Quick Reference Guide - Rockford, Il
15
2021 Rockford, IL MSA Quick Reference Guide RockfordIL.com
Transcript of Quick Reference Guide - Rockford, Il

2021
Rockford, IL MSA
Quick Reference Guide
RockfordIL.com
01
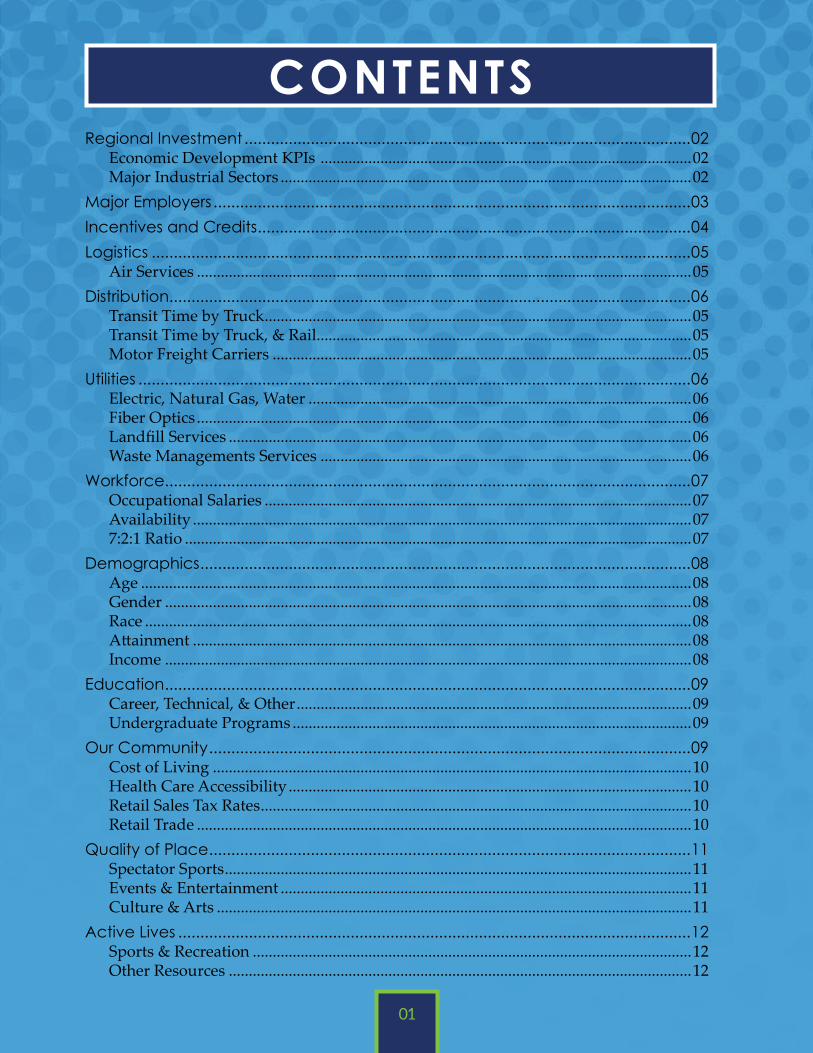
CONTENTSRegional Investment .....................................................................................................02
Economic Development KPIs .............................................................................................02Major Industrial Sectors .......................................................................................................02
Major Employers ............................................................................................................03Incentives and Credits ..................................................................................................04Logistics ..........................................................................................................................05
Air Services ............................................................................................................................05Distribution......................................................................................................................06
Transit Time by Truck ...........................................................................................................05Transit Time by Truck, & Rail..............................................................................................05Motor Freight Carriers .........................................................................................................05
Utilities .............................................................................................................................06Electric, Natural Gas, Water ................................................................................................06Fiber Optics ............................................................................................................................06Landfill Services ....................................................................................................................06Waste Managements Services .............................................................................................06
Workforce.......................................................................................................................07Occupational Salaries ...........................................................................................................07Availability .............................................................................................................................077:2:1 Ratio ...............................................................................................................................07
Demographics ...............................................................................................................08Age ..........................................................................................................................................08Gender ....................................................................................................................................08Race .........................................................................................................................................08Attainment .............................................................................................................................08Income ....................................................................................................................................08
Education .......................................................................................................................09Career, Technical, & Other ...................................................................................................09Undergraduate Programs ....................................................................................................09
Our Community .............................................................................................................09Cost of Living ........................................................................................................................10Health Care Accessibility .....................................................................................................10Retail Sales Tax Rates ............................................................................................................10Retail Trade ............................................................................................................................10
Quality of Place .............................................................................................................11Spectator Sports .....................................................................................................................11Events & Entertainment .......................................................................................................11Culture & Arts .......................................................................................................................11
Active Lives ....................................................................................................................12Sports & Recreation ..............................................................................................................12Other Resources ....................................................................................................................12

02
REGIONAL INVESTMENTThe regional economic impact figures and industry specific capital investment includes data from January 2016 through December 2020 for Winnebago County. The employment concentration figures for specific industry clusters are MSA (Metropolitan Statistical Area) level data; which includes Winnebago and Boone Counties.
New & Renovated Space5,619,989 sq. ft.
Capital Investment$1,271,141,316
New & Retained Jobs7,416
Capital Investment
$542,904,169
Employment Concentration
18.1%
NotesThis includes but is not
limited to aerospace, medical, automotive, and additive
manufacturing.
Manufacturing
Capital Investment
$43,750,000
Employment Concentration
9.1%
NotesThis includes but is not limited to warehouse,
airport improvements, and distribution.
Logistics & Distribution
Capital Investment
$647,348,089
Employment Concentration
5.6%
NotesThis combines data from our region’s four health systems,
VA services, and other medical establishments.
Healthcare
Capital Investment
$37,600,000
Employment Concentration
45%
NotesThis includes universities,
private schools, RPS205, HSD 122, and HCSD 206.
Education
Source: Bureau of Labor & Statistics May 2019; RAEDC Project Database

03
MAJOR EMPLOYERSCollins Aerospace
2,200Woodward
1,675
Aerospace
UPS2,203
Wal-Mart Stores1,470
Lowe’s1,110
Logistics, Retail, & Distribution
Rockford Public Schools District
4,075
Harlem Consolidated Schools1,1330
Belvidere Community Unit Schools
1,045
Healthcare
Fiat Chrysler Automobiles (FCA)
3,580
Magna816
Syncreon600
Education
Mondelez850
General Mills675
Taylor Company*671
*Manufactures food production equipment
Automotive
Winnebago County1,461
Food Processing
Government
Mercyhealth4,520
SwedishAmerican3,375
OSF Healthcare2,200
City Of Rockford
1,216
Source: Company, news, & statistical websites Notes: Not all figures have been updated due to a lack of information from lay-offs and furloughs from COVID-19
04
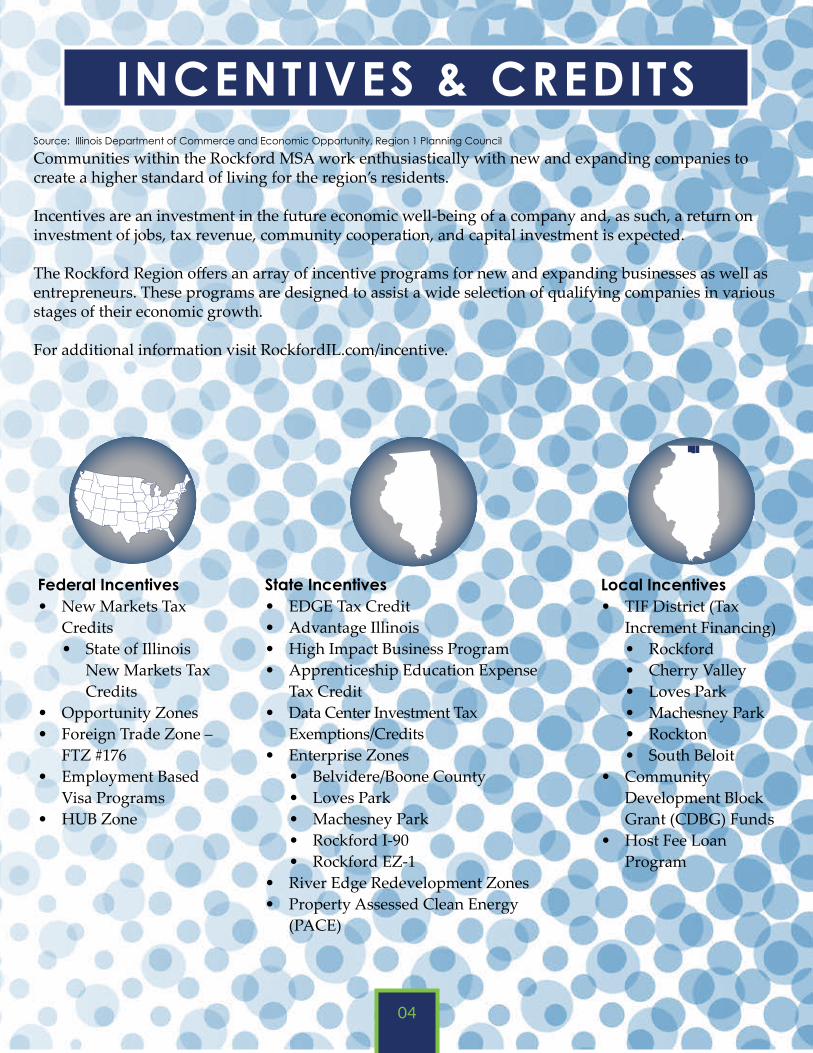
INCENTIVES & CREDITSSource: Illinois Department of Commerce and Economic Opportunity, Region 1 Planning Council
Communities within the Rockford MSA work enthusiastically with new and expanding companies to create a higher standard of living for the region’s residents.
Incentives are an investment in the future economic well-being of a company and, as such, a return on investment of jobs, tax revenue, community cooperation, and capital investment is expected.
The Rockford Region offers an array of incentive programs for new and expanding businesses as well as entrepreneurs. These programs are designed to assist a wide selection of qualifying companies in various stages of their economic growth.
For additional information visit RockfordIL.com/incentive.
Local Incentives• TIF District (Tax
Increment Financing)• Rockford• Cherry Valley • Loves Park• Machesney Park• Rockton• South Beloit
• Community Development Block Grant (CDBG) Funds
• Host Fee Loan Program
Federal Incentives• New Markets Tax
Credits• State of Illinois
New Markets Tax Credits
• Opportunity Zones• Foreign Trade Zone –
FTZ #176• Employment Based
Visa Programs• HUB Zone
State Incentives• EDGE Tax Credit• Advantage Illinois• High Impact Business Program• Apprenticeship Education Expense
Tax Credit• Data Center Investment Tax
Exemptions/Credits• Enterprise Zones
• Belvidere/Boone County• Loves Park• Machesney Park• Rockford I-90• Rockford EZ-1
• River Edge Redevelopment Zones• Property Assessed Clean Energy
(PACE)

Lake Michigan
Chicago
MilwaukeeMadison
Beloit
BelvidereRockford
South Beloit
Schaumburg
NapervilleAurora
Joliet
Evanston
Janesville
Quad Cities
Dubuque
WISCONSIN
ILLINOIS
IOWA
IND
IAN
A
Chicago Rockford International Airport (RFD)
O’Hare International Airport (ORD)
Rochelle
05
LOGISTICSAir ServiceSource: Airports Council International; Airport Authority Websites
Chicago Rockford International Airport (RFD) • Top 20 air cargo airport in the Nation• 2018’s Fastest growing cargo airport in the
world• Amazon’s Ecommerce freight hub• UPS’s second-largest North American air hub• Driving distance from I-39/90 Interchange: 11
miles• AAR maintenance, repair, and overhaul
facility• 10,000 and 8,200 feet of hard surface runway • Can land any aircraft operating today• Category III instrument landing system• Centerline and touchdown zone lighting• Foreign Trade Zone benefits (FTZ #176)• 24/7 customs, federal inspections• CES (Centralized Examination Station)• Multiple FBOs - full spectrum of aviation
services• 3,000+ acres of airport land for development• 200+ airside acres• 2,000+ acres for industrial, commercial projects• Home to Global Trade Park, shovel ready sites
Chicago O’Hare International Airport (ORD)• Driving distance from I-39/90 interchange: 61
miles• 3rd busiest passenger airport & top 20 in cargo
in the world (2018)• 49 passenger, 30 cargo airlines• Nonstop service to 49 international
destinations
Chicago Midway International Airport (MDW)• Driving distance from I-39/90 interchange: 86
miles• Nonstop service to 73 cities• 26th busiest passenger airport in U.S. (2018)
Rail Service Rail carriers serving area:
BNSF, CN, CP Shortline rail serving area:
Illinois RailwayServices Include:• Continuous switching service• Intermodal service available• Transload service available
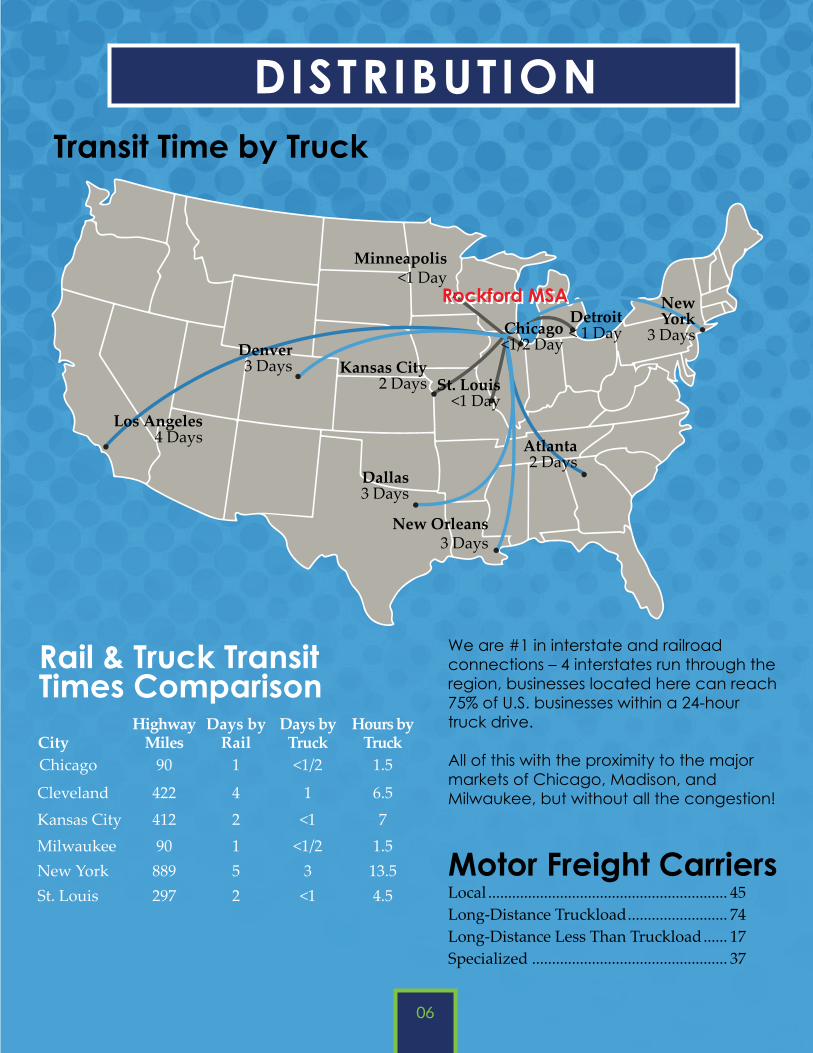
We are #1 in interstate and railroad connections – 4 interstates run through the region, businesses located here can reach 75% of U.S. businesses within a 24-hour truck drive.
All of this with the proximity to the major markets of Chicago, Madison, and Milwaukee, but without all the congestion!
Rockford MSA
Atlanta2 Days
New Orleans3 Days
Dallas3 Days
New York
3 DaysDenver3 Days
Los Angeles4 Days
Kansas City2 Days
Minneapolis<1 Day
Detroit< 1 DayChicago
<1/2 Day
St. Louis<1 Day
06
DISTRIBUTIONTransit Time by Truck
Motor Freight CarriersLocal ............................................................ 45Long-Distance Truckload ......................... 74Long-Distance Less Than Truckload ...... 17Specialized ................................................. 37
Rail & Truck Transit Times Comparison
City Highway
MilesDays by
RailDays by
TruckHours by
TruckChicago 90 1 <1/2 1.5
Cleveland 422 4 1 6.5Kansas City 412 2 <1 7Milwaukee 90 1 <1/2 1.5New York 889 5 3 13.5St. Louis 297 2 <1 4.5
07
UTILIT IES
Utilities Source: Region 1 Planning Council
The Rockford MSA has competitive utility costs and a modern infrastructure, offering a lower cost of doing business with high-quality resources.
Illinois is ranked 3rd in the country for grid modernization, 10 spots ahead of our closest Midwest neighbor.
ElectricComEd (Investor-owned): Serves most of the MSA. Top 10% in reliability nationally. Business incentives are available.
Rock Energy (Co-Op): Serves a small northern portion of the MSA. It is a non-profit serving 27,000 customers in two states.
Natural GasNicor Gas (Investor-owned): Serves most of the MSA. It is the largest natural gas distributor in Northern Illinois. Energy rebates are available.
Rock Energy (Co-Op): Serves small northern portion of MSA. It is a non-profit serving 27,000 customers in two states.
Water & SewerThe region is considered attractive for its water capacity, quality, and service.
Industrial ServicesSource: U.S. Census Bureau MSA Business Patterns (2016)
The Rockford MSA has robust industrial and advanced manufacturing supply chains and is a top logistics distribution center.
Machine Shops.................................................154Tool and Die Shops .......................................... 25
Landfills Source: U.S. Census Bureau MSA Business Patterns (2016)
Winnebago Reclamation Services, Veolia ES Orchard Hills Landfill, Rochelle Sanitary Landfill, or Area Disposal Service Inc.Waste Management/ Remediation Services .......................................21
Fiber Optic Source: Region 1 Planning Council, Industry Reports
Business and residential customers within the Rockford MSA have access to robust fiber optic and broadband services.
Dark fiber exists throughout the region, particularly along interstates 90 and 39.
A redundant fiber loop connects the Rockford MSA to Chicago and other networks.
Comcast Business: More than 250 miles of fiber optics in the area, delivering Internet speeds up to 10 Gbps with options for even greater speeds.
iFiber: Provides up to 1 Gbps network transport services for the public and private sector on a 900-mile fiber network across nine Northern Illinois counties.
08
WORKFORCE
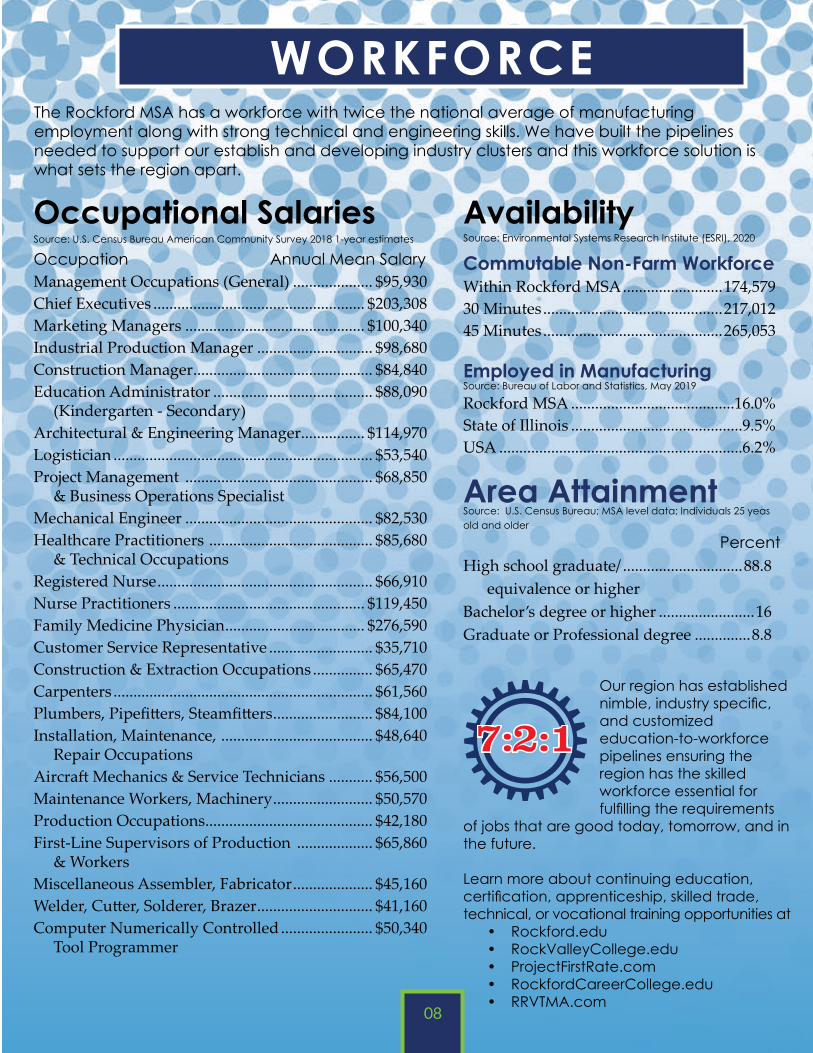
AvailabilitySource: Environmental Systems Research Institute (ESRI), 2020
Commutable Non-Farm WorkforceWithin Rockford MSA .........................174,57930 Minutes .............................................217,01245 Minutes .............................................265,053
Employed in ManufacturingSource: Bureau of Labor and Statistics, May 2019
Rockford MSA .........................................16.0%State of Illinois ...........................................9.5%USA .............................................................6.2%
Occupational Salaries Source: U.S. Census Bureau American Community Survey 2018 1-year estimates
Occupation Annual Mean SalaryManagement Occupations (General) .................... $95,930Chief Executives ..................................................... $203,308Marketing Managers ............................................. $100,340Industrial Production Manager ............................. $98,680Construction Manager ............................................. $84,840Education Administrator ........................................ $88,090 (Kindergarten - Secondary)Architectural & Engineering Manager ................ $114,970Logistician ................................................................. $53,540Project Management ............................................... $68,850 & Business Operations SpecialistMechanical Engineer ............................................... $82,530Healthcare Practitioners ......................................... $85,680 & Technical OccupationsRegistered Nurse ...................................................... $66,910Nurse Practitioners ................................................ $119,450Family Medicine Physician ................................... $276,590Customer Service Representative .......................... $35,710Construction & Extraction Occupations ............... $65,470Carpenters ................................................................. $61,560Plumbers, Pipefitters, Steamfitters ......................... $84,100Installation, Maintenance, ...................................... $48,640 Repair OccupationsAircraft Mechanics & Service Technicians ........... $56,500Maintenance Workers, Machinery ......................... $50,570Production Occupations .......................................... $42,180First-Line Supervisors of Production ................... $65,860 & WorkersMiscellaneous Assembler, Fabricator .................... $45,160Welder, Cutter, Solderer, Brazer ............................. $41,160Computer Numerically Controlled ....................... $50,340 Tool Programmer
The Rockford MSA has a workforce with twice the national average of manufacturing employment along with strong technical and engineering skills. We have built the pipelines needed to support our establish and developing industry clusters and this workforce solution is what sets the region apart.
Our region has established nimble, industry specific, and customized education-to-workforce pipelines ensuring the region has the skilled workforce essential for fulfilling the requirements
of jobs that are good today, tomorrow, and in the future.
Learn more about continuing education, certification, apprenticeship, skilled trade, technical, or vocational training opportunities at
• Rockford.edu• RockValleyCollege.edu• ProjectFirstRate.com• RockfordCareerCollege.edu• RRVTMA.com
7:2:1
Area AttainmentSource: U.S. Census Bureau; MSA level data; Individuals 25 yeas old and older
PercentHigh school graduate/ ..............................88.8
equivalence or higherBachelor’s degree or higher ........................16Graduate or Professional degree ..............8.8

09
DEMOGRAPHICS
Wider Population Source: Environmental Systems Research Institute (ESRI), 2019
Rockford MSA .................................................345,079Within 25 miles ................................................472,245Within 50 miles .............................................1,864,434Within 100 miles .........................................13,473,897
AgeSource: U.S. Census Bureau Population Estimates Program; MSA level data
Total Percent0 - 5 17,415 6.25 - 9 ..........................................10,478................6.510 - 14 ......................................18,434................6.515 - 19 ......................................17,963................6.420 - 24 ......................................17,492................6.225 - 34 ......................................34,366..............12.235 - 44 ......................................34,265..............12.145 - 54 ......................................34,795..............12.355 - 59 ......................................20,210................7.260 - 64 ......................................18,613................6.665 - 74 ......................................29,777.................1175 - 84 ......................................14,892................5.385+..............................................5,962................2.1
Median Age ................................39.8
GenderSource: U.S. Census Bureau Population Estimates Program
Total ................... PercentMale 138,060 ............................48.9Female 144,512 ............................51.1
Income Source: U.S. Census Bureau American Community Survey 2020 1-year estimates; Winnebago County level data
Median Household Income ...........................$53,866Mean Household Income ...............................$73,962Per Capita Personal Income ...........................$28,977
The Rockford Region is strong because of its diverse demographics and connected location — central in the Midwest and right next to the expanding Chicagoland market. And it is strong because of the cooperative, attractive cities and villages of all sizes across north-central Illinois.
RaceSource: ESRI 2020, MSA Level Data
Label TotalAmerican Indian............................................1,276Asian ...............................................................9,241Black and African American ......................40,813Hispanic ........................................................52,755Multiple Races .............................................12,131 Other Races ..................................................23,634Pacific Islander ..................................................126White ...........................................................257,858
Places of WorshipProtestant Churches ..............................................269Catholic Churches ...................................................17Latter-Day Saints Congregations ............................5Orthodox Churches ..................................................3Buddhist Temples......................................................4Mosques ......................................................................1Unitarian Universalist Churches ............................2Jewish Synagogues ...................................................2Baha’i Centers ............................................................1

10
EDUCATION
Winnebago County features award winning schools. Rockford Public Schools District 205 (RPS205) has attained level 4/5 in the Ford Next Generation Model Community and two schools have been awarded Model Status from the National Career Academy Coalition.
Undergraduate ProgramsSource: School, Ranking, & News websites
EnrollmentNorthern Illinois University .............................13,457Uni. of Wisconsin ...............................................11,133 Beloit College ........................................................1,402Rockford University ............................................1,211Judson University ................................................1,230Northern Illinois University ..................................972St. Anthony College of Nursing ............................202Uni. of Illinois-College of Medicine .....................387Upper Iowa University ...........................................120
Career, Technical, & OtherSource: School, Ranking, & News website
EnrollmentRock Valley College ............................................... 5,415Kishwaukee College .............................................. 2,295Blackhawk Technical College .............................. 2,470Highland Community College ............................ 1,730Rasmussen College ................................................... 571 Rockford Career College ......................................408

11
OUR COMMUNITYThe Rockford MSA is comprised of communities focused on exceptional quality of life for our residents and companies. The region is home to both large and small communities providing a wide array of lifestyle options from downtown lofts to quiet tree-lined historic neighborhoods. Live downtown, near a river, or in a rural home with plenty of space around you.
In the Rockford MSA, life is affordable and convenient, Our low cost of living makes creating a life here the easy choice. Reclaim your day by trading windshield time for activities with friends and family.
Cost of Living Index Source: C2ER (2020 Annual Average). Costs include housing, food, utilities, transportation, miscellaneous goods, and health care.
New York (Manhattan), NY .........................244.7Honolulu, HI ..................................................198.6San Diego, CA ................................................141.3Chicago, IL .....................................................120.0Denver, CO .....................................................110.8Madison, WI ...................................................106.6Minneapolis, MN ..........................................106.2Joliet-Will County, IL ....................................100.6Detroit, MI ........................................................99.5Austin, TX ........................................................99.3Phoenix, AZ......................................................98.9Cleveland, OH .................................................96.6Cedar Rapids, IA .............................................95.8Chattanooga, TN .............................................94.7Mobile, AL ........................................................94.3Peoria, IL ...........................................................92.6Columbus, OH .................................................92.2Indianapolis, IN ...............................................92.1Quad Cities, IL - IA .........................................91.7Wichita, KS .......................................................90.8Des Moines, IA.................................................89.6Rockford, IL ..............................................88.9Champaign-Urbana, IL...................................87.7St. Louis, MO ...................................................87.6
Retail TradeSource: 2017 U.S. Census Bureau; MSA level data
Number of Retail Establishments ...............1,026Total Retail Sales ............................$4,342,023,000
Retail Sales Tax
State ..................................................................6.25%County ...............................................................1.5%Municipal* .............................................. 0.0 to 2.0%*Special business districts in certain communities have higher rates.
TransportationRockford Mass Transit District (RMTD) • 21 day routes, 6 night routes, 6 Sunday only
routes, 41 vehicles• Service hours: Mon-Fri 5:15 am - 11:15 pm, Sat
6:00 am - 5:45 pm, Sun 9:15 am - 5:15 pm
Intercity Bus: Coach USA/Van Galder Bus Company• Daily service to O’Hare: 18 trips inbound, 20
outbound between 2:20 am and 12:30 am• 13 trips daily both to/from Downtown
Chicago/Union Station• 13 trips daily both to/from Midway Airport
Means of Transportation Total PercentCar/Truck/Van (alone) .............129,708 ............ 84.3Car/Truck/Van (carpool) ............13,790 .............. 9.0Public Transportation ..................1,634 .............. 1.1Walk .............................................. 1,486 .............. 1.0Taxi/Motorcycle/Bike/Other ...... 1,830 .............. 1.2
Mean travel time to work ...................22.7 minutes *Some data in this category may be impacted by COVID-19

12
QUALITY OF PLACE
Events & EntertainmentThere’s always something fun to do all season long in our region like discovering handmade artisan creations, learning about the Sock Monkey, or simply strolling our beautiful conservatory and gardens, visit downtown and sample the delicious food, or check out our unique storefronts for a bit of shopping.
Our spectacular events attract people from near and far. For a more complete list of activities visit: GoRockford.com.
• 815 Day• Farmers & Craft Markets• Friday Night Flix• Heritage Days• Hometown Christmas• Old Settlers Days• Rock River Anything That Floats Race• Rockford ProAm• Screw City Beer Festival• Stroll on State• Tough Mudder• WWII Days
HealthcareSource: Illinois Health Facilities and Services Review Board, Online Sources, Area Health Resources Files
Rockford MSA residents enjoy the highest-quality and accessibility in medical care from four health systems.
Hospital Number of BedsMercyhealth ........................................................... 268 SwedishAmerican Hospital ................................. 359SwedishAmerican Medical Center Belvidere ..... 39 OSF Saint Anthony Medical Center ................... 254
Number of Physicians (M.D.) ........................... 1,003Number of Dentists (D.D.S.) ................................ 202
The positive business climate throughout our region is matched by a great quality of life! We have world-class attractions and activities throughout the year; which are within close proximity to major metropolitan areas. The advantages include big-city lifestyle but with a small-town feel.
Spectator SportsWhile spectator sports usually means watching, in our area that translates to being fully involved cheering for your favorite teams and players and having the chance to say you saw them play before they became famous.
• Rockford IceHogs, AHL hockey team (affiliates of the Chicago Blackhawks)
• Rockford Rivets, collegiate baseball• Rockford Speedway, the highest ranked
quarter mile oval short track raceway tabbed as “Mid-America’s Finest Racetrack”
15 Museums
14 Public Libraries
12 Art Galleries
07 Theaters
01 Symphony Orchestra
Culture and Arts
13
ACTIVE LIVES
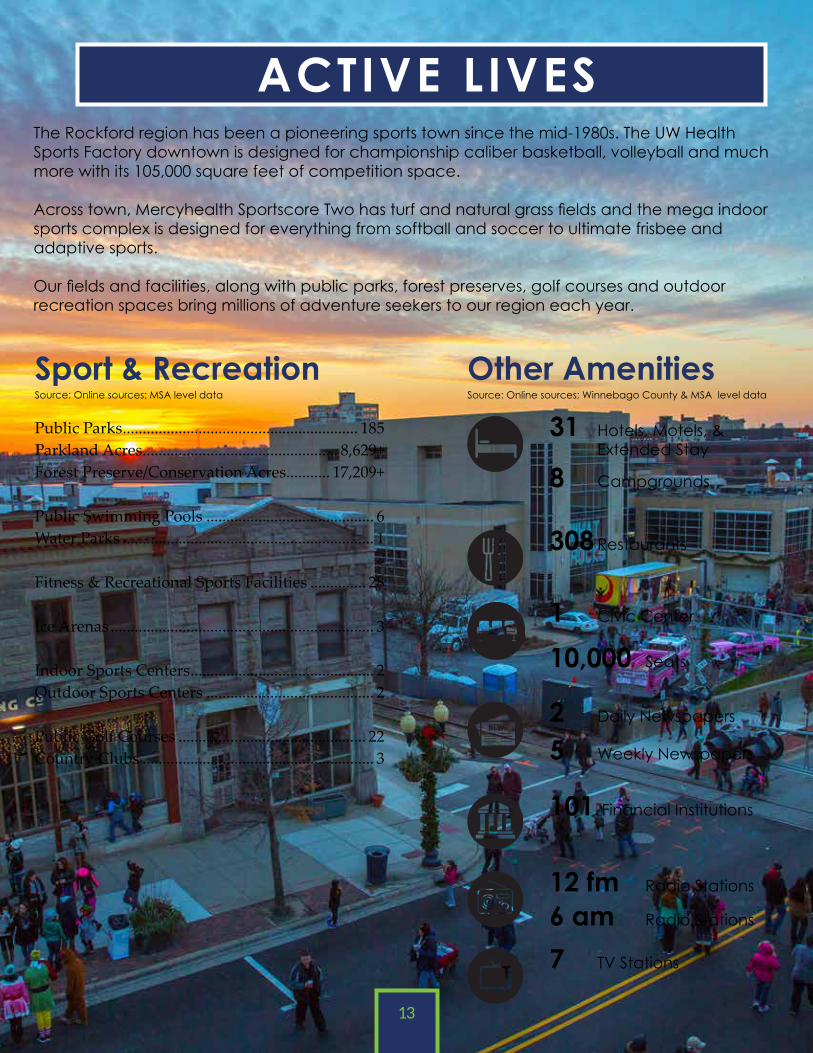
Sport & RecreationSource: Online sources; MSA level data
Public Parks ........................................................... 185Parkland Acres ................................................. 8,629+Forest Preserve/Conservation Acres........... 17,209+
Public Swimming Pools .......................................... 6Water Parks ............................................................... 1
Fitness & Recreational Sports Facilities .............. 28
Ice Arenas .................................................................. 3
Indoor Sports Centers .............................................. 2Outdoor Sports Centers .......................................... 2
Public Golf Courses ............................................... 22Country Clubs .......................................................... 3
Other AmenitiesSource: Online sources; Winnebago County & MSA level data
31 Hotels, Motels, & Extended Stay
308 Restaurants
10,000 Seats
101 Financial Institutions
12 fm Radio Stations
7 TV Stations
2 Daily Newspapers
8 Campgrounds
1 Civic Center
5 Weekly Newspapers
6 am Radio Stations
The Rockford region has been a pioneering sports town since the mid-1980s. The UW Health Sports Factory downtown is designed for championship caliber basketball, volleyball and much more with its 105,000 square feet of competition space.
Across town, Mercyhealth Sportscore Two has turf and natural grass fields and the mega indoor sports complex is designed for everything from softball and soccer to ultimate frisbee and adaptive sports.
Our fields and facilities, along with public parks, forest preserves, golf courses and outdoor recreation spaces bring millions of adventure seekers to our region each year.
RockfordIL.com
Legal DisclaimerInformation contained herein has been compiled to the best of our knowledge. Any inaccuracies can be reported to [email protected].
100 Park Ave, Suite 100, Rockford, Illinois 61101T: 815.987-8118 | [email protected]
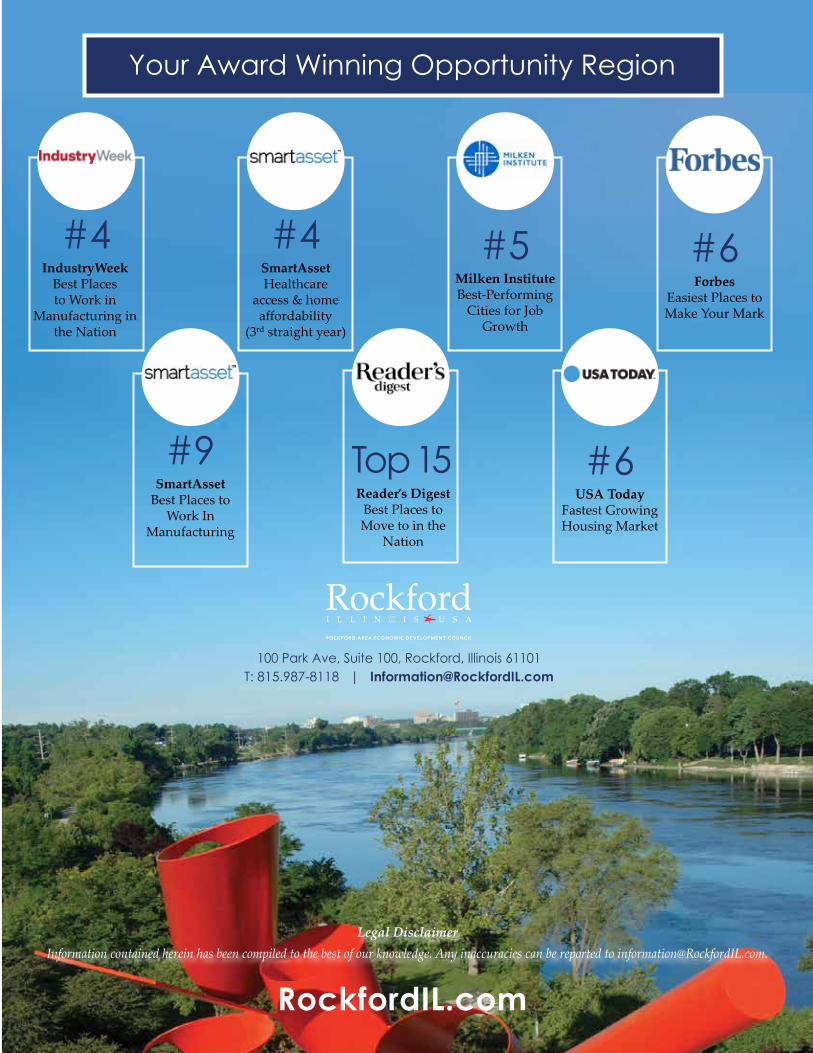
#6USA Today
Fastest Growing Housing Market
#6Forbes
Easiest Places to Make Your Mark
#4IndustryWeek
Best Places to Work in
Manufacturing in the Nation
#4SmartAssetHealthcare
access & home affordability
(3rd straight year)
Your Award Winning Opportunity Region
#5Milken InstituteBest-Performing
Cities for Job Growth
#9SmartAsset
Best Places to Work In
Manufacturing
Top 15Reader’s Digest
Best Places to Move to in the
Nation
![CCNP BCMSN Quick Reference Sheets - Lagout Quick Reference... · CCNP BCMSN Quick Reference Sheets Exam 642-812 ... [ 4 ] CCNP BCMSN Quick Reference Sheets. ... switch would be used](https://static.fdocuments.net/doc/165x107/5a7a6ec87f8b9a05538dccf5/ccnp-bcmsn-quick-reference-sheets-lagout-quick-referenceccnp-bcmsn-quick-reference.jpg)