Quick Heal Technologies Limiteddlupdate.quickheal.com/documents/investors/Quick_Heal_Investor... ·...
40
Transcript of Quick Heal Technologies Limiteddlupdate.quickheal.com/documents/investors/Quick_Heal_Investor... ·...


2
Quick Heal Technologies Limited
Q4 & FY16 Results Update
May 2016

5
DISCLAIMER
This presentation and the following discussion may contain “forward looking statements” by Quick Heal Technologies Limited (“Quick Heal” or the “Company”)
that are not historical in nature. These forward looking statements, which may include statements relating to future results of operations, financial condition,
business prospects, plans and objectives are based on the current beliefs, assumptions, expectations, estimates and projections of the management of Quick
Heal about the business, industry and markets in which Quick Heal operates.
These statements are not guarantees of future performance and are subject to known and unknown risks, uncertainties and other factors, some of which are
beyond Quick Heal’s control and difficult to predict, that could cause actual results, performance or achievements to differ materially from those in the forward
looking statements.
Such statements are not and should not be construed as a representation of future performance or achievements of Quick Heal. In particular, such
statements should not be regarded as a projection of future performance of Quick Heal. It should be noted that the actual performance or achievements of
Quick Heal may vary significantly from such statements.
6
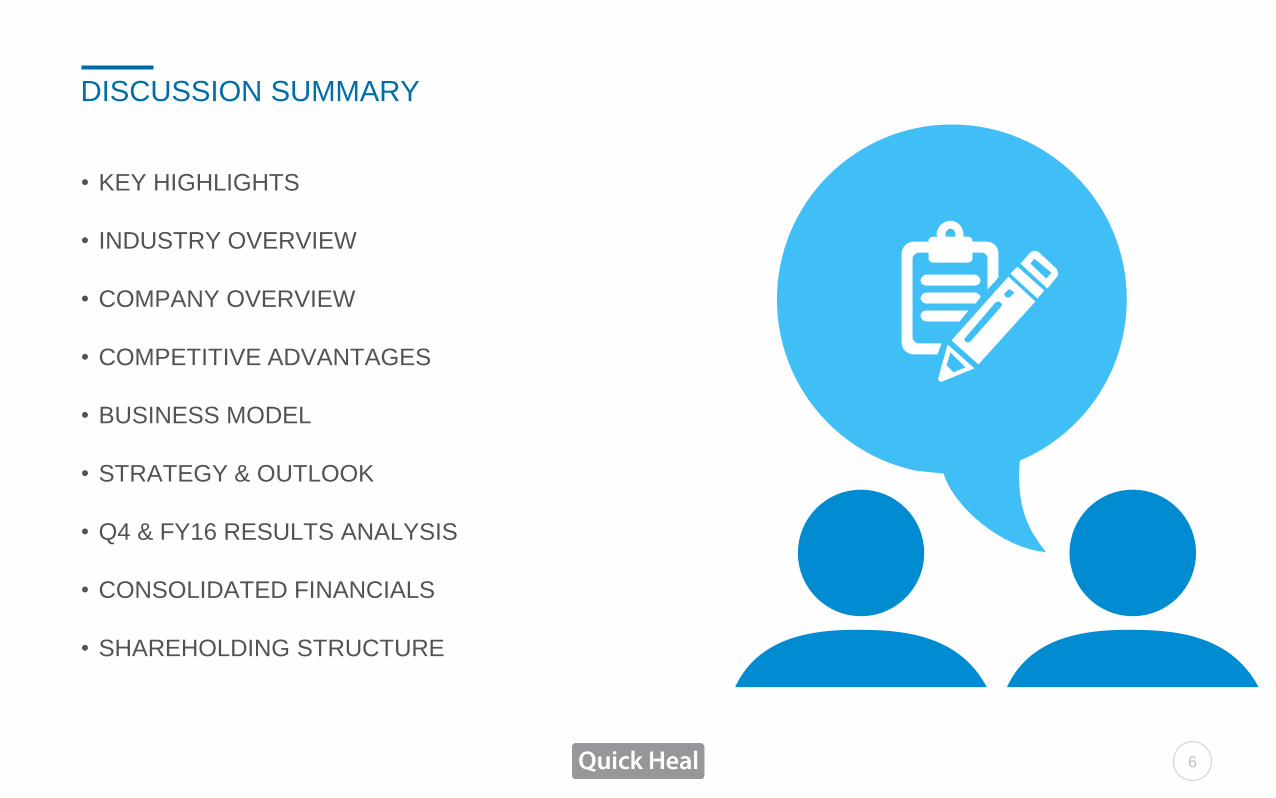
DISCUSSION SUMMARY
• KEY HIGHLIGHTS
• INDUSTRY OVERVIEW
• COMPANY OVERVIEW
• COMPETITIVE ADVANTAGES
• BUSINESS MODEL
• STRATEGY & OUTLOOK
• Q4 & FY16 RESULTS ANALYSIS
• CONSOLIDATED FINANCIALS
• SHAREHOLDING STRUCTURE

KEY HIGHLIGHTS
7
FY16:
• Revenues grew by 18% on YoY basis to Rs 3,380.7 mn
• EBITDA grew by 12% on YoY basis to Rs 1,024.6 mn
• PAT grew by 9% on YoY basis to Rs 584.0 mn
Q4 FY16:
• Revenues grew by 26% on YoY basis to Rs 1,314.4 mn
• EBITDA grew by 43% on YoY basis to Rs 581.8 mn
• PAT grew by 64% on YoY basis to Rs 378.2 mn
• The Board of Directors approved a dividend of Rs 175.1 mn for FY16 (excluding dividend tax of Rs 35 mn), translating into dividend of Rs 2.5 per equity share with face value of Rs 10, with a dividend payout ratio of 36.1% of PAT
• Received ISO 27001 and ISO 20000 certification for ‘Information Security Management System’ and ‘IT Service Management’ respectively
• Signed MoU with the Indian Computer Emergency Response Team (‘CERT-IN’) for helping them deal with the increasing complex problems associated with computer / cyber security in India

8
INDUSTRY OVERVIEWRISING INCIDENCES OF CYBER ATTACKS
RISING CYBER ATTACKS IN INDIA
22,060
71,780
130,338
49,504
2012 2013 2014 Jan-May2015
11
25
57
2013 2014 2015E
Rising threats in form of malwares, virus, phishing, trojans
Source: Company RHP
In Thousand In Thousand
SOCIAL MEDIA SCAMS ON RISE
• 16% of social media scams are targeted at Indian users
• 156% rise has been seen in social media scams
THE CYBER THREAT SCENARIO IN INDIA 2015-16
• India is the 3rd top destination of cyberattacks
• 50% of cybercrimes in India are not reported (KPMG)
RANSOMWARE THREATS WILL REACH AN ALL-TIME HIGH IN 2016
• India faces the 2nd most ransomware attacks in Asia
• 430 million new unique pieces of malware in 2015
• India records 15 ransomware attacks per hour
• Rise of 114% in ransomware attacks. Out of these, 10% were crypto-ransomware attacks
• Ransomware moved beyond PCs to smartphones, Macs and Linux machines
INDIAN SMEs UNDER INCREASED THREAT
• Large number of financial Trojans against Indian SMEs
• Targeted organizations face at least 2 attacks on average
• 40% of BFSI industries were also hit at least once
• Over half a billion personal records were stolen or lost in 2015, from SMEs
Number of Cyber Attacks Average Cost Suffered per Attack

9
QUICK HEAL R&D DETECTION STATISTICS
Source: Quick Heal Threat Report 2016
21 new families of mobile banking trojans
50% increase in detection rate from 2014 (Windows malware are propagated through email attachments, infected websites, removable drives and bundled software)
0.00
0.26
1.05
3.85
5.44
2011 2012 2013 2014 2015
21x
In Million
1.15
1.46
2014 2015
21%
In Billion
803 Android malware families
50% increase in detection rate from 2014
INDUSTRY OVERVIEWRISING INCIDENCES OF CYBER ATTACKS
757 new variants of existing Android malware families
23% increase in detection rate from 2014(Android malware are propagated through ad plug-ins, third party stores, in-app purchases, trojanized apps, fake apps and protector plug-ins)
Windows Malware Android Malware

10
INDIA HAS 2ND LARGEST INTERNET USER BASE IN THE WORLD
Source: Company RHP
INDUSTRY OVERVIEWFAST EXPANDING INTERNET USER BASE
RISING SMARTPHONE SUBSCRIPTIONS
GROWING MOBILE INTERNET USERBASE CONTINUED INCREASE IN PC INSTALLED BASE
190
257
354
500
2013 2014 2015 2017E
90
140
218
339
2013 2014 2015 2017E
130159 175
236
314
2013 2014 2015 2016 2017E
47.5
57.5
70
2013 2015 2017E
In Million In Million
In Million In Million
SIGNIFICANT EXPANSION IN NUMBER OF NETWORKED DEVICES
74%of all devices expected to become mobile connected by 2019
40%of all devices expected to be smartphones by 2019
CAGR:
27%
CAGR:
39%
CAGR:
25%
CAGR:
10%

11
MULTIPLE LEVERS IN PLACE TO DRIVE RAPID GROWTH IN INDIAN IT SECURITY MARKET
INDUSTRY OVERVIEWIT SECURITY MARKET IN INDIA – STRONG GROWTH AHEAD
28 - 30
37 - 39
45 - 50
11 - 13
14 - 16
16 - 19
10 - 12
12 - 14
15 - 18
2013 2015 2017 E
Services Software Hardware
In Rs Billion
51 - 53
65 - 67
80 - 85
17%
25%
25%
27%
20%
23%
57%
% Share
0.8 – 1.1
3 – 3.5
4 - 5
6 - 8
15 - 18
MDM UTM EPS Retail Total
25 – 30%
15 – 20%
10 – 15%
20 – 25%
15 – 20%
• Rapid growth in internet user base and
number of networked devices
including desktops, laptops,
smartphones, tablets
• Increasing number of security
intrusions in Corporate India
• Increase in allocation of corporate
budgets towards IT Security
• High priority to IT Security especially
from businesses having higher
dependency on internet (e-commerce)
and with sensitive information (BFSI,
telecom, or the Government)
Key Drivers
Indian IT Security Market IT Security Product Segments
In Rs Billion
15 – 20%
Source: Zinnov Analysis
MDM: Mobile Device Management, UTM: Unified Threat Management,
EPS: Endpoint Security

12
COMPANY OVERVIEWQUICK HEAL – BRIEF PROFILE
BUSINESS OVERVIEW
• Incorporated in 1995, Quick Heal is the pioneer in Indian IT Security Software and is currently one of the leading providers of Security Software Products and Solutions in India
• More than 30% market share in Retail segment
• Strong recognition / customer recall – “Quick Heal” for retail products and “Seqrite” for enterprise products
• Active licenses of 7.3 mn as on Mar-16 across more than 80 countries, having grown by 2.0x over FY12 to FY16
• Continued backing by Venture Capital Investor -Sequoia Capital which still holds 5.23%
KEY STRENGTHS
• Established and proven technology over a span of 22 years
• Comprehensive product offering (majority indigenously developed) across all segments (Home, SMB, Enterprise), all platforms (Windows, Mac, Android, iOS, Linux) and all devices (Desktops, Laptops, Mobiles, Tablets)
• Strong and diversified Channel network – 64 Offices and Warehouses in 36 Cities in India and 4 International Offices, 19,832 Retail Channel Partners, 372 Enterprise Channel Partners, 306 Government Partners, 1,092 Mobile Channel Partners
• Superior Customer Support
STRONG FINANCIALS
• Consolidated Revenues, EBITDA and PAT were Rs 3,380.7 mn, Rs 1,024.6 mn and Rs 584.0 mnrespectively in FY16
• Robust profitability with EBITDA Margin of 30.3% and PAT Margin of 17.3% in FY16
• Strong cash generation with Operating Cash Flow / EBITDA of 74.8% in FY16
• Strong balance sheet with zero debt and healthy cash position in FY16

13
• Quick Heal starts Radio
Campaign
• Quick Heal starts its first
branch in Nashik
2002 - 2004
• Company renamed as Quick Heal Technologies
Pvt. Ltd. from CAT Computer Services Pvt. Ltd.
• Quick Heal sets up Technical Support Centre at
Nashik
2006 - 2007
• Quick Heal becomes Microsoft’s certified
partner
• Quick Heal hosts AAVAR International
Security Conference in India
2008
• Private Equity Investment firm Sequoia Capital,
invests in Quick Heal
• Quick Heal recognized by CRN India as No.1
Channel Champion
2009 - 2010
• Incorporates Quick Heal in Kenya
• Incorporates Quick Heal in Japan
• Quick Heal acquires SurfCanister Sandbox
technology from Apurva Technologies, India
2011
• Launches Quick Heal
Mobile Security
• Launches Quick Heal
End Point Security
• Quick Heal acquires
behavior based
technologies from Nova
Shield Inc. UK
• Incorporates Quick Heal in
Dubai
• ISO 9000
2012 - 2013
• Launches Quick Heal MDM (Mobile
Device Management)
• Launches Quick Heal Terminator (UTM-
Unified Threat Management)
• Launches free mobile security for Android
• Quick Heal invests in Wegilant Net
Solutions Pvt. Ltd, India
2014• Launches Seqrite a brand encompassing security
products for Business Enterprise customers
• Quick Heal invests in ‘Smartalyse Technologies Pvt.
Ltd., India’
• Quick Heal inaugurates its first office in the US,
‘Quick Heal Technologies America’ in Boston
• Launches Quick Heal Gadget Securance for Mobile
security + insurance
• Launches Fonetastic for Mobile security
2015
• Incorporation as ‘CAT Computer
Services Pvt. Ltd.’
• Launch of ‘Quick Heal’ DOS version
• Launch of ‘Quick Heal’ Windows version
1995 - 1998
• Listing on BSE
and NSE
exchanges
• ISO 27001
• ISO 20000
2016
COMPANY OVERVIEWQUICK HEAL JOURNEY

14
Our solutions have earned a variety of awards and certifications from industry groups and
publications including AV-Test and OPSWAT
Awards in IndiaInternational Certificates
* There marks are owned and copyrighted by their respective holders
• 2016: 12th Annual Info Security PG's 2016 Global Excellence Awards, USA* Gold Winner for Product Development/Management Executive of the year* Silver Winner in the category of Security Products and Solutions for Small Businesses and SOHO
• 2016: ICSA Labs Excellence in “Information Security Testing” Award for the 5th consecutive year
• 2015: IMC Information Technology Award for Excellence in Information Technology Products for small and medium enterprise category, awarded by Indian Merchants Chamber
• 2015: Mumbai Hot 50 Brands in the B2C category, awarded by OneIndia
• 2014 – 2015: DQ Channels India’s Most Popular Vendor
• 2014 and 2015: CRN Channel Champions, Client Security awarded by United Business Media
• 2012, 2013 and 2014: Quality Brands, awarded by Quality Brand Times
• 2012: Maharashtra Corporate Excellence Awards, by Maxell Foundation
• 2008, 2009 and 2010: CRN Channel Champions, Antivirus Segments awarded by United Business Media
• 2010: Tech Life – The Lifestyle and Gadgets Awards, awarded by NDTV
• 2010: SME Awards for Best SME Innovation awarded by Business Today
• 2010: Deloitte Technology Fast500 Asia Pacific awarded by Deloitte
• 2010: Deloitte Technology Fast50 India awarded by Deloitte
• 2009: Channels Choice Award, awarded by DQ Channels
• 2009: Maharashtra IT Awards, awarded by Government of Maharashtra
• 2009: Emerging India Awards, awarded by ICICI Bank and CNBC TV 18
COMPANY OVERVIEWTECHNOLOGY & MARKET LEADERSHIP

15
KAILASH KATKAR
Promoter of the Company since
incorporation
CEO & MD
SANJAY KATKAR
Promoter of the Company since
incorporation
CTO & MD
ABHIJIT JORVEKAR
Responsible for Sales &
Marketing
Executive Director & VP
SHAILESH LAKHANI
Serves as the MD at Sequoia
Capital India
Non-Executive Director
APURVA JOSHI
Is a certified bank forensic
accounting professional and
anti-money laundering expert
Independent Director
SUNIL SETHY
Comes from an experienced
background in accountancy,
finance, treasury, and legal
departments
Independent Director
PRADEEP BHIDE
Ex-IAS Officer and has served a series of increasingly
senior positions at the State Government and Central
Government
Independent Director
MEHUL SAVLA
Serves as the Director of
RippleWave Equity Private
Limited
Independent Director
COMPANY OVERVIEWBOARD OF DIRECTORS

16
COMPANY OVERVIEWSTRONG BRAND RECOGNITION AND RECALL
24.5 m+Product Licenses Installed
7.3 m+Active Licenses across more
than 80 countries
2.0x GrowthActive Licenses over last
5 years
30% +Retail Market Share in India
Preferred Choice of
IT technicians for PC
Virus Cleaning
19,832 Retail, 372 Enterprise, 306 Government and 1,092 Mobile Partners

17
INDIA (HO)Quick Heal Technologies
Ltd.
JAPANQuick Heal Japan KK.
UAEQuick Heal Technologies
(MENA) FZE
KENYAQuick Heal Technologies
Africa Ltd.
USAQuick Heal Technologies
America Inc
COMPANY OVERVIEWEXPANDING PRESENCE ACROSS INTERNATIONAL MARKETS

3,635
4,386
5,450
6,317
7,323
MAR-12 MAR-13 MAR-14 MAR-15 MAR-16
18
ACTIVE LICENSES (MILLION)
2.0X
COMPANY OVERVIEWLARGE AND GROWING USER BASE

19
COMPETITIVE ADVANTAGEESTABLISHED AND PROVEN TECHNOLOGY
PIONEER IN IT SECURITY SOFTWARE IN INDIA
• Technological evolution over past 22 years
• Majority of products have been developed indigenously
• Highly effective against latest emerging threats and zero-day attacks
• Successful in detecting “CryptoLocker” family of viruses which use advanced obfuscation techniques to evade detection
TECHNOLOGY CERTIFICATIONS
• IAV Test, AV Comparatives
• VB 100,
• ICSA Lab
• OPSWAT
QUICK HEAL’S PRODUCT COMPETENCE
• Consumer Security - 1,343 million attacks blocked in FY16
• Enterprise Security - 118 million attacks blocked in FY16
• Mobile Security - 26 million malicious apps detected in FY16
Trademarks in India8 Pending patent
applications in India3
Trademarks in RoW7 Copyrights in India2Patents in United
States4 Pending copyright
applications in India4
20
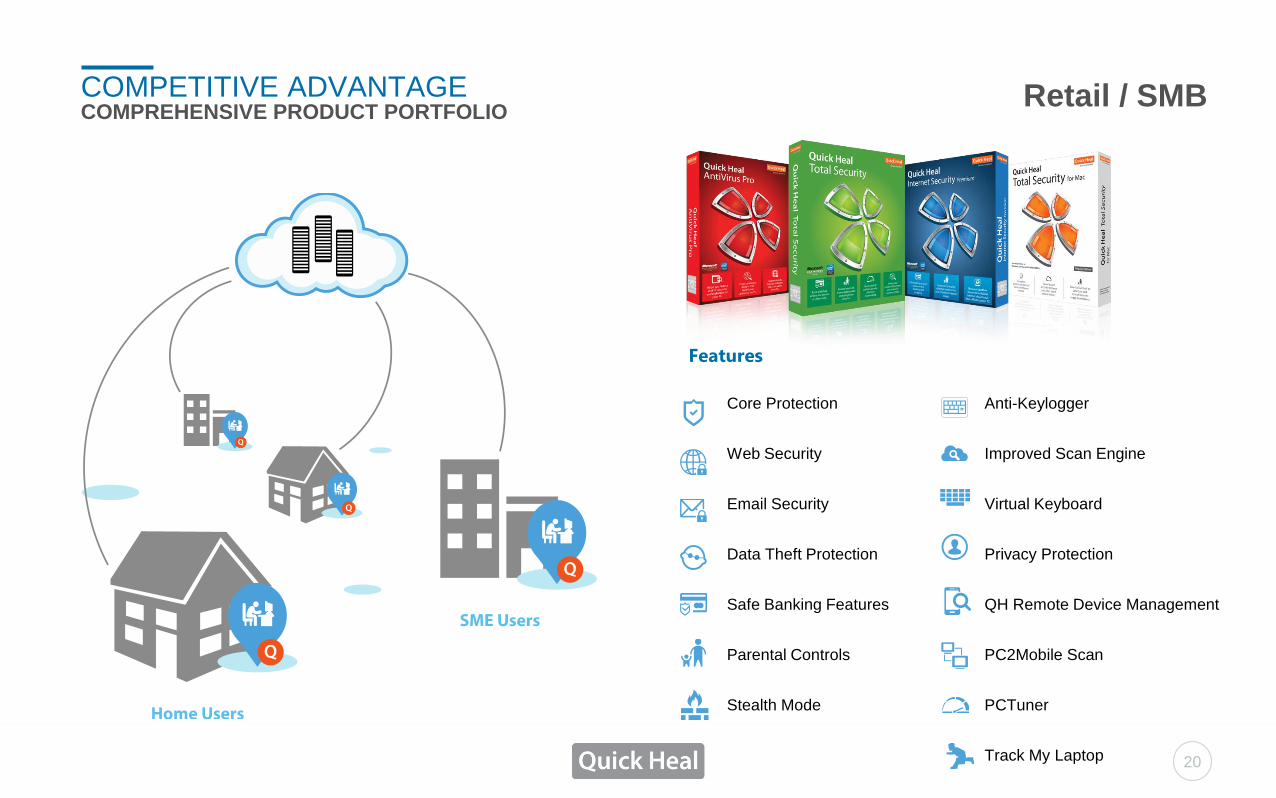
COMPETITIVE ADVANTAGECOMPREHENSIVE PRODUCT PORTFOLIO
Retail / SMB
Features
Core Protection
Web Security
Email Security
Data Theft Protection
Safe Banking Features
Parental Controls
Stealth Mode
Anti-Keylogger
Improved Scan Engine
Virtual Keyboard
Privacy Protection
QH Remote Device Management
PC2Mobile Scan
PCTuner
Track My Laptop

21
COMPETITIVE ADVANTAGECOMPREHENSIVE PRODUCT PORTFOLIO
Mobile Security / Fontastic
/Gadget Securance
Features
Background Scan
Security Advisor
Privacy Advisor
Call & Message Filter
Register with TRAI
Anti-Theft Technology
Virus Protection
Mobile Tracker
Cloud Backup
Insurance cover - Theft
Physical and Liquid Damage
Fire Damage
Remote Device Management
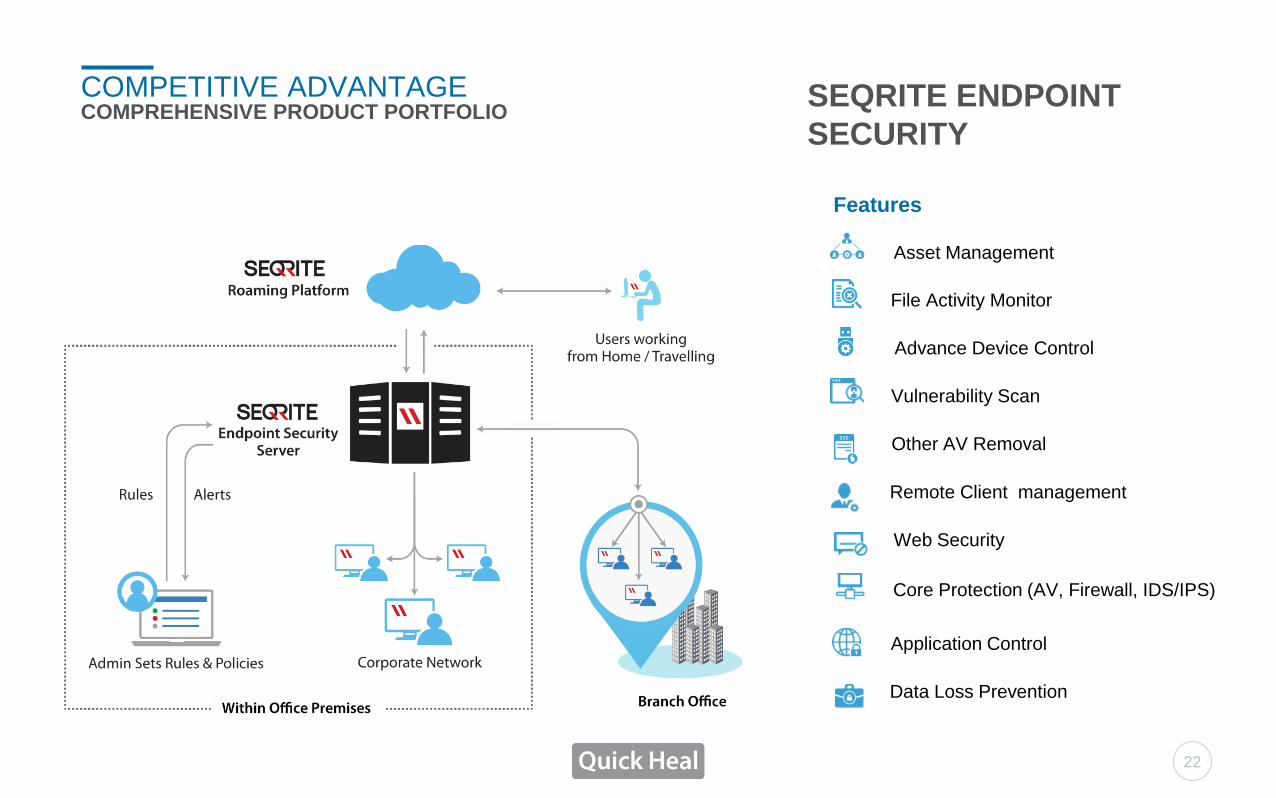
COMPETITIVE ADVANTAGECOMPREHENSIVE PRODUCT PORTFOLIO
Advance Device Control
Features
Other AV Removal
Vulnerability Scan
Web Security
Application Control
Core Protection (AV, Firewall, IDS/IPS)
SEQRITE ENDPOINT
SECURITY
Data Loss Prevention
Remote Client management
Asset Management
File Activity Monitor
22
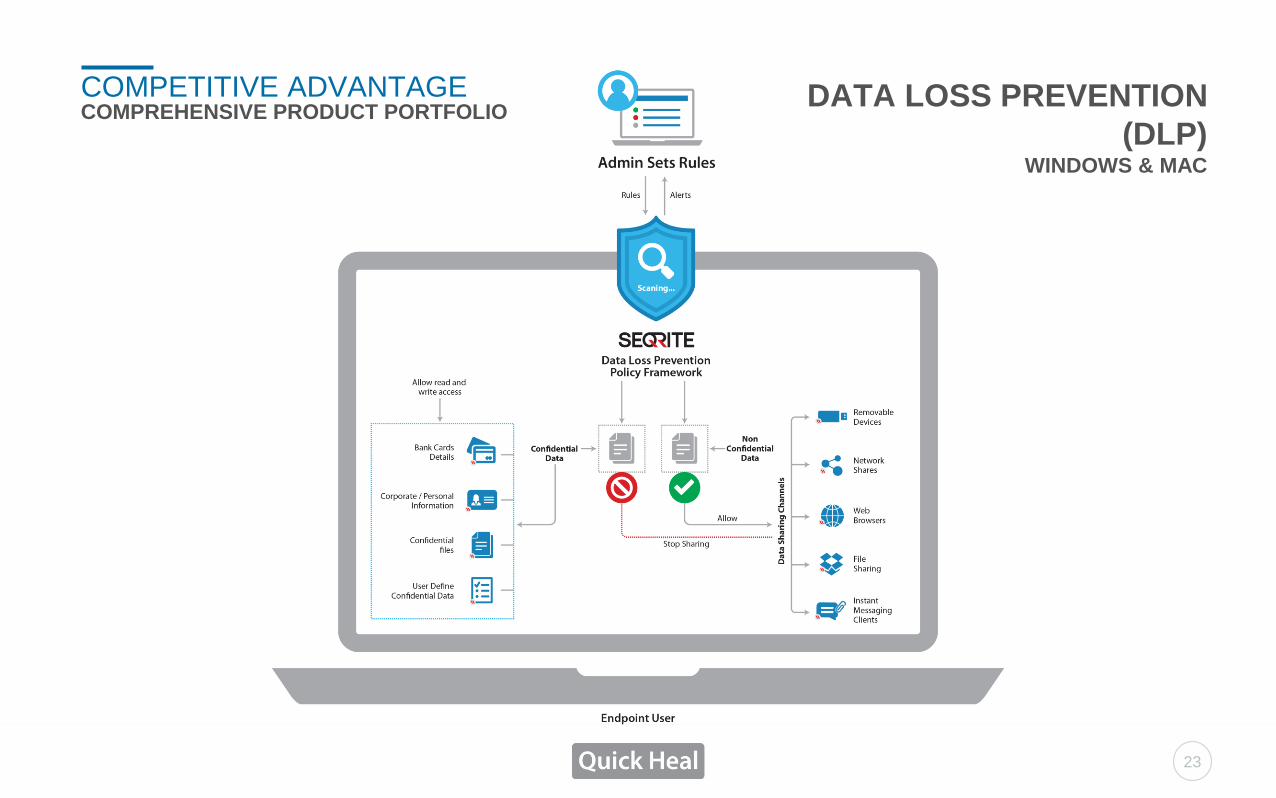
COMPETITIVE ADVANTAGECOMPREHENSIVE PRODUCT PORTFOLIO
DATA LOSS PREVENTION
(DLP)WINDOWS & MAC
23

SEQRITE TERMINATOR
Firewall
Features
Antivirus
Mail Protection
Content Filtering
IPS
Application Control
ISP Load Balance
ISP Failover
Link Aggregation
Bandwidth Management
User / Group management
Monitoring and Reporting
COMPETITIVE ADVANTAGECOMPREHENSIVE PRODUCT PORTFOLIO
24

SEQRITE ENTERPRISE
CLOUD PLATFORM
Get status, security and compliance
info from EPS, Terminator products
Access Seqrite products from
anywhere and anytime
Apply uniform security policies
at all locations
Backup important Seqrite product
comfiguration to cloud
Features
COMPETITIVE ADVANTAGECOMPREHENSIVE PRODUCT PORTFOLIO
25

COMPETITIVE ADVANTAGECOMPREHENSIVE PRODUCT PORTFOLIO
Manage users, devices, groups
Features
OTA provisioning of devices
Remotely push configuration and policies
Application control
Anti-theft (ring / lock / locate / trace)
Remote wipe
SEQRITE MOBILE
DEVICE MANAGEMENT
26

Features
Manage chat groups, policies
One-to-One chat
Group Chat
Share files (image, audio, video, etc.)
Evaporated & Private messages
COMPETITIVE ADVANTAGECOMPREHENSIVE PRODUCT PORTFOLIO
SEQRITE SECURE CHAT
27

28
Significant National Outreach and Penetration
Jammu
Ludhiana
Chandigarh
GuwahatiLucknow
New Delhi
Jaipur
Kolkata
Ahmedabad
Rajkot
Bhubaneshwar
Nagpur
Chennai
Aurangabad
Bangalore
Madurai
Coimbatore
Kochi
Hubli
Kolhapur
Pune
Mumbai
Nashik
Surat
Baroda
PatnaIndore
Raipur
Vijayawada
Hyderabad
Vizag
Customer Centric Approach
Head Office & R&D CenterPune
Domestic & International Support
Centre (Telephone, SMS, Online
chat, forum, Remote and on-site
ground support)
Sales team is closely
involved in maximising
product availability
across the channel and
providing technical /
sales assistance
Signed Agreements
Annual Sales Targets
Attractive Sales
Incentives
Quick Heal – 64 offices & warehouses across 36 cities in India
End Users End Users
Certifications
programmes for
enterprise channel
partner empowerment &
education
On-going training (4
technical support centres)
to channel partners for
providing support
services to end users
End Users
COMPETITIVE ADVANTAGEEXTENSIVE PAN-INDIA DISTRIBUTION NETWORK
Retail Network
19,872
Enterprise & Government
Network
678
Mobile Channel
1,092

29
COMPETITIVE ADVANTAGESUPERIOR CUSTOMER SUPPORT
STRONG CUSTOMER SUPPORT – SINGLE LARGEST DIFFERENTIATOR
• Multi-lingual end user support in English, Hindi and several other major regional Indian languages
• Multi-modal support to users through phone, email, SMS, online chat, support forum and remote access
• Ground support and onsite support for non-home users pan India
• Availability of data sheets, product videos and manuals on website for providing information on technical specifications, installation
guide, upgrade mechanisms
• Release of various articles, technical papers, quarterly threat reports and conducting webinars in the area of security software
Strong Emphasis on
Efficient Customer Service
Remote Access Support –
Key Differentiator
Maintain High Levels of User
Satisfaction and Retention

15 - 17%
27 - 29%
17 - 19%
38 - 45%
Q1 Q2 Q3 Q4
30
QUARTERLY REVENUES - % OF ANNUAL
Note: Fiscal year ends on March 31 of each year as shown above
Source: Industry Overview and Trends – India and IT Security Market India - Inferences - Zinnov
SEASONALITY IMPACT ON REVENUES & MARGINS:
• Revenues are higher in Q2 and Q4.
• R&D, G&A expenses are spread across all
four quarters
• Hence, there is variation in EBITDA margin
on quarterly basis
BUSINESS MODELSEASONALITY IMPACT ON REVENUES & MARGINS

31
CTO
Business
Logic Team
Development
TeamQuality
Assurance Team
Incidence
Response Team
IoT(1) TeamThreat Research &
Response Team
CONTINUOUS FOCUS AND INVESTMENTS IN R&DR&D DEPARTMENT STRUCTURE
ROBUST R&D FRAMEWORK TO ACTIVELY TRACK AND QUARANTINE NEW VIRUSES
• Business Logic Team - helps in building product roadmaps and devising appropriate strategies.
• Product Development Team - responsible for the design and development of various products
and solutions.
• Incidence Response Team – responsible for any emergency situation/incident at any enterprise
security infrastructure.
• Threat Research and Response Team -takes part in detection of and removal of reported
viruses and malwares
• Internet of Things Security Team - create products and solutions for home automation security
• Quality Assurance Team - provides systematic measurement, standard evaluation and
monitoring of processes.
Earmarked Rs 418.8 mn
from IPO proceeds to be
spent on R&D investments
over next 3 years
Indian GAAP Financial
Reporting with full
expensing of R&D
expenses
BUSINESS MODELTHRUST ON RESEARCH & DEVELOPMENT
138191
318433
555
7.9% 9.6% 12.9% 16.1% 17.7%
FY12 FY13 FY14 FY15 FY16
No. of R&D Employees R&D - % of Revenues

32
STRONG DRIVERS FOR LONG-TERM GROWTH
• Special focus on Tier
II and Tier III towns
• Tailored offerings for
SMB and enterprise
users
• Develop and promote
software-as-a-service
model
• Plans to focus on
manufacturing, BFSI,
healthcare,
hospitality industries
• Reach out to SMBs -
Expand sales team
to identify new SMB
opportunities,
increase
engagement with
channel partners
• Focus on international
expansion through
consistent brand
building and marketing
effort including media
events and exhibitions
• Exploring opportunities
in South Africa, Middle
East & South East Asia
• Developing products
for mobile platforms
such as Android,
Windows, Linux, iOS
and Blackberry and for
smartphones and
tablets
• Monetize opportunities
of our free solutions for
mobile devices
• Work ongoing on
several new
technologies such as
IoT and home
security automation
• Has 4 US patents to
its credit. Awaiting 3
Indian patents
Retain and Expand User
Base
International Expansion
Expand Mobile Capabilities
Grow SMB and Enterprise Business
Strengthen R&D
Investments and Broaden
Product Portfolio

In Rs. Mn
Q4 & FY16 RESULTS HIGHLIGHTS
538.1 584.0
18.8%17.3%
FY15 FY16PAT PAT Margin %
Q4 FY16 YoY ANALYSIS
FY16 YoY ANALYSIS
REVENUES EBITDA and EBITDA MARGIN PAT and PAT MARGIN
1,041.1
1,314.4
Q4 FY15 Q4 FY16
407.6
581.8
39.2%44.3%
Q4 FY15 Q4 FY16EBIDTA EBIDTA Margin %
26 % 43 %231.1
378.2
22.2%
28.8%
Q4 FY15 Q4 FY16PAT PAT Margin %
64 %
CASH PROFIT
314.9
441.5
Q4 FY15 Q4 FY16Cash Profit
40 %
REVENUES EBITDA and EBITDA MARGIN PAT and PAT MARGIN
2,861.2
3,380.7
FY15 FY16
918.0 1,024.6
32.1% 30.3%
FY15 FY16EBIDTA EBIDTA Margin %
18 % 12 % 9 %
CASH PROFIT
740.1 821.1
FY15 FY16Cash Profit
11 %
33

34
Q4 & FY16 – REVENUE ANALYSIS
% Share Q4 FY15 Q4 FY16
89.1% 84.7%
10.7% 14.3%
0.2% 1.0%
SEGMENT BREAKUP
Q4 FY16 YoY ANALYSIS
SEGMENT BREAKUP
FY16 YoY ANALYSIS
928.0
1,113.5
111.2
187.6
2.0
13.3
Q4 FY15 Q4 FY16
Retail
Enterprises & Government
Mobile
% Share FY15 FY16
86.7% 85.1%
13.0% 13.3%
0.3% 1.6%
2,479.7 2,877.6
370.8
450.1
10.7
53.0
FY15 FY16
Retail
Enterprises & Government
Mobile
3,380.7
2,861.2
1,314.4
1,041.1
69 %
20 %
575 %
21 %
16 %
397 %
In Rs. Mn
35
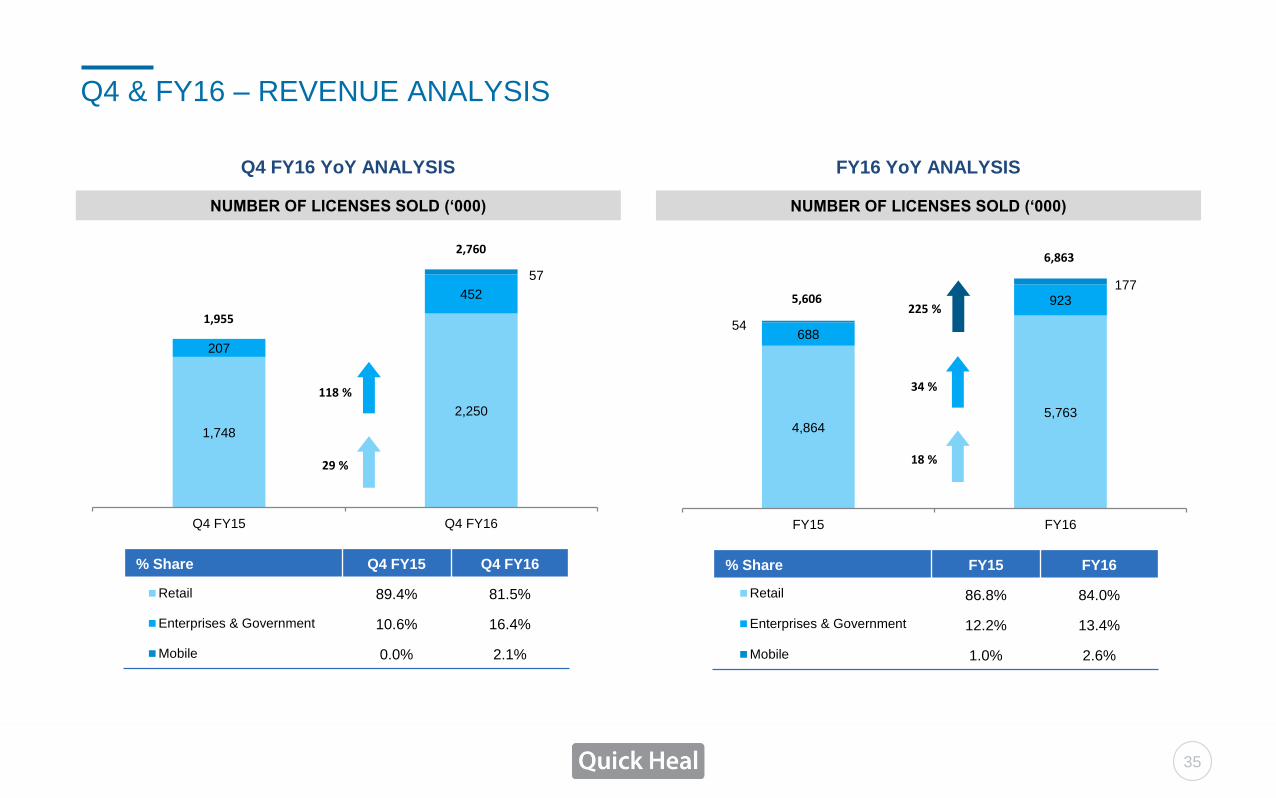
Q4 & FY16 – REVENUE ANALYSIS
NUMBER OF LICENSES SOLD (‘000)
Q4 FY16 YoY ANALYSIS
NUMBER OF LICENSES SOLD (‘000)
FY16 YoY ANALYSIS
% Share Q4 FY15 Q4 FY16
89.4% 81.5%
10.6% 16.4%
0.0% 2.1%
1,748
2,250
207
452
57
Q4 FY15 Q4 FY16
Retail
Enterprises & Government
Mobile
% Share FY15 FY16
86.8% 84.0%
12.2% 13.4%
1.0% 2.6%
4,8645,763
688
923
54
177
FY15 FY16
Retail
Enterprises & Government
Mobile
6,863
5,606
2,760
1,955
118 %
29 %
34 %
18 %
225 %

36
Q4 & FY16 – REVENUE ANALYSIS
DEALER CONCENTRATION PROFILE
FY15
DEALER CONCENTRATION PROFILE
FY16
9%
38%
52%
Top 1 Top 10 Top 20
% of Total Revenues
8%
33%
45%
Top 1 Top 10 Top 20
% of Total Revenues

6.8%
12.0%
10.3%
21.0%
10.7%
39.2%
Direct Cost
R&D Cost
Advertising & Sales Promotion Cost
Sales & Distribution Cost
G&A Cost
EBITDA Margin
37
Q4 & FY16 – COST ANALYSIS
8.9%
16.1%
14.8%
16.3%
11.9%
32.1%
5.9%
12.3%
13.7%
14.1%
9.8%
44.3%
7.9%
17.7%
13.3%
17.1%
13.7%
30.3%
Q4 FY15 Q4 FY16
FY15 FY16

38
FY16 - WORKING CAPITAL ANALYSIS
WORKING CAPITAL ANALYSIS – FY16
65
33
5 37
Receivables Days Inventory Days Payables Days Net Working Capital Days
Note: Net Working Capital Days = (Net Working Capital / Fourth Quarter Sales) * 91 days

39
CONSOLIDATED PROFIT & LOSS STATEMENT
Particulars (In Rs Mn) Q4 FY16 Q4 FY15 YoY% FY16 FY15 YoY%
Net Sales (Net Of Excise Duty) 1,314.4 1,041.1 26.3% 3,380.7 2,861.2 18.2%
Other Operating Income 0.0 0.0 - 0.0 0.0 -
Total Income From Operations 1,314.4 1,041.1 26.3% 3,380.7 2,861.2 18.2%
Direct Cost 77.6 71.2 9.0% 265.4 255.0 4.1%
Gross Profit 1,236.8 969.9 27.5% 3,115.3 2,606.2 19.5%
Gros Margin % 94.1% 93.2% 94 bps 92.1% 91.1% 106 bps
R&D Cost 161.4 125.2 28.9% 599.6 459.5 30.5%
Advertisting & Sales Promotion 180.1 107.1 68.2% 448.9 422.6 6.2%
Sales and Distribution 185.1 218.5 -15.3% 577.9 465.7 24.1%
General Administration 128.4 111.5 15.1% 464.2 340.3 36.4%
EBIDTA 581.8 407.6 42.7% 1,024.6 918.1 11.6%
EBITDA Margin % 44.3% 39.2% 511 bps 30.3% 32.1% -178 bps
Depreciation / Amortization 63.3 83.7 -24.4% 237.1 202.0 17.4%
EBIT 518.5 323.9 60.1% 787.5 716.1 10.0%
Other Income 35.5 17.6 101.7% 98.0 82.2 19.2%
Finance Cost 0.0 0.0 - 0.0 0.0 -
PBT 554.0 341.5 62.2% 885.6 798.3 10.9%
Tax 175.8 110.3 59.3% 301.6 260.2 15.9%
Effective Tax Rate % 31.7% 32.3% -58 bps 34.1% 32.6% 146 bps
PAT 378.2 231.1 63.6% 584.0 538.1 8.5%
PAT Margin % 28.8% 22.2% 657 bps 17.3% 18.8% -153 bps
EPS (Rs) 6.07 3.78 60.6% 9.37 8.81 6.4%

40
CONSOLIDATED BALANCE SHEET
Particulars (In Rs Mn) FY16 FY15
Share Holders’ Funds:
Equity Share Capital 700.3 610.7
Reserves And Surplus 5,369.0 2,703.7
Total Of Shareholder Funds 6,069.3 3,314.4
Non-Current Liabilities:
Long Term Borrowings 0.0 0.0
Deferred Tax Liabilities (Net) 0.0 0.0
Other Long Term Liabilities 0.0 0.0
Long Term Provisions 0.0 0.0
Total Of Non-Current Liabilities 0.0 0.0
Current Liabilities:
Short-Term Borrowings 0.0 0.0
Trade Payables 531.8 373.7
Other Current Liabilities 143.3 75.0
Short-Term Provisions 409.6 516.7
Total Of Current Liabilities 1,084.7 965.3
Total Equity & Liabilities 7,154.0 4,279.7
Particulars (In Rs Mn) FY16 FY15
Non-Current Assets:
Fixed Assets
Fixed Assets 1,967.9 1,848.0
Non-Current Investments 34.2 4.2
Deferred Tax Assets (Net) 71.6 48.5
Long-Term Loans And Advances 177.7 172.3
Other Non-Current Assets 2.0 1.2
Total Non-Current Assets 2,253.4 2,074.2
Current Assets:
Current Investments 1,084.0 1,296.1
Inventories 66.7 78.4
Trade Receivables 945.8 647.6
Cash And Bank Balances 2,690.6 126.4
Short-Term Loans And Advances 94.6 55.4
Other Current Assets 19.0 1.6
Total Current Assets 4,900.6 2,205.5
Total Assets 7,154.0 4,279.7

41
SHAREHOLDING STRUCTURE
Promoter & Promoter Group, 72.87
Institutions, 13.77
Public, 13.36
Source – BSE
% Shareholding – March 2016

Mr Rajesh Ghonasgi
Quick Heal Technologies Limited
CFO
Email ID: [email protected]
Contact No: +91 (20) 6681 3232
Nilesh Dalvi / Kapil Jagasia
Dickenson Seagull IR
IR Consultant
Email ID: [email protected] |
Contact No:+91 9819289131 / 9819033209
FOR FURTHER QUERIES