Question: How much warming can CO2 cause? Higher levels of atmospheric CO2 do cause some warming....
73
Question: How much warming can CO2 cause? • Higher levels of atmospheric CO2 do cause some warming. However, CO2s ability to absorb heat is logarithmic, meaning the more CO2 there is, the less heat it can absorb. • If atmospheric CO2 levels double or triple , CO2, by itself , can not cause temperatures to rise more than 1.0 to 1.5 degrees C (source T.J. Nelson, http://brneurosci.org/co2.html) • For CO2 to cause warming above 1.5 degrees Centigrade rising levels of CO2 must cause positive feedbacks
-
Upload
kendra-dredge -
Category
Documents
-
view
227 -
download
0
Transcript of Question: How much warming can CO2 cause? Higher levels of atmospheric CO2 do cause some warming....

Question: How much warming can CO2 cause?
• Higher levels of atmospheric CO2 do cause some warming. However, CO2s ability to absorb heat is logarithmic, meaning the more CO2 there is, the less heat it can absorb.
• If atmospheric CO2 levels double or triple, CO2, by itself, can not cause temperatures to rise more than 1.0 to 1.5 degrees C (source T.J. Nelson, http://brneurosci.org/co2.html)
• For CO2 to cause warming above 1.5 degrees Centigrade rising levels of CO2 must cause positive feedbacks

Positive feedback, sometimes referred to as "cumulative causation", refers to a situation where some effect causes more of itself. A system undergoing positive feedback is unstable, that is, it will tend to spiral out of control as the effect amplifies itself.
(Source: Wikipedia)
Rising levels of CO2 can only cause temperatures to warm above about 1 to 1.5 degree C if they also causes more water vapor in the atmosphere/ heat trapping cirrus clouds/ and or a reduction in clouds.
*But observation shows this does not happen.
*Warming causes more low level clouds to form, it rains and temperatures cool. Low level clouds are negative feedbacks, they moderate temperature.

Cirrus Clouds slow the release of heat from the atmosphere. Observation shows that fewer of these clouds form when air
temperatures warm.

C02’s absorption of heat is logarithmic, the more there is, the less heat it can absorb

Atmospheric CO2 levels continue to rise yet temperatures are not following

Rapid temperature change is a daily, seasonal occurrence
• The difference between the daily low and high temperature can be as high as 35 deg F or more
• Difference between record low and record high Virginia state temperatures is 140 degrees F
• Mankind and nature survived these radical temperature changes, (they adapted)

Effect of CO2 on temperatures at two locations, each at the same latitude
Dry desert Humid jungle

The impact of humidity, H2O, and CO2 on high/low temperatures
• The slight impact of warming from CO2 can be demonstrated from the temperature changes between the low and high temperature in humid tropical and dry desert areas
• Tropical areas are cooler in the day than the desert and are also warmer at night, due to the stabilizing effect of humidity.
• In desert areas temperatures are both warmer in the day and cooler in night than tropical areas.
• CO2 levels are about the same in both areas, yet the CO2 in the desert does not trap/retain the heat of the day. This demonstrates that CO2 by itself does not cause much warming and how important water vapor is in stabilizing temperature.

The theory of AGW• The theory of man made global warming states that increases in
atmospheric CO2 from man will absorb heat and cause temperatures to rise. This warming from additional concentrations of CO2 is said to cause increasing levels of humidity which in turn absorbs even more heat, creating a vicious cycle with rising temperatures spinning out of control.
• If this theory were correct, why did runaway global warming not ocure in earlier times, when atmospheric CO2 concentrations were much higher than today’s?
• Temperatures and humidity also rise substantially in summer. This has not triggered runaway temperatures, either.
“Over geological time, there is no observed relationship between global
climate and atmospheric CO2. “ Ian Plimer.

Observation shows that atmospheric humidity is not rising as CO2 levels increase.
This contradicts the theory of AGW. Data source: NOAA Earth System Research Laboratory

CO2 is essential for life on Earth
• CO2 levels were about 270ppm in the mid 1700s (they are 400ppm today).
• If CO2 levels fall below 150ppm, plants stop growing. Photosynthesis stops.
• Most life on Earth was thus close to extinction during the glacial period of the ice ages due to a lack of atmospheric CO2 when CO2 levels fell to 180ppm.

What is the impact of higher CO2 levels on plant life?

Plants today grow 15% more quickly due to the higher level of CO2.
Greenhouses raise CO2 levels to 1,000ppm to increase the growth rate of plants.
Higher CO2 levels will help feed a growing world population.

• With rising levels of atmospheric CO2:
Plants require less water to grow.
Arid areas of earth become more productive agriculturally.
There is less drought.
Question: Is storm intensity increasing due to AGW?U.S. tornado activity has been generally in decline in
the past few decades.

Tornadoes in the United States during the Spring 2013 are near the lowest level ever recorded. U.S. Tornado
fatalities have also been declining significantly.

Global hurricane intensity is at 50 year lowsU.S. Hurricane activity is at 12 year lows
(source: Florida State University)
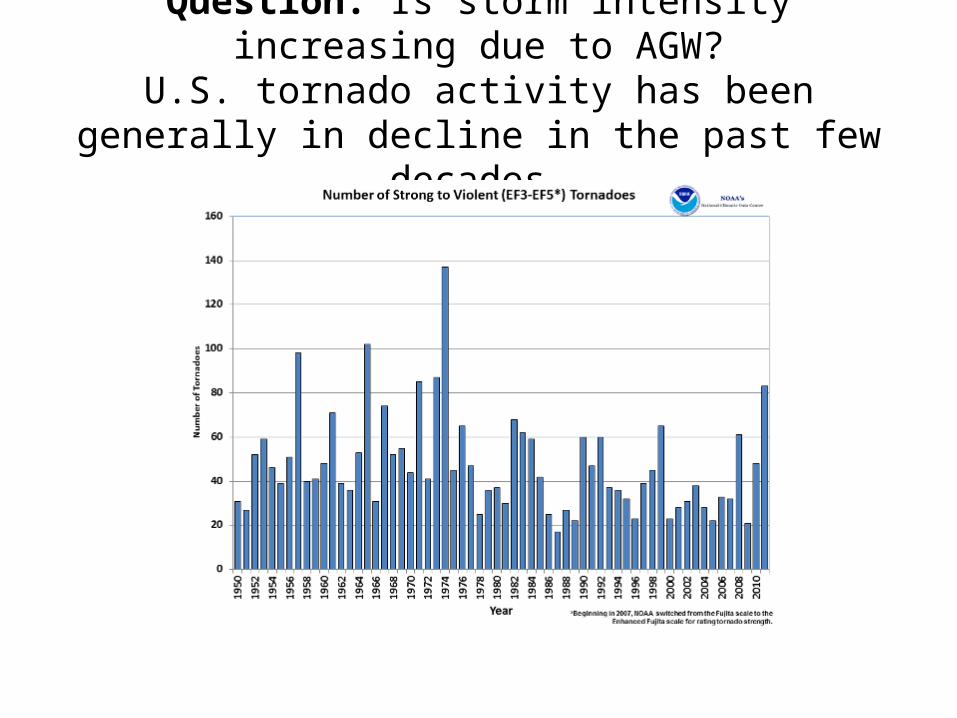
In the past, landfall hurricane strikes in the U.S. were much more common than the period since
the 1970s.

Global deaths due to extreme events are in decline(source:
appinys.org)

Question: Is the polar ice melting due to AGW?
• The earth is in an interglacial period. There is an imbalance with the ice that remains at the poles from the last Ice Age and the warmer temperature of the Holocene. Slow melting has been going on for thousands of years and will continue.
• At the Poles, 20,000,000 square kilometers of sea ice melt and then refreeze every year. As one pole melts the other freezes, thus there is an offsetting balance
• Massive ice melt is natural and happens every single year

Both poles lose substantial amount of sea ice every year in the polar Summer

• Question:
If the entire North Pole, all the Arctic ice melts, along with all the sea ice on earth at both Poles……
How high would the seas rise?

Answer: None at All
Floating ice is already in the ocean, displacing water.
Melting sea ice cannot raise the sea level.

• For the seas to rise, ice on land must melt.
• Greenland has 10% of the global land ice
• Antarctica has 90%.
• Question: In what year did Antarctica, with 90% of the globe’s land ice have the most sea ice ever recorded?

Answer: 2012
Antarctica had the most sea ice ever recorded in September 2012

Antarctic sea ice has been growing almost continuously for the last 30 years
(source: The Air Vent)

Satellite data shows that atmospheric temperatures above Antarctica have been cooling since the start of measurement in
1979(source, University of Alabama, Huntsville)

There has been above average melting of the Arctic sea ice but an almost equal growth of ice in the Antarctic.
Total global sea ice volumes are remarkably stable.Source: Cryosphere Today – University of Illinois – Polar Research Group

Antarctica is the key to sea level rise
• Sea ice is greatly influenced by temperature, especially water temperature
• Sea ice has been growing in Antarctica for 30 years. Temperatures have been cooling in 96% of Antarctica for 50 years (but not at the Peninsula)
• The average temperature in Antarctic interior is -58 degrees F. It is also the highest Continent on earth with an average altitude of 8,200 feet.
• Antarctica is classified as a desert. It is the driest place on earth. There is little snow.
• If the man made global warming theory is true, sea ice will melt, but the higher humidity will cause much more snow in the interior and overall ice volumes will grow. This is also true of Greenland.
• Mankind has little impact on the climate in Antarctica
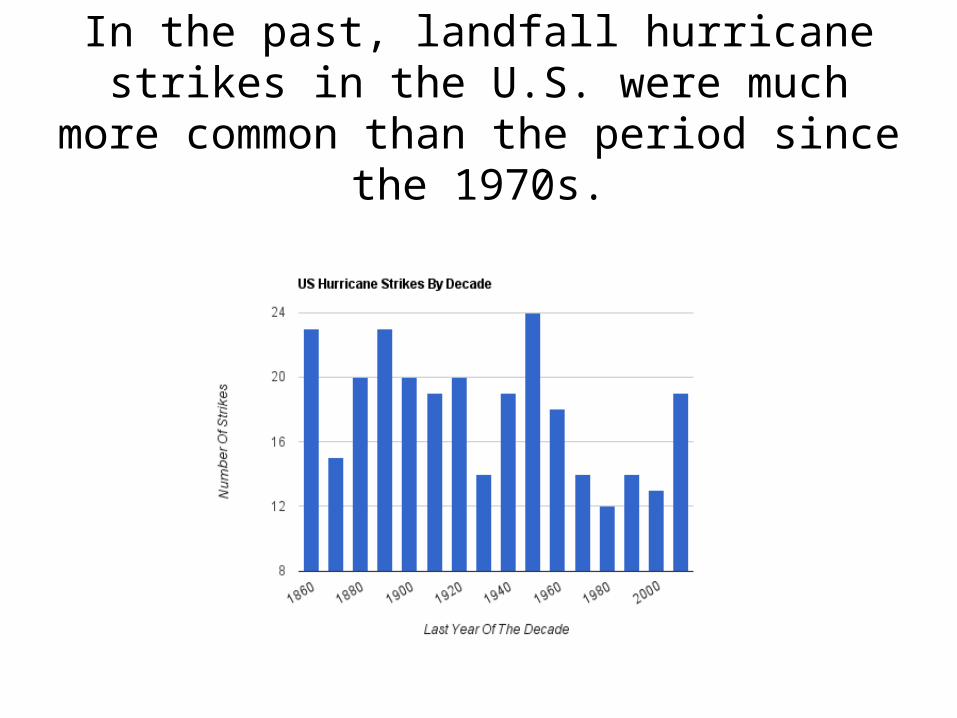
Greenland has approximately ten percent of the globe’s land ice. Ice cores taken in Greenland show that temperatures there in the last ten-thousand years have mostly been warmer than today. The ice did not
melt then. It probably won’t not now.

Scientific name for the Polar Bear is “Ursus Maritimus”, sea bear.Polar Bears are excellent swimmers and can easily swim 100 miles or
more. The longest documented swim is 426 miles, non stop, over nine days..
Polar Bear populations are today the largest ever recorded, an increase of 400%+ since the 1960s
Polar Bears have survived previous periods when the Arctic ice melted completely
(source of polar bear population, US Senate)

The sea level has been rising for 20,000 years and the end of the last Ice Age. The rate of increase has slowed, and especially in
the last four years (source: Wikipedia_

Global sea level rise has been consistent, about 8 inches per century. Note the decline in Ocean levels the past few years.

Some say rising CO2 will cause ocean acidification, killing corals
• If all the fossil fuels on earth were burned there would not be enough CO2 to cause the oceans to acidify.
• CO2 in the ocean is converted to carbonate. It becomes fixed in insoluble form, sinking to the ocean bottom, forming limestone.
• Coral reefs thrived when atmospheric CO2 was ten times higher and temperatures ten degrees warmer than today.
• Corals have adapted in the past to changes in CO2 levels. (Source: Ian Plimmer)

Would a warming world lead to increased risk of mosquito borne malaria?
• Studies predicting that warmer climates will increase malaria infections commonly assume that the disease-causing parasites will develop faster and that the ability of the mosquito to acquire, maintain and transmit the pathogen will remain constant. They conclude that as temperature rises, mosquitoes become infectious quicker and therefore malaria transmission increases.
• But the latest study shows that temperature has a more complex effect. As temperature rises, parasites do develop faster, but fewer of them become infectious. End result, a warming world would not have more malaria.
• Malaria is no stranger to the northern climates. The largest malaria outbreak of modern times was in Siberia in the 1920s and 1930s, when 13 million were infected, 600,000 died and 30,000 died as far north as Arkhangelsk, on the Arctic Circle. Alaska has also had similar outbreaks of Malaria.
Why has the earth been warming if not from rising CO2 levels? The Sun may be the answer.
• The source for the warm temperatures we have and need to sustain life comes almost entirely from the Sun.
• The Earth’s atmosphere and greenhouse gases are the reason its temperatures are not like those of the Moon, (-243 degrees F at night to +212 degrees F in day).
• Many climate scientists fail to look to the heavens to take a closer view of the Sun.
(source: Wiki Answers)

Galileo was the first to observe Sunspots

Galileo’s drawing of sunspots in 1613

An active Sun on the left and inactive Sun on the right.Sunspots are used to track solar activity. Solar activity is not constant,
the Sun has cycles that last an average of 11 years. We are now in cycle 24.

Changing solar activity is measured by observing and counting Sunspots. Note how much solar activity has increased since measurement began in the
year 1610.

The observatory at Armagh Ireland has one of the longest continuous temperature records on earth. This chart tracks the
close relationship between temperature from 1796 (as shown by the dots on the chart), and 11 year solar cycles ( the solid line).
(source: Armagh Observatory)

Solar activity and temperature appear to be closely linked.source: Jean-Louis Le Mouel, Vincent Courtillot, Elena Blanter, Mikhail Shnirman

The solar activity in the last decades of the 20th Century was the highest in the last 8,000 years.
This may explain why global temperatures were warming in this period (chart is 1611 to 2001)
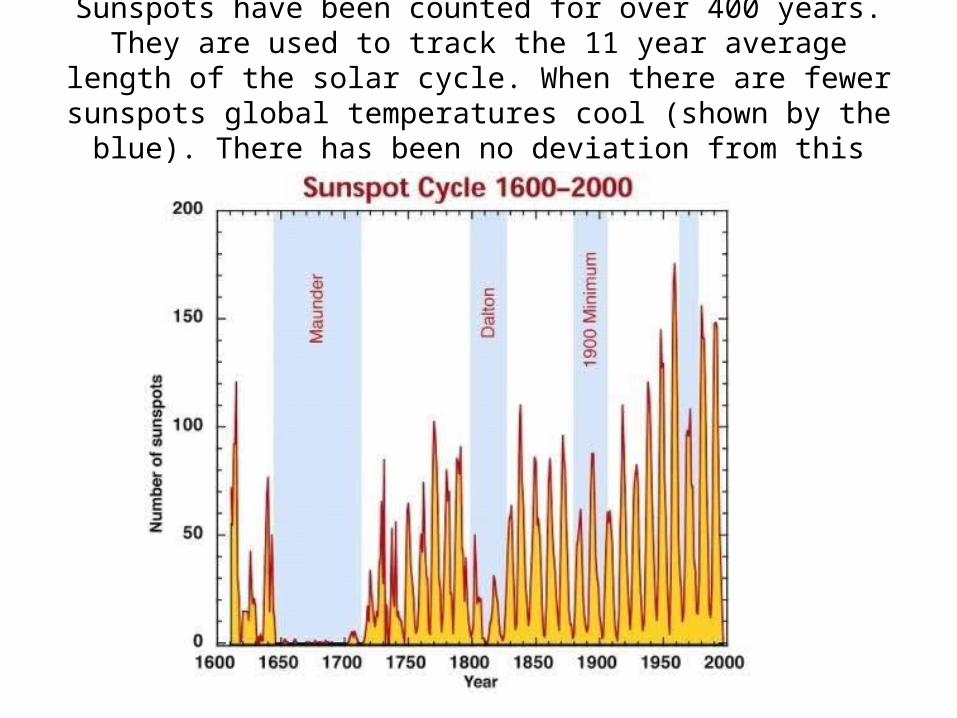
Sunspots have been counted for over 400 years. They are used to track the 11 year average length of the solar cycle. When there are fewer sunspots global temperatures cool (shown by the blue). There has
been no deviation from this relationship over this period.

The current solar cycle, cycle 24, is very slow to ramp up. It is predicted to be very weak, especially when compared to
previous cycle 22 and 23. Current solar activity is at the lowest level in almost two centuries.
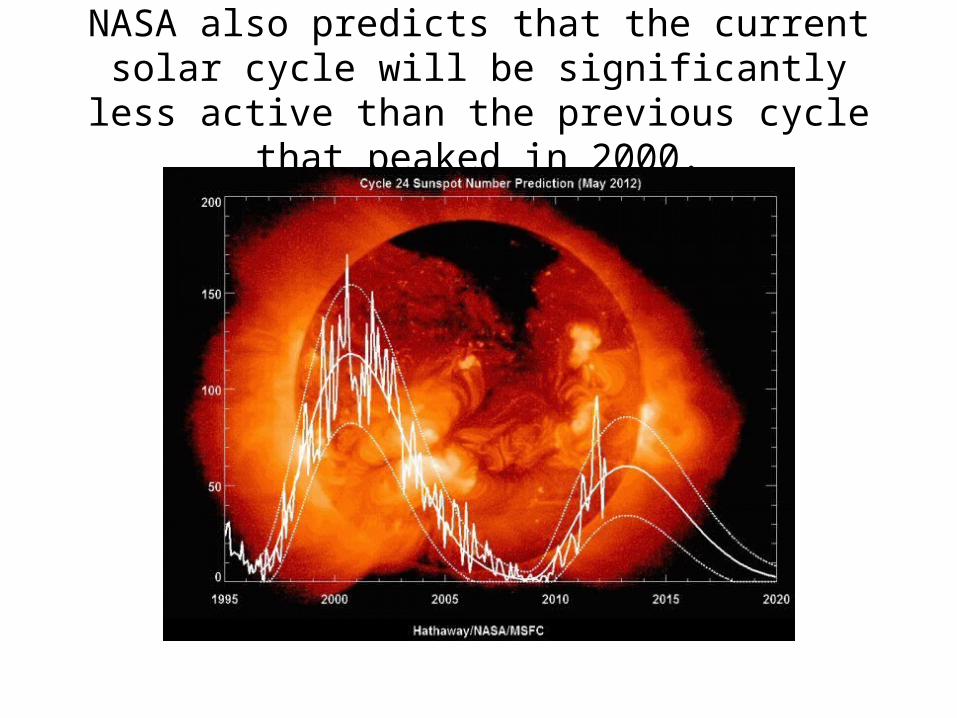
NASA also predicts that the current solar cycle will be significantly less active than the previous cycle that
peaked in 2000.

Solar activity is driven by the Sun’s internal magnetic field, (AP Index). The AP index (solar magnetic activity) in December 2009 was at the lowest level ever recorded. Note that the low AP index in mid chart,
was also during the 1970s cooling scare. (Source: David Archibald)

The Solar magnetic field strength, the AP index, remains at very low levels and has not recovered from the shift which began in
October 2005.

Solar cycle lengths from 1762. Cycle 23, which ended in 2009, is the longest since 1788, a cycle that predated a several decade
long very cold period called the Dalton minimum. Longer cycles have fewer sunspots than shorter ones.
(Source: Wattsupwiththat.com)

Temperature and solar records at De Bilt Netherlands 1705 - 2000, demonstrates the close relationship between solar cycle
length and temperatures.With each additional year of cycle length above 11 years
temperatures cool an average of 0.7 degrees C. at this location.
(source: David Archibald)

The central England temperature record since 1659 shows the same general relationship between solar cycle length in years
and temperature.

Using the record of temperature and solar cycle length at Hanover New Hampshire since 1835, one can see that the short solar cycle 22 of the 1990’s was during a warm period and the 12.5 year long cycle 23 should result in a 2.0 degree C reduction in temperature (3.6 deg F) at this location over the
expected twelve year life of solar cycle 24. (Source: David Archibald, using Friis-Christenson Larsen theory)

The relationship between Solar cycle length and temperature at ten locations in Norway
With Solar Cycle 23 being 3 years longer than Solar Cycle 22, temperatures in Norway should decrease 0.6C to 1.8C in the next decade using historical data from the impact of previous Solar Cycles.
Source: Jan-Erik Solheim
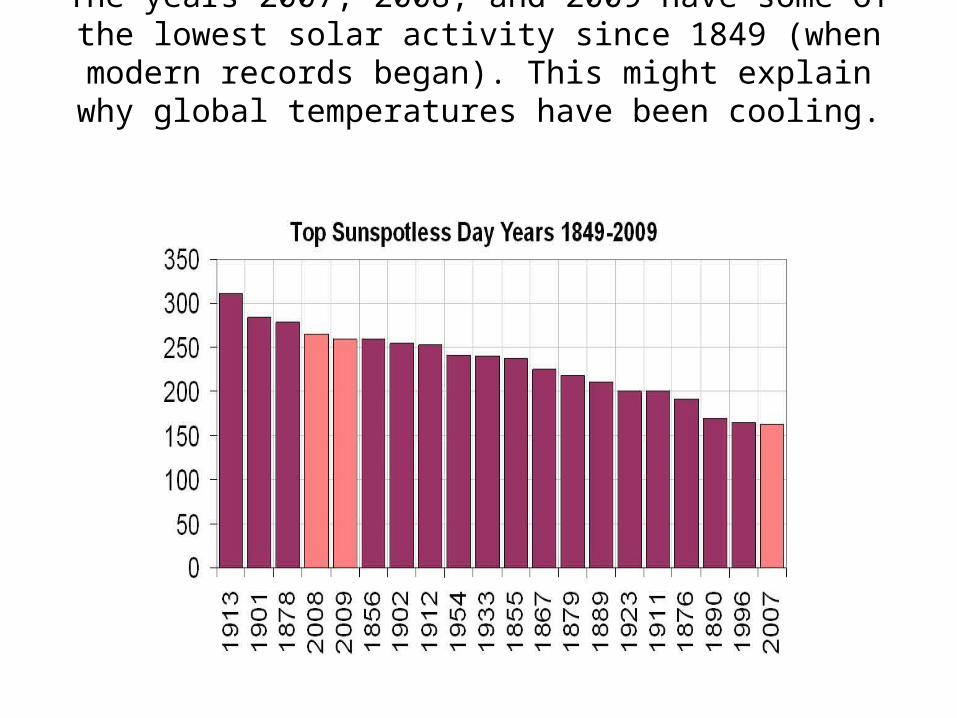
The years 2007, 2008, and 2009 have some of the lowest solar activity since 1849 (when modern records began). This might
explain why global temperatures have been cooling. (Source: Anthony Watts)

Solar winds in recent years were at lowest level every recorded. Changes in solar activity have impact on the atmosphere that
surrounds Earth.

Solar Impact on cloud formationThe impact on the earth’s climate from the Sun goes beyond irradiance (heat).
Solar winds have declined over 30% . Ultra violet radiation levels have also been in decline. Cosmic rays reaching earth’s surface have also increased substantially.
Some scientists believe that changing solar activity affect global temperatures by causing changes within the atmosphere and especially the clouds. With today’s century low solar activity and record low solar winds, it is thought that the increase in cosmic rays that reach our atmosphere from deep in space cause more clouds to form. Clouds reflect up to 65% of solar radiation back into space, and when there are more clouds, temperatures cool. Conversely, increasing solar activity and the resulting increase in solar winds reduces the amount of cosmic rays that reach the atmosphere, fewer clouds form, more solar rays reach the earth’s surface, and this leads to higher temperatures.
If the past is a predictor of the future, the changes we now see in solar activity will cause the temperatures to cool for the next 20 years or longer. The Thames River at London could freeze once again as it often did during the Little Ice Age and into the early 1800’s.

Relationship between cosmic rays and cloud formation.
(source: David Archibald)

Lower solar activity allows more cosmic rays to enter Earth’s atmosphere. Some scientists believe that when cosmic ray levels
are low, more low level clouds form, and this cools the Earth.

Research has verified a close connection between cosmic rays and temperature. Studies of dripstones in Oman for the period
7500-4500 BC show a high degree of synchronicity between solar activity and temperature development. Figure modified after
Neff et al. (2001)

Observation shows there is a correlation between cosmic rays, and low altitude cloud formation. Low level clouds reflect solar
rays back into space, cooling the Earth’s surface.Source: Svensmark

As more clouds form they cool the oceans and later, atmospheric temperatures. Note the close relationship between solar cycles, ocean surface and atmospheric
temperatures.

Low cloud cover has an impact on temperatures. They cause them to cool.
David Archibald

This chart shows a close relationship between solar magnetic activity, ( the AA Planetary Geomagnetic Index), and ocean
surface temperature (NAO)

There is a strong relationship between solar activity (sunspots) and the global surface temperature. Source NOAA

Global atmospheric temperatures have not increased for 15 years according to the UK Met Office. The trend
shows cooling.

The UK Met Office and NASA predict that there is a 92% chance that low solar activity will continue for the next several decades and will be as low as the time period of the Dalton and Maunder Minimums, periods when global temperatures were significantly
lower than today.Source: Livingston and Penn Solar Cycle Amplitude Estimate

What will global temperatures do in the next 20-40 years?
• Never in the past has CO2 been a significant factor in determining temperature on Earth.
• The Pacific and Atlantic surface temperatures run in roughly 30 year cycles (PDO, AMO), dominated by periods of cooling or warming. They have been in a warm cycle the past three decades and are currently transitioning towards their cool phase. These cycles are closely linked with solar activity.
• Solar activity was very strong in the 1980s and early 1990s but has weakened since. Low solar activity is expected to continue for the next several decades.
• Volcanic activity also impacts global temperatures. Major volcanic eruptions emit fine particles into the upper atmosphere that block sunlight from reaching the Earth’s surface. This causes temperatures to cool. A major northern hemisphere eruption could influence the global climate for years.
• If the past is a barometer of the future, overall global temperatures should noticeably cool in the next twenty to forty years. This cooling appears to have already begun.
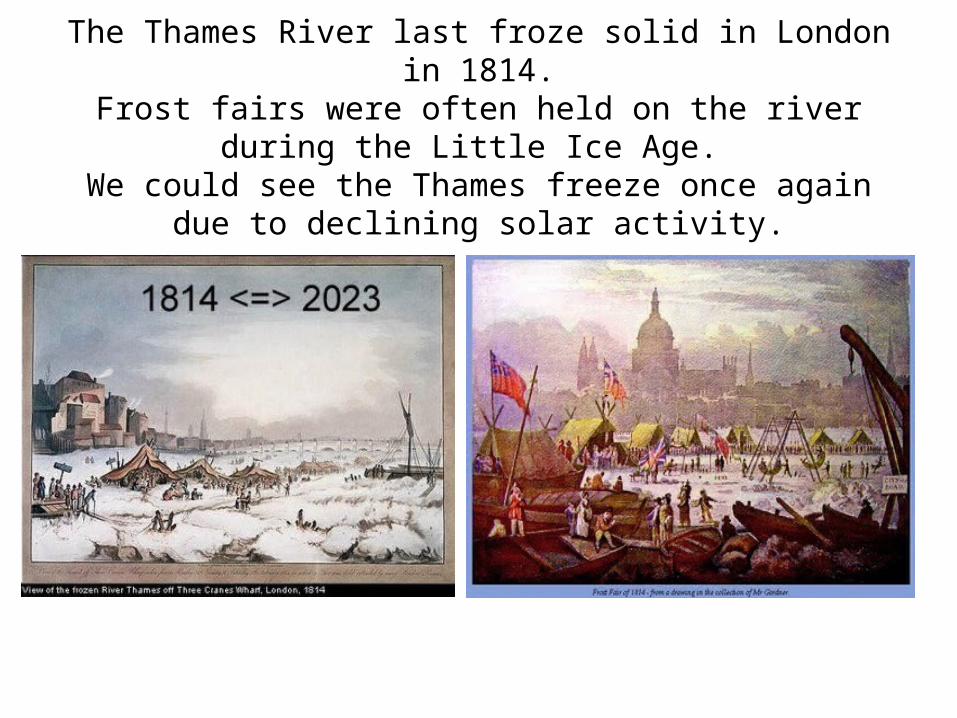
The Thames River last froze solid in London in 1814.Frost fairs were often held on the river during the Little Ice Age.
We could see the Thames freeze once again due to declining solar activity.

We could also see the return of the frozen canals of the Netherlands, such as those depicted in the stories of
Hans Christian Anderson.

Conclusions• The earth’s current warming trend started in the mid 1700s with
the end of the Little Ice Age, long before CO2 was a factor.• Until we understand the natural forces that impact climate,
models cannot be relied upon to predict future temperatures with accuracy.
• CO2 does not have much direct impact on temperature.• Positive feedbacks caused by rising levels of CO2 have not been
observed.• Rising CO2 levels have a beneficial impact on plant growth.• There is little loss of overall global polar ice, though some slow
melting is normal. The melting of Arctic ice has no impact on sea level.
• Sea levels have been rising for thousands of years, and some rise is normal
• Global hurricane intensity is at fifty year lows.

Conclusions• Global atmospheric temperatures have been cooling slightly for ten
years or more. There has been no “statistically significant” global warming since 1995 even though CO2 levels are rising.
• Polar bear populations are growing.• Solar activity and temperature are closely linked. Today’s century
low solar activity is causing temperatures to drop. Temperatures could fall as quickly as the 70’s cooling scare but they could become colder and last longer. This would cause the loss of several weeks in the growing season on both ends and result in reduced crop production. (David Archibald)
• Cold periods are much worse for humanity than warm ones. Cold periods in the past have been ones of famine, disease, death
and political instability.• Man has little impact on global temperatures.
(* David Archibald)

For more information
• www.isthereglobalwarming.com• www.wattsupwiththat.com• www.icecap.us• www.friendsofscience.org
• Contact author Geoffrey Pohanka 1772 Ritchie Station Court Capitol Heights, MD 20743 [email protected] (this presentation may be duplicated so long as it is not used for profit or commercial purposes)