Question! 01000001 1 Byte = 8 bits ASCII Code American Standard Code for Information Interchange.
27
-
Upload
stanley-bennett -
Category
Documents
-
view
269 -
download
3
Transcript of Question! 01000001 1 Byte = 8 bits ASCII Code American Standard Code for Information Interchange.

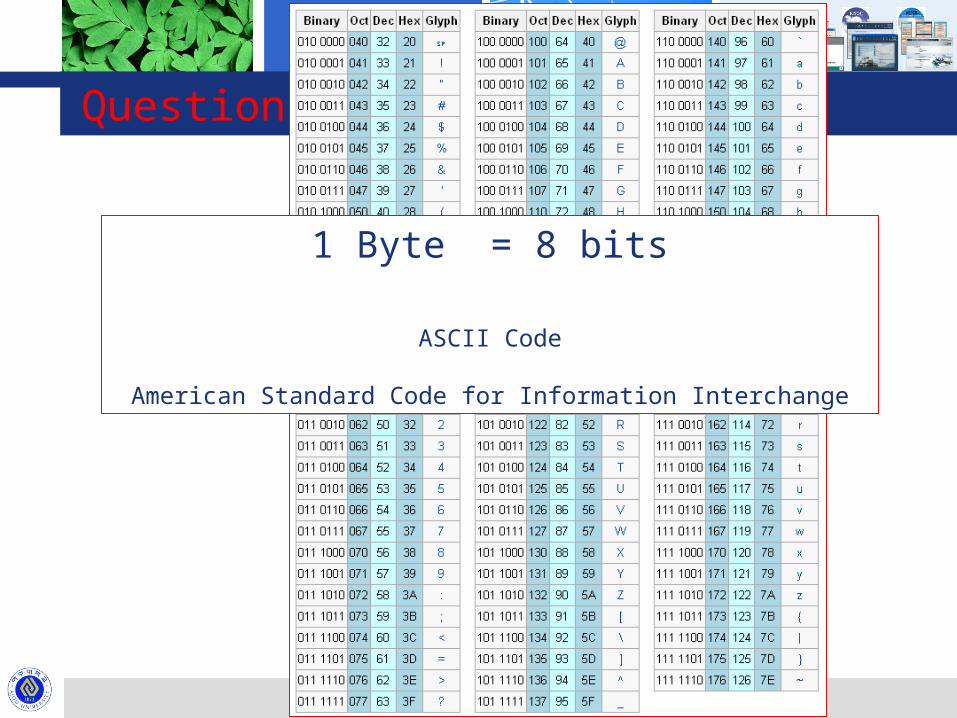
Question!
010000011 Byte = 8 bits
ASCII Code
American Standard Code for Information Interchange
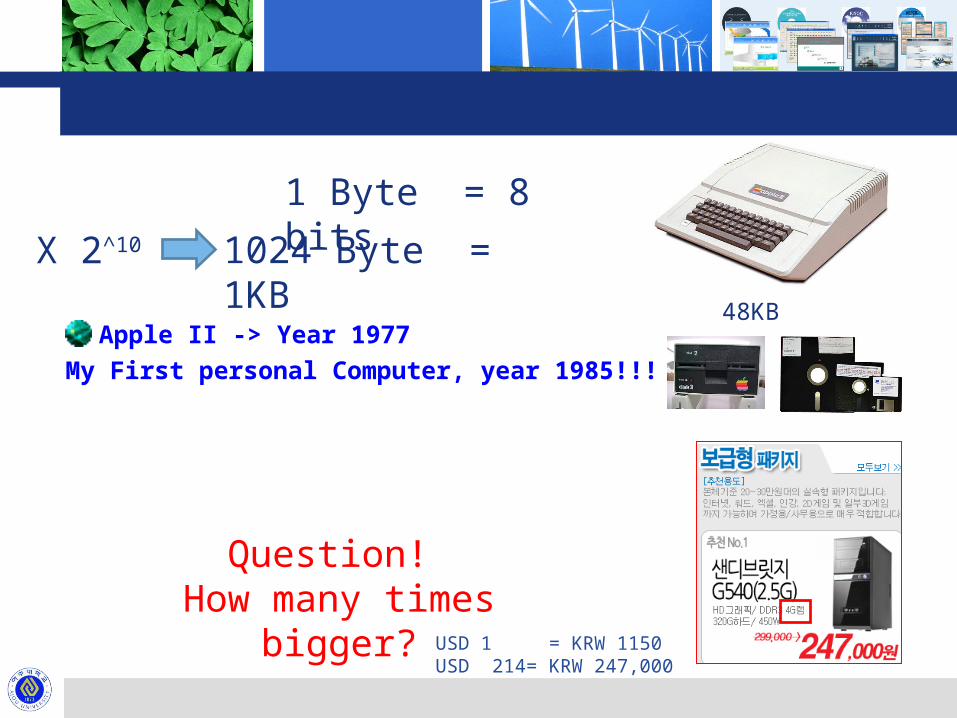
Apple II -> Year 1977My First personal Computer, year
1985!!!
1 Byte = 8 bits
X 2^10 1024 Byte = 1KB
48KB
Question! How many times bigger?
USD 1 = KRW 1150USD 214= KRW 247,000
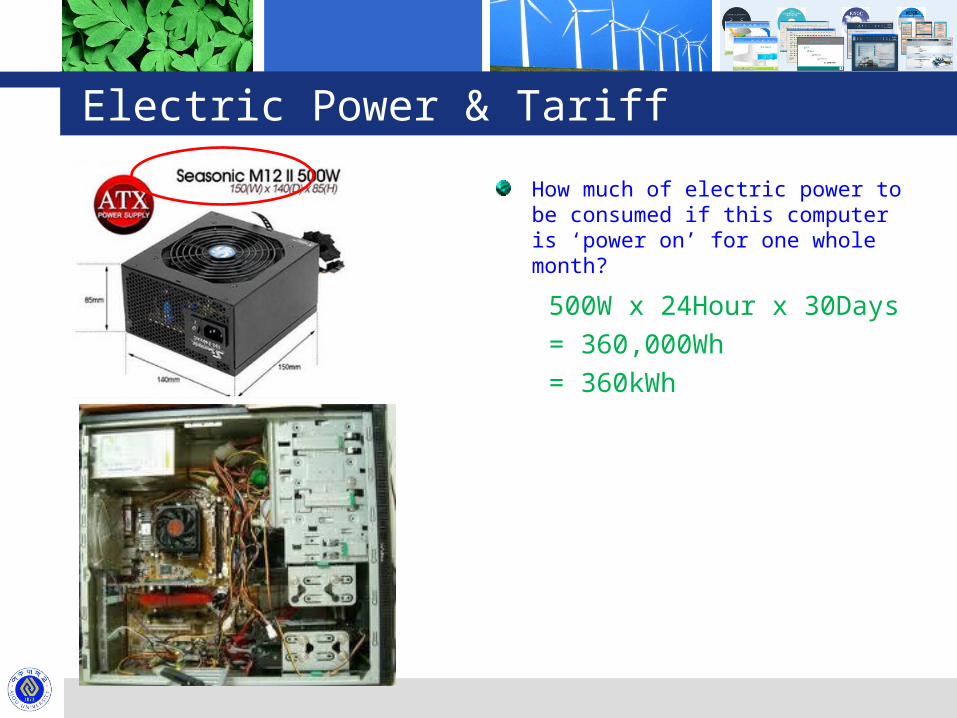
Electric Power & Tariff
How much of electric power to be consumed if this computer is ‘power on’ for one whole month?
500W x 24Hour x 30Days= 360,000Wh= 360kWh

Korea Nuclear Power Plants (Kori)
One Nuclear Power Plant Capacity 1GW = 1,000MW = 1,000,000kW
Photovoltaic
66
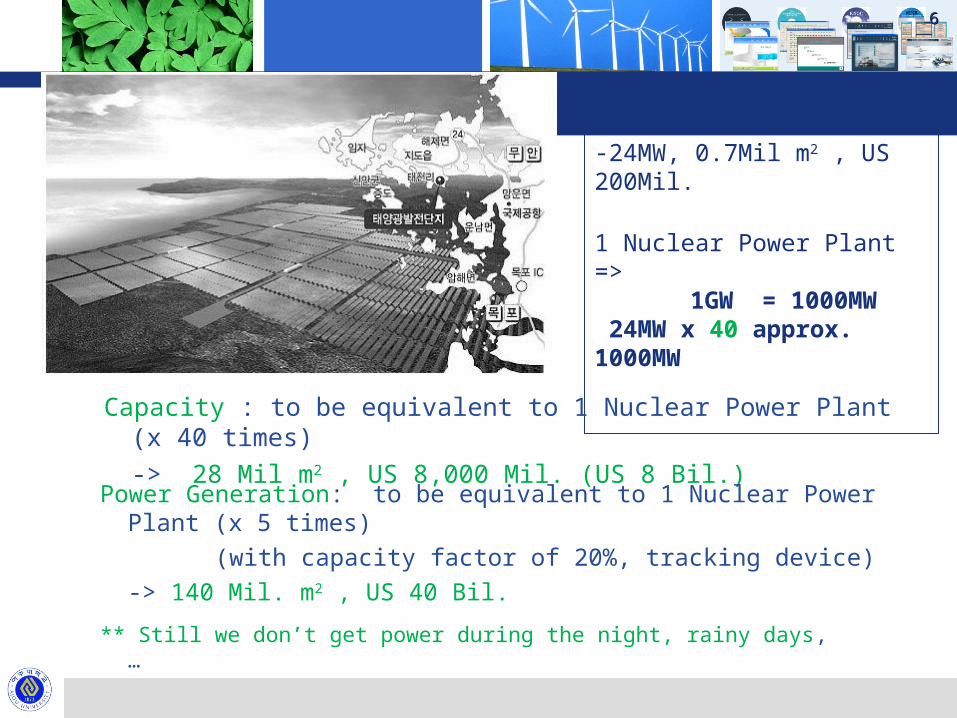
East Sun Power Gen. Co.-24MW, 0.7Mil m2 , US 200Mil.
1 Nuclear Power Plant => 1GW = 1000MW
24MW x 40 approx. 1000MW
Capacity : to be equivalent to 1 Nuclear Power Plant (x 40 times)-> 28 Mil m2 , US 8,000 Mil. (US 8 Bil.)
Power Generation: to be equivalent to 1 Nuclear Power Plant (x 5 times)
(with capacity factor of 20%, tracking device) -> 140 Mil. m2 , US 40 Bil.
** Still we don’t get power during the night, rainy days,…
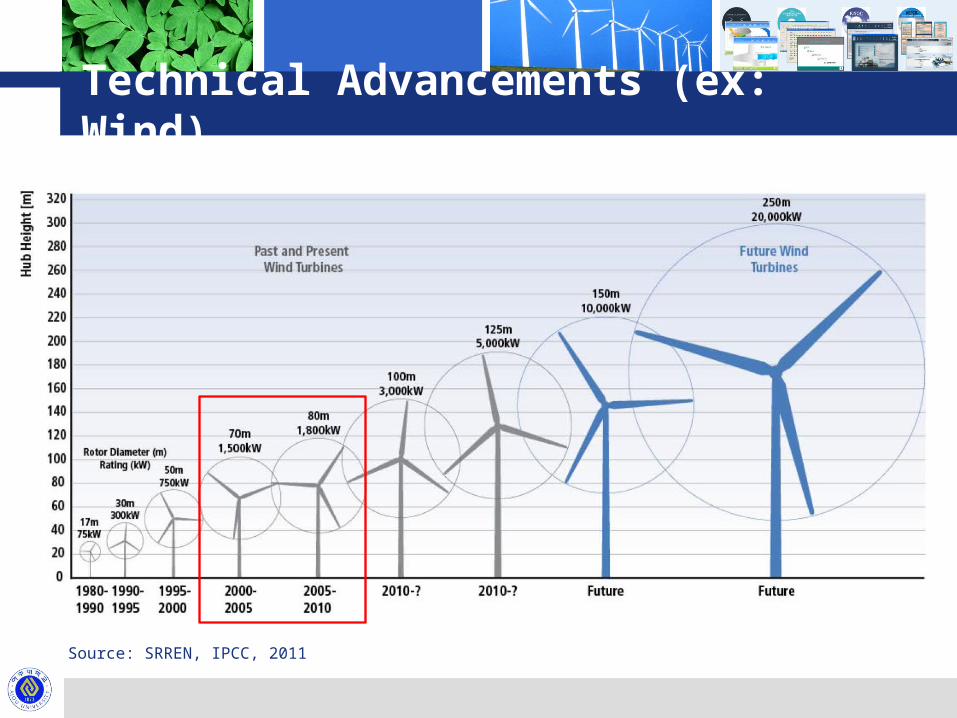
Technical Advancements (ex: Wind)
Source: SRREN, IPCC, 2011
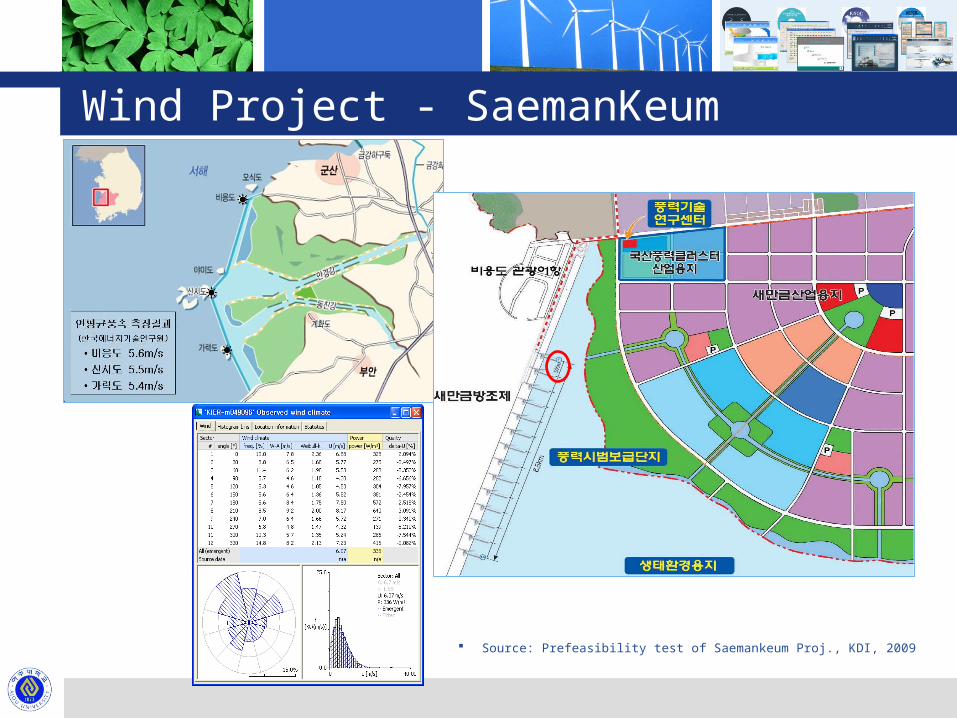
Wind Project - SaemanKeum
Source: Prefeasibility test of Saemankeum Proj., KDI, 2009
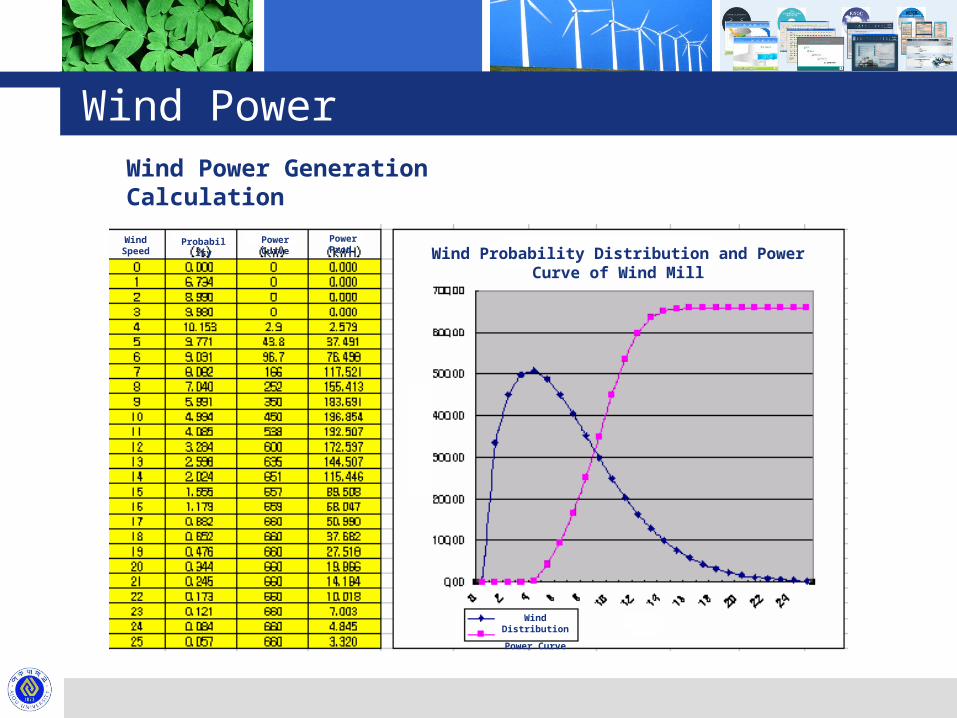
Wind PowerWind Power Generation Calculation
Power Prod.Wind Speed
Probability Power Curve
Wind Distribution
Power Curve
Wind Probability Distribution and Power Curve of Wind Mill
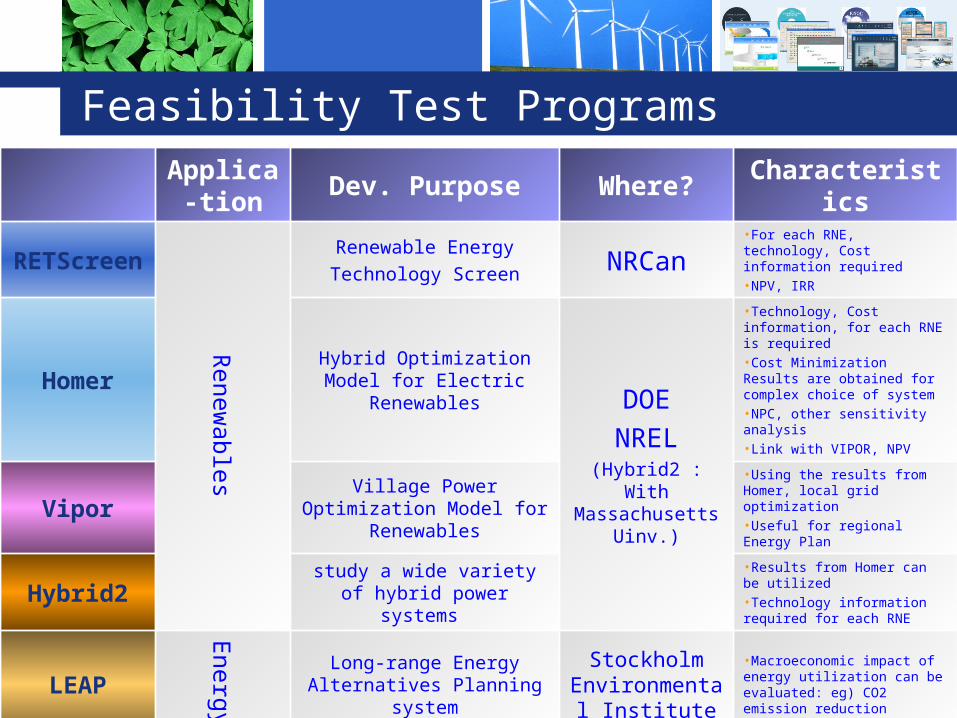
Feasibility Test ProgramsApplica
-tionDev. Purpose Where?
Characteristics
RETScreen
Renew
able
s
Renewable EnergyTechnology Screen NRCan
•For each RNE, technology, Cost information required•NPV, IRR
Homer Hybrid Optimization Model for Electric Renewables DOE
NREL(Hybrid2 : With Massachusetts
Uinv.)
•Technology, Cost information, for each RNE is required•Cost Minimization Results are obtained for complex choice of system•NPC, other sensitivity analysis•Link with VIPOR, NPV
ViporVillage Power
Optimization Model for Renewables
•Using the results from Homer, local grid optimization•Useful for regional Energy Plan
Hybrid2 study a wide variety of hybrid power systems
•Results from Homer can be utilized•Technology information required for each RNE
LEAP Energ
y in
G
enera
l
Long-range Energy Alternatives Planning
system
Stockholm Environmental
Institute
•Macroeconomic impact of energy utilization can be evaluated: eg) CO2 emission reduction
NEMS National Energy Modeling System DOE EIA
•National Energy Model for each energy source (Supply) and sectoral (Demand) impact analysis•Technology information, Cost, other future scenarios can be input for further impact analysis

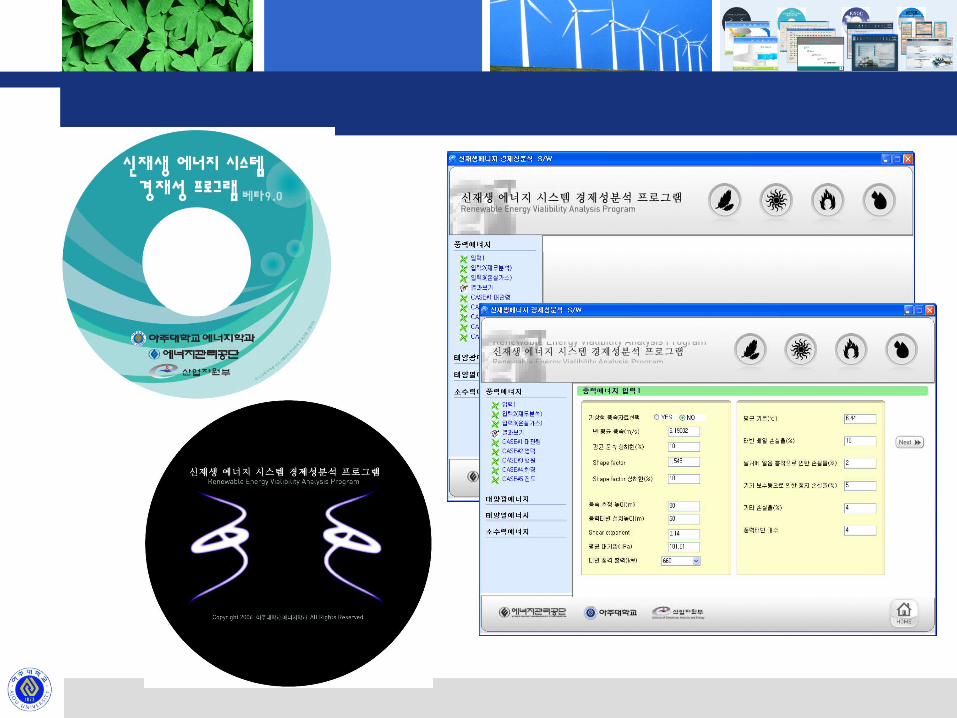
Wind (REVAP v0.9) & PV

Solar - REVAP v0.9
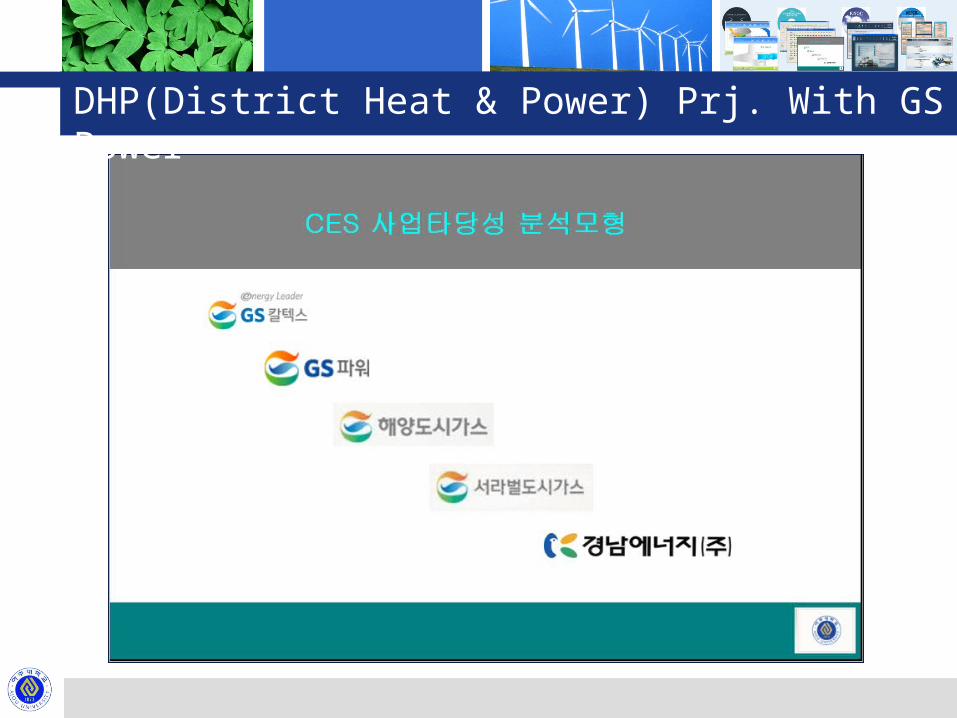
DHP(District Heat & Power) Prj. With GS Power
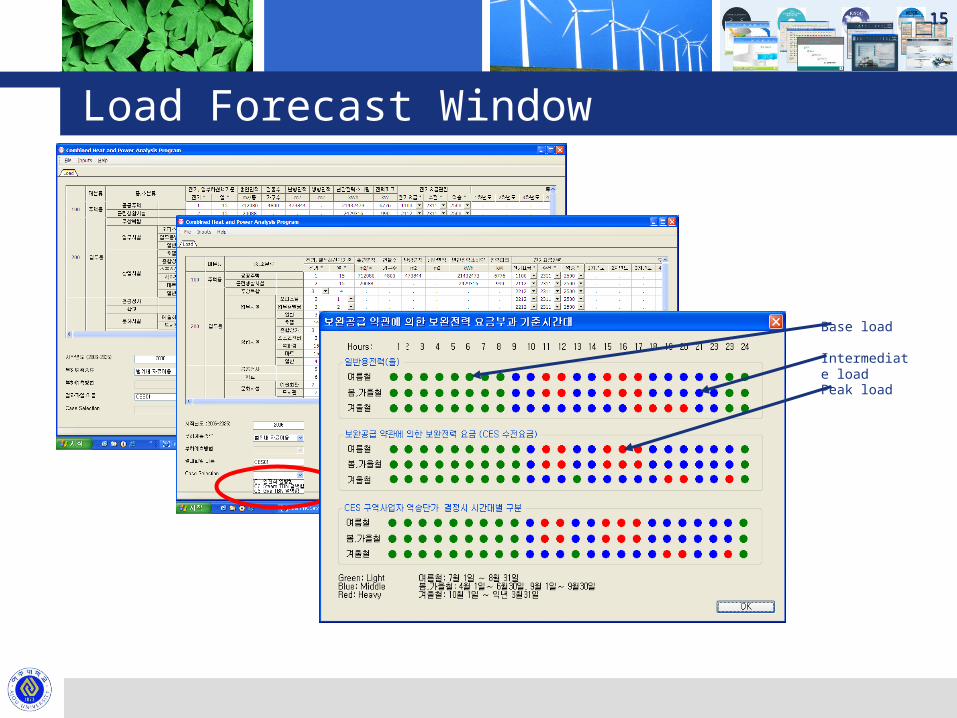
Load Forecast Window
1515
Base load
Intermediate loadPeak load

Financial Statement
1616
1717
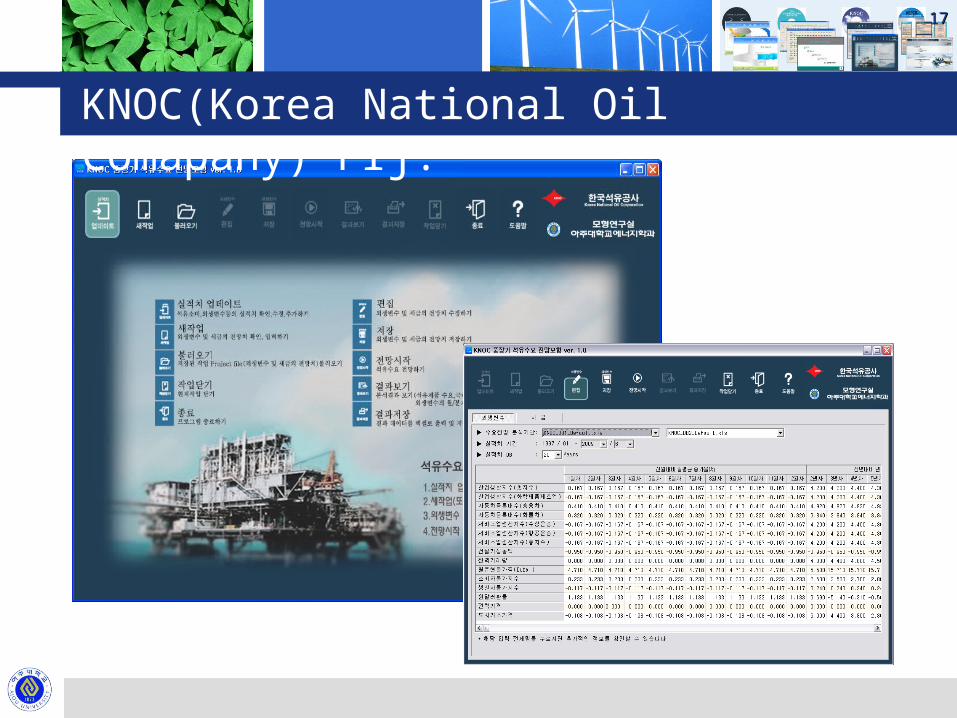
KNOC(Korea National Oil Comapany) Prj.
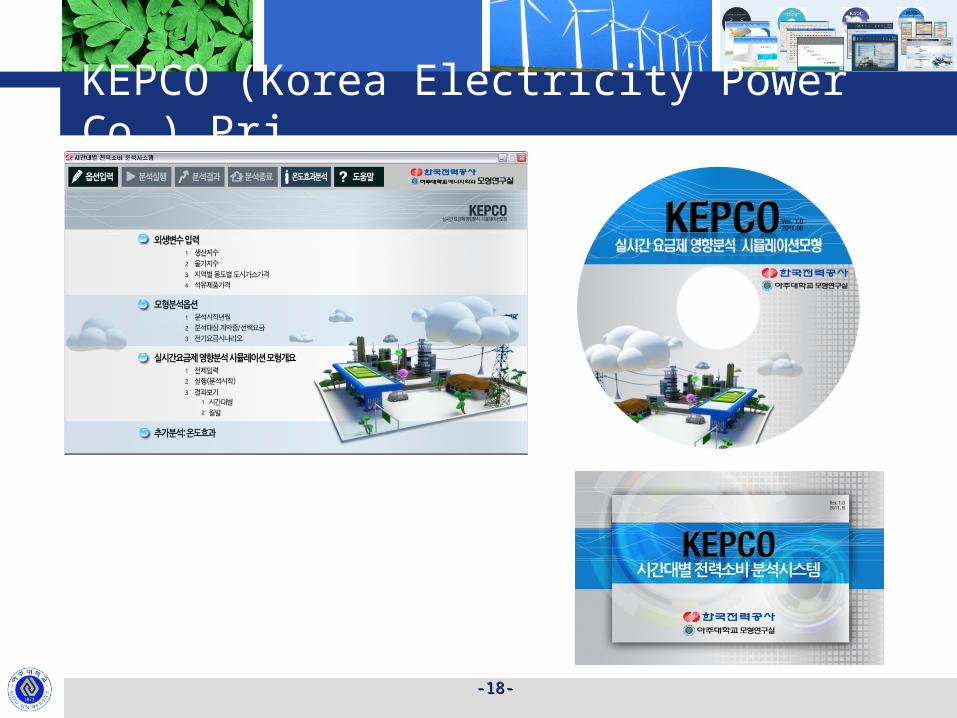
KEPCO (Korea Electricity Power Co.) Prj.
--1818--
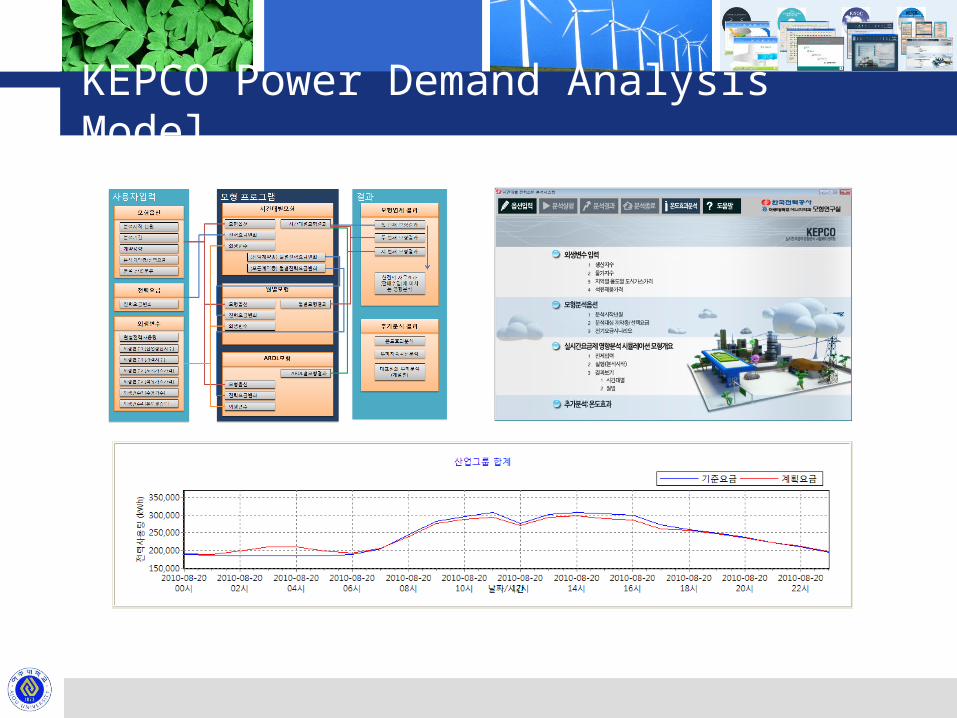
KEPCO Power Demand Analysis Model
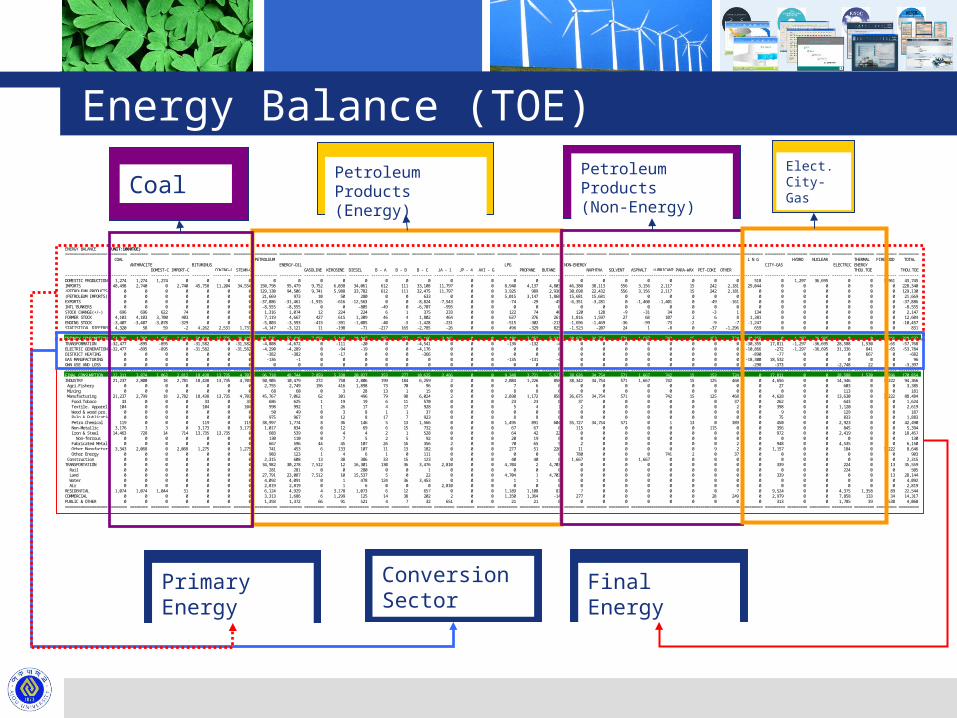
Energy Balance (TOE)
ENERGY BALANCE (UNIT:1000TOE)=========================== ======== ======== ======== ======== ======== ======== ========== ========== =================================== ======== ========================== ======== ===============================================================================================================================================================================
COAL PETROLEUM L N G HYDRO NUCLEAR THERMAL FI REWOOD TOTALANTHRACI TE BI TUMI NUS ENERGY-OI L LPG NON-ENERGY CI TY-GAS ELECTRI C ENERGY
DOMEST-C I MPORT-C COKI NG-C STEAM-C GASOLI NE KEROSENE DI ESEL B - A B - B B - C J A - 1 J P - 4 AVI - G PROPANE BUTANE NAPHTHA SOLVENT ASPHALT LUBRI CANTSPARA-WAX PET-COKE OTHER THOU. TOE THOU. TOE- - - - - - - - - - - - - - - - - - - - - - - - - - - - - - - - - - - - - - - - - - - - - - - - - - - - - - - - - - - - - - - - - - - - - - - - - - - - - - - - - - - - - - - - - - - - - - - - - - - - - - - - - - - - - - - - - - - - - - - - - - - - - - - - - - - - - - - - - - - - - - - - - - - - - - - - - - - - - - - - - - - - - - - - - - - - - - - - - - - - - - - - - - - - - - - - - - - - - - - - - - - - - - - - - - - - - - - - - - - - - - - - - - - - - - - - - - - - - - - - - - - - - - - - - - - - - - - - - - - - - - - - - - - - - - - - - - - - - - - - - - - - - - - - - - - - - - - - - - - - - - - - - - - - - - - - - - - - - - - - - - - - - - - - - - - - - - - - - - - - - - - - - - -DOMESTI C PRODUCTI ON 1, 274 1, 274 1, 274 0 0 0 0 0 0 0 0 0 0 0 0 0 0 0 0 0 0 0 0 0 0 0 0 0 0 518 0 1, 297 36, 695 0 0 3, 961 43, 745I MPORTS 48, 498 2, 740 0 2, 740 45, 758 11, 204 34, 554 150, 798 95, 479 9, 752 6, 038 34, 061 612 111 33, 108 11, 797 0 0 8, 940 4, 137 4, 803 46, 380 38, 113 556 3, 156 2, 117 15 242 2, 181 29, 044 0 0 0 0 0 0 228, 340(PETROLEUM PRODUCTS) 0 0 0 0 0 0 0 129, 130 94, 506 9, 741 5, 988 33, 782 612 111 32, 475 11, 797 0 0 3, 925 989 2, 936 30, 698 22, 432 556 3, 156 2, 117 15 242 2, 181 0 0 0 0 0 0 0 129, 130(PETROLEUM I MPORTS) 0 0 0 0 0 0 0 21, 669 973 10 50 280 0 0 633 0 0 0 5, 015 3, 147 1, 868 15, 681 15, 681 0 0 0 0 0 0 0 0 0 0 0 0 0 21, 669EXPORTS 0 0 0 0 0 0 0 -37, 886 -31, 461 -1, 915 -616 -12, 563 0 0 -8, 824 -7, 543 0 0 -74 -29 -45 -6, 351 -3, 281 0 -1, 460 -1, 401 0 -49 -161 0 0 0 0 0 0 0 -37, 886I NTL' BUNKERS 0 0 0 0 0 0 0 -8, 555 -8, 555 0 0 -805 -49 0 -6, 707 -995 0 0 0 0 0 0 0 0 0 0 0 0 0 0 0 0 0 0 0 0 -8, 555STOCK CHANGE(+/ - ) 696 696 622 74 0 0 0 1, 316 1, 074 12 224 224 6 1 375 233 0 0 122 74 48 120 128 -9 -31 34 0 -3 1 134 0 0 0 0 0 0 2, 147FORMER STOCK 4, 103 4, 103 3, 700 403 0 0 0 7, 119 4, 667 427 615 1, 309 46 4 1, 802 464 0 0 637 376 261 1, 816 1, 597 27 68 107 2 6 8 1, 381 0 0 0 0 0 0 12, 604ENDI NG STOCK -3, 407 -3, 407 -3, 078 -329 0 0 0 -5, 803 -3, 593 -415 -391 -1, 085 -40 -3 -1, 428 -231 0 0 -515 -302 -213 -1, 696 -1, 469 -36 -99 -73 -2 -9 -7 -1, 247 0 0 0 0 0 0 -10, 457STATI STI CAL DI FFERENCE4, 320 58 59 -2 4, 262 2, 531 1, 731 -4, 147 -3, 121 11 -198 -71 -217 165 -2, 785 -26 0 0 496 -329 825 -1, 523 -207 24 1 -8 0 -37 -1, 296 659 0 0 0 0 0 0 831- - - - - - - - - - - - - - - - - - - - - - - - - - - - - - - - - - - - - - - - - - - - - - - - - - - - - - - - - - - - - - - - - - - - - - - - - - - - - - - - - - - - - - - - - - - - - - - - - - - - - - - - - - - - - - - - - - - - - - - - - - - - - - - - - - - - - - - - - - - - - - - - - - - - - - - - - - - - - - - - - - - - - - - - - - - - - - - - - - - - - - - - - - - - - - - - - - - - - - - - - - - - - - - - - - - - - - - - - - - - - - - - - - - - - - - - - - - - - - - - - - - - - - - - - - - - - - - - - - - - - - - - - - - - - - - - - - - - - - - - - - - - - - - - - - - - - - - - - - - - - - - - - - - - - - - - - - - - - - - - - - - - - - - - - - - - - - - - - - - - - - - - - - -PRI MARY CONSUMPTI ON 54, 788 4, 768 1, 956 2, 812 50, 020 13, 735 36, 285 101, 526 53, 416 7, 859 5, 448 20, 847 353 277 15, 166 3, 466 0 0 9, 484 3, 853 5, 631 38, 626 34, 754 571 1, 667 742 15 153 724 30, 355 0 1, 297 36, 695 0 0 3, 961 228, 622TRANSFORMATI ON -32, 477 -895 -895 0 -31, 582 0 -31, 582 -4, 808 -4, 672 0 -111 -20 0 0 -4, 541 0 0 0 -136 -132 -4 0 0 0 0 0 0 0 0 -30, 355 17, 811 -1, 297 -36, 695 28, 588 1, 530 -65 -57, 768ELECTRI C GENERATI ON -32, 477 -895 -895 0 -31, 582 0 -31, 582 -4, 290 -4, 289 0 -94 -19 0 0 -4, 176 0 0 0 0 0 0 0 0 0 0 0 0 0 0 -10, 866 -272 -1, 297 -36, 695 31, 336 841 -65 -53, 784DI STRI CT HEATI NG 0 0 0 0 0 0 0 -382 -382 0 -17 0 0 0 -366 0 0 0 0 0 0 0 0 0 0 0 0 0 0 -890 -77 0 0 0 667 0 -682GAS MANUFACTURI NG 0 0 0 0 0 0 0 -136 -1 0 0 0 0 0 0 0 0 0 -135 -131 -4 0 0 0 0 0 0 0 0 -18, 300 18, 532 0 0 0 0 0 96OWN USE AND LOSS 0 0 0 0 0 0 0 0 0 0 0 0 0 0 0 0 0 0 0 0 0 0 0 0 0 0 0 0 0 -298 -373 0 0 -2, 748 22 0 -3, 397- - - - - - - - - - - - - - - - - - - - - - - - - - - - - - - - - - - - - - - - - - - - - - - - - - - - - - - - - - - - - - - - - - - - - - - - - - - - - - - - - - - - - - - - - - - - - - - - - - - - - - - - - - - - - - - - - - - - - - - - - - - - - - - - - - - - - - - - - - - - - - - - - - - - - - - - - - - - - - - - - - - - - - - - - - - - - - - - - - - - - - - - - - - - - - - - - - - - - - - - - - - - - - - - - - - - - - - - - - - - - - - - - - - - - - - - - - - - - - - - - - - - - - - - - - - - - - - - - - - - - - - - - - - - - - - - - - - - - - - - - - - - - - - - - - - - - - - - - - - - - - - - - - - - - - - - - - - - - - - - - - - - - - - - - - - - - - - - - - - - - - - - - - -FI NAL CONSUMPTI ON 22, 311 3, 874 1, 062 2, 812 18, 438 13, 735 4, 703 96, 718 48, 744 7, 859 5, 338 20, 827 353 277 10, 625 3, 466 0 0 9, 348 3, 721 5, 627 38, 626 34, 754 571 1, 667 742 15 153 724 0 17, 811 0 0 28, 588 1, 530 3, 896 170, 854I NDUSTRY 21, 237 2, 800 18 2, 781 18, 438 13, 735 4, 703 50, 905 10, 479 272 758 2, 806 199 184 6, 259 2 0 0 2, 084 1, 226 858 38, 342 34, 754 571 1, 667 742 15 125 468 0 4, 656 0 0 14, 346 0 3, 222 94, 366 Agri . Fi shery 0 0 0 0 0 0 0 2, 755 2, 749 196 416 1, 898 73 70 96 0 0 0 7 6 0 0 0 0 0 0 0 0 0 0 27 0 0 603 0 0 3, 385 Mi ni ng 0 0 0 0 0 0 0 68 60 0 3 28 13 1 15 0 0 0 8 8 0 0 0 0 0 0 0 0 0 0 0 0 0 113 0 0 181 Manufacturi ng 21, 237 2, 799 18 2, 782 18, 438 13, 735 4, 703 45, 767 7, 062 62 301 496 79 98 6, 024 2 0 0 2, 030 1, 172 858 36, 675 34, 754 571 0 742 15 125 468 0 4, 628 0 0 13, 630 0 3, 222 88, 484 Food. Tobaco 33 0 0 0 33 0 33 686 625 1 19 19 6 11 570 0 0 0 23 23 0 37 0 0 0 0 0 0 37 0 262 0 0 643 0 0 1, 624 Texti l e. Apparel 104 0 0 0 104 0 104 998 992 1 26 17 4 17 928 0 0 0 5 4 1 2 0 0 0 0 0 0 2 0 398 0 0 1, 120 0 0 2, 619 Wood & wood pro. 0 0 0 0 0 0 0 50 49 0 3 8 1 1 37 0 0 0 0 0 0 0 0 0 0 0 0 0 0 0 9 0 0 129 0 0 187 Pul p & Publ i cati ons 0 0 0 0 0 0 0 975 967 0 12 8 17 7 923 0 0 0 8 8 0 0 0 0 0 0 0 0 0 0 75 0 0 833 0 0 1, 883 Petro. Chemi cal 119 0 0 0 119 0 119 38, 997 1, 774 8 36 146 5 13 1, 566 0 0 0 1, 495 891 604 35, 727 34, 754 571 0 1 13 0 389 0 450 0 0 2, 923 0 0 42, 490 Non-Metal l i c 3, 176 3 3 0 3, 173 0 3, 173 1, 017 834 0 12 69 6 15 732 0 0 0 67 67 0 115 0 0 0 0 0 115 0 0 356 0 0 845 0 0 5, 394 I ron & Steel 14, 463 728 14 714 13, 735 13, 735 0 603 539 0 4 4 2 1 528 0 0 0 64 42 22 0 0 0 0 0 0 0 0 0 972 0 0 2, 419 0 0 18, 457 Non- ferrous 0 0 0 0 0 0 0 130 110 0 7 5 2 5 92 0 0 0 20 19 0 0 0 0 0 0 0 0 0 0 0 0 0 0 0 0 130 Fabri cated Metal 0 0 0 0 0 0 0 667 596 44 45 107 26 16 356 2 0 0 70 65 5 2 0 0 0 0 0 0 2 0 948 0 0 4, 535 0 0 6, 150 Other Manufacturi ng3, 343 2, 068 0 2, 068 1, 275 0 1, 275 741 453 6 133 107 11 13 182 0 0 0 277 51 226 11 0 0 0 0 0 9 2 0 1, 157 0 0 184 0 3, 222 8, 646 Other Energy 0 0 0 0 0 0 0 903 123 1 4 6 1 0 111 0 0 0 0 0 0 780 0 0 0 741 2 0 37 0 0 0 0 0 0 0 903 Constructi on 0 0 0 0 0 0 0 2, 315 608 13 38 386 33 15 123 0 0 0 40 40 0 1, 667 0 0 1, 667 0 0 0 0 0 0 0 0 0 0 0 2, 315TRANSPORTATI ON 0 0 0 0 0 0 0 34, 982 30, 278 7, 512 12 16, 301 130 36 3, 476 2, 810 0 0 4, 704 2 4, 703 0 0 0 0 0 0 0 0 0 339 0 0 224 0 13 35, 559 Rai l 0 0 0 0 0 0 0 281 281 0 0 280 0 0 1 0 0 0 0 0 0 0 0 0 0 0 0 0 0 0 0 0 0 224 0 0 505 Land 0 0 0 0 0 0 0 27, 791 23, 087 7, 512 10 15, 537 5 0 22 0 0 0 4, 704 1 4, 703 0 0 0 0 0 0 0 0 0 339 0 0 0 0 13 28, 144 Water 0 0 0 0 0 0 0 4, 092 4, 091 0 1 478 124 36 3, 453 0 0 0 1 1 0 0 0 0 0 0 0 0 0 0 0 0 0 0 0 0 4, 092 Ai r 0 0 0 0 0 0 0 2, 819 2, 819 0 1 6 0 0 0 2, 810 0 0 0 0 0 0 0 0 0 0 0 0 0 0 0 0 0 0 0 0 2, 819RESI DENTI AL 1, 074 1, 074 1, 044 31 0 0 0 6, 124 4, 929 4 3, 178 1, 073 6 12 657 0 0 0 1, 189 1, 108 81 7 0 0 0 0 0 0 7 0 9, 524 0 0 4, 375 1, 358 89 22, 544COMMERCI AL 0 0 0 0 0 0 0 3, 313 1, 686 6 1, 299 125 14 38 202 2 0 0 1, 350 1, 364 -14 277 0 0 0 0 0 28 249 0 2, 979 0 0 7, 858 133 34 14, 317PUBLI C & OTHER 0 0 0 0 0 0 0 1, 393 1, 372 66 91 521 4 7 32 651 0 0 21 21 0 0 0 0 0 0 0 0 0 0 313 0 0 1, 785 39 538 4, 068=========================== ======== ======== ======== ======== ======== ======== ========== ========== =================================== ======== ========================== ======== ===============================================================================================================================================================================
Primary Energy
Conversion Sector
Final Energy
Petroleum Products (Energy)
Petroleum Products (Non-Energy)
CoalElect.City-Gas

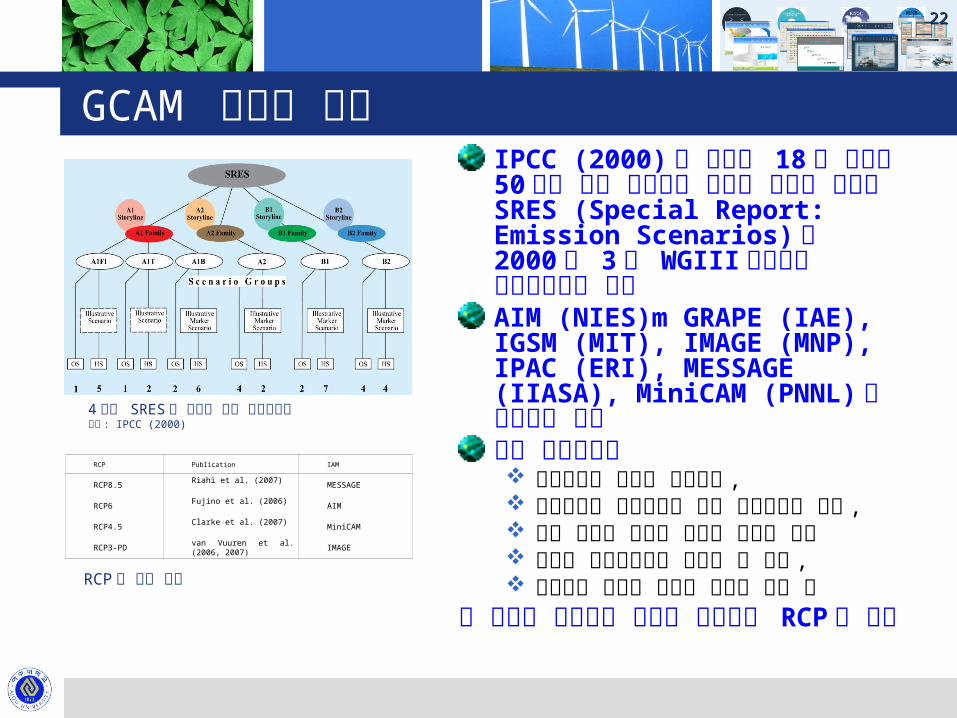
GCAM 모형의 장점IPCC (2000) 에 의하면 18 개 국가의 50 명이 넘는 저자들로 구성된 팀으로 작성한 SRES (Special Report: Emission Scenarios) 를 2000 년 3 월 WGIII 회의에서 채택하였다고 보고AIM (NIES)m GRAPE (IAE), IGSM (MIT), IMAGE (MNP), IPAC (ERI), MESSAGE (IIASA), MiniCAM (PNNL) 의 후보모형 선택이들 후보군에서 일관성있는 자료를 제공하고 , 연구결과가 심사과정을 거쳐
게재되어야 하고 , 관련 연구에 참여할 의사가 있어야 하며 모형이 데이터요구를 충족할 수 있고 , 모형팀이 충분한 경험이 있어야 하는 등
의 조건을 충족하는 다음의 모형들과 RCP 가 선정
2222
RCP Publication IAM
RCP8.5
RCP6
RCP4.5
RCP3-PD
Riahi et al. (2007)
Fujino et al. (2006)
Clarke et al. (2007)
van Vuuren et al. (2006, 2007)
MESSAGE
AIM
MiniCAM
IMAGE
4 가지 SRES 의 특징과 관련 시나리오들출처 : IPCC (2000)
RCP 와 관련 모형
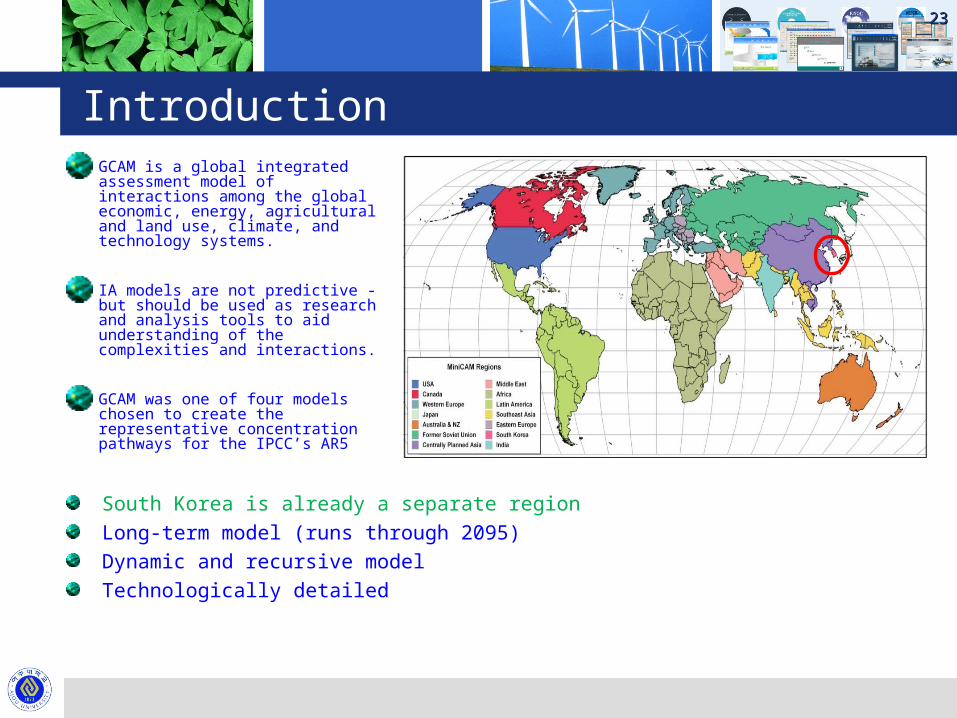
IntroductionGCAM is a global integrated assessment model of interactions among the global economic, energy, agricultural and land use, climate, and technology systems.
IA models are not predictive - but should be used as research and analysis tools to aid understanding of the complexities and interactions.
GCAM was one of four models chosen to create the representative concentration pathways for the IPCC’s AR5
South Korea is already a separate regionLong-term model (runs through 2095)Dynamic and recursive modelTechnologically detailed
2323

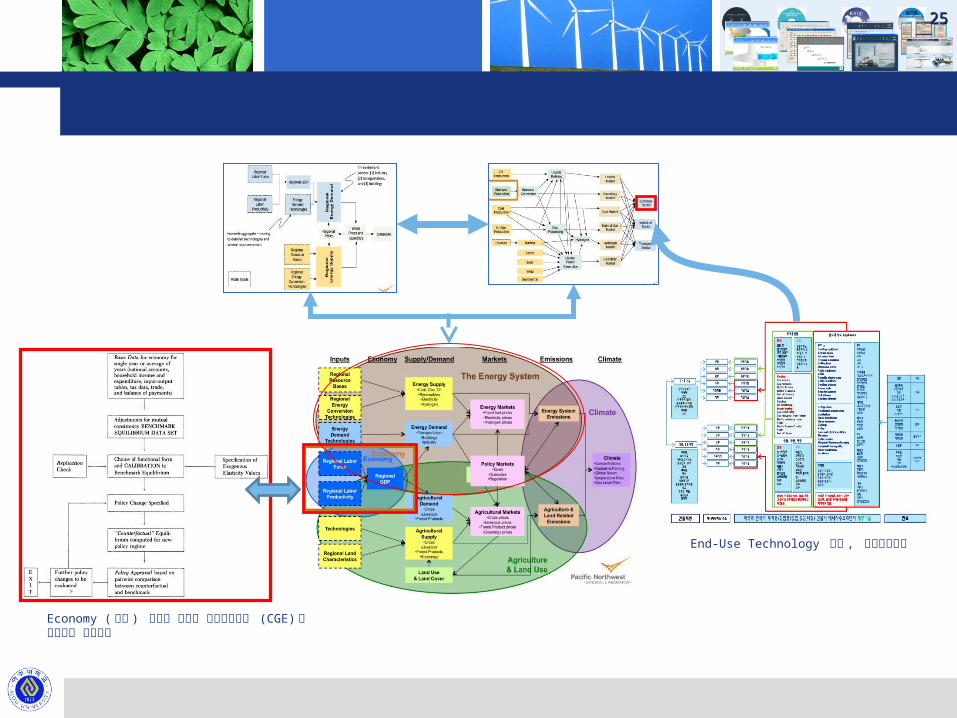
GCAM(PNNL)에너지 시스템 , 농업 & 토지이용 , 기후 , 경제 부문이 연결되어 있음에너지와 농업 & 토지이용의 공급측면에 있어 여러 기술의 적용이 가능전력 부문에 있어 화석연료 이외에 원자력 , 수력 , 태양에너지 , 풍력 , 지열을 포함하고 각각의 원별 시장에서 건물 , 산업 , 수송 부문으로의 투입구조Energy Demand is determined by the GDP and the energy demand technologiesEnergy Supply is determined by the Resource Bases and Energy Conversion TechnologiesThe flow of energy from supply side (primary and secondary fuels) and end- use sectors (buildings, industrial, transportation)
2424
자료 : Calvin K., 2010
2525
End-Use Technology 감안 , 기존모형개선
Economy ( 경제 ) 부문의 모형을 일반균형모형 (CGE) 와 연계하는 로직개발
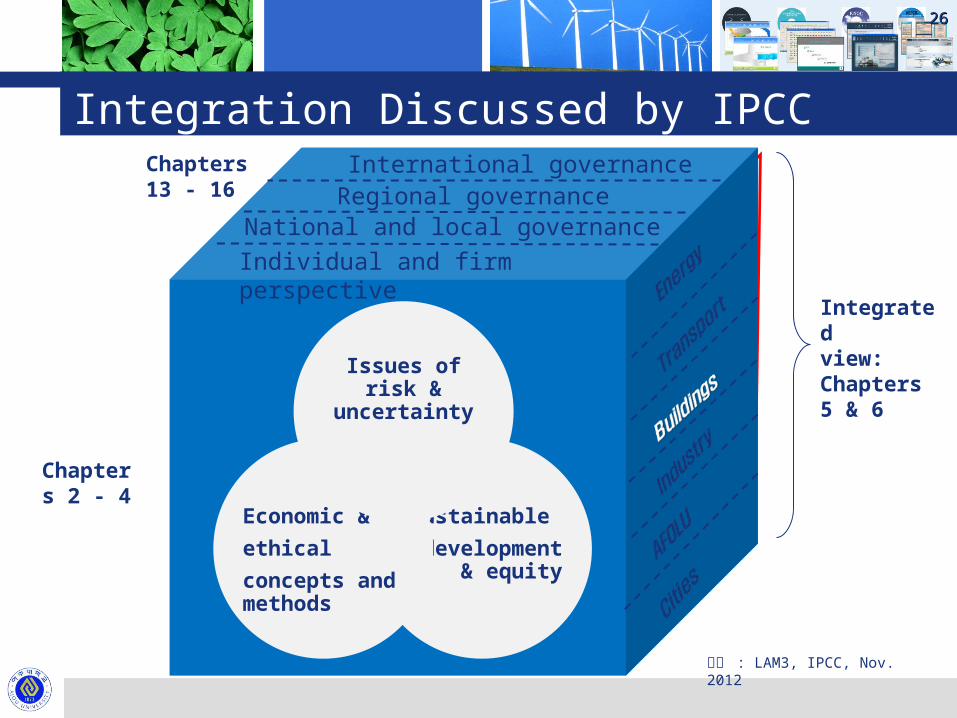
Integration Discussed by IPCC
2626
International governance
Individual and firm perspectiveNational and local governance
Regional governance
Sustainable
development & equity
Economic &
ethical
concepts and methods
Issues of risk &
uncertainty
Integrated view:Chapters5 & 6
Chapters 13 - 16
Chapters 2 - 4
출처 : LAM3, IPCC, Nov. 2012
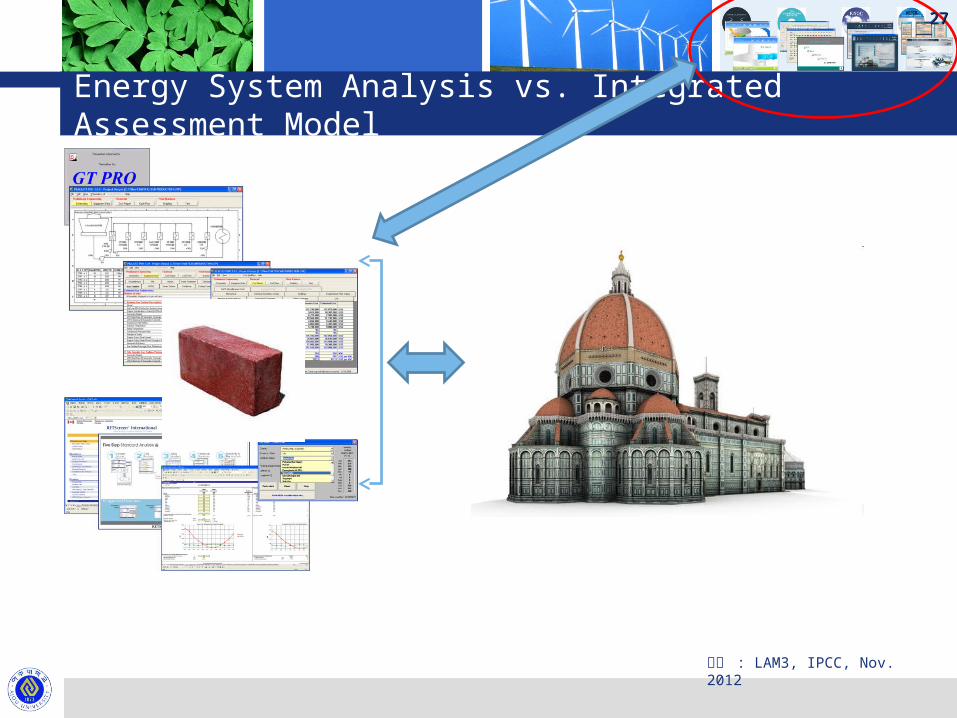
Energy System Analysis vs. Integrated Assessment Model
출처 : LAM3, IPCC, Nov. 2012
2727