Quaterly Report 4 T 2015
38
Q4 2015|
-
Upload
mag-market-intelligence -
Category
Documents
-
view
214 -
download
0
description
By Dukascopy Bank
Transcript of Quaterly Report 4 T 2015

Q4 2015|
Q4 2015| 2
The global economy gives no reasons for celebration. It seems the situation is even worse than three months ago,
when we thought we had hit the rock bottom. Alas, further deterioration is only becoming increasingly likely.
Looking back at our previous quarterly report, the world was mostly concerned with China because of the devastating
quake in the country’s equity market. As a result, the Chinese government was forced to roll back some of the reforms
that were aimed at opening and integrating the economy. At that time Greece also occupied a large portion of the
headlines, but do not mistake current tranquillity for absence of grounds for concern; it will surely come back to bite
us, as the problem was not resolved for good. The talks between creditors and Greece only postponed a decision
bound to be painful in any scenario, whichever path will be chosen in the end.
With the latest events these topics are receding into the background, but this is hardly good news, considering that
reasons to be pessimistic only keep piling up. The latest readings on the US labour market turned out to be a big
negative surprise. It remains to be seen whether the indicator will rebound, but whatever the case this shows a
significant weakness in the US economy. We no longer guess in which month the Fed is going to hike the rate, but
rather in which year.
The other regions fail to generate optimism as well. Whatever rhetoric there was in the past, the Bank of England is
nowhere near monetary policy normalisation. The real United Kingdom economy is hardly improving, which is an
evidence of low transmission mechanism effectiveness, and such a malaise is nowadays common among the developed
countries. The banks are criticised for focusing too much on the asset prices rather than on the real economy, which in
turn is on the verge of a new wave of crisis, as we see a massive exodus of funds from the emerging markets, currently
the only bright spot on the globe.
At the same time, the ECB and BOJ are barely holding off from further stimulus, seeing that their previous attempts are
not yielding tangible results. Perhaps it is high time officials do something about this, before the disease of barely
positive inflation and subdued growth becomes chronic; however, the bankers’ toolbox appears to be empty. Flight to
quality is thus set to persist, and arguments in favour of recovery are unlikely to appear any time soon.
Trade thoughtfully and take care,
Dukascopy Research Team

Q4 2015| 3
Table of Contents
page 4
Fundamental
Analysis
page 10
Technical
Analysis
page 26
Trade Pattern
Ideas
page 31
Aggregate
Technical
Indicator
page 19
Expert
Commentary
page 8
Community
Forecasts

Q4 2015| 4
Fundamental Analysis

Q4 2015| 5
The third quarter of 2015 was marked by a number of events which triggered a rattle and turbulence in economies and
financial markets worldwide. China’s economic slowdown, global market rout and breathless expectation of Fed’s
decision on its interest rates were engrossing minds of economists and analysts minds.
China has been feeling sharply the ill winds of “hard landing”, triggering an increasing panic
around the world. In order to stabilize the economy and stop it on the way to an inevitable
abyss of downturn, Beijing stepped up big-bang stimulus. The PBoC injected billions of yuan into China's economy and
cut the interest rates several times. The moves were aimed at supporting slowing economic growth in the world's
second biggest economy at a time of extreme volatility in Chinese as well as global stock markets. Nevertheless,
markets were little influenced by the central bank's action.
The Fed maintained the interest rates unchanged at its crucial September meeting in light of
worries about the global economy, financial markets turbulence and tepid domestic inflation. Yet, the US central bank
left the door open for a modest policy tightening later this year. Even though the Fed's post-meeting statement said
Jeffrey Lacker, the hawkish President of the Federal Reserve Bank of Richmond, insisted on increasing the Fed's target
range on overnight rates, the overall tone of the statement was dovish. Moreover, for the first time ever, one
monetary policymaker, Minneapolis Federal Reserve Bank President Narayana Kocherlakota, thought the US needed to
move to negative interest rates until at least the end of 2016 to achieve full employment and get inflation back to 2%.
Janet Yellen, Fed Chairwoman, did not rule out the possibility of negative interest rates in the event that the Federal
Reserve needs to deploy additional accommodation.
As the year is coming to the end, the Fed has two more policy meetings in October and December. Four Fed
policymakers now say rates should not be raised until at least 2016, compared to two who felt that way in June. Given
the US central bank’s caution and concerns, it implies that the Fed may raise the Fed Funds rate even more slowly than
has been priced in so far.
USA
China
The Perfect Storm
In light of the heightened uncertainty abroad ... the committee judged it appropriate to wait.
- Janet Yellen, Fed Chairwoman

Q4 2015| 6
During the last conference of the third quarter, ECB President Mario Draghi said
that renewed downside risks have emerged to the growth and inflation outlook
recently. Therefore, Draghi dropped a clear hint that the central bank could expand its QE programme, given the new
downside risks, and pointing out that the asset-purchase programme is flexible, and the ECB could change the size,
composition and duration of the programme. The central bank downgraded its growth outlook to 1.4% in 2015 from
1.5%, while the inflation was expected to slide to negative territory in the months ahead; still, the move would be due
to lower oil and commodity prices rather than full-blown deflation.
The Bank of England maintains its interest rates on hold, even though the
Governor Mark Carney hinted that the central bank might raise rates “at the turn of the year”. September's MPC
minutes continued to sound more dovish as downside risks to global economic activity and the inflation outlook have
increased since the August Inflation Report. The BoE also stuck to its view that consumer prices will start to pick up
around the turn of the year, though it noted that a drop in oil prices had increased uncertainty about the near-term
outlook. Minutes also showed that there was considerable scepticism about how the strength of the Sterling would
feed through to the UK inflation. However, the central bank retained its positive outlook on the UK economy's
prospects, despite the concerns over China and the global economic growth.
Reserve Bank of Australia Governor Glenn Stevens delivered another optimistic
assessment of the Australian economy, highlighting it could weather a serious China slowdown. Stevens' statement
appeared to lower the chances of the central bank cutting the official cash rate further from its current all-time low of
2%. Moreover, the central bank's Governor even said that a hard landing for the world's second largest economy,
where annual growth would decline below 7%, may not be enough to trigger another rate cut. Australia slashed rates
twice this year to a record-low 2% to underpin investment and consumption as economic growth remains below its
long-term average of more than 3%. Stevens reiterated his view that the lower Australian Dollar is having a bigger
effect on the nation's economy now. Nevertheless, growth remains slower than hoped for.
Euro zone
Great Britain
Australia
The Australian economy is growing well despite the biggest fall in our terms of trade in more than fifty years.
- Treasurer Joe Hockey

Q4 2015| 7
The Reserve Bank of New Zealand was the only bank that acted in the
third quarter, slashing interest rates for the third time this year to
cushion the nation's economy amid weak dairy prices and softness in construction. The reduction in the benchmark
rate to 2.75% was widely anticipated and came as no surprise. The central bank raised the official cash rate four times
in 2014, encouraged by increasing Asian demand for its dairy products, a booming housing market in Auckland, New
Zealand's largest city, and the need for post-earthquake reconstruction in Christchurch. However, New Zealand's
economy started to slow, inflation eased and dairy prices tumbled. Inflation is currently running at 0.4%, well below
the RBNZ's target of 1% to 3% while dairy prices are now around 60% below compared with where they were in early
2014. Business and consumer sentiment has plunged and growth is slowing.
Moreover, the RBNZ's forecasts suggest at least one more rate cut in the coming months. However, it also opened the
door to much steeper rate cuts in case global economic conditions weaken further or if El Niño weather conditions
have a significant negative impact. RBNZ governor Graeme Wheeler noted that the domestic economy was growing at
an annual rate of 2%, compared with 2.5% when the bank last cut rates.
New Zealand
Domestically, the economy is adjusting to the sharp decline in export prices, and the consequent fall in the exchange rate.
- Reserve Bank of New Zealand

Q4 2015| 8
Community Forecasts

Q4 2015| 9
During the previous three months of 2015, the most traded currency pair traded in a highly volatile and mixed
environment. In July and August the Euro experienced a constant decrease in value being generally affected by
continuing negotiations over the Greece debt crisis and positive economic data from the US region. However, a turning
point took place in the last week of August, when the pair managed to test the 1.17 mark, after the American stock
market opened lower with the Dow Jones Industrial Average tumbling around 1100 points. Then the pair resumed to
gain in value as investors switched their attention to the upcoming Federal Reserve policy meeting and strengthened
even more, since the US central bank left short-term interest rates unchanged.
Dukascopy Community members equally divided in their estimates, while the consensus forecast for December 31 is
located just around 1.119 mark, meaning the pair still will show a moderate decline. The bullish trader sharpsense
thinks, that no US rate hike this year will weaken the Dollar while better-than-expected Euro data announcement, in
turn, could strengthen the single European currency. However, another trader, Cutseiya does not expect any
fundamental factor which may push the pair higher than 1.1700 level.
cutseiya
“I do not expect any
fundamental factor which
may push the pair higher “
sharpsense
“I suppose better-than-expected Euro data announcement could strengthen the single European
currency”
EUR/USD

Q4 2015| 10
Technical Analysis

Q4 2015| 11
EUR/USD
2015 Q3 Summary
The single European currency continued to build the upward-sloping channel pattern against the US Dollar in course of
the third quarter of this year. The period began just above the 1.10 mark, when bears were controlling the market and
pushing the price downwards. They succeeded in reaching the 1.08 level, where they met the lower trend-line of the
pattern in the middle of July. However, the subsequent active phase of recovery started only in the beginning of August
after one failed attempt to do so in the second part of July. Turmoil in world markets made the Euro an actual safe-
haven currency by the third decade of the summer’s last month. The quarter’s high was hit on August 24 at the 1.1717
mark, which almost corresponded with the bullish channel’s upper boundary. The remaining part of the period was
predominantly spent inside the triangle pattern and the pair consolidated at around 1.1150 by September 30, meaning
that active development is likely to follow in Q4.
2015 Q4 Outlook
From the perspective of technical analysis, the outlook for the EUR/USD currency pair is quite bullish for the last
quarter of 2015. At first, the pair is currently nearing the lower trend-line of the channel up pattern, which should
provide sufficient support for long traders. In addition to that, October should be marked by an important event as 100
and 200-day SMAs are going to cross each other. It usually implies an improving sentiment among market participants,
which should encourage purchases of the Euro. Inside the boundaries of the present pattern, the target level for bulls is
1.20 for the end of November. However, the current year’s high at 1.1717 should be watched closely as it creates
downside risks for the 19-nation currency and may derail the recovery.
100-day SMA 200-day SMA
Daily Chart

Q4 2015| 12
2015 Q3 Summary
Contrary to the EUR/USD currency pair, which was steadily moving upwards during the previous quarter, the Cable
came under uplifted selling pressure in three months through September 30. Some signs of the Pound’s weakness were
already observed at the end of June, when the cross finished the second quarter at the relatively high level of 1.56.
However, a sell-off failed to be stopped until 1.5330, where the support was found by the second decade of July. In the
next two months the GBP/USD cross attempted to get back on track. However, the bullish momentum was exhausted
by the time the price advanced up to the 1.58 mark. Additional strong downtrend took place at the end of August,
partly amid the global equity market rout, which to some extent was transferred to the foreign exchange market. The
following revival of the British currency was again capped in September by the 1.5650 mark, which resulted in a five-
figure drop by September-end and the quarter was finished just above 1.51.
2015 Q4 Outlook
Considering the current location of the pair, namely, just above the upper edge of the bearish pattern, we can expect a
revival to take place in the nearest future. However, the long-term picture remains quite mixed, noting difficulty of
predicting the pair’s behaviour from the previous quarter. The pattern suggests the Sterling will fail around 1.55, in case
the near-term rebound happens. This event should expose the 1.50 psychological mark, which is only guarded by this
year’s low at 1.4564. However, the 100-day SMA managed to violate the 200-day SMA in August and therefore raised
positive expectations about the pair’s future. At the same time, we still prefer an overall lead of bears and do not see
GBP/USD going noticeably to the north in the three months through December 31.
100-day SMA 200-day SMA
GBP/USD Daily Chart

Q4 2015| 13
2015 Q3 Summary
Taking into account the mixed picture created by Japanese fundamentals, the USD/JPY currency pair seems to have
behaved in the most unpredicted way during the previous three months. The US Dollar failed to extend rally beyond
this year’s high set back in June at the 125.85 mark, even though there were successful attempts to increase the value
of the pair. Bulls were dominating the market throughout the first part of the third quarter when they returned USD/
JPY back above 125. However, global fears concerning economic growth in China has led to a major sell-off in the equity
markets worldwide. It has significantly pushed up demand for safe-haven currencies including the Yen, which spiked
from 123.50 to 116 against the Greenback in just two trading days of Aug 21 and Aug 24. In September the pair
stabilised and decided to trade sideways by showing only minor changes around the 120 level, where it also closed the
reported three-month period.
2015 Q4 Outlook
It seems that a great deal of uncertainty is driving the foreign exchange market at the moment and particularly the
USD/JPY currency pair. On top of that, markets are unsure about the timing of the Fed policy tightening cycle and
possibility of additional stimulus from the Bank of Japan. Both events, if they happen, are going to have an overall
positive effect on the Dollar and will be bearish with respect to the Yen. In the short-term, the pair is highly likely to
continue hovering in the horizontal trend between 121.50 and 118.50. We may expect some more active movements
to take place by the end of October. Bulls are required to show they are capable of rising above the 200-day SMA
(120.87) in order to affirm their positive intentions. However, downside risks will be on the table, as long as USD/JPY
does not consolidate above the major 125 area.
100-day SMA 200-day SMA
USD/JPY Daily Chart

Q4 2015| 14
2015 Q3 Summary
Gold continued to trade between two downward-sloping boundaries during the July-September quarter of this year. In
line with our fairly pessimistic quarterly expectations, the yellow metal was unable to limit losses after the second
quarter ended and the down-trend was the only possible way to develop further. The steepest depreciation was seen
in July, when the bullion allowed its losses to be extended as low as 1,071. On the way down the metal managed to
erode the most important support represented by the 2014 low at 1,131. The following development of the price was
clearly driven by the 100-day SMA, which reached 1,145 by the end of September. There were two attempts to recover
in August and the second part of September, but both of them were rejected by the moving average. As a result of
that, the period’s end was marked by another start of the bearish tendency, which sent XAU/USD below the 2014 low
to close the quarter at 1,125.
2015 Q4 Outlook
Bears are highly likely to get back market control again in the fourth quarter of this year. A stable consolidation below
the 2014 low will put at risk any perspectives of a recovery in the next three months. The only substantial support is
placed at the current 2015 low of 1,071. In case this level is penetrated, then bears will start targeting the area below
1,050 and the bullion may allow for a drop down to 1,020 by the end of this calendar year, where the price will touch
the pattern’s lower trend-line. As for additional bearish factors, both 100 and 200-day SMAs are quickly headings to the
south and they are going to support short market participants in course of October-December. Thus, our outlook
remains largely pessimistic, and only a spike above 1,178 (200-day SMA) can refocus attention back to the upside.
100-day SMA 200-day SMA
XAU/USD Daily Chart

Q4 2015| 15
EUR/JPY Daily Chart
100-day SMA 200-day SMA
2015 Q3 Summary
The third quarter began with the European currency attempting to appreciate against the Japanese Yen, but the bullish
momentum was lost in August when the pair reached the 139.00 major level. Later on a trend-line was formed, which
kept limiting the EUR/JPY from climbing too high, forcing the trade to remain within the borders of 133.00 and 137.00
levels. Little attention was paid to the SMAs, with the 200-day one providing some resistance on some occasions.
2015 Q4 Outlook
The third quarter changed the perspective for the Euro from bullish to bearish, since the target levels were not reached
during that period. The newly-formed trend-line is providing resistance and should keep the EUR/JPY cross at bay for
the first month of the quarter; the monthly technical studies are supporting this view. However, the pair is expected to
rebound from the 133.00 major level, as it kept the single currency afloat for five months in a row. With the pair
forming a descending triangle pattern, a rebound would not be a surprise, followed by a breach of the down-trend.
Although the apex of the triangle rests near the Q4 end, attempts to break out could be made in November, setting the
first target of the previous quarter’s high, namely the 139.00 psychological area. Nevertheless, we should not rule out
the possibility of the down-trend providing sufficient resistance for the support at 133.00 to be pierced, causing the
European currency to begin making its way towards the July 2009 low at 127.00.
Q4 2015| 16
Daily Chart AUD/USD
100-day SMA 200-day SMA
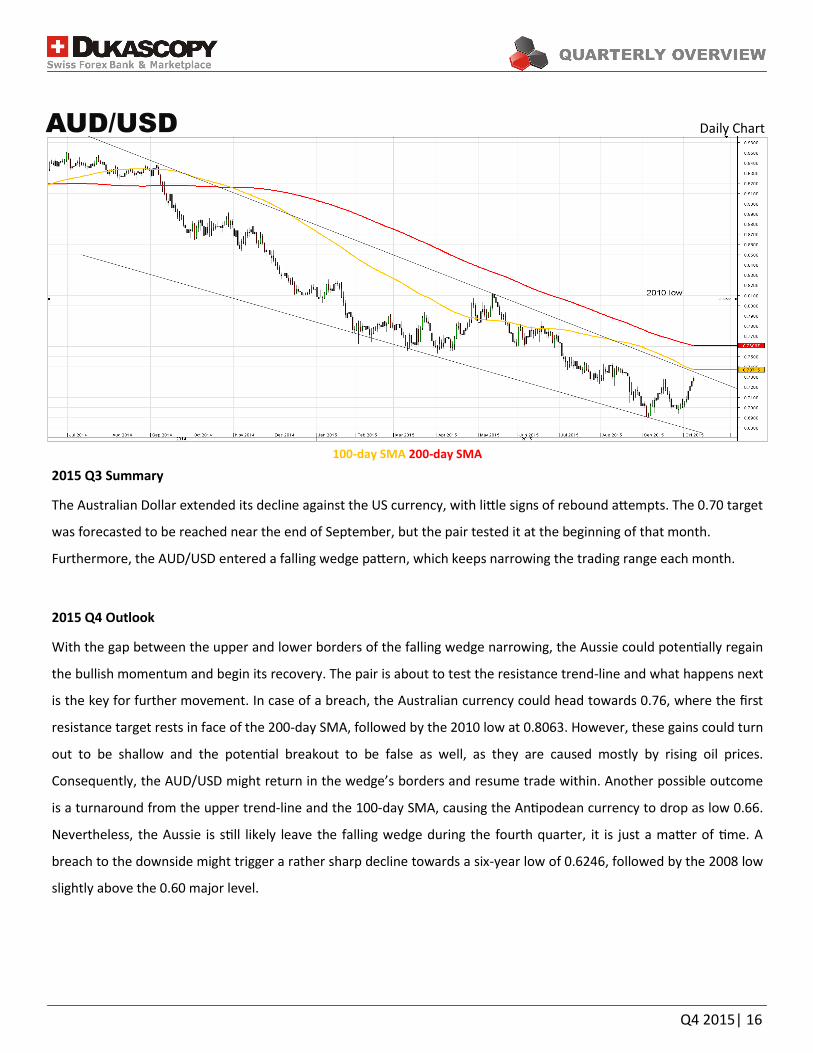
2015 Q3 Summary
The Australian Dollar extended its decline against the US currency, with little signs of rebound attempts. The 0.70 target
was forecasted to be reached near the end of September, but the pair tested it at the beginning of that month.
Furthermore, the AUD/USD entered a falling wedge pattern, which keeps narrowing the trading range each month.
2015 Q4 Outlook
With the gap between the upper and lower borders of the falling wedge narrowing, the Aussie could potentially regain
the bullish momentum and begin its recovery. The pair is about to test the resistance trend-line and what happens next
is the key for further movement. In case of a breach, the Australian currency could head towards 0.76, where the first
resistance target rests in face of the 200-day SMA, followed by the 2010 low at 0.8063. However, these gains could turn
out to be shallow and the potential breakout to be false as well, as they are caused mostly by rising oil prices.
Consequently, the AUD/USD might return in the wedge’s borders and resume trade within. Another possible outcome
is a turnaround from the upper trend-line and the 100-day SMA, causing the Antipodean currency to drop as low 0.66.
Nevertheless, the Aussie is still likely leave the falling wedge during the fourth quarter, it is just a matter of time. A
breach to the downside might trigger a rather sharp decline towards a six-year low of 0.6246, followed by the 2008 low
slightly above the 0.60 major level.

Q4 2015| 17
USD/CAD Daily Chart
100-day SMA 200-day SMA
2015 Q3 Summary
The US Dollar reached its first target (Q1 high) in July, as was anticipated. However, the USD/CAD did not return to the
trend-line, as the 2009 high was pierced and a fresh ten-year one was established, namely 1.3461. The Greenback
remained strong through all of the third quarter, although the bullish momentum slowed down in the quarter’s last
two months, compared to the sharp acceleration the Buck experienced during the second quarter.
2015 Q4 Outlook
The Buck began to lose its bullish momentum near Q3’s end, with the exchange rate falling back towards the 2009 high
at 1.3065. Oil prices are rising from time to time, boosting the Canadian Dollar, causing the USD/CAD to retrace its
steps. But will this correction continue or will the US currency be able to climb higher and reach an 11-year high during
the next three months? The answer is: highly unlikely. With rather poor conditions in the US labour market, the Fed is
expected to postpone its interest rate hike. Even though December sounds appealing, it is doubtful the rates will get
raised in 2015 at all, therefore, reducing the confidence in the American Dollar and prolonging the sell-off. However,
the given currency pair remains in a rather strong up-trend. The trend-line, along with the 200-day SMA, should
provide sufficient support to cause a rebound if the 100-day SMA fails to do so earlier. Nevertheless, Q3 is expected to
end with the Buck trading somewhere between 1.29 and 1.30, as momentum is likely to be regained as the potential
2016 rate hike deadline looms closer.

Q4 2015| 18
NZD/USD Daily Chart
100-day SMA 200-day SMA
2015 Q3 Summary
The New Zealand Dollar rebounded in the middle of July, but the gains did not last. The rebound helped the NZD/USD
to break out of the smaller descending channel, although the overall bearish trend prevailed, as the pair gravitated
towards the support trend-line. Trade continued under the 2010 low, with the trend-line being somewhat pierced at
the end of the quarter, but with arising signs of a possible rebound.
2015 Q4 Outlook
This current rebound might just be an illusion and the Kiwi is just returning within the borders of the larger descending
channel, where it has been trading for almost two years now. Furthermore, the exchange rate is edging closer to the
100-day SMA, where resistance might be met. The gap between the 100 and 200-day SMAs widened, diminishing the
chances of a possible trend reversal; however, the NZ Dollar is unlikely to drop below the 0.59 major level. The up-
trend around that area is likely to provide sufficient support in case it is reached, as the Kiwi has not approached the
given trend-line since the beginning of the global financial crisis. However, with increased speculation about the Fed
delaying the interest rate hike till 2016, the current rally might well extend to the major level of 0.70. The 200-day SMA
is expected to reach that mark as well and become the second target in case the 100-day one gets pierced in beginning
of the quarter. Ultimately, the Kiwi has a chance of rebounding from the multi-year lows, especially if the RBNZ decides
that the NZ currency has been weakening long enough.

Q4 2015| 19
Expert Commentary

Q4 2015| 20
What performance do you expect from the Euro versus its major counterparts
during the 4th quarter of 2015?
I suppose we will see a slightly weaker Euro, because of the ECB’s tendency to
expand its QE programme further. The ECB will most likely be disappointed by the
inflation numbers, which should trigger some actions that are not fully priced in the
Euro exchange rate at the moment. Therefore, in general I anticipate the common
currency to get weaker against its major counterparts. Nevertheless, I do not expect
some big movement, because I believe the ECB will only gradually increase the QE
volume.
What will be the main drivers for the Euro during the same period?
Obviously the main driver is the ECB policy, because that is something which seems
to be very much forecastable for a long period. Moreover, the fact that the ECB will
obviously think about increasing the QE volume is something which brings more volatility from this side of the
equation. However, the general risk sentiment in global fundamental markets is also driving the Euro. We saw it
before the Euro behaved more like a safe haven currency recently, when risk aversion shocked up the currency
market and the Euro got stronger.
What are your forecasts for EUR/USD and EUR/JPY for Q4 of 2015?
I think the EUR/USD will trade slightly lower than now on the range of 1.06-1.08, while the Japanese Yen still has
some potential to go weaker, due to some disappointment regarding the inflation performance of Japan, especially
the wage performance.
Therefore, the new speculation above Bank of Japan is heading to become more active again and taking the next step
might arise soon and this would keep the Yen under pressure. Thus, I suppose the 125 might be a sensible level for
the EUR/JPY for the end of this year.
Euro
Ulrich Leuchtmann
Head: Currency Strategist
Commerzbank
Germany
The new speculation above Bank of Japan is heading to become more active again and taking the next step might arise soon and this would keep the Yen under pressure.
- Ulrich Leuchtmann

Q4 2015| 21
What performance do you expect from the Pound versus its major
counterparts during the 4th quarter of 2015?
I suppose the main story of the Sterling is on the crosses rather than versus
the US Dollar. On that basis we believe that the Sterling will re-establish the
trend of outperformance, largely on the back of the prospect for UK
monetary policy.
We think markets are far too sanguine in the pricing of UK rate prospects
with the risks of hikes being rather greater than the market currently
discounts.
What will be the main drivers for the British Pound during the same period?
The main driver, I believe, is conventional monetary policy. There are very structural issues in the background of the
Sterling. However, with a stable political background I believe we are back to focusing mainly on conventional
monetary policy, and interest rates differentials is the key driver.
What are your forecasts for GBP/USD, EUR/GBP and GBP/CHF for Q4 of 2015?
For the GBP/USD we think it is broadly stable from here; in fairly tight ranges we are constructive on both currencies.
Against the Euro we believe it would trade back below 0.70, in order to retest the loss that we saw earlier this year. A
similar performance to that is against the Swiss Franc, where we have the Euro and the Swiss Franc performing partly
similarly, again stressing that the story of the Sterling relies on the crosses rather than versus the Dollar.
We think markets are far too sanguine in the pricing of UK rate prospects with the risks of hikes being rather greater than the market currently
discounts.
- Adam Cole
Adam Cole
Global Head: FX Strategy
RBC Capital Markets
UK
Pound Sterling

Q4 2015| 22
What performance do you expect from the Greenback during the Q4 of this
year?
Currently we see the outlook for the US Dollar remaining rather constrained over
the fourth quarter of this year. Even if the Fed does not hike rates in September,
it will surely raise interest rates some time in Q4.
Against that, we have got growing risks of quantitative easing or expansion of the
QE programme in Europe and ongoing angst in concern about Chinese growth
prospects, which is a negative for a lot of emerging market currencies. Overall, I
would assess that the outlook for the Greenback in Q4 is still positive.
What will be the major drivers for USD throughout the same period?
I would say that the three most important headwinds for the US dollar in the
fourth quarter are the outlook for the Chinese economic growth, the US Fed
policy and prospects for the European Central Bank policy.
What are your forecasts for EUR/USD, GBP/USD and USD/JPY by the end of 2015?
By the end of the fourth quarter we anticipate the shared currency to trade around 1.08 against the US Dollar, while
the USD/JPY currency pair we see at 124. As for the Sterling, we expect the level of 1.55 in the Q4.
US Dollar
Over I would say that the three most important headwinds for the US dollar in the fourth quarter are the outlook for the Chinese economic
growth, the US Fed policy and prospects for the European Central Bank policy. - Richard Franulovich
Richard Franulovich,
Senior Currency Strategist
Westpac
US

Q4 2015| 23
What performance do you expect from the Swiss Franc versus its major
counterparts during the 4th quarter of 2015?
We are basically expecting the EUR/CHF to range trade around recent levels, I would
say between 1.05 and 1.1050, which is the highest level that we have reached in
September. We believe that the current context in the Eurozone and in Switzerland,
obviously, will assure the current monetary policy remains unchanged. Besides, we
see some political risk in Europe, in the Euro zone, especially given the general
elections in Spain at the end of this year. We suppose that political noise could keep
the EUR/CHF or at least cut in the very short term.
We had the quarterly meeting from the Swiss National Bank a few weeks ago and
they told us exactly the same. Mr. Thomas Jordan, Swiss National Bank Chairman,
said that they are ready to act and, if necessary, intervene in the FX market as they did in the previous months. That is
why we also see limited downside potential.
What will be the main drivers for the Franc during the same period?
We believe that for the Swiss Franc the main driver would be the uncertainties delivered from the Eurozone’s political
situation. Obviously, global risk aversion is going to be an important driver for the Swiss Franc. Recently, we have seen
that the Japanese Yen, for example, has reacted more positively than the Swiss Franc, when there was the suspect in
risk aversion derived from the situation in China.
What are your forecasts for the USD/CHF and the EUR/CHF for Q4 of 2015?
For the EUR/CHF our forecast stands at 1.07 levels for the end of December. Talking about the USD/CHF currency pair,
we estimate it to trade at 1.01 levels, which is definitely linked to our projections in EUR/USD.
Swiss Franc
Obviously, global risk aversion is going to be an important driver for the Swiss Franc.
- Lutz Karpowitz
Roberto Cobo
Senior Economist
Banco Bilbao Vizcaya
Argentina SA
Spain

Q4 2015| 24
What performance do you expect from the Yen versus its major counterparts
during the 4th quarter of 2015?
At the end of August the Yen appreciated on back of growing global risk aversion.
The USD/JPY exchange rate has not yet recovered from that move and since then
has been trading around 120. Fundamentally, I think everything still points
towards weaker Japanese Yen against the US Dollar while the EUR/JPY should
trade largely sideways.
What will be the main drivers for the Yen during the same period?
In Q4 the value of the Yen will mostly be affected by global risk sentiment and
speculation about further extension of the BoJ’s monetary policy. The decline of the Japanese economy in Q2, weaker
demand from emerging markets (in particular Asian economies) and reluctantly low inflation recently strengthened the
case for further expansion of the monetary policy.
However, BoJ governor Haruhiko Kuroda has stressed in recent weeks that he does not yet see the necessity to expand
the monetary policy at the moment. For October 2015 about 1/3 of analysts expect further expansion. However, we
think that a simple extension of the QE program will only have limited effects as the implementation of the first arrow
of Abenomics and the extension one year ago did not succeed in reviving inflation. However, for more aggressive
measures it is, in our opinion, still too early. Nevertheless, in particular if we see some further currency appreciation,
speculation about further monetary policy measures should prevent the appreciation from being sustainable.
What are your forecasts for EUR/JPY and USD/JPY for Q4 of 2015?
We see the USD/JPY to be at 125 levels and we expect the EUR/JPY trading at 135 levels in Q4 of 2015.
The decline of the Japanese economy in Q2, weaker demand from emerging markets (in particular Asian economies) and reluctantly low inflation
recently strengthened the case for further expansion of the monetary policy.
- Esther Maria Reichelt
Japanese Yen
Esther Maria Reichelt
FX Strategist
Commerzbank
Germany
Q4 2015| 25
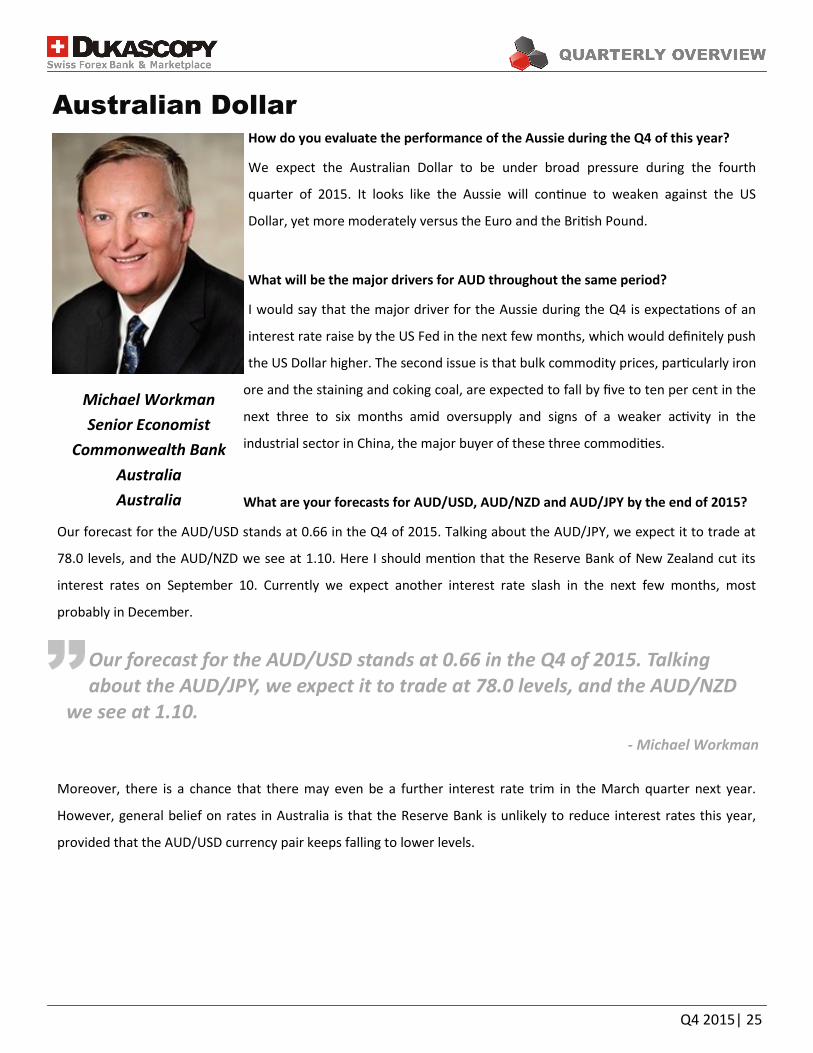
How do you evaluate the performance of the Aussie during the Q4 of this year?
We expect the Australian Dollar to be under broad pressure during the fourth
quarter of 2015. It looks like the Aussie will continue to weaken against the US
Dollar, yet more moderately versus the Euro and the British Pound.
What will be the major drivers for AUD throughout the same period?
I would say that the major driver for the Aussie during the Q4 is expectations of an
interest rate raise by the US Fed in the next few months, which would definitely push
the US Dollar higher. The second issue is that bulk commodity prices, particularly iron
ore and the staining and coking coal, are expected to fall by five to ten per cent in the
next three to six months amid oversupply and signs of a weaker activity in the
industrial sector in China, the major buyer of these three commodities.
What are your forecasts for AUD/USD, AUD/NZD and AUD/JPY by the end of 2015?
Our forecast for the AUD/USD stands at 0.66 in the Q4 of 2015. Talking about the AUD/JPY, we expect it to trade at
78.0 levels, and the AUD/NZD we see at 1.10. Here I should mention that the Reserve Bank of New Zealand cut its
interest rates on September 10. Currently we expect another interest rate slash in the next few months, most
probably in December.
Moreover, there is a chance that there may even be a further interest rate trim in the March quarter next year.
However, general belief on rates in Australia is that the Reserve Bank is unlikely to reduce interest rates this year,
provided that the AUD/USD currency pair keeps falling to lower levels.
Our forecast for the AUD/USD stands at 0.66 in the Q4 of 2015. Talking about the AUD/JPY, we expect it to trade at 78.0 levels, and the AUD/NZD
we see at 1.10.
- Michael Workman
Australian Dollar
Michael Workman
Senior Economist
Commonwealth Bank
Australia
Australia

Q4 2015| 26
Trade Pattern Ideas

Q4 2015| 27
XAU/USD
200-week SMA
We hold a negative bias towards gold. By the looks of it, the question is whether the price will drop immediately or
there is going to be a relatively shallow rally before the sell-off is resumed, not whether the long-term outlook is bullish
or bearish. The bullion is currently probing an important falling resistance line at 1,150, which can be traced back to
September 2012. Even in case of success, the boundaries of the channel should capture the bulk of trade.
A close above 1,150 will pave the way for a recovery to 1,260, namely the upper boundary of the emerging pattern. We
expect the bears to regain control of the situation there and turn the pair around. Even if gold jumps higher, the long-
term risks will still be skewed to the downside because of the 200-week moving average (1,400) which was crossed in
the first half of 2013.
Another scenario we deem likely is a failure to cross 1,150 and a subsequent dip beneath the lower boundary of the
channel. Once the price is under 1,050, the selling will likely intensify. And while there could be some intermediary
upward corrections, the main target will be 700, the level that proved its importance back in 2006, 2007 and again in
2008.
The sentiment is bullish, but only a small step from being neutral. At the beginning of October 56% of the open
positions are long and 44% are short.
XAU/USD
Channel Down
We hold a negative bias towards gold.
Weekly Chart

Q4 2015| 28
AUD/SGD
200-day SMA
Since the last time we analysed the long-term chart of AUD/SGD, the outlook on the currency pair has not been subject
to change. On the contrary, the bearish bias has only strengthened, and the market continues to respect the upper
boundary of the channel.
What has changed materially is the attitude of the SWFX market participants towards the pair. Three months ago the
sentiment was neutral, but now the traders are considerably more optimistic with respect to the Antipodean currency.
Previously only 54% of the open positions were long. At the moment as much as 70% of traders expect the Aussie to
outperform its Singapore counterpart.
However, to our mind the current rally has little potential to develop. The chief reason is a major trend-line at 1.02,
which is highly unlikely to let the price keep advancing for long. Conversely, if the bulls manage to push the Aussie
higher, the next target should be 1.04, where the August high merges with the 200-day SMA.
The base scenario is a rejection at 1.02 and an ensuing decline, which is expected to result in a test of the lowest level
since 2009, namely, 0.9450. Beyond this, AUD/SGD could aim for 0.9070, the minimum of the last seven years.
AUD/SGD
Channel Down
The current rally has little potential to develop.
Daily Chart

Q4 2015| 29
GBP/USD
200-month SMA
In the monthly chart, the Cable is clearly trading within the boundaries of a bullish channel. At the moment the pair is
near the pattern’s lower boundary, which implies a good buying opportunity. Nevertheless, we have doubts whether
the Sterling will in fact be able to recuperate from 1.49.
The reason for our disbelief lies in the fact that the currency pair has already failed to sustain gains after a prior test of
the same rising trend-line. This showcases that demand around 1.49 dollars might not be as strong as initially
estimated, which is why we refrain from saying that the outlook is bullish. On the contrary, we consider that the
downside risks prevail, and confirmation of this will be in the form of a breach of the green trend-line. In such a case,
the first target will be 2010’s low at 1.4230, followed by 2009’s low at 1.35.
As for the mood among the market participants, the majority (65%) is currently long on the pair, and if 1.49 withstands
the selling pressure, there will be few reasons for GBP/USD not to reach the upper edge of the channel at 1.73.
GBP/USD
Channel Up
At the moment the pair is near the pattern’s lower boundary, which implies a good buying opportunity.
Monthly Chart

Q4 2015| 30
EUR/GBP
200-week SMA
Along with AUD/SGD, we studied this pattern in our previous release of the quarterly report. Since then the chart
evolved according to our expectations, and we see the Euro gaining even more ground against the Sterling in the
future.
After the currency pair rebounded from the falling support line at 0.70, the current objective is the falling resistance
line at 0.80. Another reason to change the outlook from bullish to bearish in the vicinity of 0.80 will be presence of the
200-week simple moving average. If this round level fails to contain the bullish pressure, however, the next destination
could be 0.88, namely the ceiling of 2013.
On the other hand, a sudden sell-off is to meet fierce resistance at 0.68, implied by the mentioned lower boundary of
the channel. Additional support area is circa 0.6536, which is the long-term target, represented by the 2007 minimum.
In the meantime, the SWFX traders are divided in their views in respect to EUR/GBP’s prospects, as 46% of positions
are long and 54% are short.
EUR/GBP
Channel Down
SWFX traders are divided in their views in respect to EUR/GBP’s prospects, as 46% of positions are long and 54% are short.
Weekly Chart

Q4 2015| 31
Aggregate Technical Indicator

Q4 2015| 32
EUR/USD
GBP/USD
Daily chart
Daily chart

Q4 2015| 33
USD/JPY Daily chart
USD/CHF Daily chart

Q4 2015| 34
EUR/JPY
AUD/USD
Daily chart
Daily chart

Q4 2015| 35
USD/CAD
NZD/USD
Daily chart
Daily chart

Q4 2015| 36
Newest releases and archive: Fundamental Analysis Technical Analysis Press Review Market Research Expert Commentary Dukascopy Sentiment Index Trade Pattern Ideas Global Stock Market Review Commodity Overview Economic Research Quarterly Report Aggregate Technical Indicator Community Forecasts
Additional information: Dukascopy Group Home Page Market News & Research FXSpider Live Webinars Dukascopy TV Daily Pivot Point Levels Economic Calendar Daily Highs/Lows SWFX Sentiment Index Movers & Shakers FX Currency Index CoT Charts
Social networks:
Fundamental Analysis
Expert Commentary
Commodity Overview
Technical Analysis
Dukascopy Bank Sentiment Index
Economic Research
Press Review
Trade Pattern Ideas
Dukascopy Aggregate Technical Indicator
Market Research
Global Stock Market Review
Follow the live daily webinars at http://www.dukascopy.com/tv/Live
Community Forecasts

Q4 2015| 37
Disclaimer Everything in this article, including opinions and figures, is provided for informational purposes only and may not be interpreted as financial advice or solicitation of products. Dukascopy group assume no responsibility for the completeness or the accuracy of any data contained in this article. Financial figures indicated in this article have not been verified by the Dukascopy group. Views, opinions and analyses are those of the author of the article, and are not endorsed by the Dukascopy group. Dukascopy group waive any and all warranties, express or implied, regarding, but without limitation to, warranties of the merchantability or the fitness for a particular purpose, with respect to all information in this article. Dukascopy group shall under no circumstances be responsible for any direct, indirect, consequential, contingent or any other damages sustained in connection with the use of this article.

Q4 2015| 38