Quasi-Experimental Health service evaluation · quasi-experimental health service evaluation...
39
QUASI-EXPERIMENTAL HEALTH SERVICE EVALUATION COMPASS 1 APRIL 2016
Transcript of Quasi-Experimental Health service evaluation · quasi-experimental health service evaluation...

QUASI-EXPERIMENTAL HEALTH SERVICE EVALUATIONCOMPASS 1 APRIL 2016

AIM & CONTENTS
Aim – to explore what a quasi-experimental study is and some issues around how they are done Context and Framework
Review of NZ health service evaluation studies
Case study – Evaluation of the ITC project

CONTEXT & FRAMEWORKQUASI-EXPERIMENTAL DESIGN

AUCKLAND & WAITEMATA PLANNING & FUNDING
Population > 1 million
Budget $2.4b per year

EVALUATING CHANGE IN HEALTH SERVICES
Change is constant and frequent
Health service changes are typically complex
Evaluation undertaken for learning and accountability
Evaluation of outcomes is only a part of evaluation
For outcome evaluation RCTs are best – but frequently cannot be undertaken
Quasi-experimental outcome evaluations may be feasible
Outcome or impact evaluation
Black box
Input Outcome

WHAT IS A QUASI-EXPERIMENTAL STUDY?
Shadish & Cook (2002)
Share experimental study’s purpose of testing causal hypotheses about manipulablecauses
Share many of experiment’s structural elements for counterfactual inference e.g. control groups, pre-tests etc
But allocation is by self-selection or researcher control but not randomisation
Rosenbaum (2010) – “when investigators are especially proud of devices included to distinguish treatment effects from plausible alternatives…”
RCT ⇐ Quasi-experimental ⇒ Non-experimental
FRAMEWORK
Internal validity
Design
ControlBias

REVIEW OF CURRENT PRACTICENEW ZEALAND HEALTH SERVICE OUTCOME EVALUATIONS

CURRENT PRACTICE
Review of 52 outcome evaluations
2010-2015
Using a data extraction tool
Design
Constructs - Control
Bias or threats

SEARCH
SearchNumber of
resultsEvaluations
HIIR 1332 24Google 600 12Medline 421 7National Library 360 10NZMJ 694 18Total 3,407 52

DESCRIPTION OF EVALUATIONSNumber Percent
Primary care 11 21%Community 22 42%Hospital 10 19%Outpatient 5 10%National (Policy) 4 8%
Prevention 21 40%Acute care 8 15%Long term care 23 44%
New service 22 42%Model of care 14 27%New role 7 13%Quality improvement 4 8%Policy 5 10%
Health outcomes 49 94%Efficiency 7 13%Patient experience 3 6%
Setting
Type of care
Change made
Outcomes measured

QUASI-EXPERIMENTAL DESIGN
Designs – two main types Non-equivalent control group designs
O1 X O2
O1 _ O2
Discontinuity designs
Interrupted time series designs
O1 O2 O3 O4 X O5 O6 O7 O8
Regression discontinuity designs
With variations - Managing selection bias
Measured bias Variables – selectors, prognostics,
outcomes
Methods - Propensity scores, Inverse probability weights, regression etc
Unmeasured bias Intact group matching
Difference in difference
Instrumental variables
Discontinuities

Effective Practice and Organisation of Care Group(EPOC)
CochraneCollaboration

DESIGNS - EPOC
Study type Number PercentEPOC Included designsNon-randomised trial 3 5%Controlled before and after 4 7%Interrupted time series 11 20%Repeated measures study 2 4%Total 20 36%EPOC excluded designsUncontrolled before and after 28 51%Cohort studies 6 11%Case-control studies 1 2%Regression discontinuity 0 0%Intrumental variable studies 0 0%Total 35 64%
Total studies 52Total study designs 55

BIAS ASSESSMENT - INCLUDED STUDIES
NRT CBA ITS RMSAllocation to groups likely to cause bias
1 4
Baseline outcomes different 1 1
Baseline characteristics different
3 3
Contamination of control 1 0Outcome assessment likely to be biased
1 1 1 0
Selective outcome reporting 0 0 0 0
Attrition likely to cause bias 1 1 0 1
Other events may have caused effect
8 0
No clear pattern of outcome change predicted
6 0
Intervention caused change in outcome assessment
0 0
Other bias 0 0 0 1Number of studies 3 4 11 2
Cause of biasDesign

BIAS ASSESSMENT – EXCLUDED STUDIES
Before-after CohortAllocation to groups likely to cause bias 2Baseline characteristics different 4Contamination of control 0Other events may have caused effect 9 2Effect may have been caused by maturation of participants 3 0Regression to the mean 20 0Attrition likely to cause bias 13 2Repeated testing of outcome may have led to change in response 3 0Outcome assessment likely to be biased 9 2Other problems with outcome measurement 3 1Total studies 28 6
Study typeCause of bias

CONTROL OF CONSTRUCTS OF STUDY

EXAMPLES OF CONSTRUCT ISSUES
Participants – 1715 entered a new programme, 278 in evaluation – no reason or comparison given
Intervention – evaluation of a assessment unit model of care – unclear if the improved outcomes were due to the new care model or additional resources
Control – school lifestyle intervention control was different schools, from different regions, from different time period
Outcomes – Intervention to improve GP access – un-validated patient experience measure with 80-90% positive on pre-test
Time – outcomes measured at last follow up – “3 months to several years”

SUMMARY
Only about a third of evaluations used a design that EPOC recommends including
Of these ITS studies are the most common
Selection bias is the biggest problem for controlled studies (despite DID)
History threats are the biggest problems for ITS
About a half of evaluation use only uncontrolled before and after studies
These are very susceptible to regression to the mean
Also troubled by history threats, attrition, and bias in assessment of outcomes

LIMITATIONS
Small study – precision
Probably unrepresentative sample
Single investigator and subjective decisions
Limited by information in reports – sometimes inadequate
Unable to say cause of limitations
New Zealand only study

INTEGRATED TRANSITION OF CARECASE STUDY OF A QUASI-EXPERIMENTAL EVALUATION

BACKGROUND
Waitemata DHB has high rates of early readmission in older patients (75+)
Assumed this was due to poor transitions from discharge back into the community
Integrated Transition of Care Project was an attempt to improve transitions
Selected patients judged to be at high risk of readmission on a predictive risk model (>20%)
Intervention began in March 2012 and ran for a year
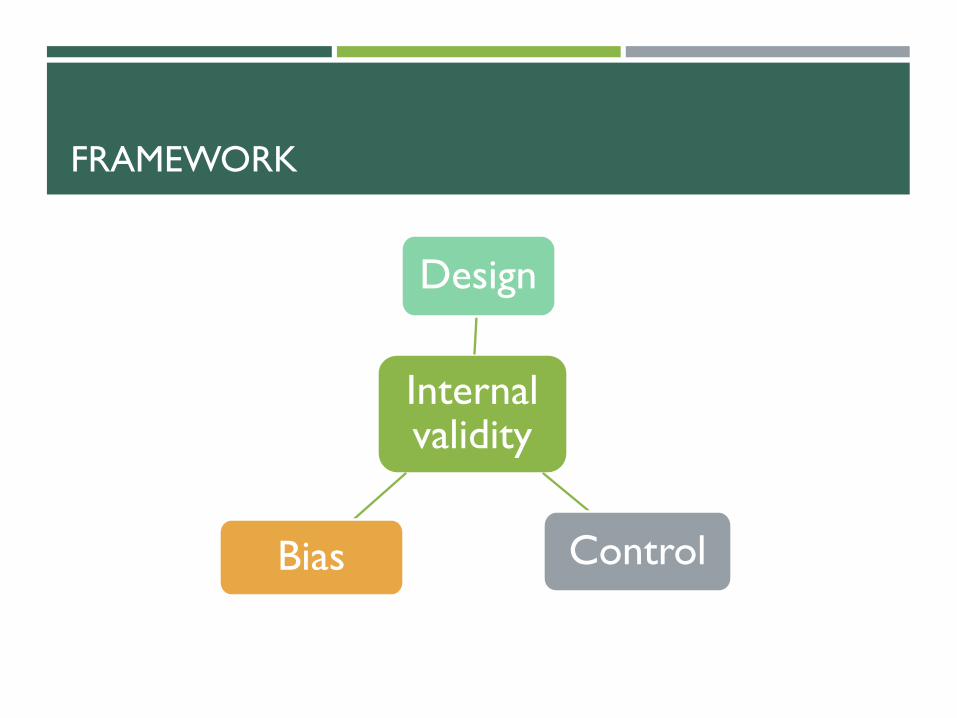
Aim to reduce readmissions by 25% (from 26% to 20% 28 day readmission)
5,172 people treated
Involved in design and evaluation from conception

INTERVENTION

QUASI-EXPERIMENTAL EVALUATION
Internal validity
Design
ControlBias

DESIGN – REGRESSION DISCONTINUITY
.1.2
.3.4
.5.6
lpol
y sm
ooth
: Rea
dmitt
ed w
ithin
28
days
of d
isch
arge
No intervention InterventionAssignment variable relative to cutoff
Readmitted within 28 days of dischargeBandwidth .0837790182691872

DESIGN – INTERRUPTED TIME SERIES

BIAS – ITS DESIGNMORE ANALYSIS

BIAS – OTHER EVENTS
Opening of Assessment and Discharge Unit – early 2011
ED Waiting Times Health Target - July 2009
Bad Influenza season
Other unidentified
DESIGN – INTERRUPTED TIME SERIES

BIAS – OTHER EVENTS

BIAS – OTHER EVENTS

BIAS – SELECTION

BIAS - OTHER
Attrition – 97% data outcome capture
Instrument – measurement bias unlikely as objective outcomes, no change
Maturation – not plausible
Regression - unlikely in ITS
Testing – not an issue
Selective reporting of outcomes – pre-specified in protocol

CONTROL OF CONSTRUCTS OF STUDY

CONTROL - PARTICIPANTS
Strengths
Selection on known covariate (risk score) – easy to create control group
Can use regression discontinuity design
Weaknesses
Unable to create risk score in control group for technical reasons – difficult to create control group (or control ITS)
Difficult to create risk score retrospectively – not completely sure of accuracy
Selection by investigator on predictive risk model threshold
CONTROL - INTERVENTION
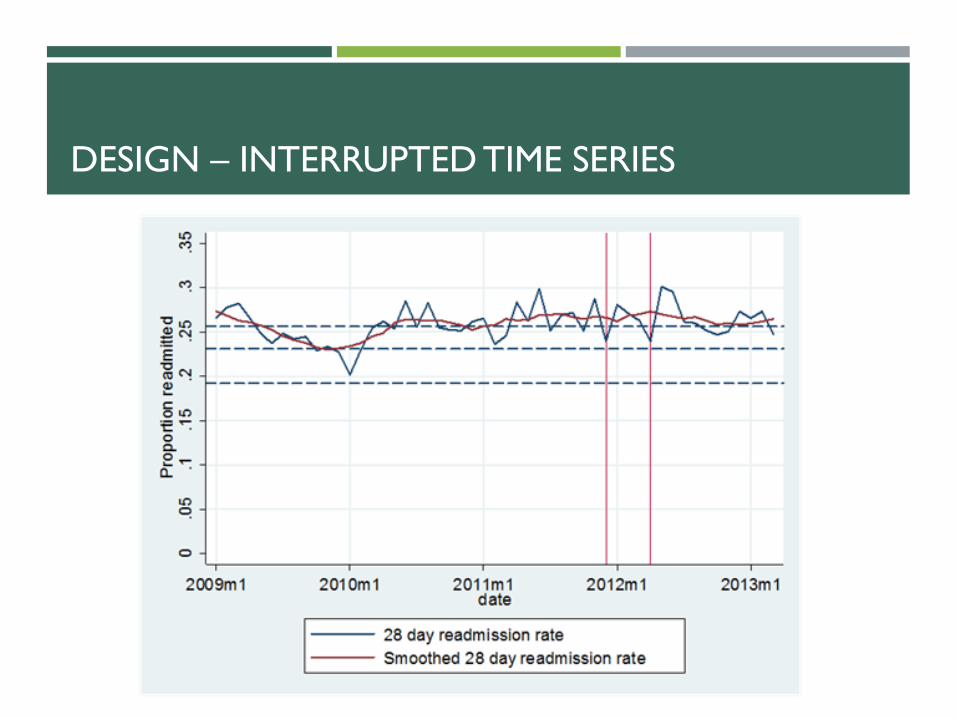
ITS
Did not create rapid onset of intervention – due to development period
Regression discontinuity
Discharge planning improvement probably contaminated control group
Poor control over intervention – timing and contamination

CONTROL - OUTCOMES
Measured
Health system focussed Readmission
ED attendance
Mortality (underpowered)
Other health service utilisation
Health service cost
Existing data collections
Not measured
Patient focussed Patient experience
Quality of life
Functional status
Would have required new data collection
SUMMARY
Early involvement in both intervention design and evaluation design
Still trade off between two needs
Research control over selection very important
Able to use strong quasi-experimental designs
Validity threats plausibility can be (partially) investigated by additional analysis
Control over constructs is important – we didn’t make best use of it

FUTURE RESEARCH
Feasibility of strong QE Evaluation 5 further case studies
Do good QE evaluations produce internally valid results? Systematic review of studies examining this question
Within study comparison