

Quarterly Update - ENBD REIT · ** Final dividend for FYE 31st March 2019, approved by shareholders...
28
www.enbdreit.com 1
Transcript of Quarterly Update - ENBD REIT · ** Final dividend for FYE 31st March 2019, approved by shareholders...

www.enbdreit.com 1

www.enbdreit.com
Julia Ward-Osseiran
Investor Relations Officer
ENBD REIT
Asif Siddique
Chief Financial Officer
ENBD REIT
Anthony Taylor
Head of Real Estate
ENBD REIT
Presenting team
ENBD REIT Quarterly Update as at 30th September 2019 3
www.enbdreit.com ENBD REIT Quarterly Update as at 30th September 2019
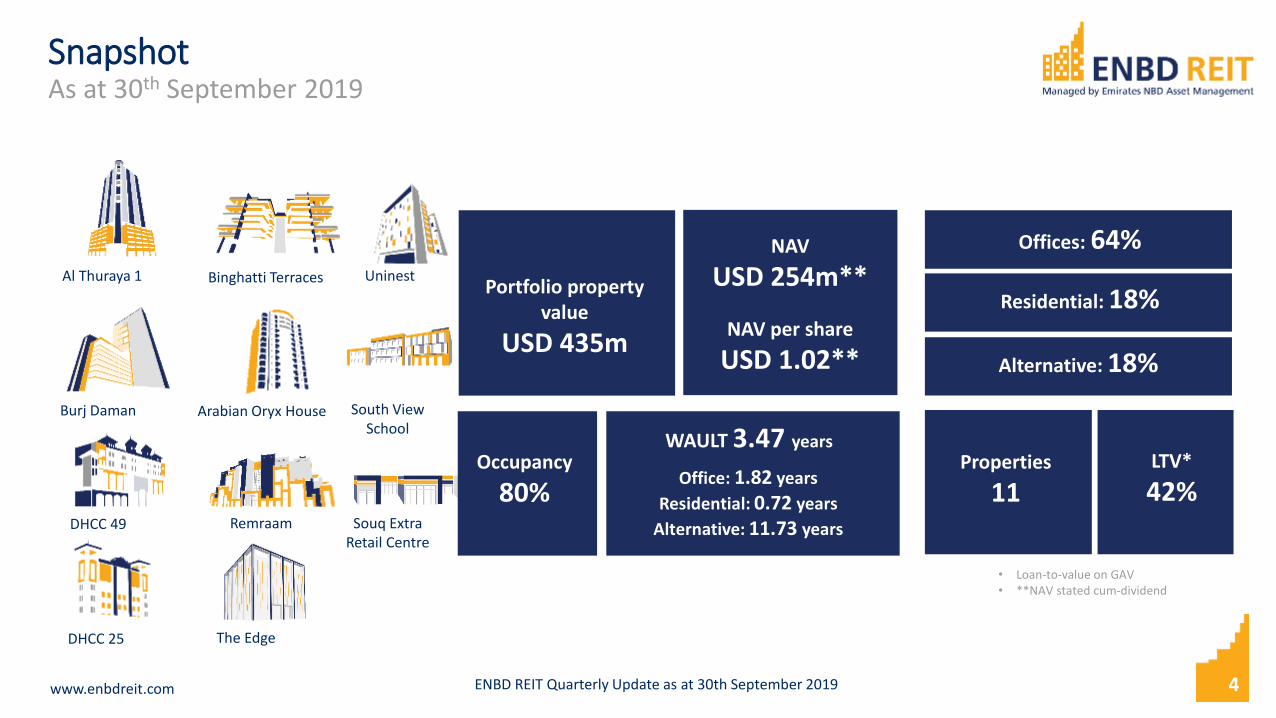
SnapshotAs at 30th September 2019
Portfolio property value
USD 435m
Offices: 64%
Residential: 18%
NAV
USD 254m**
NAV per share
USD 1.02**
LTV*
42%Occupancy
80%
Al Thuraya 1
Burj Daman
DHCC 49
DHCC 25
Binghatti Terraces
Arabian Oryx House
Remraam
WAULT 3.47 years
Uninest
Alternative: 18%
South View School
4
The Edge
• Loan-to-value on GAV• **NAV stated cum-dividend
Souq Extra Retail Centre
Office: 1.82 years
Residential: 0.72 years
Alternative: 11.73 years
Properties
11
www.enbdreit.com
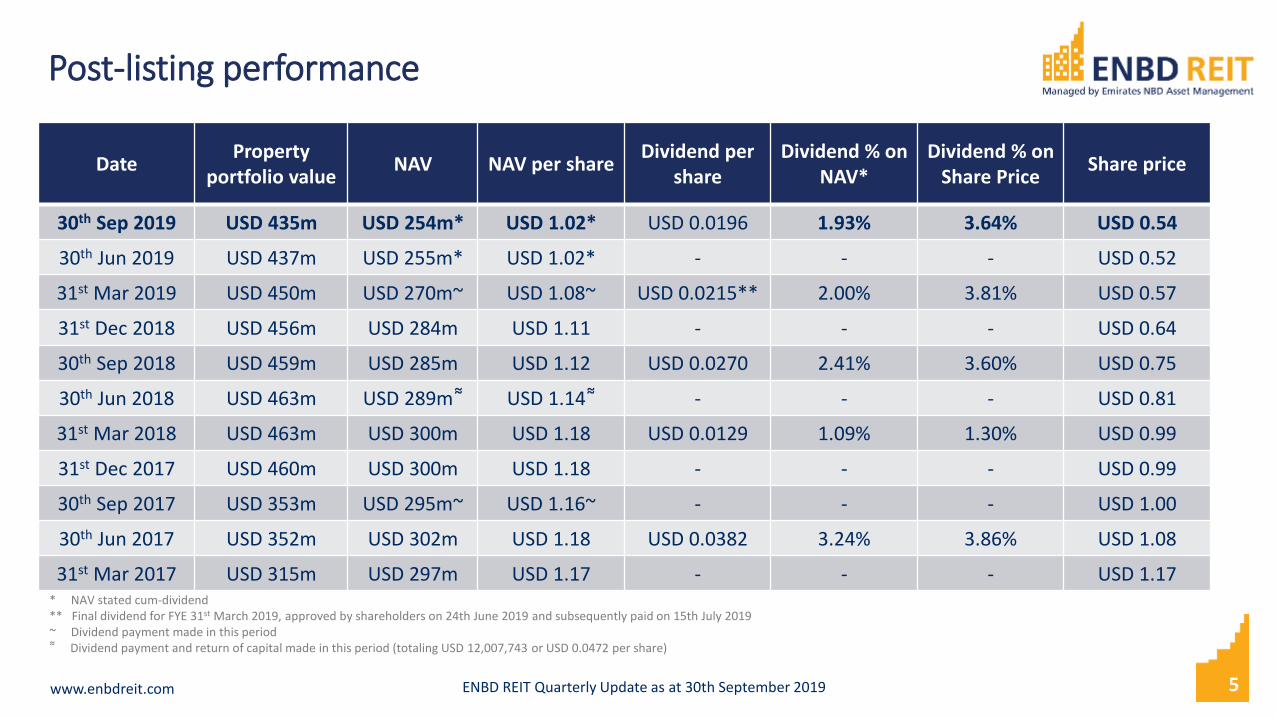
Post-listing performance
5
DateProperty
portfolio valueNAV NAV per share
Dividend pershare
Dividend % on NAV*
Dividend % on Share Price
Share price
30th Sep 2019 USD 435m USD 254m* USD 1.02* USD 0.0196 1.93% 3.64% USD 0.54
30th Jun 2019 USD 437m USD 255m* USD 1.02* - - - USD 0.52
31st Mar 2019 USD 450m USD 270m~ USD 1.08~ USD 0.0215** 2.00% 3.81% USD 0.57
31st Dec 2018 USD 456m USD 284m USD 1.11 - - - USD 0.64
30th Sep 2018 USD 459m USD 285m USD 1.12 USD 0.0270 2.41% 3.60% USD 0.75
30th Jun 2018 USD 463m USD 289m ͌ USD 1.14 ͌ - - - USD 0.81
31st Mar 2018 USD 463m USD 300m USD 1.18 USD 0.0129 1.09% 1.30% USD 0.99
31st Dec 2017 USD 460m USD 300m USD 1.18 - - - USD 0.99
30th Sep 2017 USD 353m USD 295m~ USD 1.16~ - - - USD 1.00
30th Jun 2017 USD 352m USD 302m USD 1.18 USD 0.0382 3.24% 3.86% USD 1.08
31st Mar 2017 USD 315m USD 297m USD 1.17 - - - USD 1.17* NAV stated cum-dividend** Final dividend for FYE 31st March 2019, approved by shareholders on 24th June 2019 and subsequently paid on 15th July 2019~ Dividend payment made in this period͌ Dividend payment and return of capital made in this period (totaling USD 12,007,743 or USD 0.0472 per share)
ENBD REIT Quarterly Update as at 30th September 2019
www.enbdreit.com 6
Intention to restructure and review strategy
ENBD REIT Quarterly Update as at 30th September 2019
Disclosed on NASDAQ Dubai on Sunday 8th December 2019
NOTICE OF INTENTION TO RESTRUCTURE AND REVIEW STRATEGY
ENBD REIT (CEIC) PLC (“ENBD REIT”), the Shari’a compliant real estate investment trust managed by Emirates NBD Asset
Management Limited, announces that its Board of Directors have concluded a comprehensive review of various strategic
alternatives to maximise long-term value for shareholders.
ENBD REIT confirms that, in light of this review, the Board has decided to proceed with formalising a restructuring and to become
a privately held REIT, subject to shareholders’ and regulatory approvals. ENBD REIT is also considering the deposit of ENBD REIT
shares in Nasdaq Dubai CSD, facilitating share transfers upon becoming a privately held REIT.
ENBD REIT is in discussions with the regulator, the Dubai Financial Services Authority (“DFSA”) and other stakeholders. Further
details of progress with the restructuring, delisting and possible future share transfer mechanisms will be submitted for
shareholders’ approval at an upcoming extraordinary general meeting. This will be announced on or before 23rd January 2020.
www.enbdreit.com 7
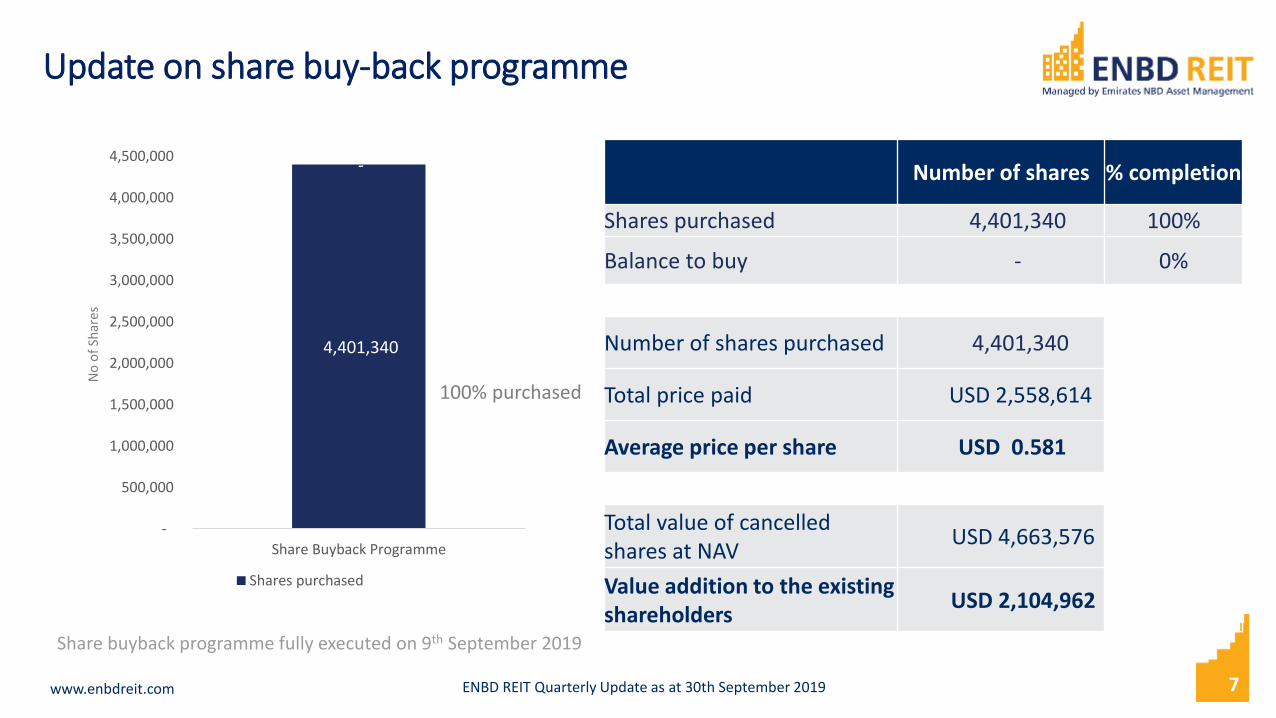
4,401,340
-
-
500,000
1,000,000
1,500,000
2,000,000
2,500,000
3,000,000
3,500,000
4,000,000
4,500,000
Share Buyback Programme
Shares purchased
100% purchased
No
of
Shar
es
Number of shares % completion
Shares purchased 4,401,340 100%
Balance to buy - 0%
Number of shares purchased 4,401,340
Total price paid USD 2,558,614
Average price per share USD 0.581
Total value of cancelled shares at NAV
USD 4,663,576
Value addition to the existing shareholders
USD 2,104,962
Share buyback programme fully executed on 9th September 2019
Update on share buy-back programme
ENBD REIT Quarterly Update as at 30th September 2019
www.enbdreit.com
NAV highlights
ENBD REIT Quarterly Update as at 30th September 2019
30th September 2019
Property Portfolio Value USD 435m
Cash USD 11m
Prepayments & Accruals USD (9m)
Gross Asset Value (GAV) USD 436m
NAV per share USD 1.02
Net Asset Value (NAV) USD 254m
Loan-to-Value (LTV) 42%
Gross rental yield on NAV 14.11%
Net Rental yield on NAV˄ 3.93%
Number of shares in issue 250,000,000
˄ Financial YTD annualized
8
www.enbdreit.com
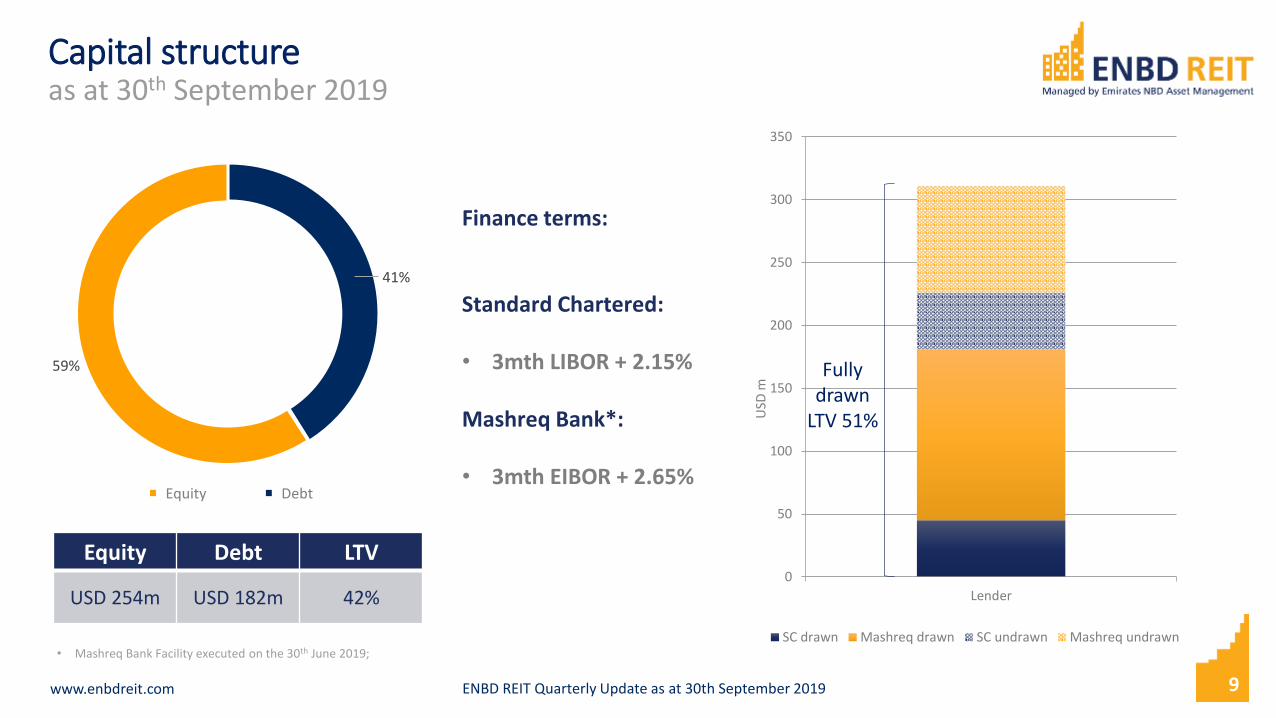
Capital structureas at 30th September 2019
41%
59%
Finance terms:
Standard Chartered:
• 3mth LIBOR + 2.15%
Mashreq Bank*:
• 3mth EIBOR + 2.65%DebtEquity
Equity Debt LTV
USD 254m USD 182m 42%
9ENBD REIT Quarterly Update as at 30th September 2019
0
50
100
150
200
250
300
350
Lender
SC drawn Mashreq drawn SC undrawn Mashreq undrawn
Fully drawn
LTV 51%USD
m
• Mashreq Bank Facility executed on the 30th June 2019;

Portfolio
www.enbdreit.com
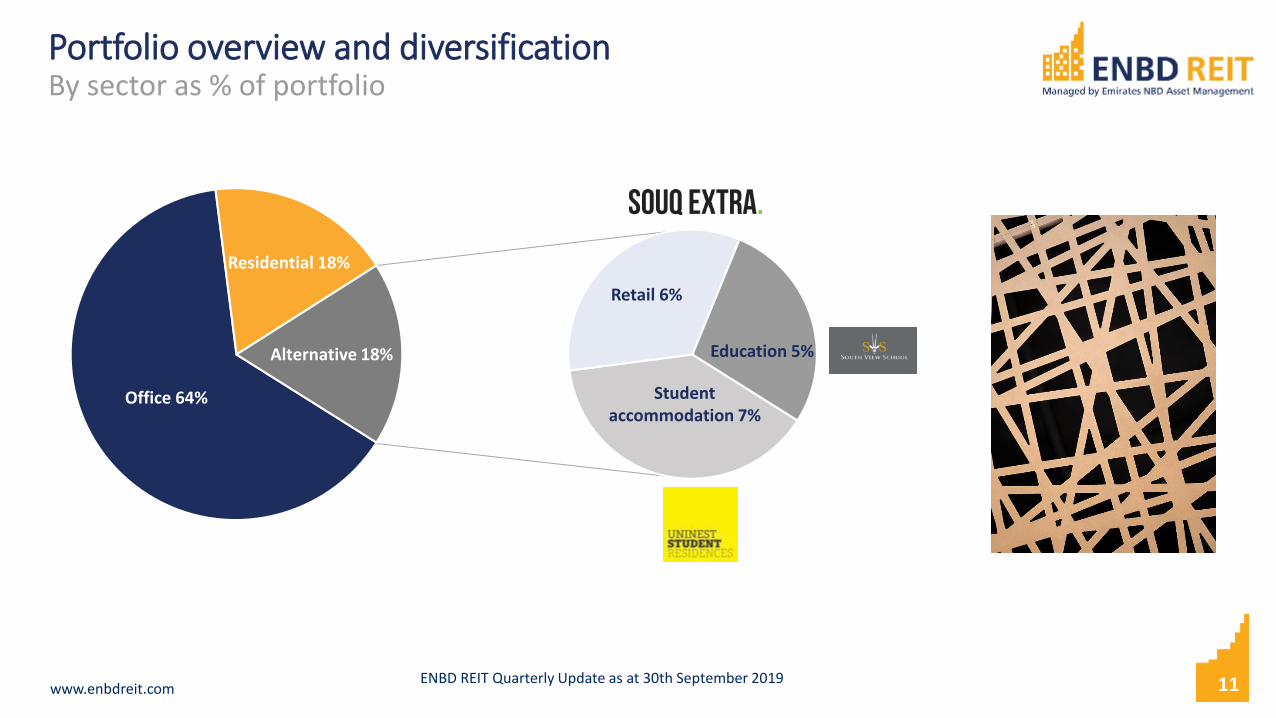
Portfolio overview and diversificationBy sector as % of portfolio
ENBD REIT Quarterly Update as at 30th September 2019 11
Office 64%
Residential 18%
Alternative 18% Education 5%
Student accommodation 7%
Retail 6%
www.enbdreit.com
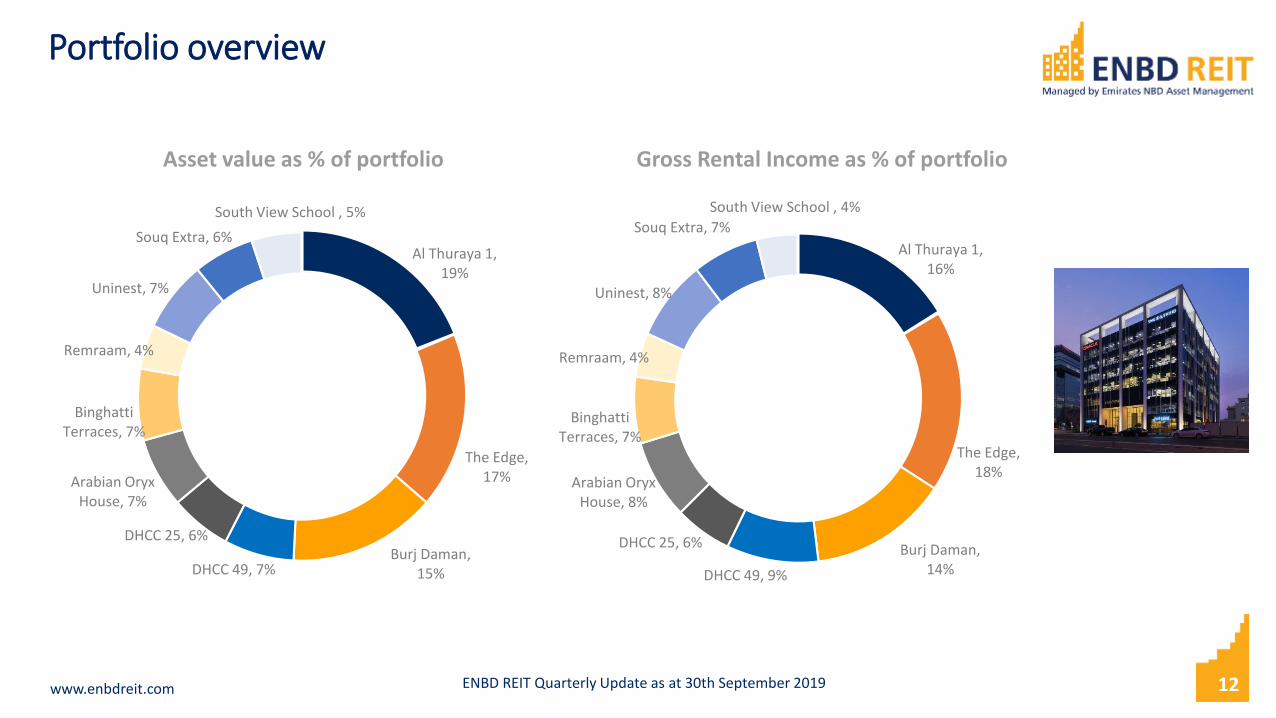
Portfolio overview
ENBD REIT Quarterly Update as at 30th September 2019
Al Thuraya 1, 19%
The Edge, 17%
Burj Daman, 15%DHCC 49, 7%
DHCC 25, 6%
Arabian Oryx House, 7%
Binghatti Terraces, 7%
Remraam, 4%
Uninest, 7%
Souq Extra, 6%
South View School , 5%
12
Al Thuraya 1, 16%
The Edge, 18%
Burj Daman, 14%DHCC 49, 9%
DHCC 25, 6%
Arabian Oryx House, 8%
Binghatti Terraces, 7%
Remraam, 4%
Uninest, 8%
Souq Extra, 7%
South View School , 4%
Asset value as % of portfolio Gross Rental Income as % of portfolio
www.enbdreit.com
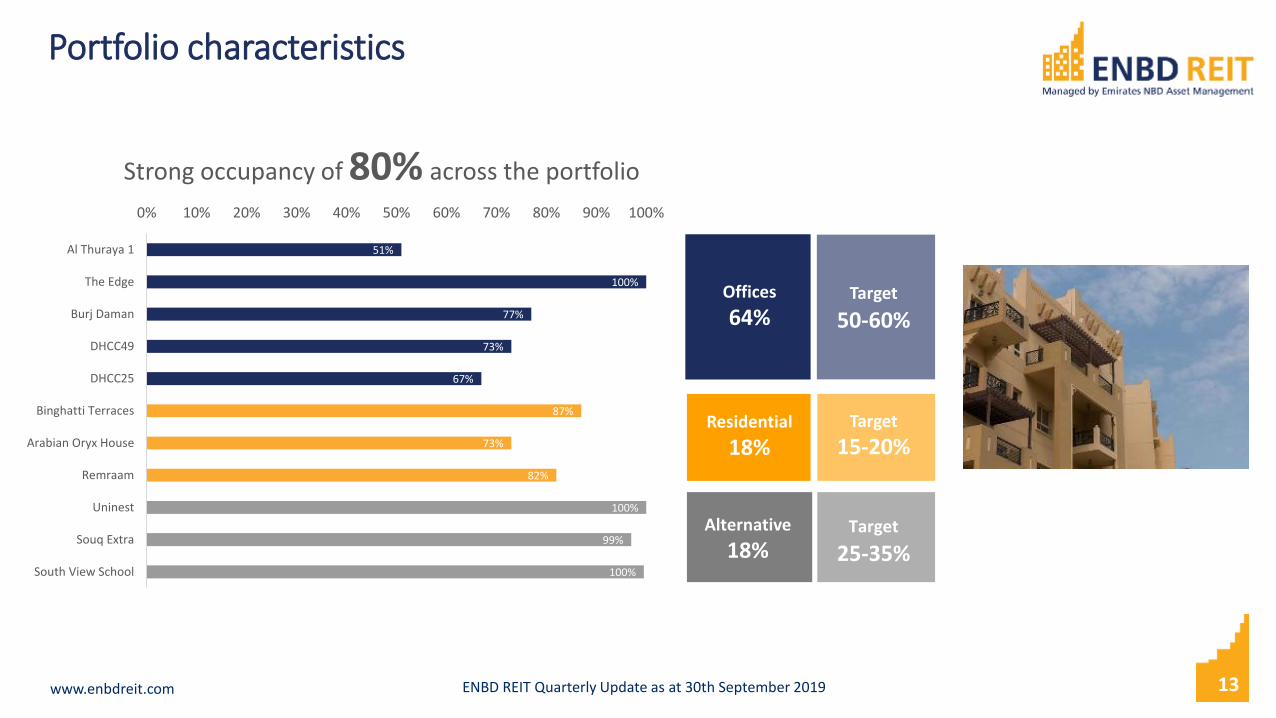
Portfolio characteristics
ENBD REIT Quarterly Update as at 30th September 2019
51%
100%
77%
73%
67%
87%
73%
82%
100%
99%
100%
0% 10% 20% 30% 40% 50% 60% 70% 80% 90% 100%
Al Thuraya 1
The Edge
Burj Daman
DHCC49
DHCC25
Binghatti Terraces
Arabian Oryx House
Remraam
Uninest
Souq Extra
South View School
Strong occupancy of 80% across the portfolio
13
Offices
64%
Residential
18%
Alternative
18%
Target
50-60%
Target
15-20%
Target
25-35%
www.enbdreit.com 14
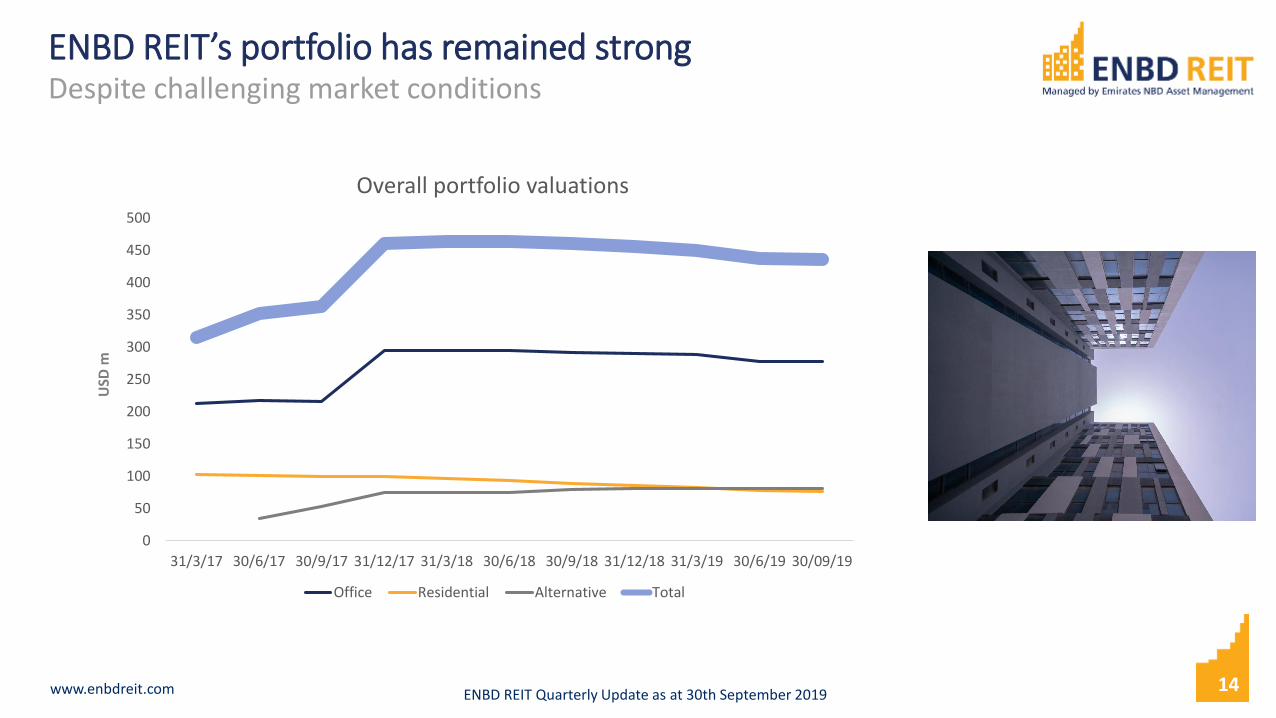
ENBD REIT’s portfolio has remained strong
ENBD REIT Quarterly Update as at 30th September 2019
0
50
100
150
200
250
300
350
400
450
500
31/3/17 30/6/17 30/9/17 31/12/17 31/3/18 30/6/18 30/9/18 31/12/18 31/3/19 30/6/19 30/09/19
Overall portfolio valuations
Office Residential Alternative Total
Despite challenging market conditionsU
SD m
www.enbdreit.com 15
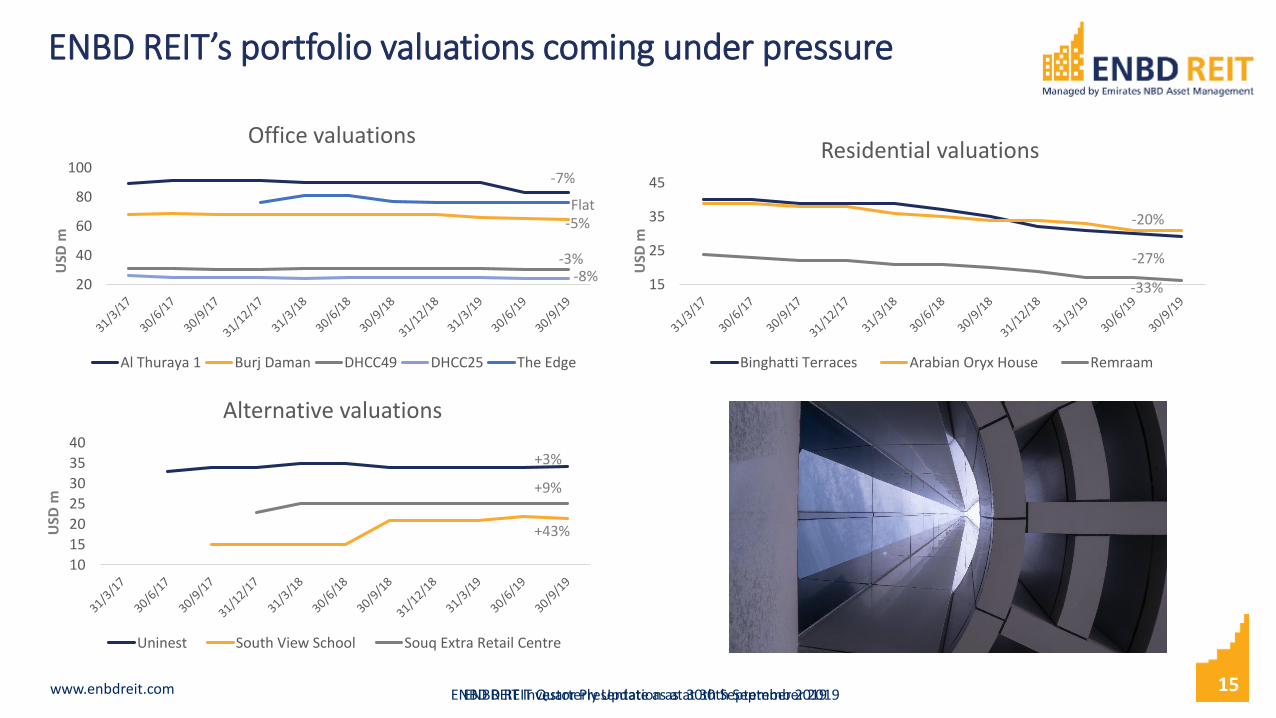
ENBD REIT’s portfolio valuations coming under pressure
20
40
60
80
100
Office valuations
Al Thuraya 1 Burj Daman DHCC49 DHCC25 The Edge
15
25
35
45
Residential valuations
Binghatti Terraces Arabian Oryx House Remraam
10
15
20
25
30
35
40
Alternative valuations
Uninest South View School Souq Extra Retail Centre
USD
m
USD
m
USD
m
-7%
Flat
-8%-3%
+3%
+43%
+9%
-33%
-27%
-20%-5%
ENBD REIT Investor Presentation as at 30th September 2019 ENBD REIT Quarterly Update as at 30th September 2019
www.enbdreit.com
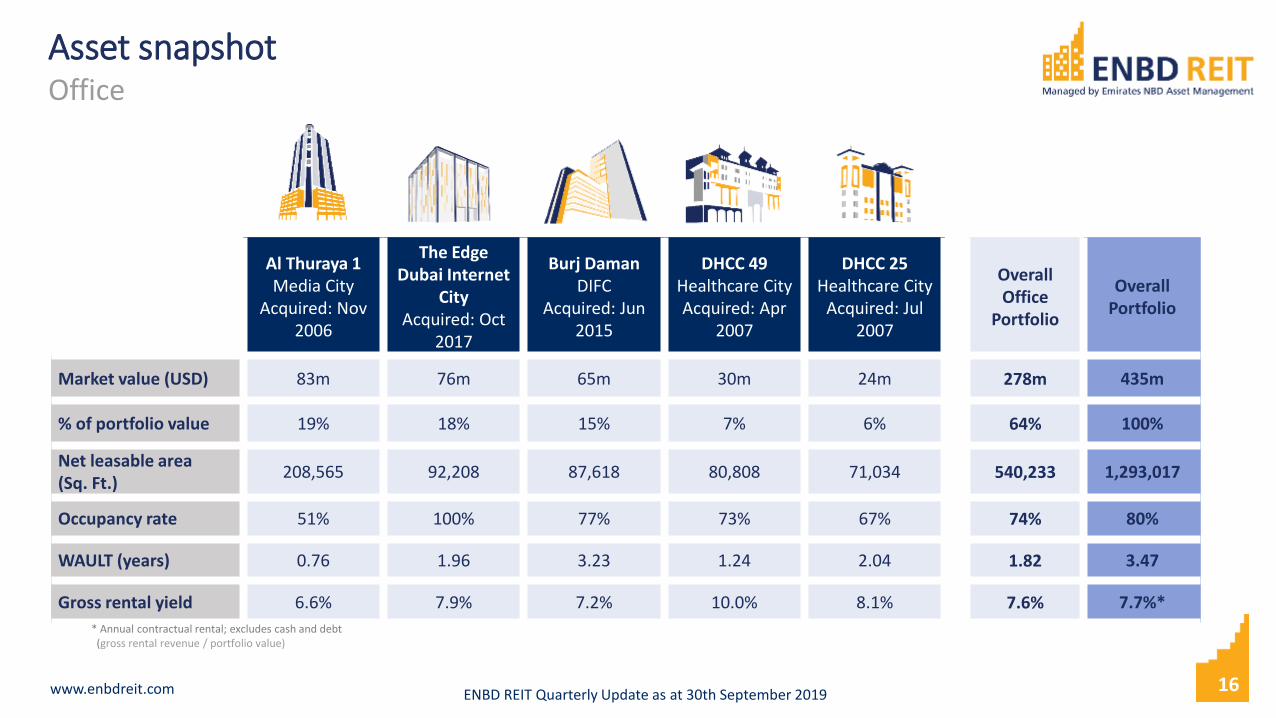
Asset snapshot
Al Thuraya 1Media City
Acquired: Nov 2006
The EdgeDubai Internet
CityAcquired: Oct
2017
Burj DamanDIFC
Acquired: Jun 2015
DHCC 49Healthcare CityAcquired: Apr
2007
DHCC 25Healthcare City
Acquired: Jul 2007
Overall Office
Portfolio
Overall Portfolio
Market value (USD) 83m 76m 65m 30m 24m 278m 435m
% of portfolio value 19% 18% 15% 7% 6% 64% 100%
Net leasable area (Sq. Ft.)
208,565 92,208 87,618 80,808 71,034 540,233 1,293,017
Occupancy rate 51% 100% 77% 73% 67% 74% 80%
WAULT (years) 0.76 1.96 3.23 1.24 2.04 1.82 3.47
Gross rental yield 6.6% 7.9% 7.2% 10.0% 8.1% 7.6% 7.7%*
Office
* Annual contractual rental; excludes cash and debt (gross rental revenue / portfolio value)
16ENBD REIT Quarterly Update as at 30th September 2019
www.enbdreit.com
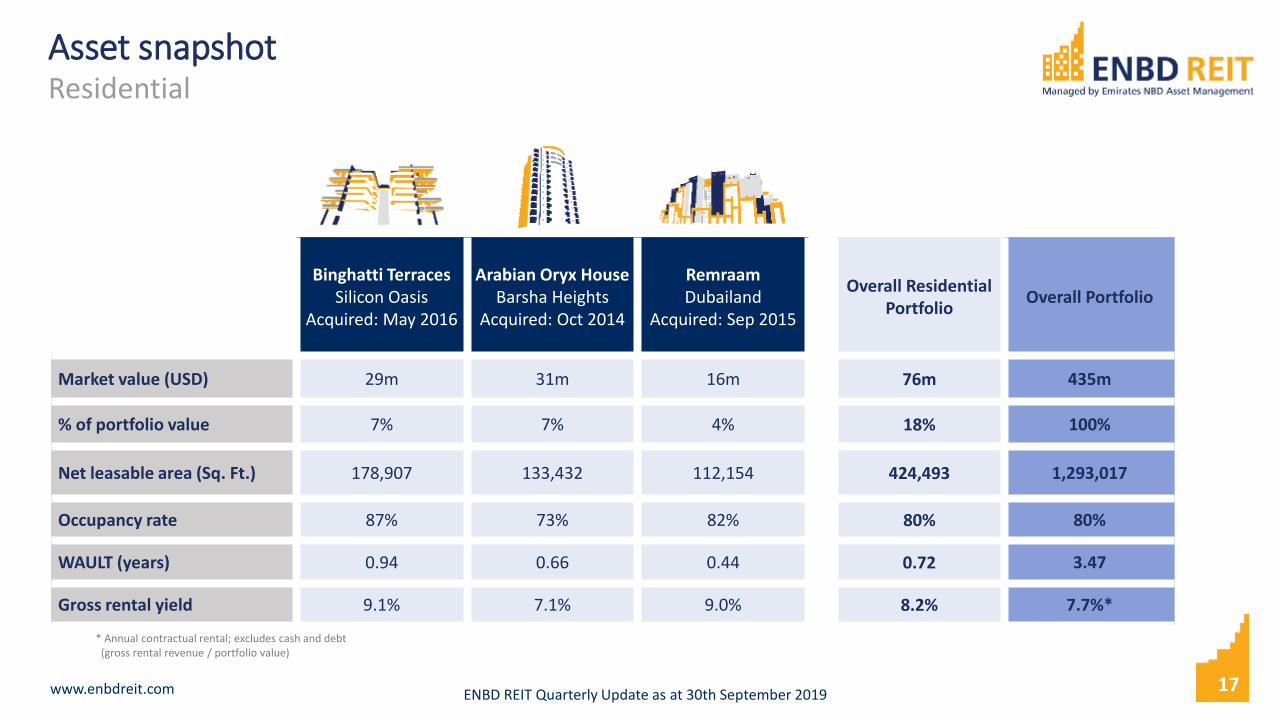
Asset snapshot
Binghatti TerracesSilicon Oasis
Acquired: May 2016
Arabian Oryx HouseBarsha Heights
Acquired: Oct 2014
RemraamDubailand
Acquired: Sep 2015
Overall Residential Portfolio
Overall Portfolio
Market value (USD) 29m 31m 16m 76m 435m
% of portfolio value 7% 7% 4% 18% 100%
Net leasable area (Sq. Ft.) 178,907 133,432 112,154 424,493 1,293,017
Occupancy rate 87% 73% 82% 80% 80%
WAULT (years) 0.94 0.66 0.44 0.72 3.47
Gross rental yield 9.1% 7.1% 9.0% 8.2% 7.7%*
Residential
* Annual contractual rental; excludes cash and debt (gross rental revenue / portfolio value)
17ENBD REIT Quarterly Update as at 30th September 2019
www.enbdreit.com
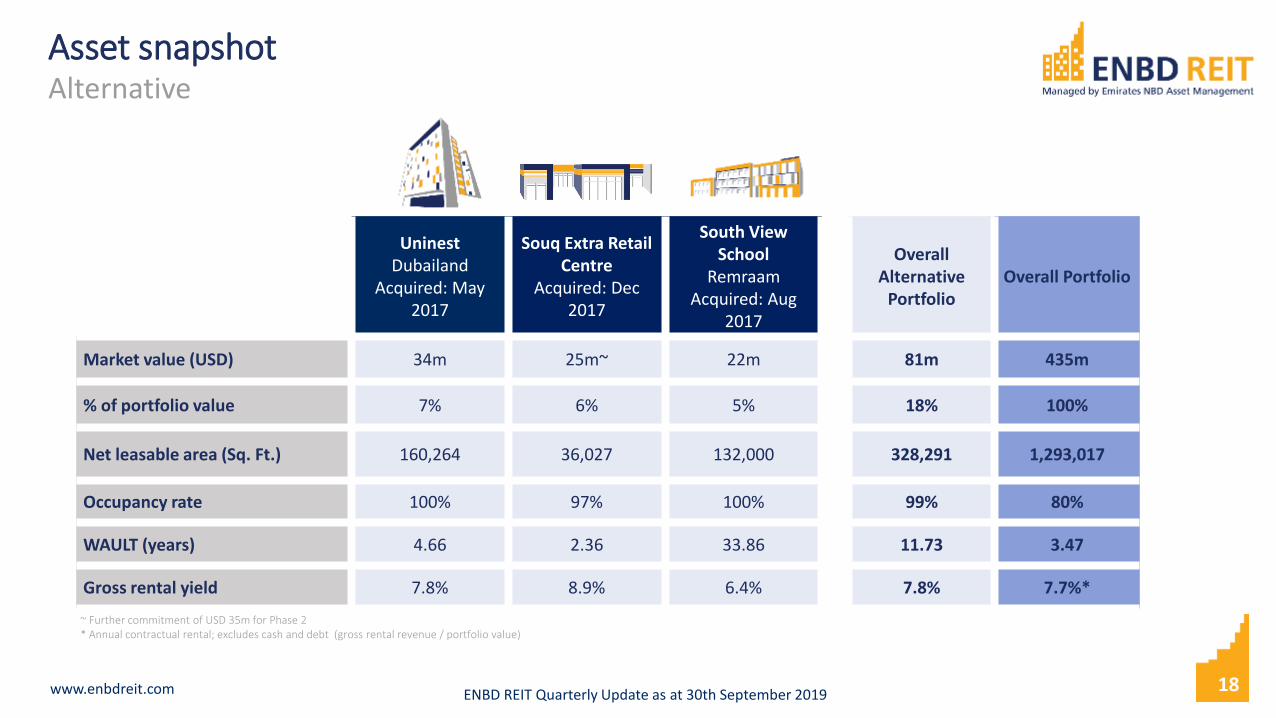
Asset snapshot
UninestDubailand
Acquired: May 2017
Souq Extra Retail Centre
Acquired: Dec 2017
South View School
RemraamAcquired: Aug
2017
Overall Alternative
PortfolioOverall Portfolio
Market value (USD) 34m 25m~ 22m 81m 435m
% of portfolio value 7% 6% 5% 18% 100%
Net leasable area (Sq. Ft.) 160,264 36,027 132,000 328,291 1,293,017
Occupancy rate 100% 97% 100% 99% 80%
WAULT (years) 4.66 2.36 33.86 11.73 3.47
Gross rental yield 7.8% 8.9% 6.4% 7.8% 7.7%*
Alternative
~ Further commitment of USD 35m for Phase 2* Annual contractual rental; excludes cash and debt (gross rental revenue / portfolio value)
18ENBD REIT Quarterly Update as at 30th September 2019

Financials
www.enbdreit.com ENBD REIT Quarterly Update as at 30th September 2019
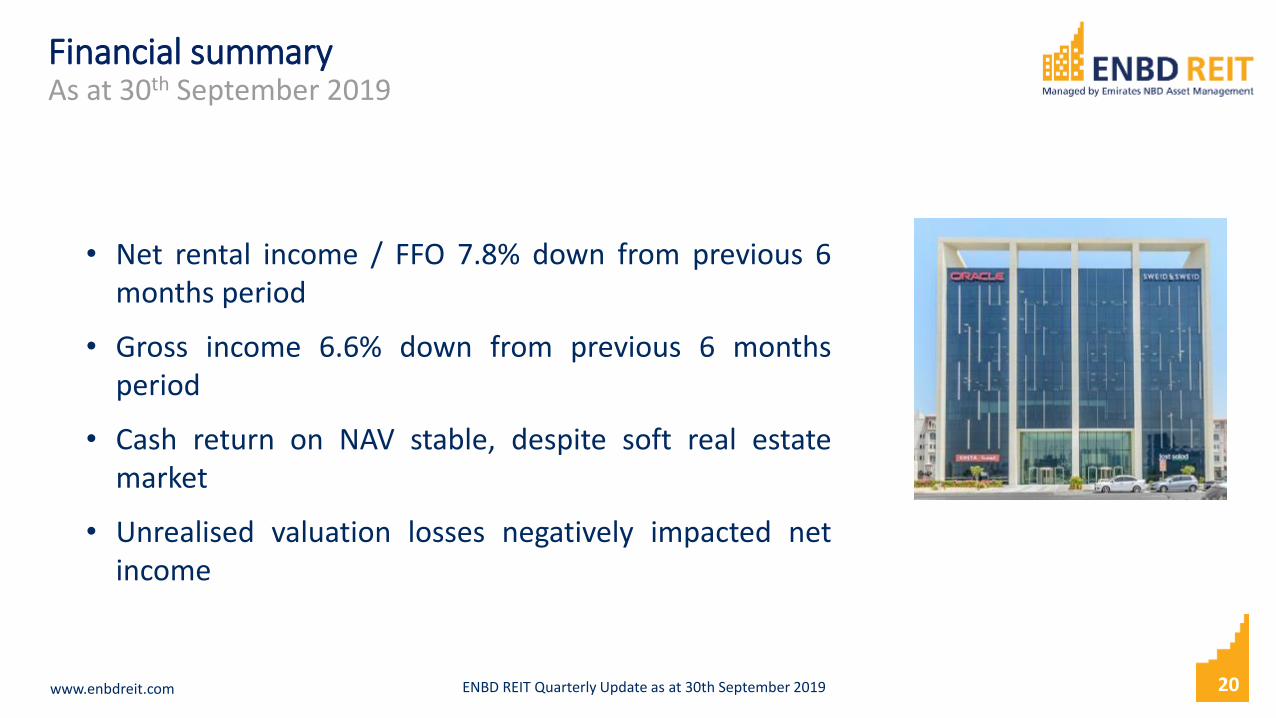
Financial summaryAs at 30th September 2019
20
• Net rental income / FFO 7.8% down from previous 6months period
• Gross income 6.6% down from previous 6 monthsperiod
• Cash return on NAV stable, despite soft real estatemarket
• Unrealised valuation losses negatively impacted netincome
www.enbdreit.com ENBD REIT Quarterly Update as at 30th September 2019
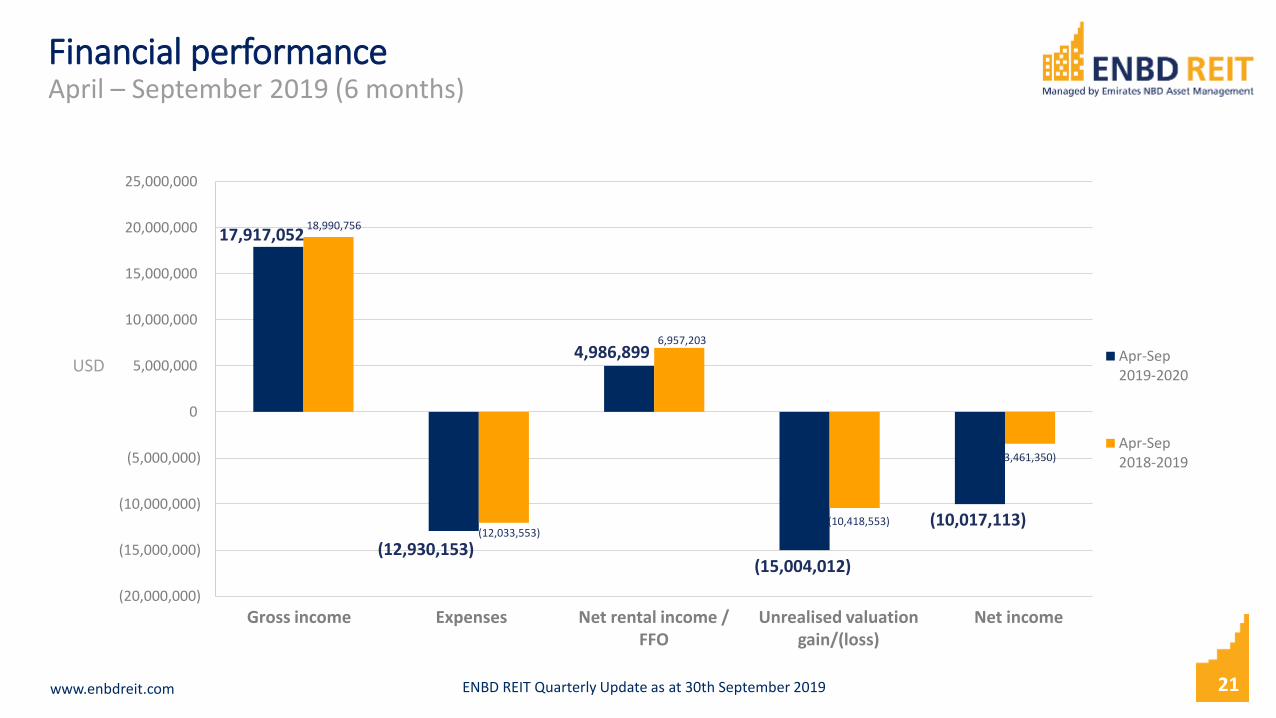
Financial performanceApril – September 2019 (6 months)
21
USD
Gross income Net rental income / FFO
Net incomeExpenses Unrealised valuation gain/(loss)
17,917,052
(12,930,153)
4,986,899
(15,004,012)
(10,017,113)
18,990,756
(12,033,553)
6,957,203
(10,418,553)
(3,461,350)
(20,000,000)
(15,000,000)
(10,000,000)
(5,000,000)
0
5,000,000
10,000,000
15,000,000
20,000,000
25,000,000
Apr-Sep2019-2020
Apr-Sep2018-2019
www.enbdreit.com 22
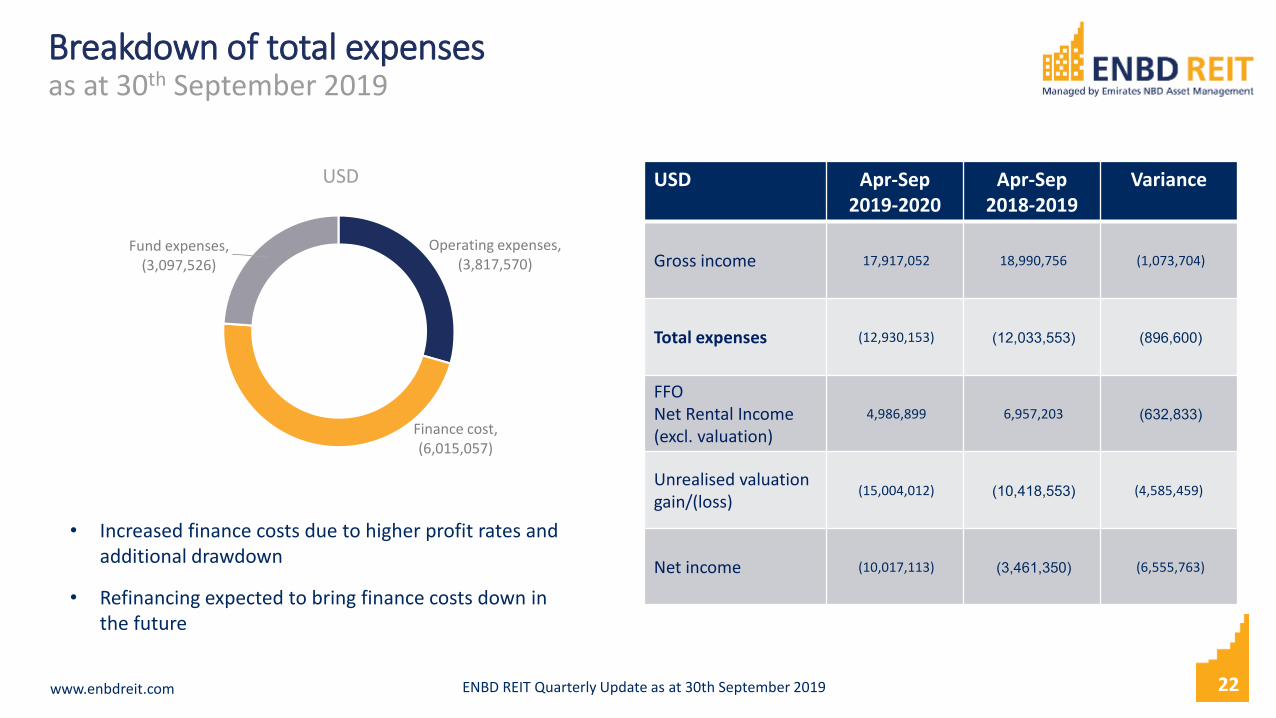
Breakdown of total expensesas at 30th September 2019
ENBD REIT Quarterly Update as at 30th September 2019
Operating expenses, (3,817,570)
Finance cost, (6,015,057)
Fund expenses, (3,097,526)
USD USD Apr-Sep 2019-2020
Apr-Sep 2018-2019
Variance
Gross income 17,917,052 18,990,756 (1,073,704)
Total expenses (12,930,153) (12,033,553) (896,600)
FFONet Rental Income(excl. valuation)
4,986,899 6,957,203 (632,833)
Unrealised valuation gain/(loss)
(15,004,012) (10,418,553) (4,585,459)
Net income (10,017,113) (3,461,350) (6,555,763)
• Increased finance costs due to higher profit rates and additional drawdown
• Refinancing expected to bring finance costs down in the future

Appendix
www.enbdreit.com
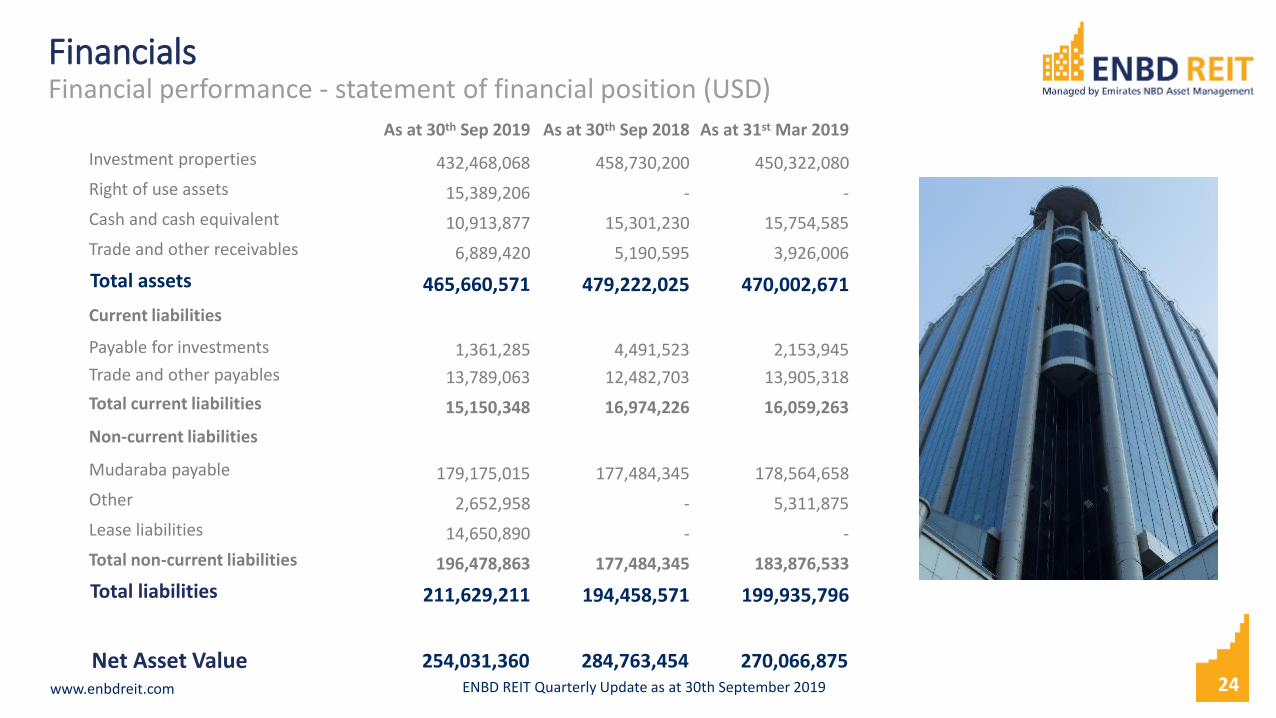
FinancialsFinancial performance - statement of financial position (USD)
24
As at 30th Sep 2019 As at 30th Sep 2018 As at 31st Mar 2019
Investment properties 432,468,068 458,730,200 450,322,080
Right of use assets 15,389,206 - -
Cash and cash equivalent 10,913,877 15,301,230 15,754,585
Trade and other receivables 6,889,420 5,190,595 3,926,006
Total assets 465,660,571 479,222,025 470,002,671
Current liabilities
Payable for investments 1,361,285 4,491,523 2,153,945
Trade and other payables 13,789,063 12,482,703 13,905,318
Total current liabilities 15,150,348 16,974,226 16,059,263
Non-current liabilities
Mudaraba payable 179,175,015 177,484,345 178,564,658
Other 2,652,958 - 5,311,875
Lease liabilities 14,650,890 - -
Total non-current liabilities 196,478,863 177,484,345 183,876,533
Total liabilities 211,629,211 194,458,571 199,935,796
Net Asset Value 254,031,360 284,763,454 270,066,875 ENBD REIT Quarterly Update as at 30th September 2019
www.enbdreit.com 25
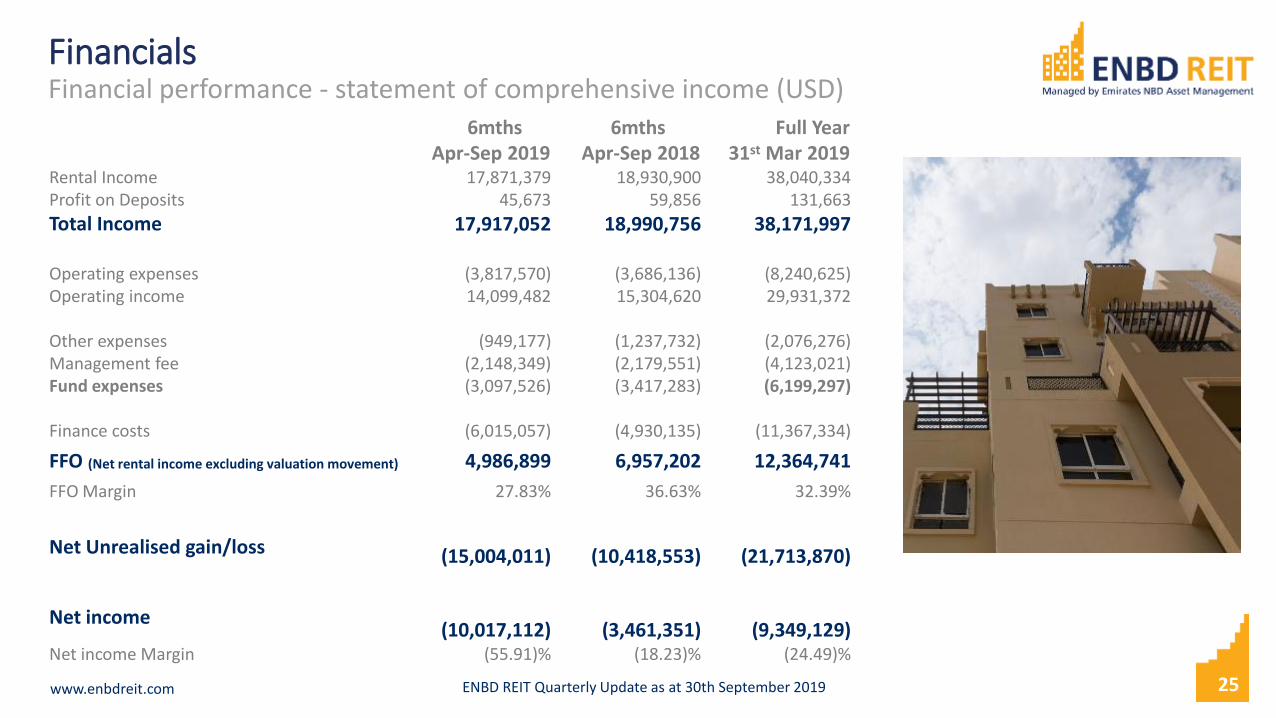
FinancialsFinancial performance - statement of comprehensive income (USD)
6mthsApr-Sep 2019
6mthsApr-Sep 2018
Full Year31st Mar 2019
Rental Income 17,871,379 18,930,900 38,040,334 Profit on Deposits 45,673 59,856 131,663
Total Income 17,917,052 18,990,756 38,171,997
Operating expenses (3,817,570) (3,686,136) (8,240,625)Operating income 14,099,482 15,304,620 29,931,372
Other expenses (949,177) (1,237,732) (2,076,276)Management fee (2,148,349) (2,179,551) (4,123,021)Fund expenses (3,097,526) (3,417,283) (6,199,297)
Finance costs (6,015,057) (4,930,135) (11,367,334)
FFO (Net rental income excluding valuation movement) 4,986,899 6,957,202 12,364,741
FFO Margin 27.83% 36.63% 32.39%
Net Unrealised gain/loss (15,004,011) (10,418,553) (21,713,870)
Net income(10,017,112) (3,461,351) (9,349,129)
Net income Margin (55.91)% (18.23)% (24.49)%
ENBD REIT Quarterly Update as at 30th September 2019
www.enbdreit.com
General [email protected]+971 (0)4 509 3010
Investor RelationsJulia [email protected]+971 (0)4 509 3010
Company SecretaryJean Kenny [email protected]+971 (0)4 428 9221
Tenants/LeasingMelanie [email protected]+971 (0)4 509 3029
MediaGeorge [email protected]+971 (0)4 369 9353
Contact us
ENBD REIT Quarterly Update as at 30th September 2019 26
www.enbdreit.com
Disclaimer
ENBD REIT Quarterly Update as at 30th September 2019
The information, estimates and opinions (“Information”) expressed herein are made in good faith and are based on sources believed to be reliable, but norepresentation or warranty, express or implied, is made as to the accuracy, completeness or correctness of the Information. The Information is not intended to serve asinvestment advice and should not be used as a substitute for independent judgement and advice. This Information has been obtained from or is based upon sourcesbelieved to be reliable, and is believed to be fair and not misleading. The Information contained in this presentation is subject to change without notice. None of ENBDREIT (CEIC) PLC (“ENBD REIT” or the “Fund”), Emirates NBD Asset Management Limited (“Emirates NBD AM”), Emirates NBD Group nor any of their respectivedirectors, employees or agents (the “ENBD Parties”) give any representation or warranty as to the reliability, accuracy or completeness of the Information, nor, to theextent permitted by relevant laws and regulations, do they accept any responsibility or liability arising in any way (including by negligence) for errors in, or omissionsfrom, the Information. None of the ENBD Parties give any undertaking to provide additional information to update this material, or to correct any inaccuracies whichmay become apparent. This document is provided for informational and illustrative purposes only. It does not constitute a solicitation, recommendation or offer to buyor sell any shares or other securities of the Fund, any specific investment product or to subscribe to any specific investment management or advisory service.Prospective investors in ENBD REIT should obtain and carefully read the Fund’s most recent prospectus and supplement, if any, as well as seek separate, independentfinancial advice prior to making an investment in ENBD REIT in order to fully assess the suitability, lawfulness and risks involved.
This presentation is not for distribution to the general public but for intended recipients only and may not be published, circulated, reproduced or distributed in wholeor part to any other person without the written consent of Emirates NBD AM. This presentation is directed to persons authorised to invest in ENBD REIT and residing injurisdictions where the Fund is authorised for distribution or where no such authorisation is required. Investment in ENBD REIT is intended only for investors whounderstand the risks involved in investing in the Fund and can withstand any potential loss therefrom. Neither ENBD REIT’s historical performance nor that of itspredecessor fund, Emirates Real Estate Fund Limited, is indicative of the future performance of the Fund and should not be used as a proxy for the future or likelyperformance of the Fund. The value of the investment in and the income from ENBD REIT can fall as well as rise as the Fund is subject to investment risks, including thepossible loss of the whole of the principal amount invested. The Information does not have any regard to the specific investment objectives, financial situation or theparticular needs of any person.
All Shari’a compliant products and services are approved by the Shari’a Supervisory Board of Emirates NBD AM.
This Information has been prepared by Emirates NBD AM for ENBD REIT. Emirates NBD AM and ENBD REIT are regulated by the Dubai Financial Services Authority.
27