Quarterly Service Performance Review Fourth … Service Performance Review Fourth Quarter, FY 2015...
39
0 Quarterly Service Performance Review Fourth Quarter, FY 2015 April - June, 2015 Engineering & Operations Committee August 13, 2015
Transcript of Quarterly Service Performance Review Fourth … Service Performance Review Fourth Quarter, FY 2015...
0
Quarterly Service Performance Review
Fourth Quarter, FY 2015
April - June, 2015
Engineering & Operations Committee
August 13, 2015
1
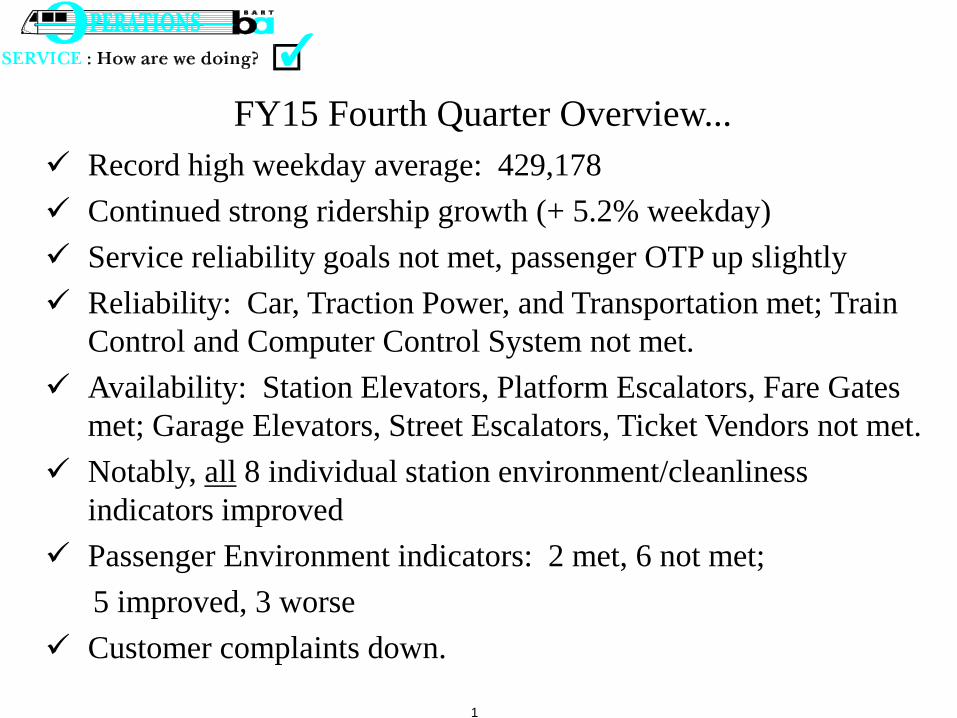
FY15 Fourth Quarter Overview...
Record high weekday average: 429,178
Continued strong ridership growth (+ 5.2% weekday)
Service reliability goals not met, passenger OTP up slightly
Reliability: Car, Traction Power, and Transportation met; Train
Control and Computer Control System not met.
Availability: Station Elevators, Platform Escalators, Fare Gates
met; Garage Elevators, Street Escalators, Ticket Vendors not met.
Notably, all 8 individual station environment/cleanliness
indicators improved
Passenger Environment indicators: 2 met, 6 not met;
5 improved, 3 worse
Customer complaints down.

2
Customer Ridership N
um
ber
of
Aver
age
Wee
kday
Tri
ps
340,000
350,000
360,000
370,000
380,000
390,000
400,000
410,000
420,000
430,000
440,000
450,000
April May June July Aug Sept Oct Nov Dec Jan
2015
Feb Mar April May June
Res ults
Goal
Average weekday ridership (429,178) up 5.2% from same quarter last year
Core weekday ridership up by 5.3% from same quarter last year
SFO Extension weekday ridership up by 4.3% from same quarter last year
Saturday and Sunday down by 0.9% and 2.1%, respectively, over same
quarter last year
Second highest ridership day ever; 548,078 June 19 Warriors Parade in
Oakland
3
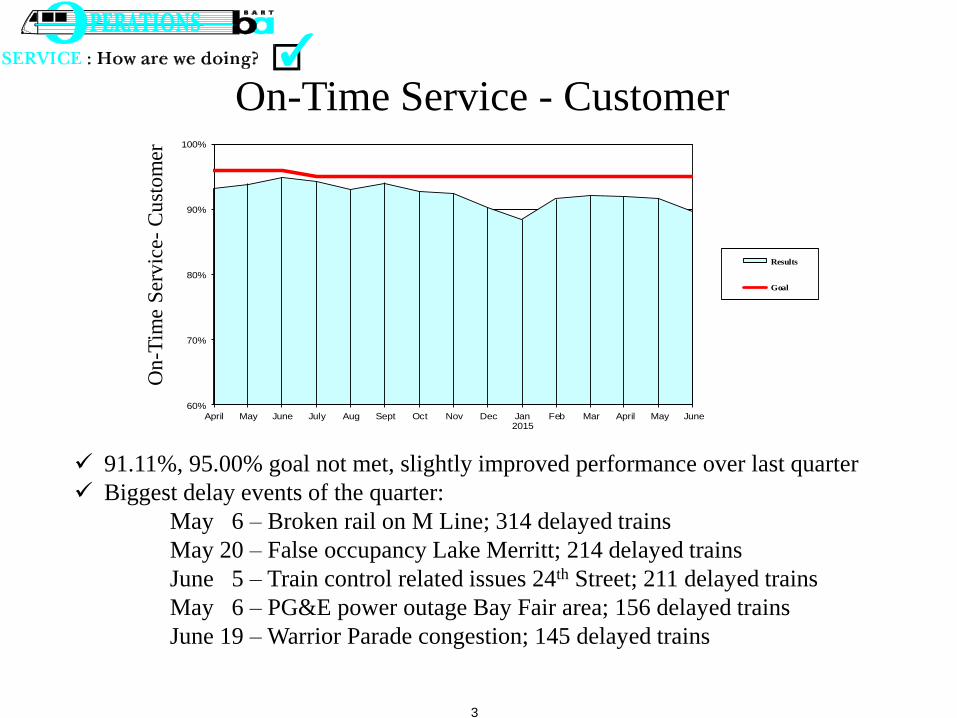
On-Time Service - Customer
On
-Tim
e S
erv
ice-
Cu
sto
mer
60%
70%
80%
90%
100%
April May June July Aug Sept Oct Nov Dec Jan2015
Feb Mar April May June
Results
Goal
91.11%, 95.00% goal not met, slightly improved performance over last quarter
Biggest delay events of the quarter:
May 6 – Broken rail on M Line; 314 delayed trains
May 20 – False occupancy Lake Merritt; 214 delayed trains
June 5 – Train control related issues 24th Street; 211 delayed trains
May 6 – PG&E power outage Bay Fair area; 156 delayed trains
June 19 – Warrior Parade congestion; 145 delayed trains
4
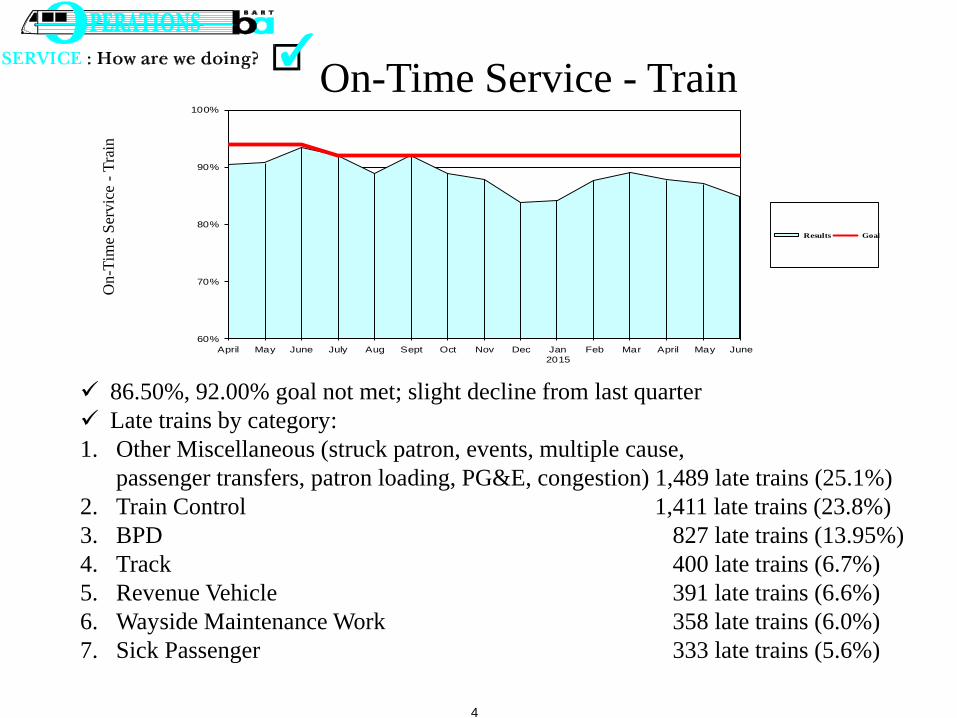
On-Time Service - Train O
n-T
ime
Ser
vic
e -
Tra
in
60%
70%
80%
90%
100%
April May June July Aug Sept Oct Nov Dec Jan
2015
Feb Mar April May June
Results Goal
86.50%, 92.00% goal not met; slight decline from last quarter
Late trains by category:
1. Other Miscellaneous (struck patron, events, multiple cause,
passenger transfers, patron loading, PG&E, congestion) 1,489 late trains (25.1%)
2. Train Control 1,411 late trains (23.8%)
3. BPD 827 late trains (13.95%)
4. Track 400 late trains (6.7%)
5. Revenue Vehicle 391 late trains (6.6%)
6. Wayside Maintenance Work 358 late trains (6.0%)
7. Sick Passenger 333 late trains (5.6%)
5
0.0
0.5
1.0
1.5
2.0
2.5
3.0
3.5
4.0
4.5
5.0
April May June July Aug Sept Oct Nov Dec Jan2015
Feb Mar April May June
Results
Goal
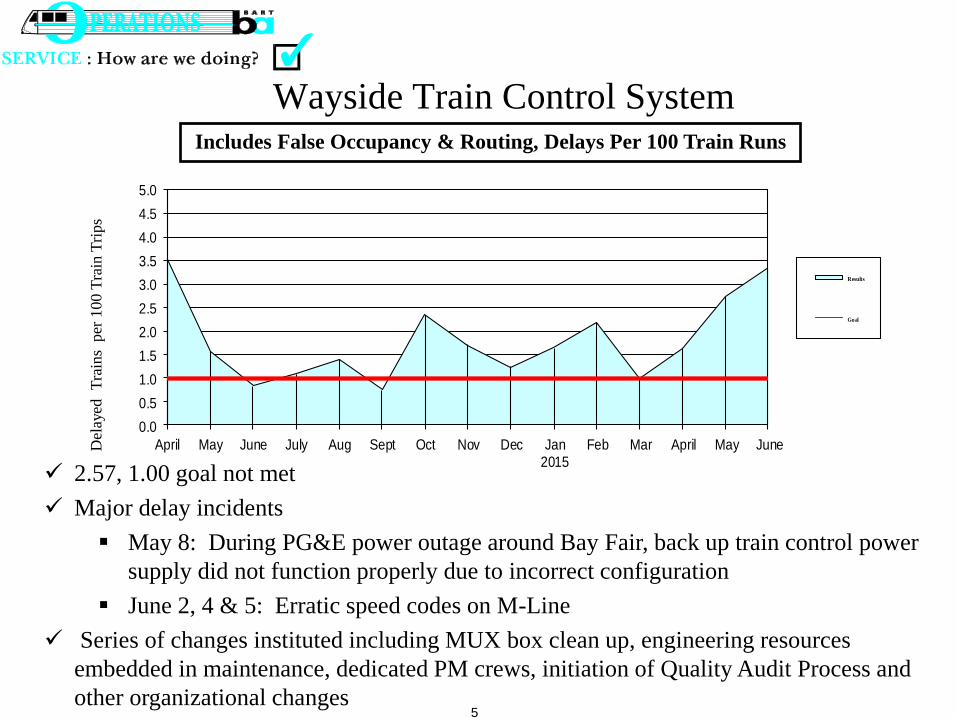
Wayside Train Control System
2.57, 1.00 goal not met
Major delay incidents
May 8: During PG&E power outage around Bay Fair, back up train control power
supply did not function properly due to incorrect configuration
June 2, 4 & 5: Erratic speed codes on M-Line
Series of changes instituted including MUX box clean up, engineering resources
embedded in maintenance, dedicated PM crews, initiation of Quality Audit Process and
other organizational changes
Includes False Occupancy & Routing, Delays Per 100 Train Runs
Del
ayed
T
rain
s p
er 1
00 T
rain
Tri
ps
6
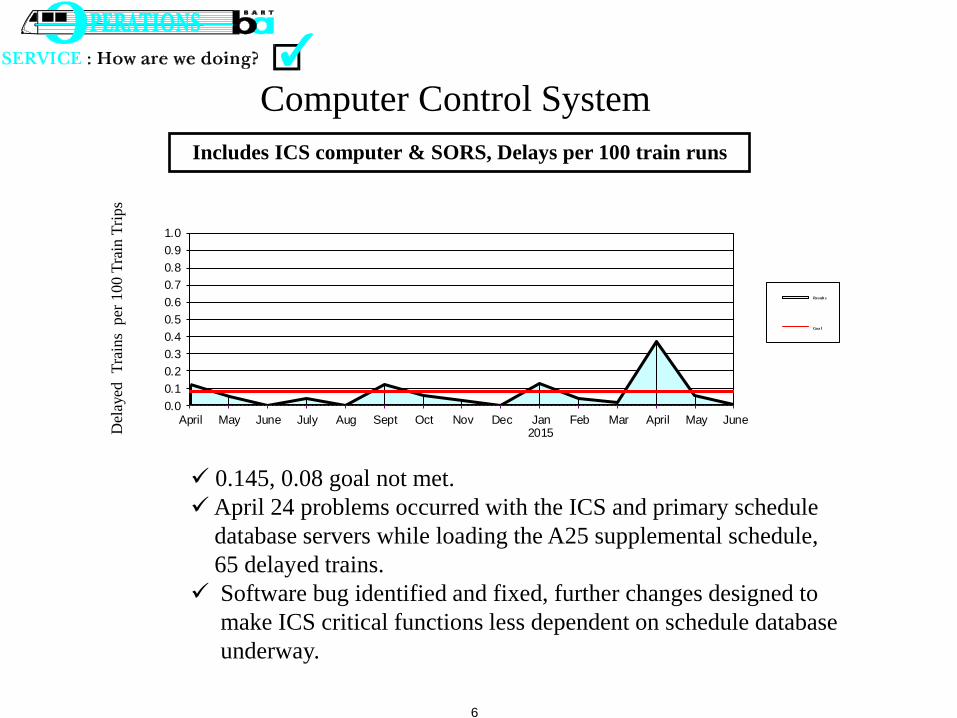
Computer Control System
0.0
0.1
0.2
0.3
0.4
0.5
0.6
0.7
0.8
0.9
1.0
April May June July Aug Sept Oct Nov Dec Jan2015
Feb Mar April May June
Result s
Goa l
Includes ICS computer & SORS, Delays per 100 train runs
Del
ayed
T
rain
s p
er 1
00 T
rain
Tri
ps
0.145, 0.08 goal not met.
April 24 problems occurred with the ICS and primary schedule
database servers while loading the A25 supplemental schedule,
65 delayed trains.
Software bug identified and fixed, further changes designed to
make ICS critical functions less dependent on schedule database
underway.
7
0.0
0.5
1.0
1.5
April May June July Aug Sept Oct Nov Dec Jan2015
Feb Mar April May June
Resul ts
Go al
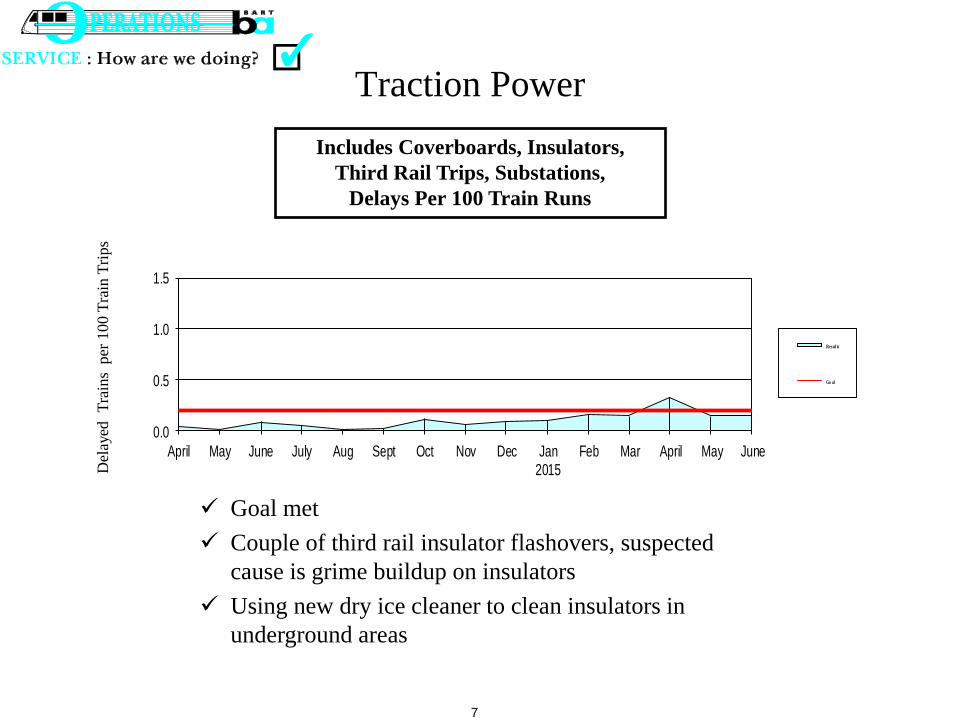
Goal met
Couple of third rail insulator flashovers, suspected
cause is grime buildup on insulators
Using new dry ice cleaner to clean insulators in
underground areas
Traction Power
Includes Coverboards, Insulators,
Third Rail Trips, Substations,
Delays Per 100 Train Runs
Del
ayed
T
rain
s p
er 1
00 T
rain
Tri
ps
8
0.0
0.5
1.0
1.5
April May June July Aug Sept Oct Nov Dec Jan2015
Feb Mar April May June
Results
Goal
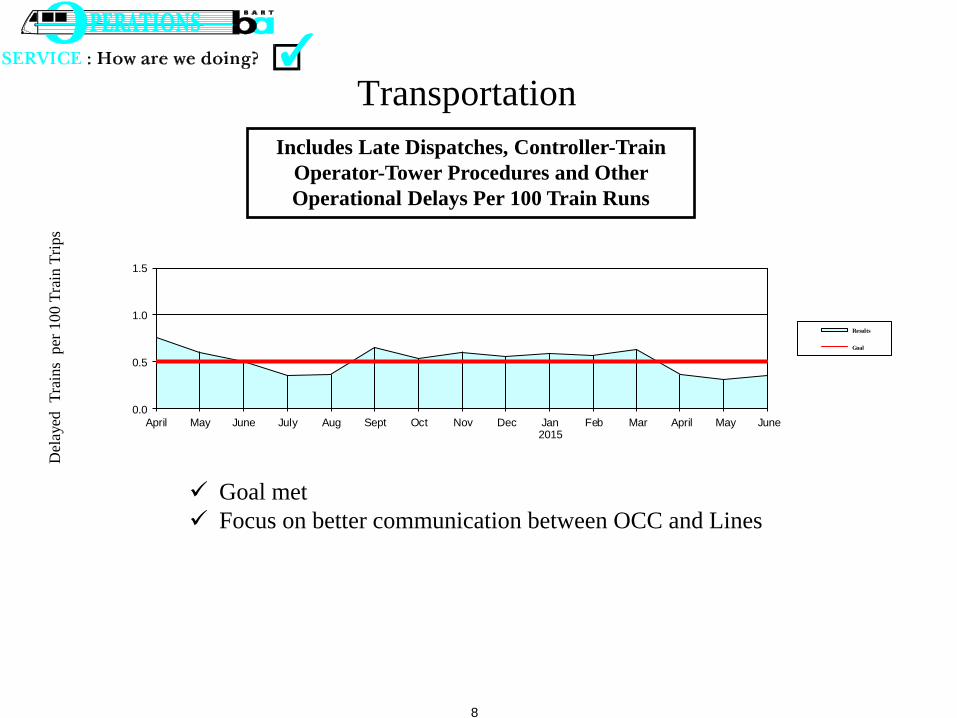
Transportation
Includes Late Dispatches, Controller-Train
Operator-Tower Procedures and Other
Operational Delays Per 100 Train Runs
Del
ayed
T
rain
s p
er 1
00 T
rain
Tri
ps
Goal met
Focus on better communication between OCC and Lines
9
0.0
0.5
1.0
1.5
2.0
2.5
3.0
April May June July Aug Sept Oct Nov Dec Jan2015
Feb Mar April May June
Results
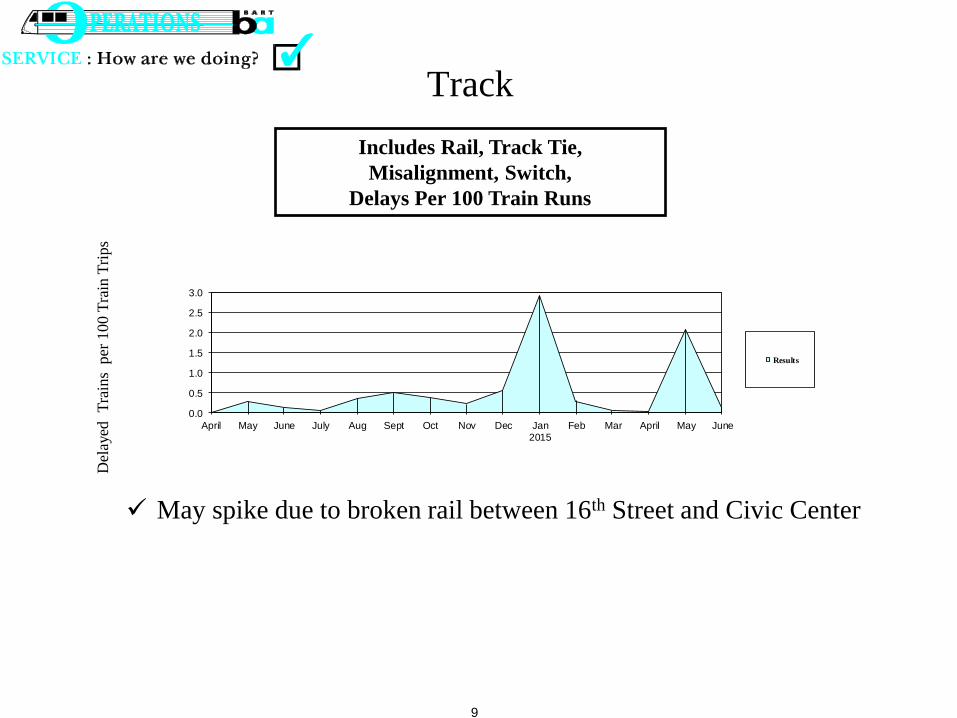
May spike due to broken rail between 16th Street and Civic Center
Track
Includes Rail, Track Tie,
Misalignment, Switch,
Delays Per 100 Train Runs
Del
ayed
T
rain
s p
er 1
00 T
rain
Tri
ps
10
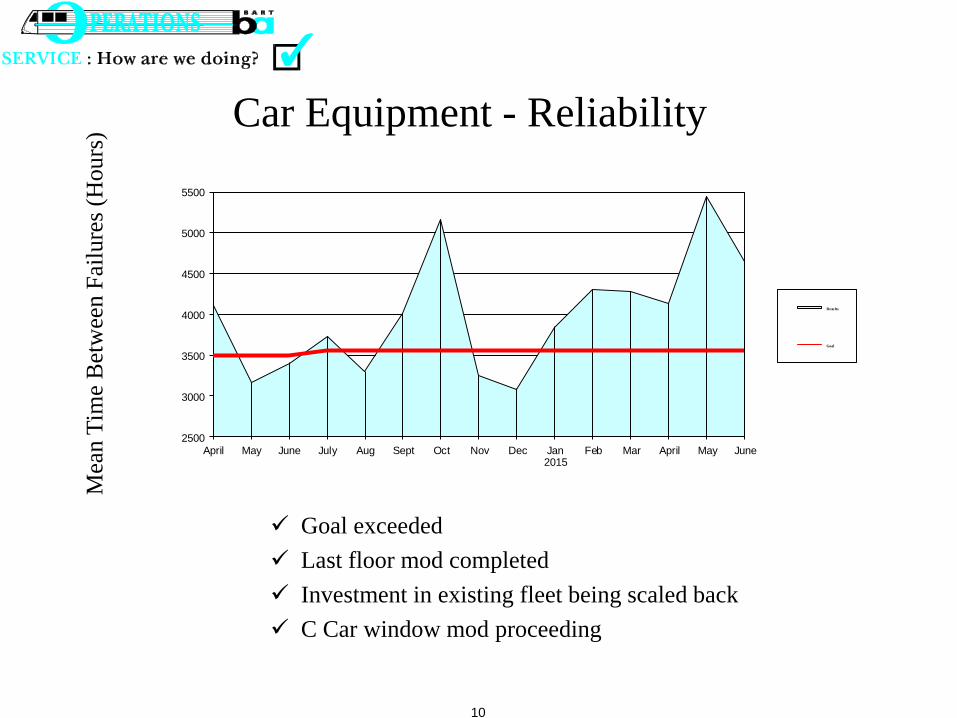
Car Equipment - Reliability M
ean T
ime
Bet
wee
n F
ailu
res
(Hours
)
2500
3000
3500
4000
4500
5000
5500
April May June July Aug Sept Oct Nov Dec Jan2015
Feb Mar April May June
Resu lts
Goal
Goal exceeded
Last floor mod completed
Investment in existing fleet being scaled back
C Car window mod proceeding
11
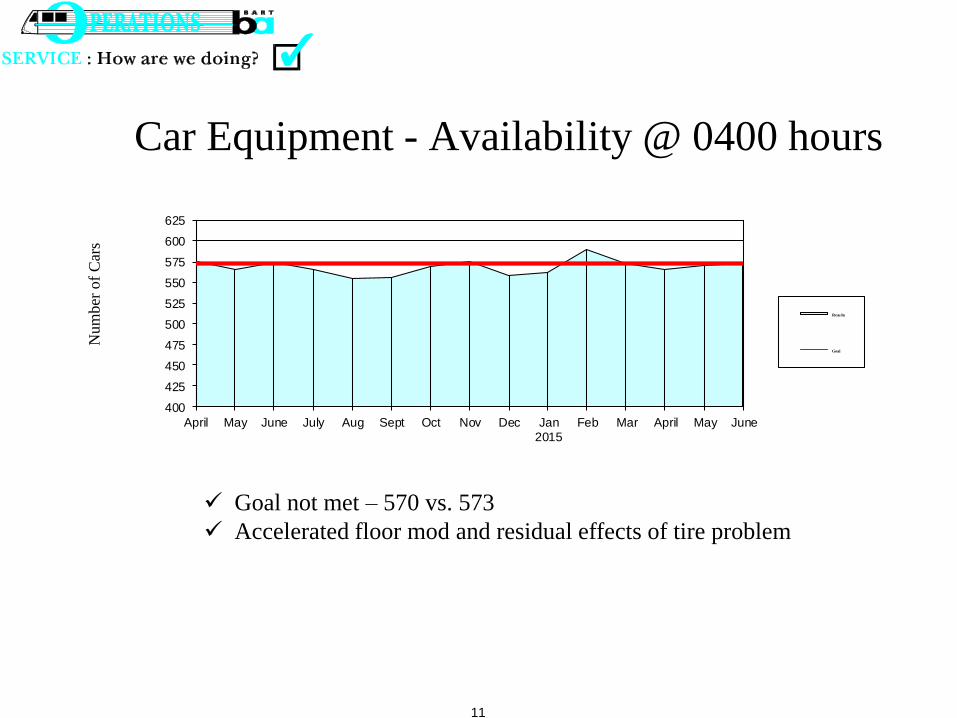
Car Equipment - Availability @ 0400 hours
Num
ber
of
Car
s
400
425
450
475
500
525
550
575
600
625
April May June July Aug Sept Oct Nov Dec Jan2015
Feb Mar April May June
Resu lts
Goal
Goal not met – 570 vs. 573
Accelerated floor mod and residual effects of tire problem
12
80%
85%
90%
95%
100%
April May June July Aug Sept Oct Nov Dec Jan2015
Feb Mar April May June
Active
Goal
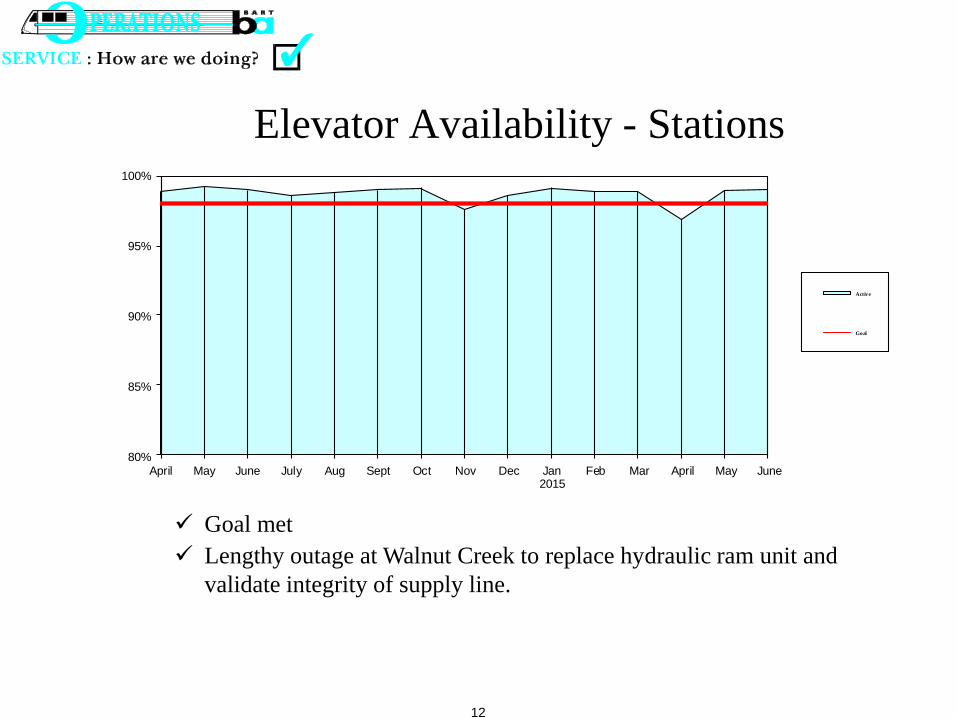
Elevator Availability - Stations
Goal met
Lengthy outage at Walnut Creek to replace hydraulic ram unit and
validate integrity of supply line.
13
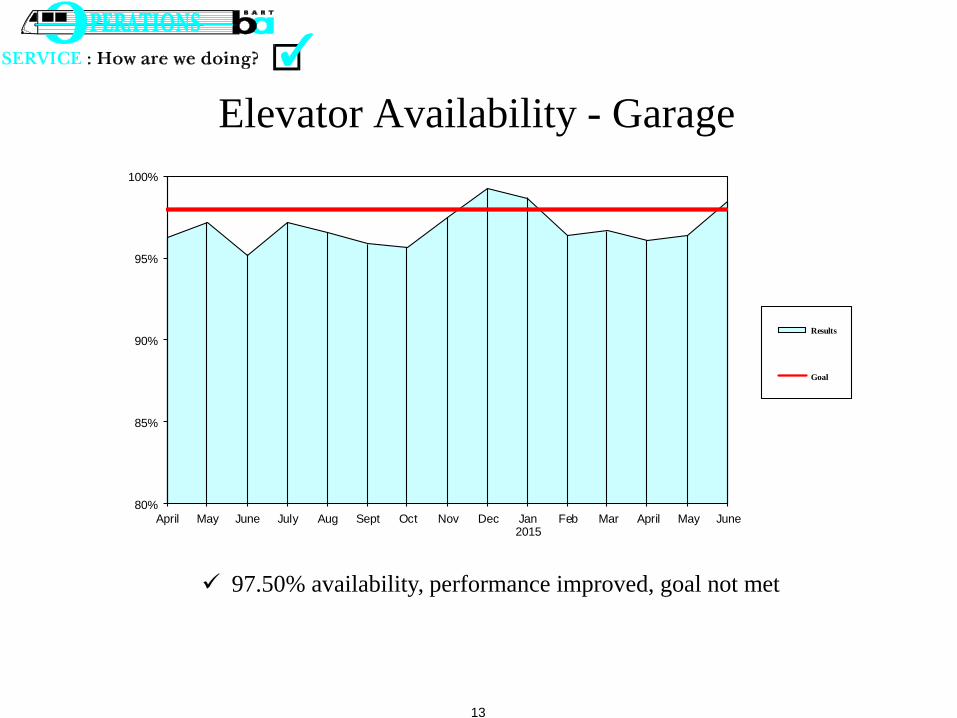
Elevator Availability - Garage
80%
85%
90%
95%
100%
April May June July Aug Sept Oct Nov Dec Jan2015
Feb Mar April May June
Results
Goal
97.50% availability, performance improved, goal not met
14
60%
70%
80%
90%
100%
April May June July Aug Sept Oct Nov Dec Jan 2015 Feb Mar April May June
Resul ts
Goal
We ighte d Avai labili ty
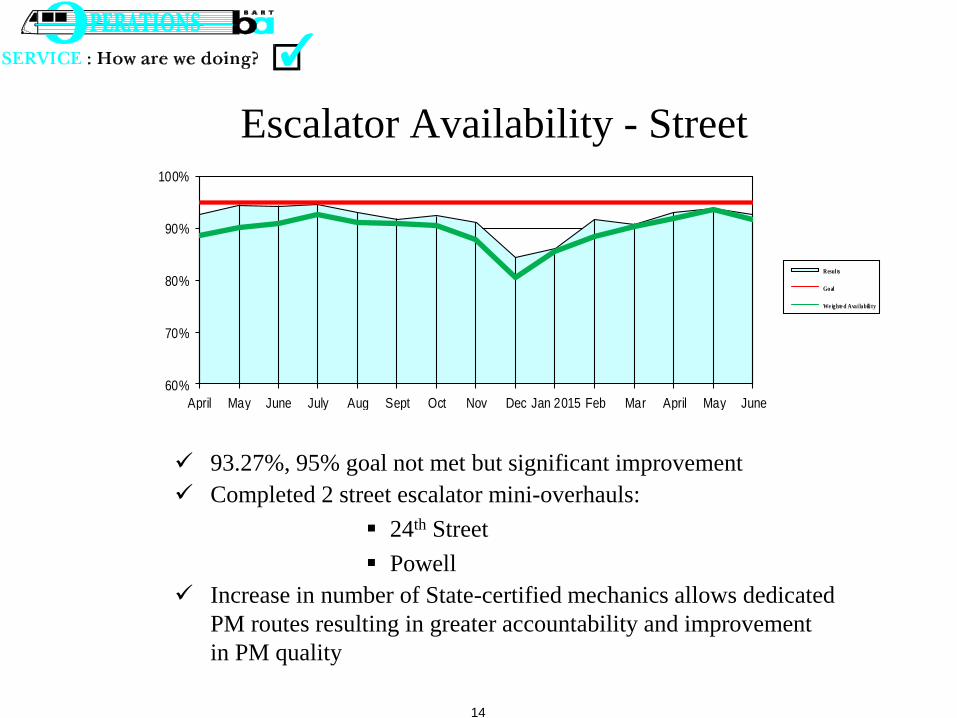
Escalator Availability - Street
93.27%, 95% goal not met but significant improvement
Completed 2 street escalator mini-overhauls:
24th Street
Powell
Increase in number of State-certified mechanics allows dedicated
PM routes resulting in greater accountability and improvement
in PM quality
15
60%
70%
80%
90%
100%
April May June July Aug Sept Oct Nov Dec Jan 2015 Feb Mar April May June
Resul ts
Go al
Wei ght ed A vail abi lit y
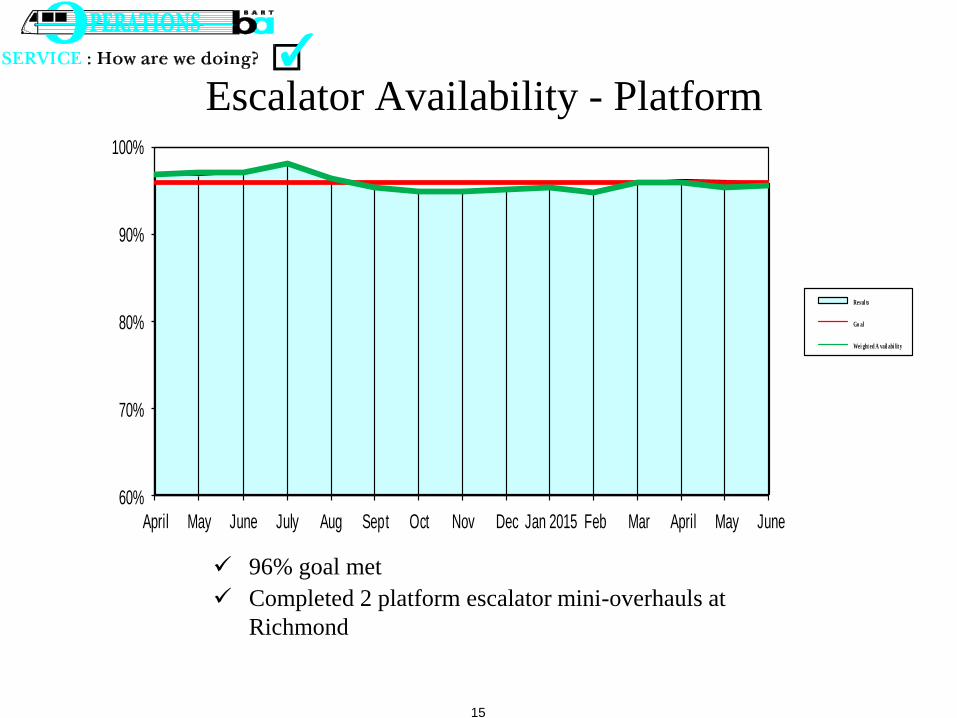
Escalator Availability - Platform
96% goal met
Completed 2 platform escalator mini-overhauls at
Richmond
16
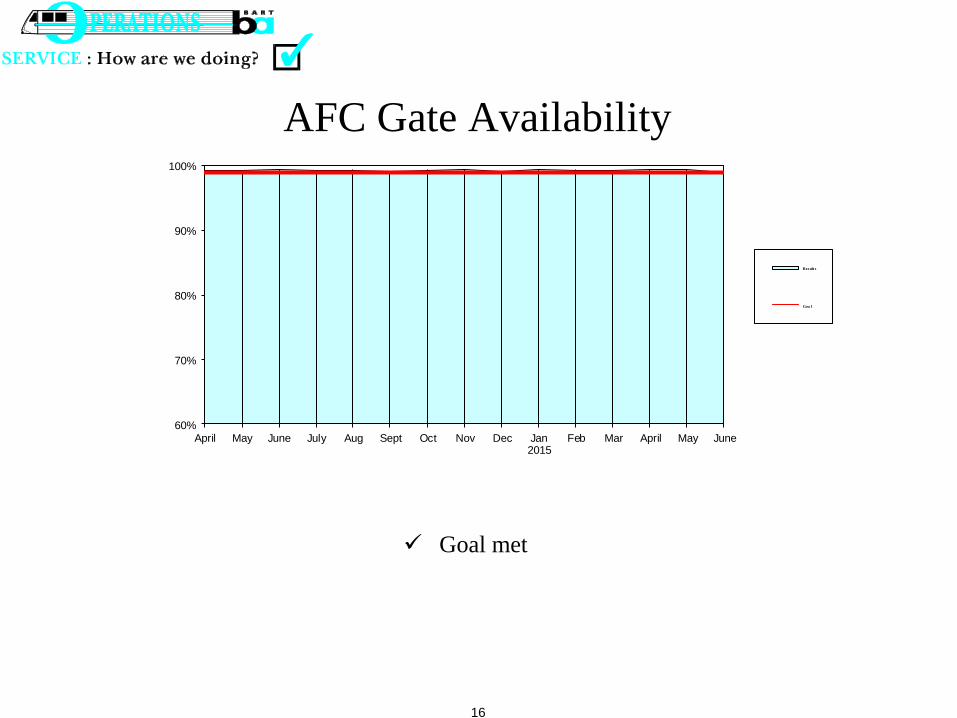
AFC Gate Availability
60%
70%
80%
90%
100%
April May June July Aug Sept Oct Nov Dec Jan2015
Feb Mar April May June
Result s
Goa l
Goal met
17
60%
70%
80%
90%
100%
April May June July Aug Sept Oct Nov Dec Jan2015
Feb Mar April May June
Resul ts
Goal
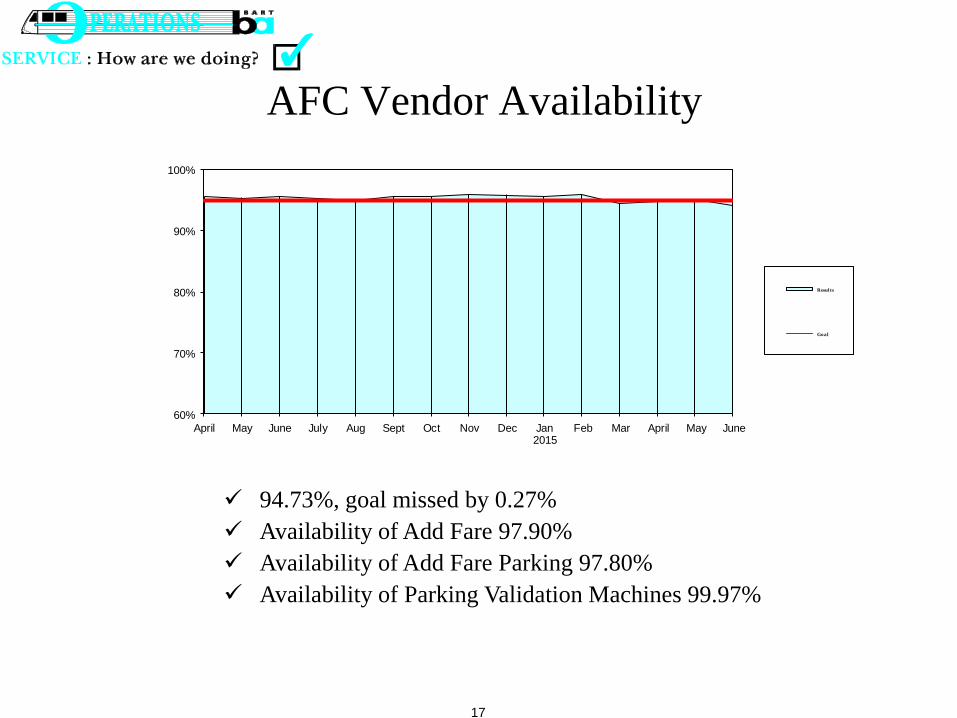
AFC Vendor Availability
94.73%, goal missed by 0.27%
Availability of Add Fare 97.90%
Availability of Add Fare Parking 97.80%
Availability of Parking Validation Machines 99.97%
18
2.78 2.75 2.72 2.70 2.78
1
2
3
4
FY2014 Qtr 4 FY2015 Qtr 1 FY2015 Qtr 2 FY2015 Qtr 3 FY2015 Qtr 4
Results
Goal
Environment - Outside Stations
Composite rating of:
Walkways & Entry Plaza Cleanliness (50%) 2.69
BART Parking Lot Cleanliness (25%) 3.02
Appearance of BART Landscaping (25%) 2.73
Goal not met but each individual indicator improved
Cleanliness ratings of either Excellent or Good:
Walkways/Entry Plazas: 63.5% Parking Lots: 80.7%
Landscaping Appearance: 65.6%
Ratings guide:
4 = Excellent
3 = Good
2.86 = Goal
2 = Only Fair
1 = Poor
19
2.75 2.75 2.71 2.65 2.74
1
2
3
4
FY2014 Qtr 4 FY2015 Qtr 1 FY2015 Qtr 2 FY2015 Qtr 3 FY2015 Qtr 4
Results
Goal
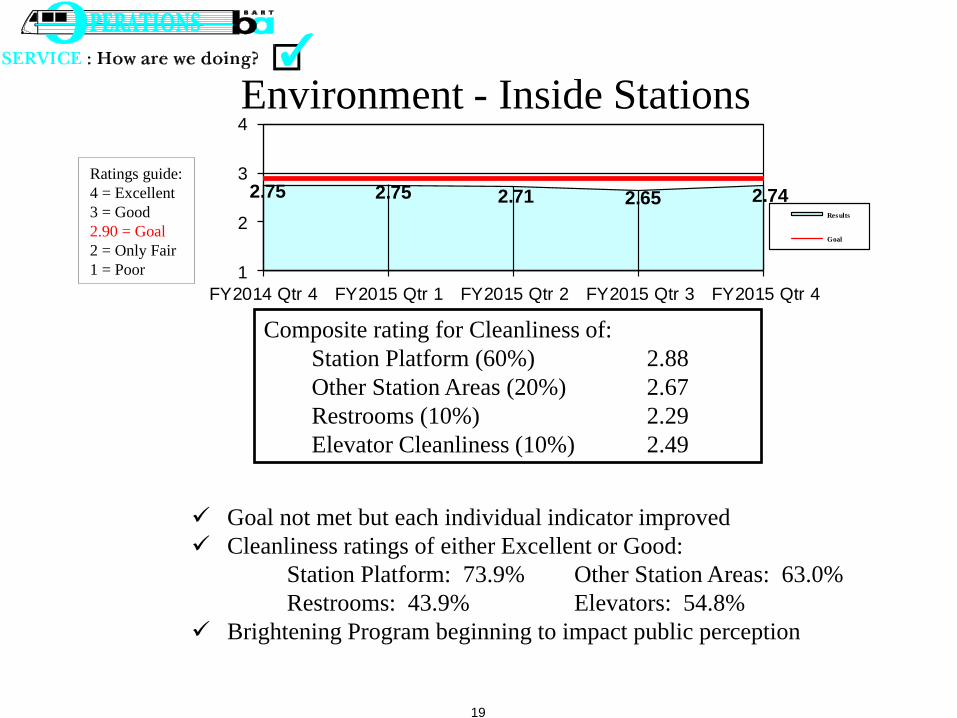
Environment - Inside Stations
Goal not met but each individual indicator improved
Cleanliness ratings of either Excellent or Good:
Station Platform: 73.9% Other Station Areas: 63.0%
Restrooms: 43.9% Elevators: 54.8%
Brightening Program beginning to impact public perception
Composite rating for Cleanliness of:
Station Platform (60%) 2.88
Other Station Areas (20%) 2.67
Restrooms (10%) 2.29
Elevator Cleanliness (10%) 2.49
Ratings guide:
4 = Excellent
3 = Good
2.90 = Goal
2 = Only Fair
1 = Poor
20
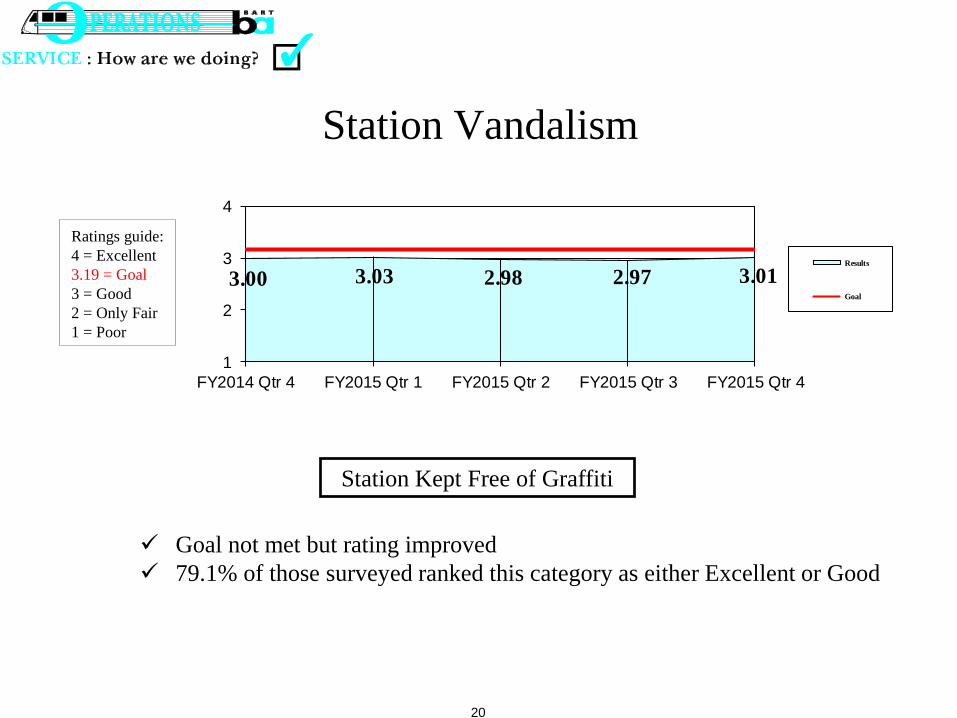
Station Vandalism
3.00 3.03 2.98 2.97 3.01
1
2
3
4
FY2014 Qtr 4 FY2015 Qtr 1 FY2015 Qtr 2 FY2015 Qtr 3 FY2015 Qtr 4
Results
Goal
Goal not met but rating improved
79.1% of those surveyed ranked this category as either Excellent or Good
Station Kept Free of Graffiti
Ratings guide:
4 = Excellent
3.19 = Goal
3 = Good
2 = Only Fair
1 = Poor
21
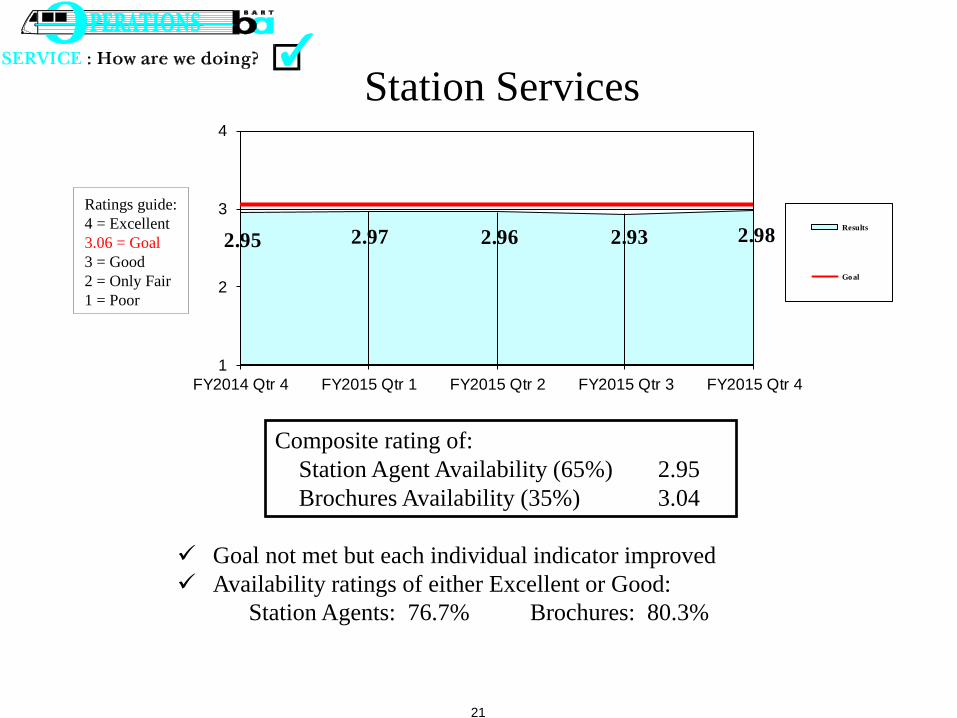
Station Services
2.95 2.97 2.96 2.93 2.98
1
2
3
4
FY2014 Qtr 4 FY2015 Qtr 1 FY2015 Qtr 2 FY2015 Qtr 3 FY2015 Qtr 4
Results
Goal
Composite rating of:
Station Agent Availability (65%) 2.95
Brochures Availability (35%) 3.04
Goal not met but each individual indicator improved
Availability ratings of either Excellent or Good:
Station Agents: 76.7% Brochures: 80.3%
Ratings guide:
4 = Excellent
3.06 = Goal
3 = Good
2 = Only Fair
1 = Poor
22
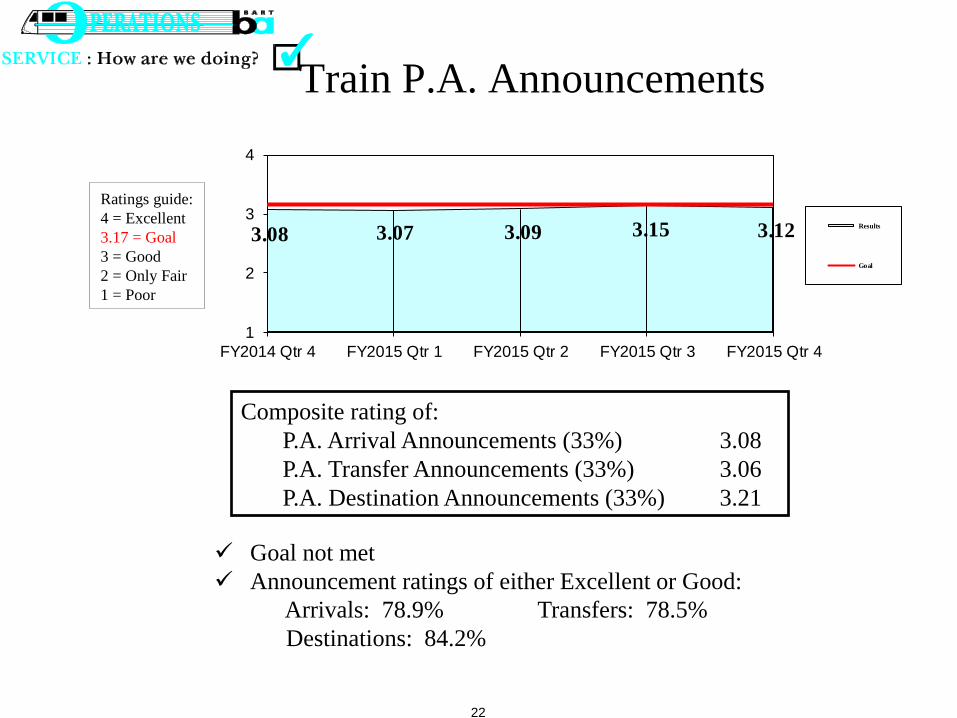
Train P.A. Announcements
3.08 3.07 3.09 3.15 3.12
1
2
3
4
FY2014 Qtr 4 FY2015 Qtr 1 FY2015 Qtr 2 FY2015 Qtr 3 FY2015 Qtr 4
Results
Goal
Goal not met
Announcement ratings of either Excellent or Good:
Arrivals: 78.9% Transfers: 78.5%
Destinations: 84.2%
Composite rating of:
P.A. Arrival Announcements (33%) 3.08
P.A. Transfer Announcements (33%) 3.06
P.A. Destination Announcements (33%) 3.21
Ratings guide:
4 = Excellent
3.17 = Goal
3 = Good
2 = Only Fair
1 = Poor
23
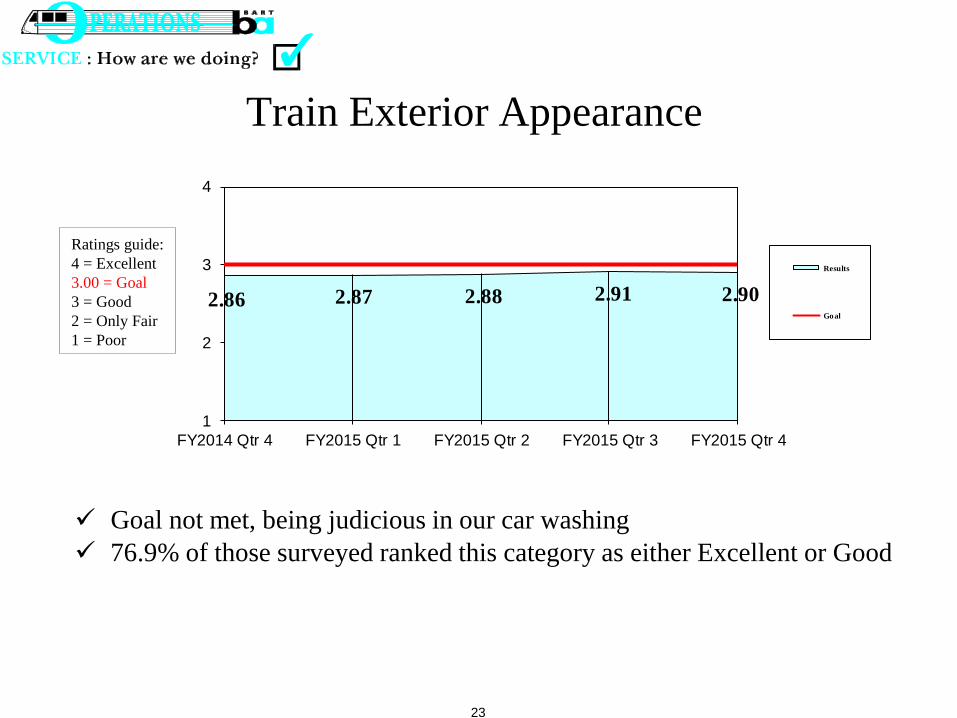
Train Exterior Appearance
Goal not met, being judicious in our car washing
76.9% of those surveyed ranked this category as either Excellent or Good
2.86 2.87 2.88 2.91 2.90
1
2
3
4
FY2014 Qtr 4 FY2015 Qtr 1 FY2015 Qtr 2 FY2015 Qtr 3 FY2015 Qtr 4
Results
Goal
Ratings guide:
4 = Excellent
3.00 = Goal
3 = Good
2 = Only Fair
1 = Poor
24
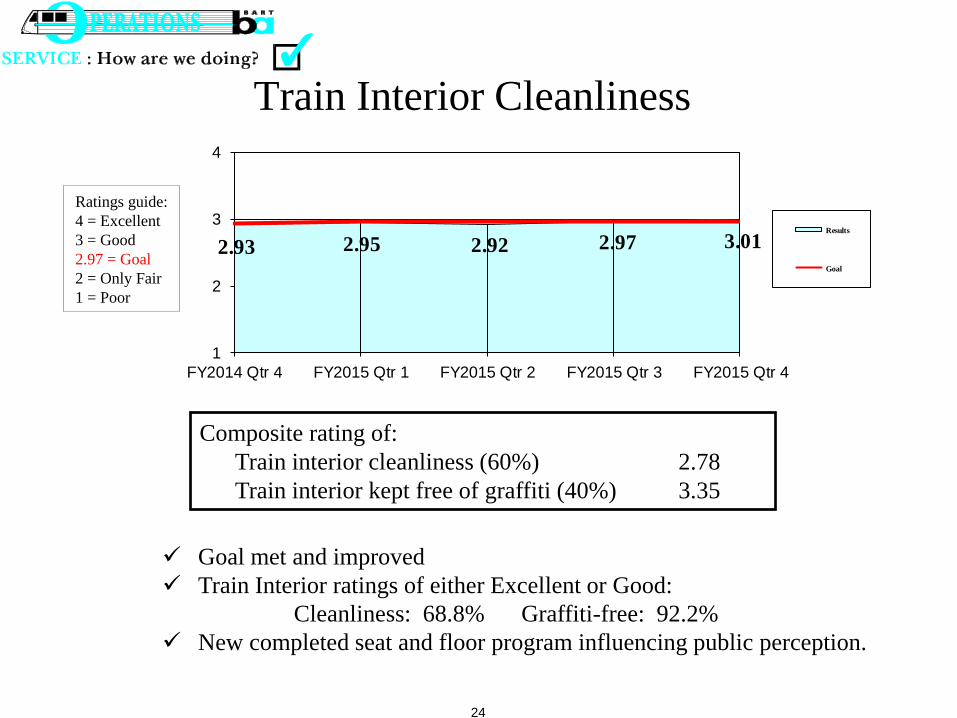
Train Interior Cleanliness
Composite rating of:
Train interior cleanliness (60%) 2.78
Train interior kept free of graffiti (40%) 3.35
Goal met and improved
Train Interior ratings of either Excellent or Good:
Cleanliness: 68.8% Graffiti-free: 92.2%
New completed seat and floor program influencing public perception.
2.93 2.95 2.92 2.97 3.01
1
2
3
4
FY2014 Qtr 4 FY2015 Qtr 1 FY2015 Qtr 2 FY2015 Qtr 3 FY2015 Qtr 4
Results
Goal
Ratings guide:
4 = Excellent
3 = Good
2.97 = Goal
2 = Only Fair
1 = Poor
25
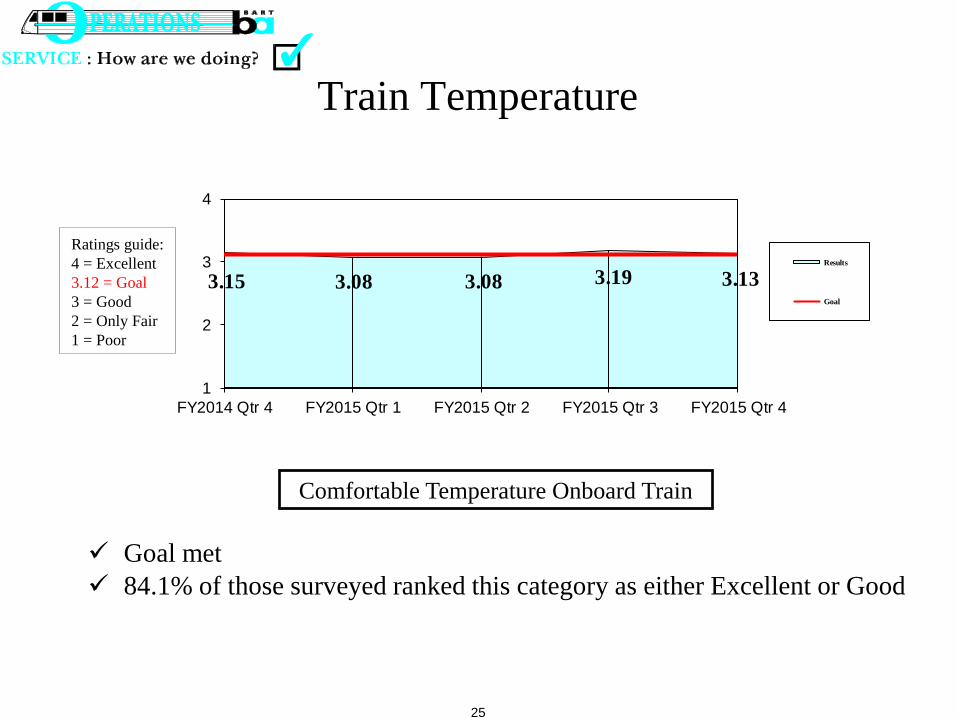
Train Temperature
3.15 3.08 3.08 3.19 3.13
1
2
3
4
FY2014 Qtr 4 FY2015 Qtr 1 FY2015 Qtr 2 FY2015 Qtr 3 FY2015 Qtr 4
Results
Goal
Comfortable Temperature Onboard Train
Goal met
84.1% of those surveyed ranked this category as either Excellent or Good
Ratings guide:
4 = Excellent
3.12 = Goal
3 = Good
2 = Only Fair
1 = Poor
26
Customer Complaints P
er 1
00,0
00 C
ust
om
ers
0
2
4
6
8
10
12
14
April May June July Aug Sept Oct Nov Dec Jan2015
Feb Mar April May June
Results
Goal
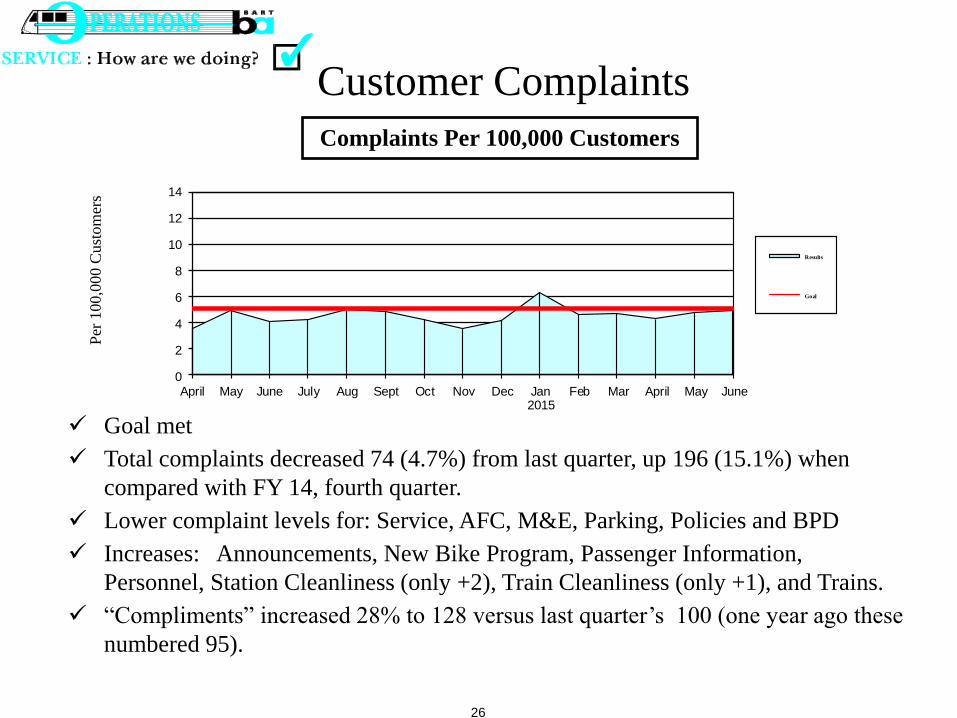
Goal met
Total complaints decreased 74 (4.7%) from last quarter, up 196 (15.1%) when
compared with FY 14, fourth quarter.
Lower complaint levels for: Service, AFC, M&E, Parking, Policies and BPD
Increases: Announcements, New Bike Program, Passenger Information,
Personnel, Station Cleanliness (only +2), Train Cleanliness (only +1), and Trains.
“Compliments” increased 28% to 128 versus last quarter’s 100 (one year ago these
numbered 95).
Complaints Per 100,000 Customers
27
0
1
2
3
4
5
6
7
8
9
10
FY2014 Qtr 4 FY2015 Qtr 1 FY2015 Qtr 2 FY2015 Qtr 3 FY2015 Qtr 4
Results
Be nchmark
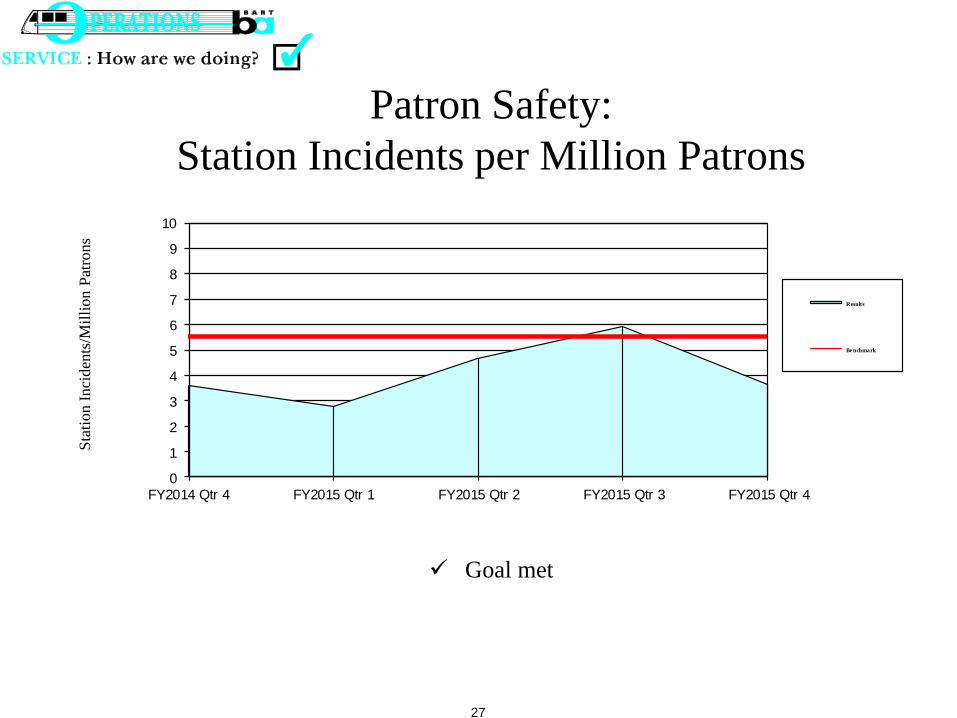
Patron Safety:
Station Incidents per Million Patrons
Sta
tion I
nci
den
ts/M
illi
on P
atro
ns
Goal met
28
0
1
2
3
4
FY2014 Qtr 4 FY2015 Qtr 1 FY2015 Qtr 2 FY2015 Qtr 3 FY2015 Qtr 4
Results
Benchmar k
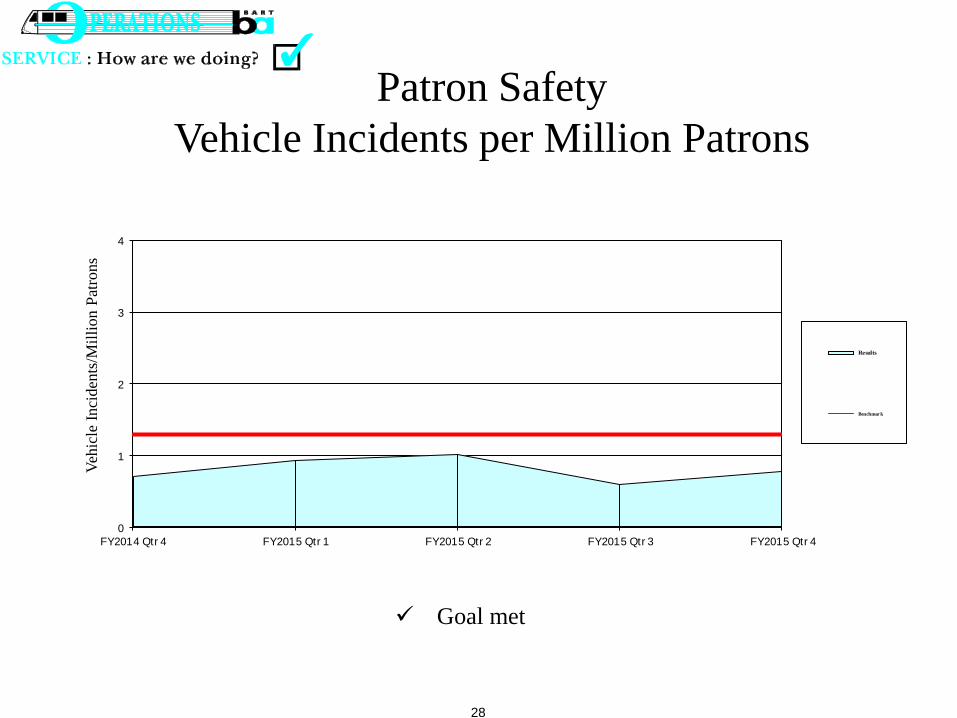
Patron Safety
Vehicle Incidents per Million Patrons
Veh
icle
Inci
den
ts/M
illi
on P
atro
ns
Goal met
29
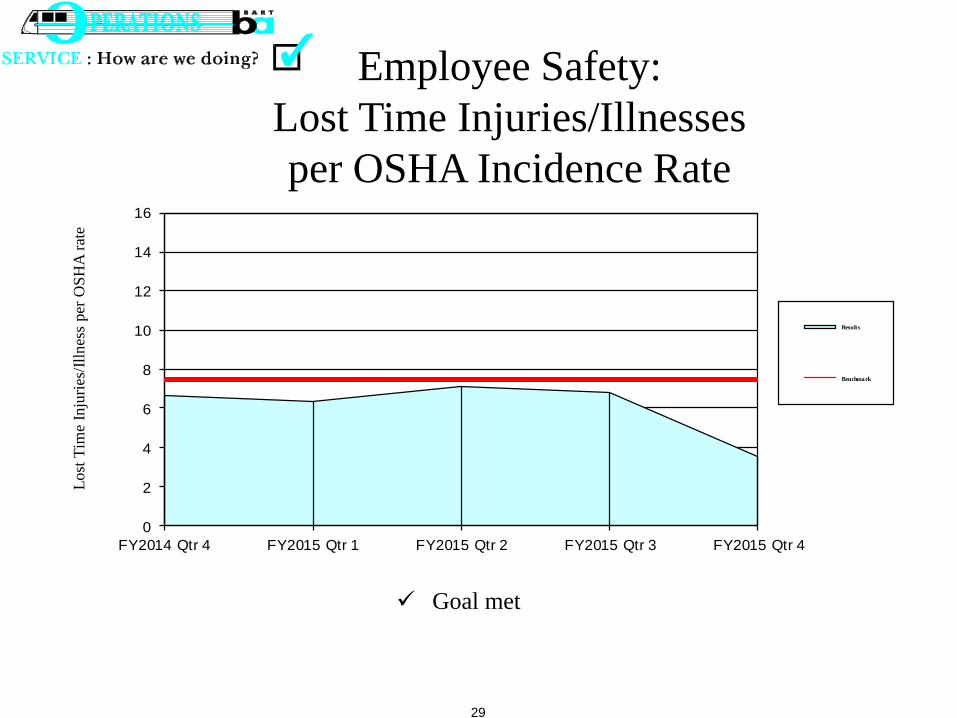
Employee Safety:
Lost Time Injuries/Illnesses
per OSHA Incidence Rate
Lost
Tim
e In
juri
es/I
lln
ess
per
OS
HA
rat
e
Goal met
0
2
4
6
8
10
12
14
16
FY2014 Qtr 4 FY2015 Qtr 1 FY2015 Qtr 2 FY2015 Qtr 3 FY2015 Qtr 4
Results
Benchmark
30
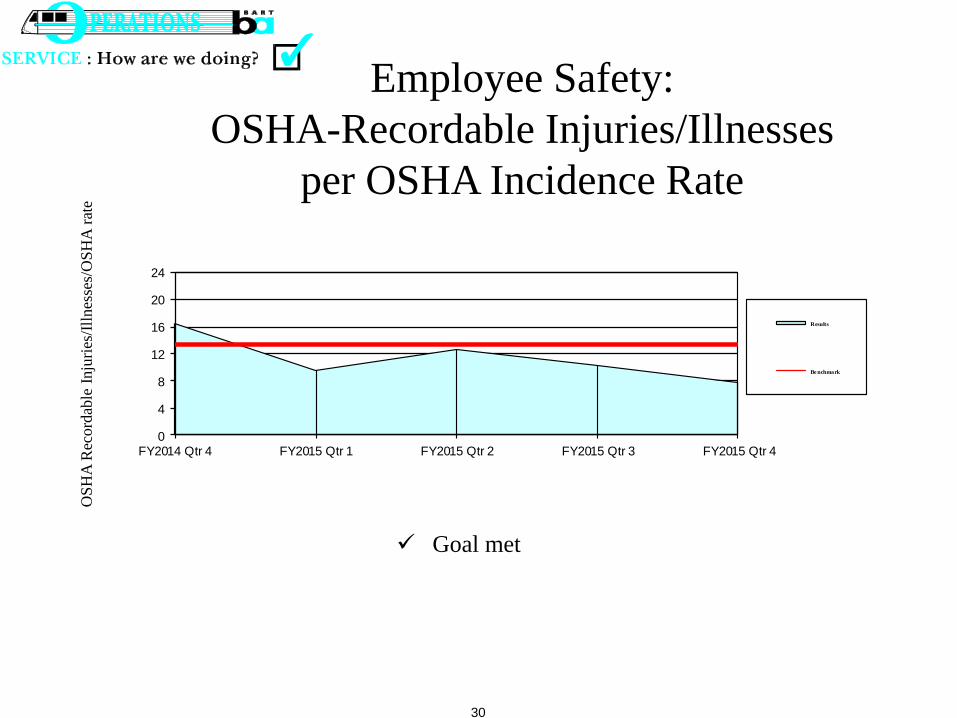
Employee Safety:
OSHA-Recordable Injuries/Illnesses
per OSHA Incidence Rate
0
4
8
12
16
20
24
FY2014 Qtr 4 FY2015 Qtr 1 FY2015 Qtr 2 FY2015 Qtr 3 FY2015 Qtr 4
Results
Be nchmark
OS
HA
Rec
ord
able
Inju
ries
/Ill
nes
ses/
OS
HA
rat
e
Goal met
31
0.000
0.100
0.200
0.300
0.400
0.500
0.600
0.700
0.800
0.900
1.000
FY2014 Qtr 4 FY2015 Qtr 1 FY2015 Qtr 2 FY2015 Qtr 3 FY2015 Qtr 4
Results
Be nchmark
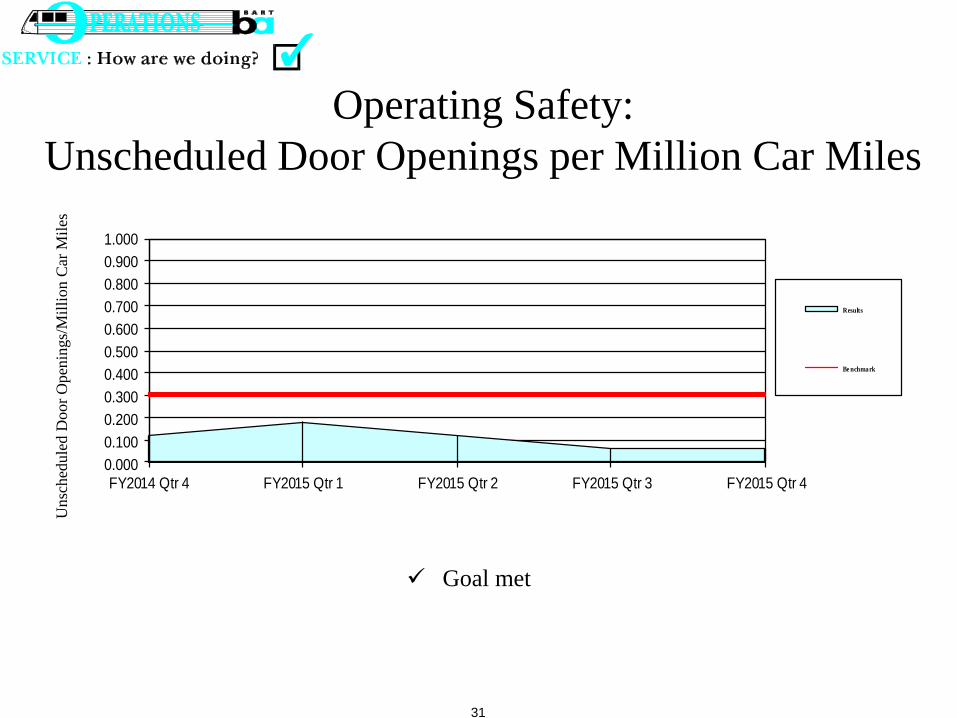
Operating Safety:
Unscheduled Door Openings per Million Car Miles
Unsc
hed
ule
d D
oor
Open
ings/
Mil
lion C
ar M
iles
Goal met
32
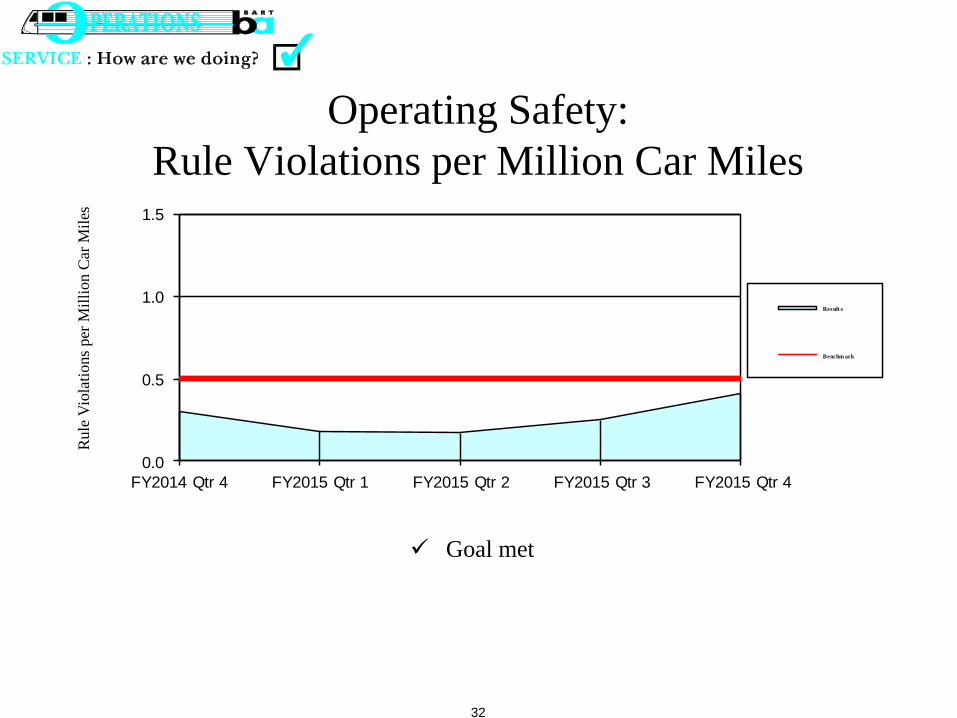
Operating Safety:
Rule Violations per Million Car Miles
0.0
0.5
1.0
1.5
FY2014 Qtr 4 FY2015 Qtr 1 FY2015 Qtr 2 FY2015 Qtr 3 FY2015 Qtr 4
Result s
Benchm ark
Rule
Vio
lati
ons
per
Mil
lion C
ar M
iles
Goal met
33
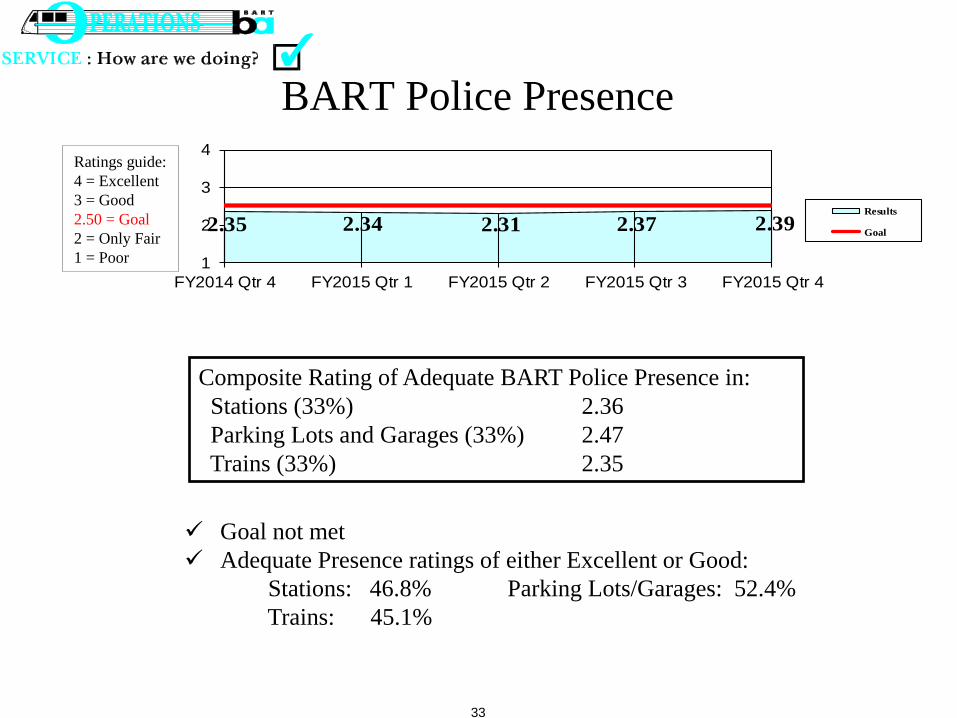
BART Police Presence
Composite Rating of Adequate BART Police Presence in:
Stations (33%) 2.36
Parking Lots and Garages (33%) 2.47
Trains (33%) 2.35
2.35 2.34 2.31 2.37 2.39
1
2
3
4
FY2014 Qtr 4 FY2015 Qtr 1 FY2015 Qtr 2 FY2015 Qtr 3 FY2015 Qtr 4
Results
Goal
Goal not met
Adequate Presence ratings of either Excellent or Good:
Stations: 46.8% Parking Lots/Garages: 52.4%
Trains: 45.1%
Ratings guide:
4 = Excellent
3 = Good
2.50 = Goal
2 = Only Fair
1 = Poor
34
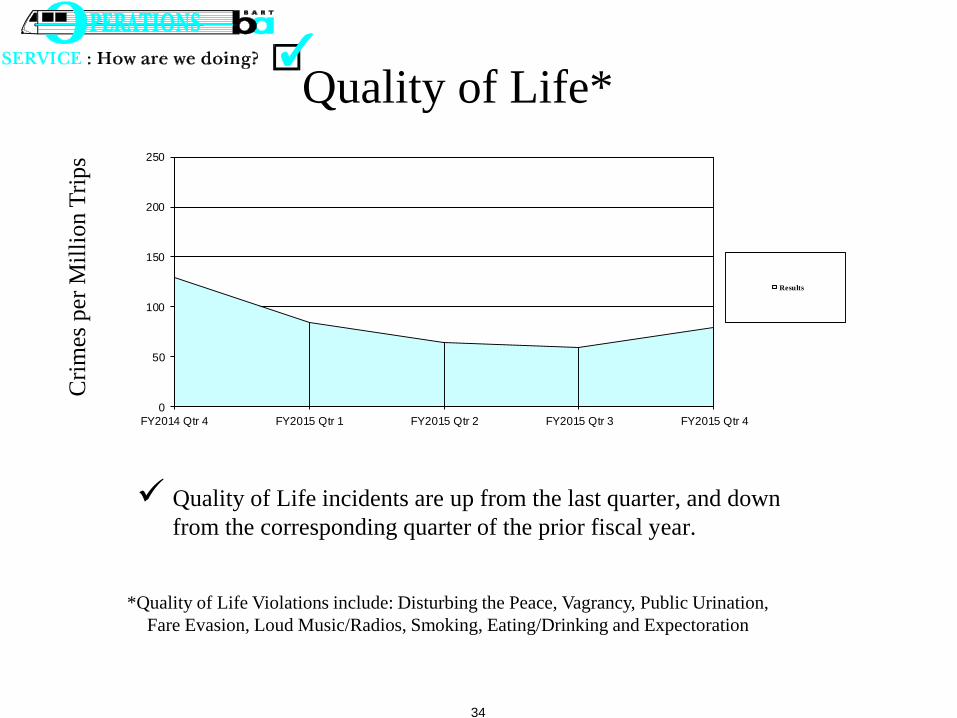
Quality of Life* C
rim
es p
er M
illi
on T
rips
Quality of Life incidents are up from the last quarter, and down
from the corresponding quarter of the prior fiscal year.
*Quality of Life Violations include: Disturbing the Peace, Vagrancy, Public Urination,
Fare Evasion, Loud Music/Radios, Smoking, Eating/Drinking and Expectoration
0
50
100
150
200
250
FY2014 Qtr 4 FY2015 Qtr 1 FY2015 Qtr 2 FY2015 Qtr 3 FY2015 Qtr 4
Results
35
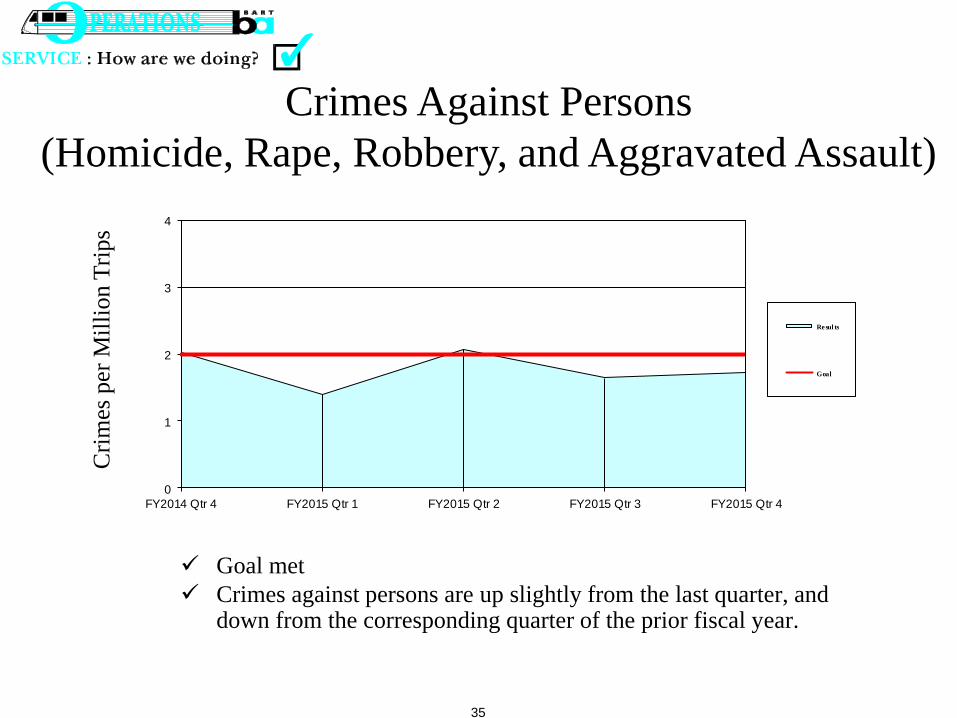
Crimes Against Persons
(Homicide, Rape, Robbery, and Aggravated Assault)
Cri
mes
per
Mil
lion T
rips
Goal met
Crimes against persons are up slightly from the last quarter, and down from the corresponding quarter of the prior fiscal year.
0
1
2
3
4
FY2014 Qtr 4 FY2015 Qtr 1 FY2015 Qtr 2 FY2015 Qtr 3 FY2015 Qtr 4
Resul ts
Goal
36
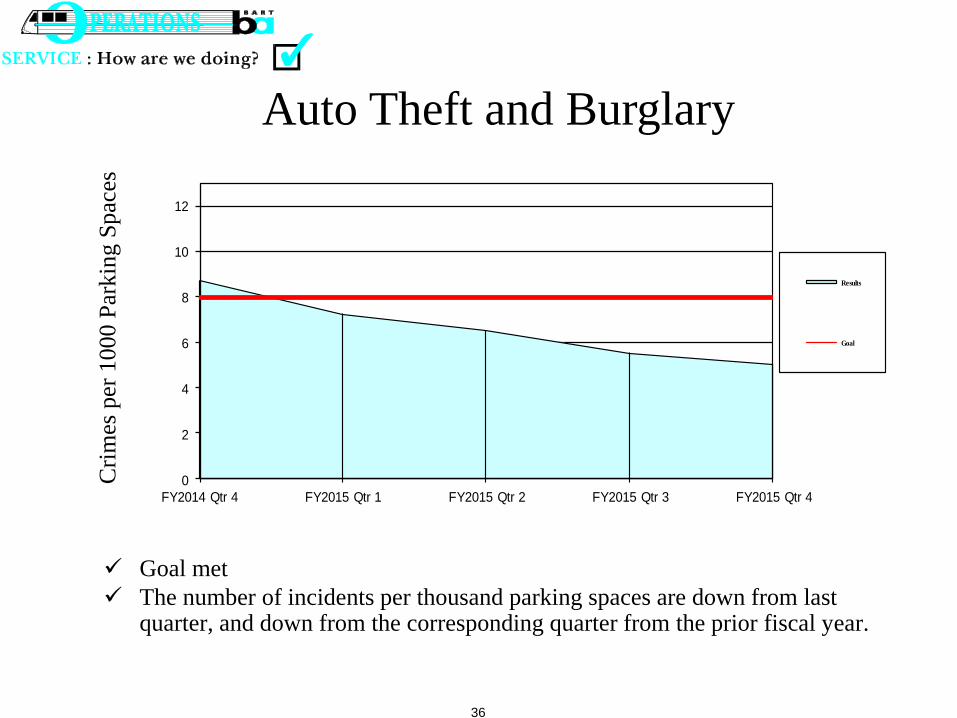
Auto Theft and Burglary C
rim
es p
er 1
000 P
arkin
g S
pac
es
Goal met
The number of incidents per thousand parking spaces are down from last quarter, and down from the corresponding quarter from the prior fiscal year.
0
2
4
6
8
10
12
FY2014 Qtr 4 FY2015 Qtr 1 FY2015 Qtr 2 FY2015 Qtr 3 FY2015 Qtr 4
Results
Goal
37
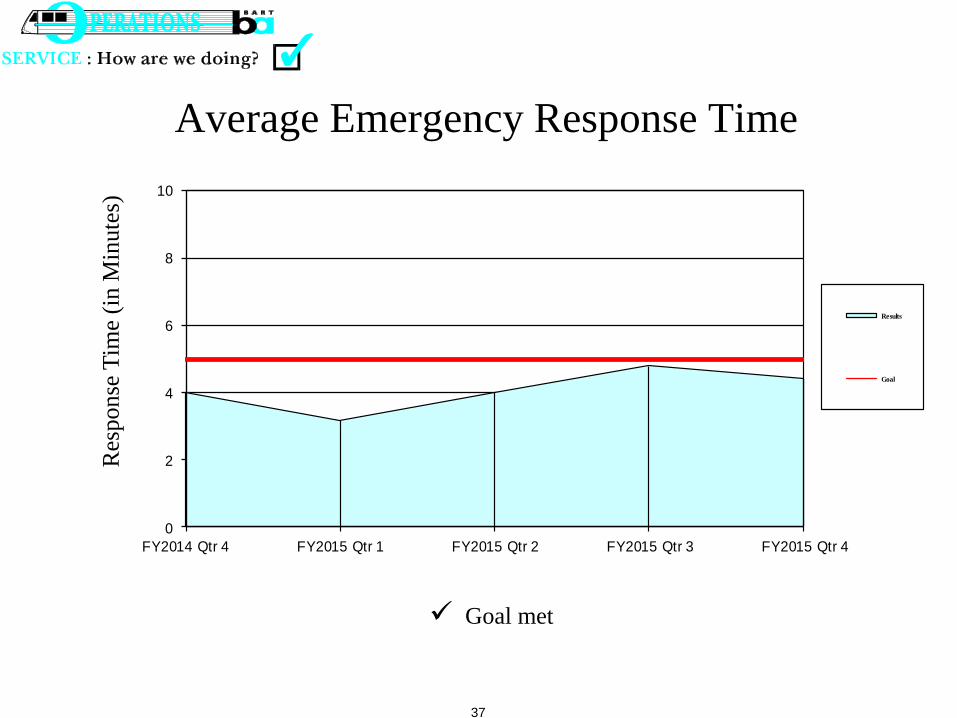
0
2
4
6
8
10
FY2014 Qtr 4 FY2015 Qtr 1 FY2015 Qtr 2 FY2015 Qtr 3 FY2015 Qtr 4
Results
Goal
Average Emergency Response Time R
esponse
Tim
e (i
n M
inute
s)
Goal met
38
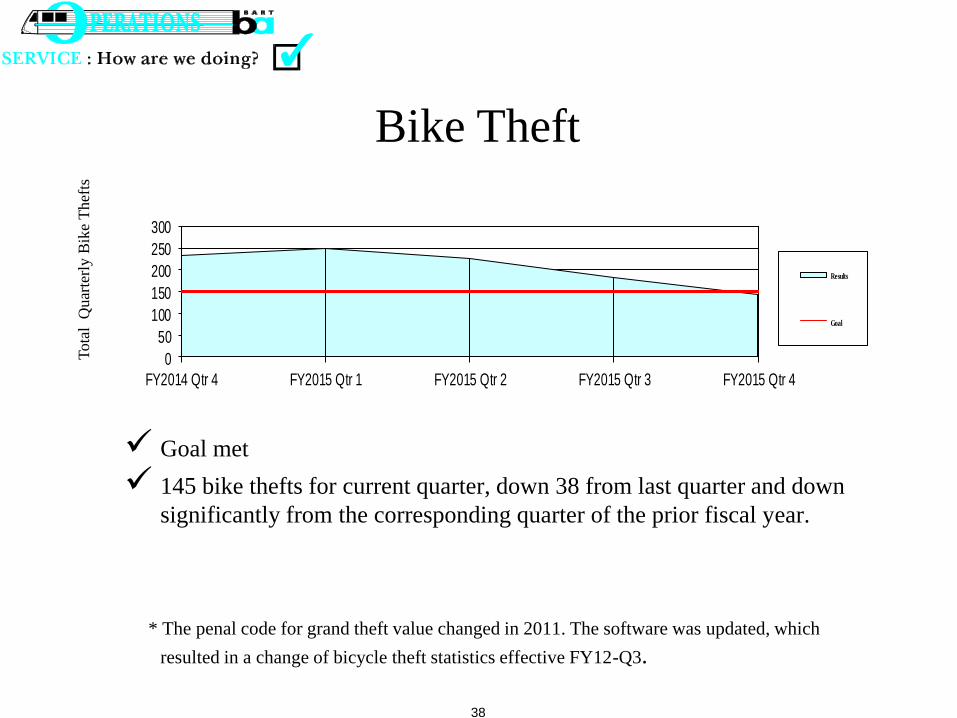
Bike Theft T
ota
l Q
uar
terl
y B
ike
Thef
ts
Goal met
145 bike thefts for current quarter, down 38 from last quarter and down
significantly from the corresponding quarter of the prior fiscal year.
* The penal code for grand theft value changed in 2011. The software was updated, which
resulted in a change of bicycle theft statistics effective FY12-Q3.
0
50
100
150
200
250
300
FY2014 Qtr 4 FY2015 Qtr 1 FY2015 Qtr 2 FY2015 Qtr 3 FY2015 Qtr 4
Results
Goal