Quarterly Report - illinois.gov Report... · Maximum sub-total 3,150 1,697 608 853 409 604 0 7,321...
38
Acting Director ILLINOIS DEPARTMENT OF CORRECTIONS Quarterly Report October 1, 2018 Bruce Rauner Governor John R. Baldwin
Transcript of Quarterly Report - illinois.gov Report... · Maximum sub-total 3,150 1,697 608 853 409 604 0 7,321...
Acting Director
ILLINOIS DEPARTMENT OF CORRECTIONS
Quarterly ReportOctober 1, 2018
Bruce Rauner
Governor
John R. Baldwin


Illinois Department of Corrections Quarterly Report - October 1, 2018
Contents
Topic Table
Population by Facility 1
Facility Population by Offense Class 2
Facility Population by Offense Type 2a
Educational and Vocational Program Participation 3
Life Skills Reentry Center Participation and Completion 3a - 3c
Capacity by Facility 4
Facility Population by Cell Type 5
Facility Floor Space 6
Facility Staff Ratios 7
Capital Projects Currently Funded 8
Projected Prison Population 9
Population Projection Comparison 9a
Intake, Exits, and Transfers by Facility 10
Adult Transition Centers 11
Note: In December, 2015 IDOC initiated a major IT transition, moving from a DOS-based offender tracking system to a modern, web-based tracking system.
During the transition, some traditional measures will contain missing values due to a combination of factors, which include quality control issues with data
entry and missing data for fields that are no longer required within the system. In addition, basic coding and program logic is still being reviewed and
corrected. Moving forward, the Department continues to validate certain data measures and all elements are subject to change as more information
becomes available. Contact the Planning & Research Unit with any questions.

Illinois Department of Corrections Quarterly Report - October 1, 2018
Population by Facility
As of August 31, 2018
Facility Population
Big Muddy River Correctional Center 1,526
Centralia Correctional Center 1,432
Danville Correctional Center 1,727
Decatur Correctional Center (female) 488
Dixon Correctional Center 2,220
East Moline Correctional Center 1,334
Elgin Treatment Center 14
Graham Correctional Center 1,898
Hill Correctional Center 1,643
Illinois River Correctional Center 1,873
Jacksonville Correctional Center 1,351
Joliet Treatment Center 115
Kewanee Life Skills Reentry Center 280
Lawrence Correctional Center 1,932
Lincoln Correctional Center 806
Logan Correctional Center (female) 1,709
Menard Correctional Center 3,216
Murphysboro Life Skills Reentry Center 54
Pinckneyville Correctional Center 2,023
Pontiac Correctional Center 1,239
Robinson Correctional Center 1,194
Shawnee Correctional Center 1,638
Sheridan Correctional Center 1,734
Southwestern Correctional Center 620
Stateville Correctional Center 2,866
Taylorville Correctional Center 1,060
Vandalia Correctional Center 1,242
Vienna Correctional Center 1,137
Western Illinois Correctional Center 1,337
Adult Transition Centers 903
Electronic Detention 48
Federal/Other State* 60
Women's Treatment Center 1
In-Transit 1
Total 40,721
* Illinois inmates placed in facilities managed by other states or the federal government
Note: Adult Transition Centers are listed individually in Table 4 and Table 11.
Note: Elgin Treatment Center opened on April 2, 2018.
Logan Life Skills Reentry Center (LSRC) started orientation in August of 2018 and
is being reported under it's parent facility.
Murphysboro Life Skills Reentry Center (LSRC) opened on April 16, 2018.
Note: Work camps, IIP's, and R&C's are combined with their parent facilities.
Source: Data retrieved from Extract Files in Planning & Research
Table 1

Illinois Department of Corrections Quarterly Report - October 1, 2018
Facility Population by Offense ClassAs of August 31, 2018
Facility Murd
er
Cla
ss X
Cla
ss 1
Cla
ss 2
Cla
ss 3
Cla
ss 4
Uncl
assi
fied 1
Total
Maximum
Menard Correctional Center 1,718 806 204 236 130 122 0 3,216
Pontiac Correctional Center 542 393 102 107 55 40 0 1,239
Stateville Correctional Center 890 498 302 510 224 442 0 2,866
Maximum sub-total 3,150 1,697 608 853 409 604 0 7,321
Female
Decatur Correctional Center (medium) 25 67 101 101 95 99 0 488
Logan Correctional Center (maximum) 328 301 216 321 280 262 1 1,709
Female sub-total 353 368 317 422 375 361 1 2,197
Medium
Big Muddy River Correctional Center 65 691 236 233 90 41 170 1,526
Centralia Correctional Center 177 609 196 261 96 94 0 1,433
Danville Correctional Center 331 771 187 237 100 101 0 1,727
Dixon Correctional Center 479 871 249 351 141 128 1 2,220
Graham Correctional Center 168 498 328 417 274 213 0 1,898
Hill Correctional Center 572 620 146 158 75 72 0 1,643
Illinois River Correctional Center 246 823 270 299 119 116 0 1,873
Lawrence Correctional Center 345 803 266 307 101 110 0 1,932
Pinckneyville Correctional Center 246 680 329 435 156 177 0 2,023
Shawnee Correctional Center 56 531 244 412 188 207 0 1,638
Sheridan Correctional Center 0 344 507 580 178 125 0 1,734
Western Illinois Correctional Center 332 532 141 190 73 69 0 1,337
Medium sub-total 3,017 7,773 3,099 3,880 1,591 1,453 171 20,984
Minimum
East Moline Correctional Center 55 448 245 311 132 143 0 1,334
Elgin Treatment Center 3 2 0 4 4 1 0 14
Jacksonville Correctional Center 52 310 242 339 175 233 0 1,351
Joliet Treatment Center 31 51 10 15 5 3 0 115
Kewanee Life Skills Reentry Center 32 108 51 70 14 5 0 280
Lincoln Correctional Center 39 243 142 204 102 76 0 806
Murphysboro Life Skills Reentry Center 1 20 12 14 4 3 0 54
Robinson Correctional Center 41 269 216 319 173 176 0 1,194
Southwestern Illinois Correctional Center 0 101 193 202 80 44 0 620
Taylorville Correctional Center 24 457 221 244 57 57 0 1,060
Vandalia Correctional Center 0 72 157 388 263 362 0 1,242
Vienna Correctional Center 43 349 247 261 118 119 0 1,137
Minimum sub-total 321 2,430 1,736 2,371 1,127 1,222 0 9,207
Total Institutions 6,841 12,268 5,760 7,526 3,502 3,640 172 39,709
Adult Transition Centers 1 99 285 265 134 119 0 903
Electronic Detention 0 0 2 21 14 11 0 48
Federal/Other State2
35 19 3 1 2 0 0 60
Women's Treatment Center 0 0 0 1 0 0 0 1
Total 6,877 12,386 6,050 7,814 3,652 3,770 172 40,721
1 Unclassified cases include Sexually Dangerous Persons and contempt of court.
2 Illinois inmates placed in facilities managed by other states or the federal government
Note: Data on class of crime are obtained from Planning & Research's Extract Files. Class of crime data reflect the
highest class of crime for which an inmate has been committed.
Note: Data entry delay may cause some discrepancy with other counts.
Note: Elgin Treatment Center opened on April 2, 2018.
Logan Life Skills Reentry Center (LSRC) started orientation in August of 2018 and is being reported under it's parent facility.
Murphysboro Life Skills Reentry Center (LSRC) opened on April 16, 2018.
Note: Work camps, IIP's, and R&C's are combined with their parent facilities.
Source: Data retrieved from Extract Files in Planning & Research
Table 2

Illinois Department of Corrections Quarterly Report - October 1, 2018
Facility Population by Offense TypeAs of August 31, 2018
Facility Per
son
Pro
perty
Dru
g
Sex
Oth
er
Total
Maximum
Menard Correctional Center 2,477 181 159 378 21 3,216
Pontiac Correctional Center 910 77 39 204 9 1,239
Stateville Correctional Center 1,801 390 446 190 39 2,866
Maximum sub-total 5,188 648 644 772 69 7,321
Female
Decatur Correctional Center (medium) 103 131 245 0 9 488
Logan Correctional Center (maximum) 819 340 449 65 36 1,709
Female sub-total 922 471 694 65 45 2,197
Medium
Big Muddy River Correctional Center 395 99 99 922 11 1,526
Centralia Correctional Center 852 146 206 219 10 1,433
Danville Correctional Center 1,140 136 213 224 14 1,727
Dixon Correctional Center 1,375 210 177 437 21 2,220
Graham Correctional Center 828 365 431 261 13 1,898
Hill Correctional Center 1,127 105 141 264 6 1,643
Illinois River Correctional Center 1,155 180 210 311 17 1,873
Lawrence Correctional Center 1,206 182 167 362 15 1,932
Pinckneyville Correctional Center 1,180 276 270 273 24 2,023
Shawnee Correctional Center 841 250 271 255 21 1,638
Sheridan Correctional Center 796 373 542 3 20 1,734
Western Illinois Correctional Center 846 126 124 231 10 1,337
Medium sub-total 11,741 2,448 2,851 3,762 182 20,984
Minimum
East Moline Correctional Center 651 241 326 110 6 1,334
Elgin Treatment Center 12 2 0 0 0 14
Jacksonville Correctional Center 534 281 396 127 13 1,351
Joliet Treatment Center 79 5 11 19 1 115
Kewanee Life Skills Reentry Center 200 35 38 6 1 280
Lincoln Correctional Center 387 118 186 106 9 806
Murphysboro Life Skills Reentry Center 32 4 17 0 1 54
Robinson Correctional Center 472 184 250 275 13 1,194
Southwestern Illinois Correctional Center 205 146 267 0 2 620
Taylorville Correctional Center 266 102 188 502 2 1,060
Vandalia Correctional Center 511 275 379 66 11 1,242
Vienna Correctional Center 548 208 278 99 4 1,137
Minimum sub-total 3,897 1,601 2,336 1,310 63 9,207
Total Institutions 21,748 5,168 6,525 5,909 359 39,709
Adult Transition Centers 78 264 555 0 6 903
Electronic Detention 3 22 23 0 0 48
Federal/Other State1
50 3 3 4 0 60
Women's Treatment Center 0 0 1 0 0 1
Total 21,879 5,457 7,107 5,913 365 40,721
1 Illinois inmates placed in facilities managed by other states or the federal government.
Note: Data on type of crime are obtained from Planning & Research's Extract Files. Type of crime
data reflect the highest type of crime for which an inmate has been committed.
Note: Data entry delay may cause some discrepancy with other counts.
Note: Elgin Treatment Center opened on April 2, 2018.
Logan Life Skills Reentry Center (LSRC) started orientation in August of 2018 and
is being reported under it's parent facility.
Murphysboro Life Skills Reentry Center (LSRC) opened on April 16, 2018.
Note: Work camps, IIP's, and R&C's are combined with their parent facilities.
Source: Data retrieved from Extract Files in Planning & Research
Table 2a

Illinois Department of Corrections Quarterly Report - October 1, 2018
Educational
Jun Jul Aug Jun Jul Aug Jun Jul Aug Jun Jul Aug
Adult Basic Education (ABE) 162 147 47 9 11 10 104 120 98 11 4 10
Advanced ABE 53 57 54 2 7 3 30 25 24 0 0 0
English Language Learner 26 0 0 0 0 0 0 0 0 0 0 0
Adult Secondary Education (ASE) 59 55 51 3 5 0 33 35 36 0 0 0
College - 2 Year degree 0 0 0 0 0 0 - - - - - -
College - 4 Year degree - - - - - - - - - - - -
Title 1 - - - - - - - - - - - -
Educational Sub Total 300 259 152 14 23 13 167 180 158 11 4 10
Vocational
Auto Body - - - - - - - - - - - -
Automotive Technology 16 16 23 0 9 4 - - - - - -
Barbering - - - - - - - - - - - -
Career Technologies3 0 0 0 0 0 0 - - - - - -
Commercial Custodian - - - - - - - - - - - -
Construction Occupations 15 18 21 2 5 0 - - - - - -
Cosmetology - - - - - - - - - - - -
Culinary Arts 16 19 18 0 3 3 - - - - - -
Electronics - - - - - - - - - - - -
Equine4 - - - - - - - - - - - -
Graphic Arts/Print Management - - - - - - - - - - - -
Horticulture 17 16 19 1 3 2 - - - - - -
HVAC - - - - - - - - - - - -
Manage First - - - - - - - - - - - -
Nail Tech4 - - - - - - - - - - - -
Remedial Bridge - - - - - - - - - - - -
Restaurant Management - - - - - - - - - - - -
Tech Related Math - - - - - - - - - - - -
Warehousing - - - - - - - - - - - -
Welding - - - - - - - - - - - -
Vocational Sub Total 64 69 81 3 20 9 0 0 0 0 0 0
Educational & Vocational Total 364 328 233 17 43 22 167 180 158 11 4 10
Educational and Vocational Program Participation As of August 31, 2018
Big Muddy River Centralia
Participants1
Completers2
Participants1
Completers2
Table 3

Illinois Department of Corrections Quarterly Report - October 1, 2018
Educational
Jun Jul Aug Jun Jul Aug Jun Jul Aug Jun Jul Aug
Adult Basic Education (ABE) 65 60 56 7 7 6 65 57 56 18 9 5
Advanced ABE 68 79 62 0 0 0 52 46 52 14 7 12
English Language Learner 0 0 0 0 0 0 0 0 0 0 0 0
Adult Secondary Education (ASE) 54 66 42 12 0 3 29 32 29 0 3 0
College - 2 Year degree 99 99 96 0 0 2 - - - - - -
College - 4 Year degree - - - - - - - - - - - -
Title 1 - - - - - - - - - - - -
Educational Sub Total 286 304 256 19 7 11 146 135 137 32 19 17
Vocational
Auto Body - - - - - - - - - - - -
Automotive Technology - - - - - - - - - - - -
Barbering - - - - - - - - - - - -
Career Technologies3 - - - - - - - - - - - -
Commercial Custodian - - - - - - - - - - - -
Construction Occupations - - - - - - - - - - - -
Cosmetology - - - - - - - - - - - -
Culinary Arts - - - - - - - - - - - -
Electronics - - - - - - - - - - - -
Equine4 - - - - - - - - - - - -
Graphic Arts/Print Management - - - - - - - - - - - -
Horticulture - - - - - - - - - - - -
HVAC - - - - - - - - - - - -
Manage First - - - - - - - - - - - -
Nail Tech4 - - - - - - - - - - - -
Remedial Bridge - - - - - - - - - - - -
Restaurant Management - - - - - - - - - - - -
Tech Related Math - - - - - - - - - - - -
Warehousing - - - - - - - - - - - -
Welding - - - - - - - - - - - -
Vocational Sub Total 0 0 0 0 0 0 0 0 0 0 0 0
Educational & Vocational Total 286 304 256 19 7 11 146 135 137 32 19 17
Educational and Vocational Program Participation As of August 31, 2018
Danville Decatur
Participants1
Completers2
Participants1
Completers2
Table 3
Illinois Department of Corrections Quarterly Report - October 1, 2018
Educational
Jun Jul Aug Jun Jul Aug Jun Jul Aug Jun Jul Aug
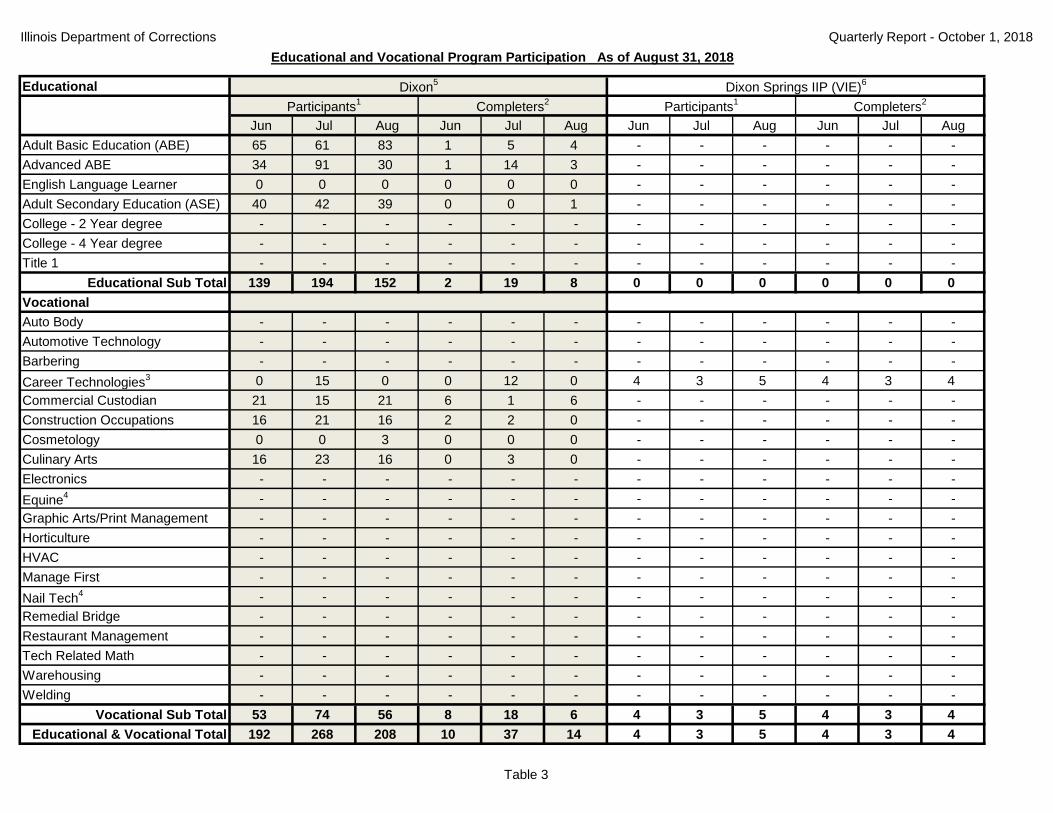
Adult Basic Education (ABE) 65 61 83 1 5 4 - - - - - -
Advanced ABE 34 91 30 1 14 3 - - - - - -
English Language Learner 0 0 0 0 0 0 - - - - - -
Adult Secondary Education (ASE) 40 42 39 0 0 1 - - - - - -
College - 2 Year degree - - - - - - - - - - - -
College - 4 Year degree - - - - - - - - - - - -
Title 1 - - - - - - - - - - - -
Educational Sub Total 139 194 152 2 19 8 0 0 0 0 0 0
Vocational
Auto Body - - - - - - - - - - - -
Automotive Technology - - - - - - - - - - - -
Barbering - - - - - - - - - - - -
Career Technologies3 0 15 0 0 12 0 4 3 5 4 3 4
Commercial Custodian 21 15 21 6 1 6 - - - - - -
Construction Occupations 16 21 16 2 2 0 - - - - - -
Cosmetology 0 0 3 0 0 0 - - - - - -
Culinary Arts 16 23 16 0 3 0 - - - - - -
Electronics - - - - - - - - - - - -
Equine4 - - - - - - - - - - - -
Graphic Arts/Print Management - - - - - - - - - - - -
Horticulture - - - - - - - - - - - -
HVAC - - - - - - - - - - - -
Manage First - - - - - - - - - - - -
Nail Tech4 - - - - - - - - - - - -
Remedial Bridge - - - - - - - - - - - -
Restaurant Management - - - - - - - - - - - -
Tech Related Math - - - - - - - - - - - -
Warehousing - - - - - - - - - - - -
Welding - - - - - - - - - - - -
Vocational Sub Total 53 74 56 8 18 6 4 3 5 4 3 4
Educational & Vocational Total 192 268 208 10 37 14 4 3 5 4 3 4
Educational and Vocational Program Participation As of August 31, 2018
Dixon5
Dixon Springs IIP (VIE)6
Participants1
Completers2
Participants1
Completers2
Table 3

Illinois Department of Corrections Quarterly Report - October 1, 2018
Educational
Jun Jul Aug Jun Jul Aug Jun Jul Aug Jun Jul Aug
Adult Basic Education (ABE) 0 0 0 0 0 0 51 54 56 11 7 4
Advanced ABE 0 0 0 0 0 0 12 17 22 0 3 0
English Language Learner 0 0 0 0 0 0 0 0 0 0 0 0
Adult Secondary Education (ASE) 6 4 5 1 1 3 23 19 20 2 1 5
College - 2 Year degree - - - - - - - - - - - -
College - 4 Year degree - - - - - - - - - - - -
Title 1 - - - - - - - - - - - -
Educational Sub Total 6 4 5 1 1 3 86 90 98 13 11 9
Vocational
Auto Body - - - - - - - - - - - -
Automotive Technology - - - - - - - - - - - -
Barbering - - - - - - - - - - - -
Career Technologies3 0 0 0 0 0 0 15 0 15 15 0 13
Commercial Custodian - - - - - - 15 21 19 4 6 3
Construction Occupations - - - - - - 4 8 14 0 0 4
Cosmetology - - - - - - - - - - - -
Culinary Arts - - - - - - 0 0 0 0 0 0
Electronics - - - - - - - - - - - -
Equine4 - - - - - - - - - - - -
Graphic Arts/Print Management - - - - - - - - - - - -
Horticulture - - - - - - - - - - - -
HVAC - - - - - - - - - - - -
Manage First - - - - - - - - - - - -
Nail Tech4 - - - - - - - - - - - -
Remedial Bridge - - - - - - - - - - - -
Restaurant Management - - - - - - - - - - - -
Tech Related Math - - - - - - - - - - - -
Warehousing - - - - - - - - - - - -
Welding - - - - - - - - - - - -
Vocational Sub Total 0 0 0 0 0 0 34 29 48 19 6 20
Educational & Vocational Total 6 4 5 1 1 3 120 119 146 32 17 29
Educational and Vocational Program Participation As of August 31, 2018
DuQuoin IIP (PNK)6 East Moline
Participants1
Completers2
Participants1
Completers2
Table 3

Illinois Department of Corrections Quarterly Report - October 1, 2018
Educational
Jun Jul Aug Jun Jul Aug Jun Jul Aug Jun Jul Aug
Adult Basic Education (ABE) 38 39 41 1 6 10 0 0 15 0 0 0
Advanced ABE 49 67 57 7 11 5 0 0 0 0 0 0
English Language Learner 0 0 0 0 0 0 0 0 0 0 0 0
Adult Secondary Education (ASE) 108 99 101 4 0 11 0 0 0 0 0 0
College - 2 Year degree - - - - - - - - - - - -
College - 4 Year degree - - - - - - - - - - - -
Title 1 - - - - - - - - - - - -
Educational Sub Total 195 205 199 12 17 26 0 0 15 0 0 0
Vocational
Auto Body 17 18 18 2 2 4 - - - - - -
Automotive Technology 0 0 0 0 0 0 - - - - - -
Barbering - - - - - - - - - - - -
Career Technologies3 0 0 15 0 0 10 - - - - - -
Commercial Custodian 0 0 0 0 0 0 - - - - - -
Construction Occupations 17 18 22 2 6 1 - - - - - -
Cosmetology - - - - - - - - - - - -
Culinary Arts - - - - - - - - - - - -
Electronics - - - - - - - - - - - -
Equine4 - - - - - - - - - - - -
Graphic Arts/Print Management - - - - - - - - - - - -
Horticulture - - - - - - - - - - - -
HVAC - - - - - - - - - - - -
Manage First - - - - - - - - - - - -
Nail Tech4 - - - - - - - - - - - -
Remedial Bridge - - - - - - - - - - - -
Restaurant Management - - - - - - - - - - - -
Tech Related Math - - - - - - - - - - - -
Warehousing - - - - - - - - - - - -
Welding - - - - - - - - - - - -
Vocational Sub Total 34 36 55 4 8 15 0 0 0 0 0 0
Educational & Vocational Total 229 241 254 16 25 41 0 0 15 0 0 0
Educational and Vocational Program Participation As of August 31, 2018
Graham Green County Work Camp (JAC)6
Participants1
Completers2
Participants1
Completers2
Table 3

Illinois Department of Corrections Quarterly Report - October 1, 2018
Educational
Jun Jul Aug Jun Jul Aug Jun Jul Aug Jun Jul Aug
Adult Basic Education (ABE) 116 103 102 6 6 17 76 101 107 5 6 13
Advanced ABE 41 46 36 0 4 1 55 78 77 0 7 3
English Language Learner 0 0 0 0 0 0 0 0 0 0 0 0
Adult Secondary Education (ASE) 42 43 42 2 1 0 24 24 74 0 0 0
College - 2 Year degree 146 121 165 9 0 0 35 25 35 0 0 0
College - 4 Year degree - - - - - - - - - - - -
Title 1 - - - - - - - - - - - -
Educational Sub Total 345 313 345 17 11 18 190 228 293 5 13 16
Vocational
Auto Body - - - - - - - - - - - -
Automotive Technology 0 0 0 0 0 0 15 16 16 0 1 2
Barbering - - - - - - - - - - - -
Career Technologies3 0 15 0 0 8 0 0 15 13 0 12 12
Commercial Custodian 16 17 14 0 0 0 - - - - - -
Construction Occupations - - - - - - 20 20 17 0 1 3
Cosmetology - - - - - - - - - - - -
Culinary Arts - - - - - - 16 15 18 4 3 2
Electronics - - - - - - - - - - - -
Equine4 - - - - - - - - - - - -
Graphic Arts/Print Management - - - - - - - - - - - -
Horticulture 17 21 18 2 4 0 4 15 18 0 0 0
HVAC - - - - - - - - - - - -
Manage First - - - - - - 0 0 0 0 0 0
Nail Tech4 - - - - - - - - - - - -
Remedial Bridge - - - - - - - - - - - -
Restaurant Management - - - - - - - - - - - -
Tech Related Math - - - - - - - - - - - -
Warehousing - - - - - - - - - - - -
Welding - - - - - - - - - - - -
Vocational Sub Total 33 53 32 2 12 0 55 81 82 4 17 19
Educational & Vocational Total 378 366 377 19 23 18 245 309 375 9 30 35
Educational and Vocational Program Participation As of August 31, 2018
Hill Illinois River
Participants1
Completers2
Participants1
Completers2
Table 3
Illinois Department of Corrections Quarterly Report - October 1, 2018
Educational
Jun Jul Aug Jun Jul Aug Jun Jul Aug Jun Jul Aug
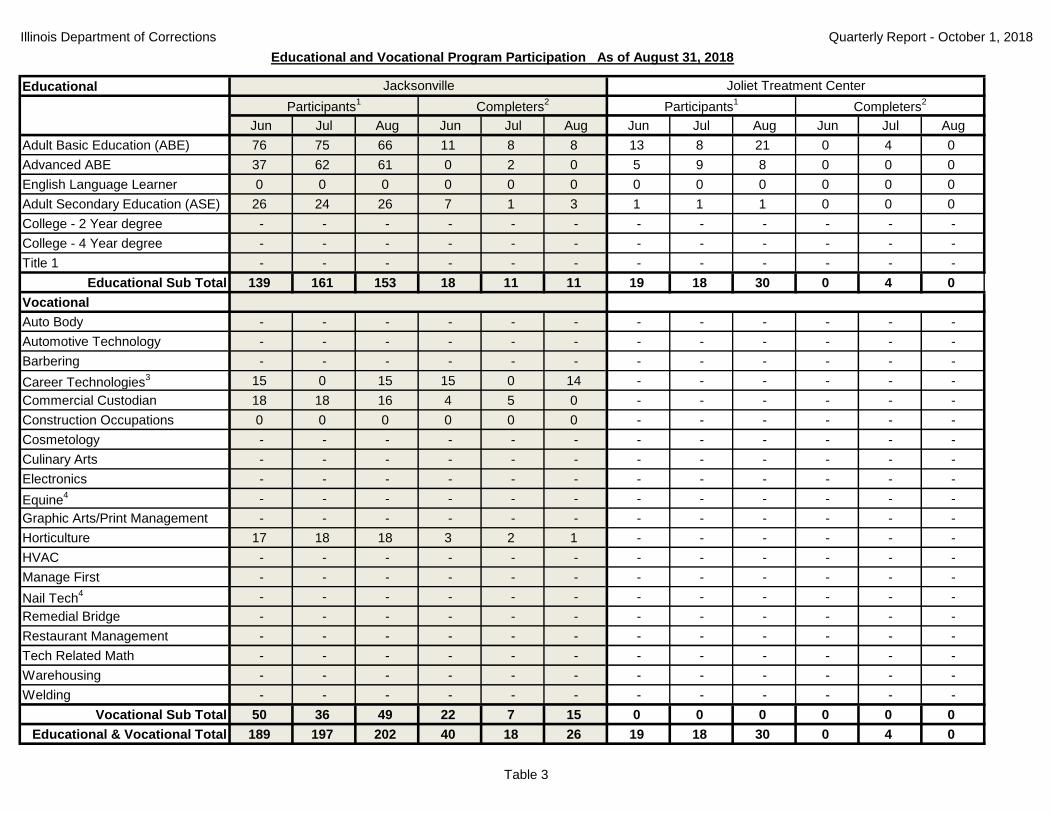
Adult Basic Education (ABE) 76 75 66 11 8 8 13 8 21 0 4 0
Advanced ABE 37 62 61 0 2 0 5 9 8 0 0 0
English Language Learner 0 0 0 0 0 0 0 0 0 0 0 0
Adult Secondary Education (ASE) 26 24 26 7 1 3 1 1 1 0 0 0
College - 2 Year degree - - - - - - - - - - - -
College - 4 Year degree - - - - - - - - - - - -
Title 1 - - - - - - - - - - - -
Educational Sub Total 139 161 153 18 11 11 19 18 30 0 4 0
Vocational
Auto Body - - - - - - - - - - - -
Automotive Technology - - - - - - - - - - - -
Barbering - - - - - - - - - - - -
Career Technologies3 15 0 15 15 0 14 - - - - - -
Commercial Custodian 18 18 16 4 5 0 - - - - - -
Construction Occupations 0 0 0 0 0 0 - - - - - -
Cosmetology - - - - - - - - - - - -
Culinary Arts - - - - - - - - - - - -
Electronics - - - - - - - - - - - -
Equine4 - - - - - - - - - - - -
Graphic Arts/Print Management - - - - - - - - - - - -
Horticulture 17 18 18 3 2 1 - - - - - -
HVAC - - - - - - - - - - - -
Manage First - - - - - - - - - - - -
Nail Tech4 - - - - - - - - - - - -
Remedial Bridge - - - - - - - - - - - -
Restaurant Management - - - - - - - - - - - -
Tech Related Math - - - - - - - - - - - -
Warehousing - - - - - - - - - - - -
Welding - - - - - - - - - - - -
Vocational Sub Total 50 36 49 22 7 15 0 0 0 0 0 0
Educational & Vocational Total 189 197 202 40 18 26 19 18 30 0 4 0
Educational and Vocational Program Participation As of August 31, 2018
Jacksonville Joliet Treatment Center
Participants1
Completers2
Participants1
Completers2
Table 3

Illinois Department of Corrections Quarterly Report - October 1, 2018
Educational
Jun Jul Aug Jun Jul Aug Jun Jul Aug Jun Jul Aug
Adult Basic Education (ABE) 151 125 205 25 14 26 89 71 82 4 4 12
Advanced ABE 95 83 87 8 3 4 34 43 59 2 3 10
English Language Learner 0 0 0 0 0 0 0 0 0 0 0 0
Adult Secondary Education (ASE) 72 87 93 11 2 0 49 33 35 2 2 2
College - 2 Year degree 0 0 0 0 0 0 - - - - - -
College - 4 Year degree - - - - - - - - - - - -
Title 1 - - - - - - - - - - - -
Educational Sub Total 318 295 385 44 19 30 172 147 176 8 9 24
Vocational
Auto Body - - - - - - - - - - - -
Automotive Technology - - - - - - - - - - - -
Barbering - - - - - - - - - - - -
Career Technologies3 14 0 0 11 0 0 - - - - - -
Commercial Custodian 16 17 23 2 2 4 - - - - - -
Construction Occupations 0 0 0 0 0 0 - - - - - -
Cosmetology - - - - - - - - - - - -
Culinary Arts 15 18 19 2 0 0 - - - - - -
Electronics - - - - - - - - - - - -
Equine4 - - - - - - - - - - - -
Graphic Arts/Print Management - - - - - - - - - - - -
Horticulture - - - - - - - - - - - -
HVAC - - - - - - - - - - - -
Manage First 0 0 0 0 0 0 - - - - - -
Nail Tech4 - - - - - - - - - - - -
Remedial Bridge - - - - - - - - - - - -
Restaurant Management - - - - - - - - - - - -
Tech Related Math - - - - - - - - - - - -
Warehousing - - - - - - - - - - - -
Welding - - - - - - - - - - - -
Vocational Sub Total 45 35 42 15 2 4 0 0 0 0 0 0
Educational & Vocational Total 363 330 427 59 21 34 172 147 176 8 9 24
Educational and Vocational Program Participation As of August 31, 2018
Lawrence Lincoln
Participants1
Completers2
Participants1
Completers2
Table 3
Illinois Department of Corrections Quarterly Report - October 1, 2018
Educational
Jun Jul Aug Jun Jul Aug Jun Jul Aug Jun Jul Aug
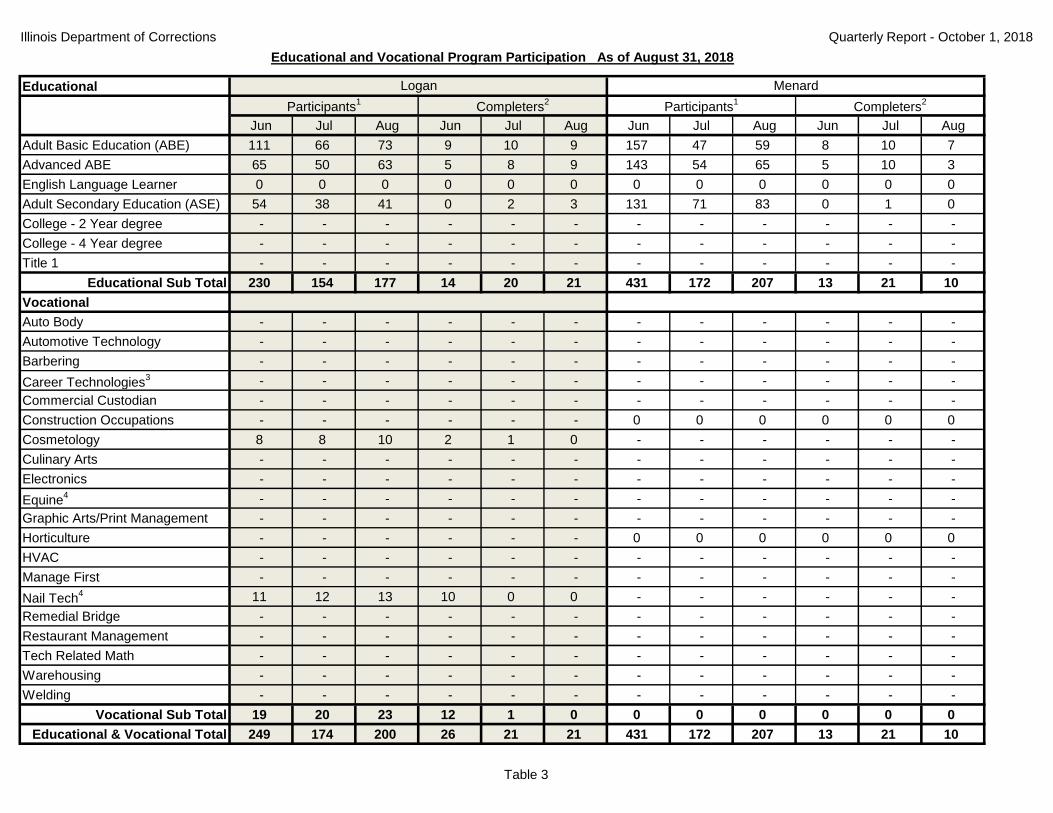
Adult Basic Education (ABE) 111 66 73 9 10 9 157 47 59 8 10 7
Advanced ABE 65 50 63 5 8 9 143 54 65 5 10 3
English Language Learner 0 0 0 0 0 0 0 0 0 0 0 0
Adult Secondary Education (ASE) 54 38 41 0 2 3 131 71 83 0 1 0
College - 2 Year degree - - - - - - - - - - - -
College - 4 Year degree - - - - - - - - - - - -
Title 1 - - - - - - - - - - - -
Educational Sub Total 230 154 177 14 20 21 431 172 207 13 21 10
Vocational
Auto Body - - - - - - - - - - - -
Automotive Technology - - - - - - - - - - - -
Barbering - - - - - - - - - - - -
Career Technologies3 - - - - - - - - - - - -
Commercial Custodian - - - - - - - - - - - -
Construction Occupations - - - - - - 0 0 0 0 0 0
Cosmetology 8 8 10 2 1 0 - - - - - -
Culinary Arts - - - - - - - - - - - -
Electronics - - - - - - - - - - - -
Equine4 - - - - - - - - - - - -
Graphic Arts/Print Management - - - - - - - - - - - -
Horticulture - - - - - - 0 0 0 0 0 0
HVAC - - - - - - - - - - - -
Manage First - - - - - - - - - - - -
Nail Tech4 11 12 13 10 0 0 - - - - - -
Remedial Bridge - - - - - - - - - - - -
Restaurant Management - - - - - - - - - - - -
Tech Related Math - - - - - - - - - - - -
Warehousing - - - - - - - - - - - -
Welding - - - - - - - - - - - -
Vocational Sub Total 19 20 23 12 1 0 0 0 0 0 0 0
Educational & Vocational Total 249 174 200 26 21 21 431 172 207 13 21 10
Educational and Vocational Program Participation As of August 31, 2018
Logan Menard
Participants1
Completers2
Participants1
Completers2
Table 3
Illinois Department of Corrections Quarterly Report - October 1, 2018
Educational
Jun Jul Aug Jun Jul Aug Jun Jul Aug Jun Jul Aug
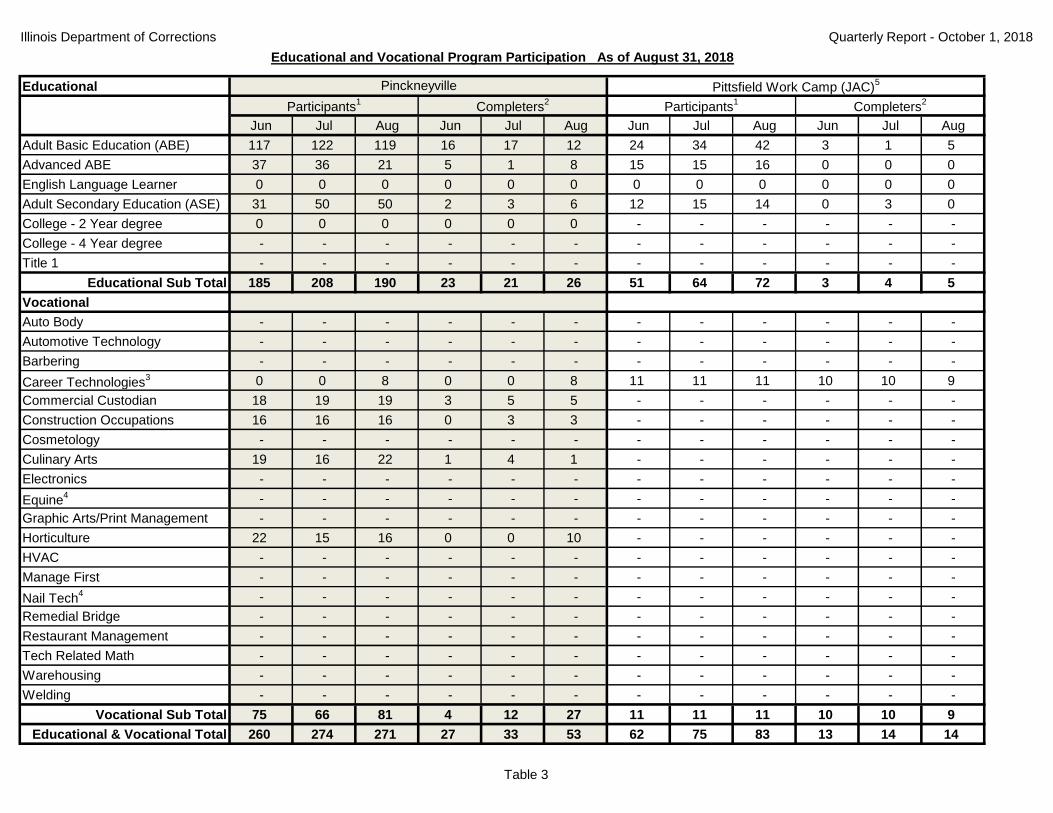
Adult Basic Education (ABE) 117 122 119 16 17 12 24 34 42 3 1 5
Advanced ABE 37 36 21 5 1 8 15 15 16 0 0 0
English Language Learner 0 0 0 0 0 0 0 0 0 0 0 0
Adult Secondary Education (ASE) 31 50 50 2 3 6 12 15 14 0 3 0
College - 2 Year degree 0 0 0 0 0 0 - - - - - -
College - 4 Year degree - - - - - - - - - - - -
Title 1 - - - - - - - - - - - -
Educational Sub Total 185 208 190 23 21 26 51 64 72 3 4 5
Vocational
Auto Body - - - - - - - - - - - -
Automotive Technology - - - - - - - - - - - -
Barbering - - - - - - - - - - - -
Career Technologies3 0 0 8 0 0 8 11 11 11 10 10 9
Commercial Custodian 18 19 19 3 5 5 - - - - - -
Construction Occupations 16 16 16 0 3 3 - - - - - -
Cosmetology - - - - - - - - - - - -
Culinary Arts 19 16 22 1 4 1 - - - - - -
Electronics - - - - - - - - - - - -
Equine4 - - - - - - - - - - - -
Graphic Arts/Print Management - - - - - - - - - - - -
Horticulture 22 15 16 0 0 10 - - - - - -
HVAC - - - - - - - - - - - -
Manage First - - - - - - - - - - - -
Nail Tech4 - - - - - - - - - - - -
Remedial Bridge - - - - - - - - - - - -
Restaurant Management - - - - - - - - - - - -
Tech Related Math - - - - - - - - - - - -
Warehousing - - - - - - - - - - - -
Welding - - - - - - - - - - - -
Vocational Sub Total 75 66 81 4 12 27 11 11 11 10 10 9
Educational & Vocational Total 260 274 271 27 33 53 62 75 83 13 14 14
Educational and Vocational Program Participation As of August 31, 2018
Pinckneyville Pittsfield Work Camp (JAC)5
Participants1
Completers2
Participants1
Completers2
Table 3
Illinois Department of Corrections Quarterly Report - October 1, 2018
Educational
Jun Jul Aug Jun Jul Aug Jun Jul Aug Jun Jul Aug
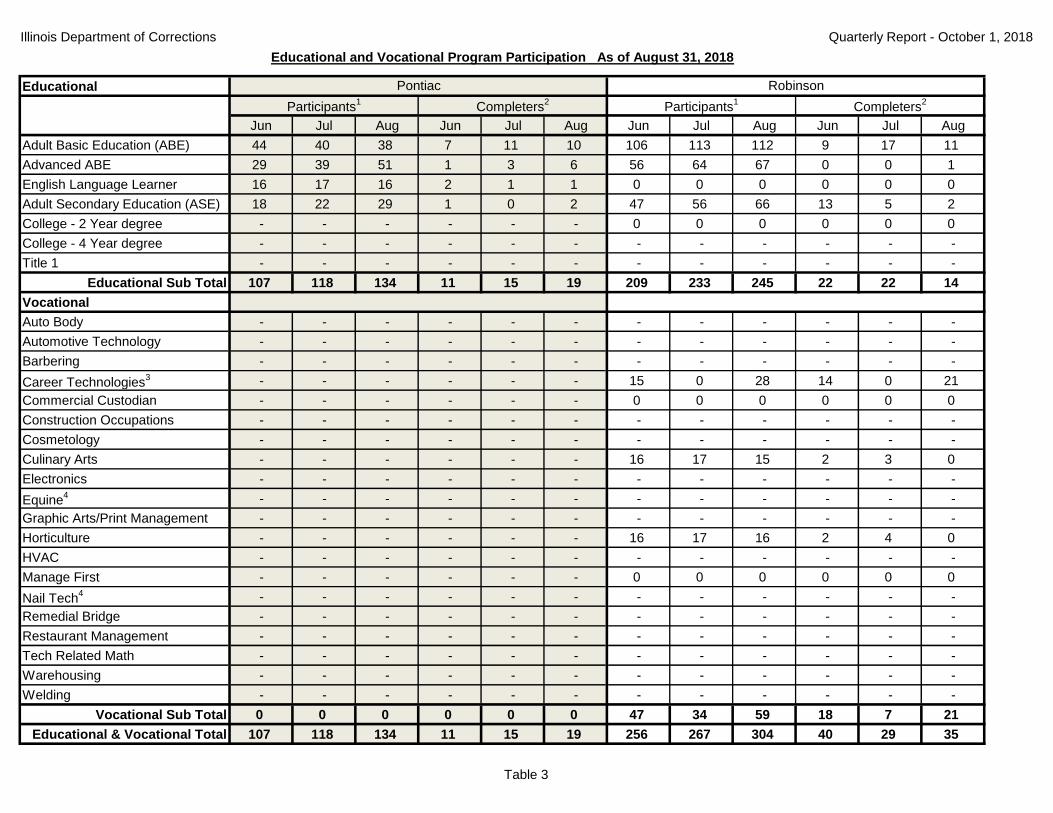
Adult Basic Education (ABE) 44 40 38 7 11 10 106 113 112 9 17 11
Advanced ABE 29 39 51 1 3 6 56 64 67 0 0 1
English Language Learner 16 17 16 2 1 1 0 0 0 0 0 0
Adult Secondary Education (ASE) 18 22 29 1 0 2 47 56 66 13 5 2
College - 2 Year degree - - - - - - 0 0 0 0 0 0
College - 4 Year degree - - - - - - - - - - - -
Title 1 - - - - - - - - - - - -
Educational Sub Total 107 118 134 11 15 19 209 233 245 22 22 14
Vocational
Auto Body - - - - - - - - - - - -
Automotive Technology - - - - - - - - - - - -
Barbering - - - - - - - - - - - -
Career Technologies3 - - - - - - 15 0 28 14 0 21
Commercial Custodian - - - - - - 0 0 0 0 0 0
Construction Occupations - - - - - - - - - - - -
Cosmetology - - - - - - - - - - - -
Culinary Arts - - - - - - 16 17 15 2 3 0
Electronics - - - - - - - - - - - -
Equine4 - - - - - - - - - - - -
Graphic Arts/Print Management - - - - - - - - - - - -
Horticulture - - - - - - 16 17 16 2 4 0
HVAC - - - - - - - - - - - -
Manage First - - - - - - 0 0 0 0 0 0
Nail Tech4 - - - - - - - - - - - -
Remedial Bridge - - - - - - - - - - - -
Restaurant Management - - - - - - - - - - - -
Tech Related Math - - - - - - - - - - - -
Warehousing - - - - - - - - - - - -
Welding - - - - - - - - - - - -
Vocational Sub Total 0 0 0 0 0 0 47 34 59 18 7 21
Educational & Vocational Total 107 118 134 11 15 19 256 267 304 40 29 35
Educational and Vocational Program Participation As of August 31, 2018
Pontiac Robinson
Participants1
Completers2
Participants1
Completers2
Table 3

Illinois Department of Corrections Quarterly Report - October 1, 2018
Educational
Jun Jul Aug Jun Jul Aug Jun Jul Aug Jun Jul Aug
Adult Basic Education (ABE) 95 91 126 1 2 10 60 58 60 11 2 0
Advanced ABE 89 70 78 0 0 0 21 28 32 3 2 3
English Language Learner 0 0 0 0 0 0 0 0 0 0 0 0
Adult Secondary Education (ASE) 54 44 53 5 2 0 27 19 16 9 0 10
College - 2 Year degree - - - - - - - - - - - -
College - 4 Year degree - - - - - - - - - - - -
Title 1 - - - - - - - - - - - -
Educational Sub Total 238 205 257 6 4 10 108 105 108 23 4 13
Vocational
Auto Body - - - - - - - - - - - -
Automotive Technology 15 18 18 1 3 0 - - - - - -
Barbering - - - - - - 19 18 18 0 0 0
Career Technologies3 15 15 15 14 13 13 0 30 0 0 22 0
Commercial Custodian 20 21 15 5 4 1 - - - - - -
Construction Occupations 13 22 23 0 5 2 - - - - - -
Cosmetology - - - - - - - - - - - -
Culinary Arts - - - - - - 31 35 30 0 2 7
Electronics - - - - - - - - - - - -
Equine4 - - - - - - - - - - - -
Graphic Arts/Print Management - - - - - - - - - - - -
Horticulture - - - - - - 34 34 32 0 8 3
HVAC - - - - - - - - - - - -
Manage First - - - - - - - - - - - -
Nail Tech4 - - - - - - - - - - - -
Remedial Bridge - - - - - - - - - - - -
Restaurant Management - - - - - - - - - - - -
Tech Related Math - - - - - - - - - - - -
Warehousing - - - - - - 32 44 43 1 14 10
Welding - - - - - - 29 28 27 0 0 5
Vocational Sub Total 63 76 71 20 25 16 145 189 150 1 46 25
Educational & Vocational Total 301 281 328 26 29 26 253 294 258 24 50 38
Educational and Vocational Program Participation As of August 31, 2018
Shawnee Sheridan
Participants1
Completers2
Participants1
Completers2
Table 3

Illinois Department of Corrections Quarterly Report - October 1, 2018
Educational
Jun Jul Aug Jun Jul Aug Jun Jul Aug Jun Jul Aug
Adult Basic Education (ABE) 60 42 60 11 12 9 55 48 58 5 3 2
Advanced ABE 0 0 0 0 0 0 30 28 37 0 1 3
English Language Learner 0 0 0 0 0 0 0 0 0 0 0 0
Adult Secondary Education (ASE) 44 38 44 3 0 3 34 39 41 0 1 6
College - 2 Year degree 60 47 64 0 1 0 - - - - - -
College - 4 Year degree - - - - - - - - - - - -
Title 1 - - - - - - - - - - - -
Educational Sub Total 164 127 168 14 13 12 119 115 136 5 5 11
Vocational
Auto Body - - - - - - - - - - - -
Automotive Technology - - - - - - - - - - - -
Barbering - - - - - - 0 8 7 0 0 0
Career Technologies3 0 0 0 0 0 0 - - - - - -
Commercial Custodian 34 34 35 3 1 1 - - - - - -
Construction Occupations 33 27 26 0 4 7 - - - - - -
Cosmetology - - - - - - - - - - - -
Culinary Arts - - - - - - - - - - - -
Electronics - - - - - - - - - - - -
Equine4 - - - - - - - - - - - -
Graphic Arts/Print Management - - - - - - - - - - - -
Horticulture 0 0 0 0 0 0 - - - - - -
HVAC - - - - - - - - - - - -
Manage First - - - - - - - - - - - -
Nail Tech4 - - - - - - - - - - - -
Remedial Bridge 31 33 43 7 5 16 - - - - - -
Restaurant Management - - - - - - - - - - - -
Tech Related Math - - - - - - - - - - - -
Warehousing 29 30 29 4 8 5 - - - - - -
Welding - - - - - - - - - - - -
Vocational Sub Total 127 124 133 14 18 29 0 8 7 0 0 0
Educational & Vocational Total 291 251 301 28 31 41 119 123 143 5 5 11
Educational and Vocational Program Participation As of August 31, 2018
Southwestern Illinois Stateville4
Participants1
Completers2
Participants1
Completers2
Table 3
Illinois Department of Corrections Quarterly Report - October 1, 2018
Educational
Jun Jul Aug Jun Jul Aug Jun Jul Aug Jun Jul Aug
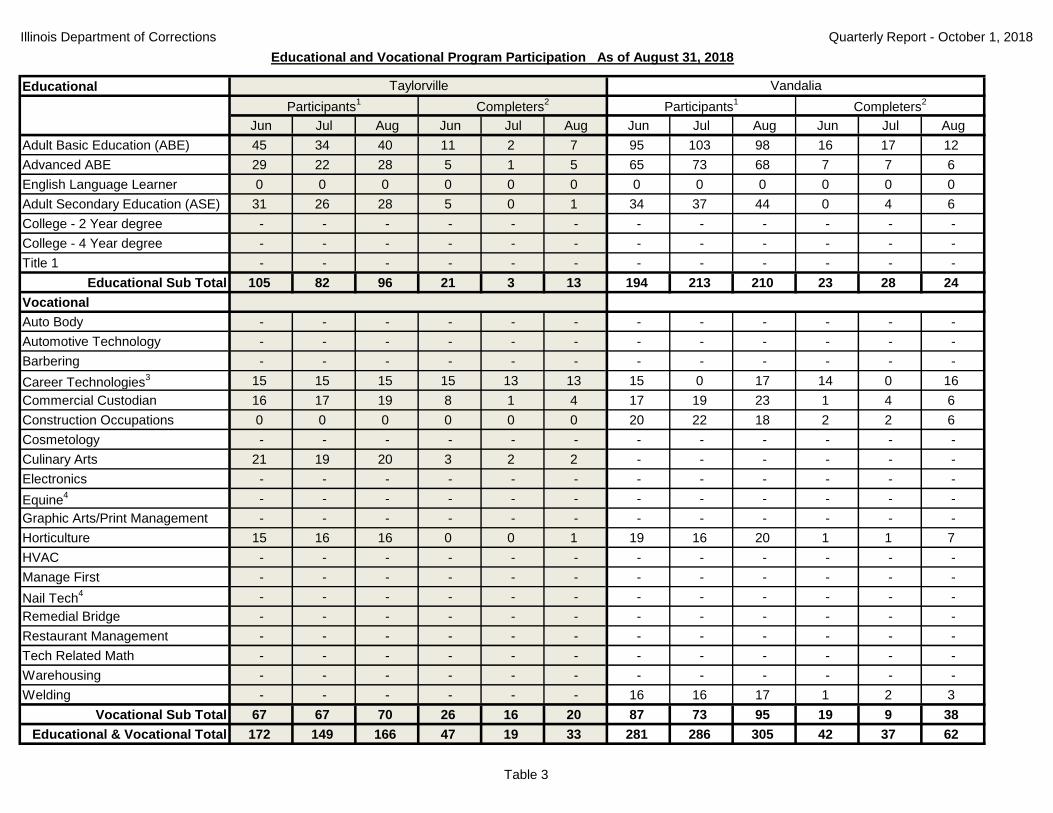
Adult Basic Education (ABE) 45 34 40 11 2 7 95 103 98 16 17 12
Advanced ABE 29 22 28 5 1 5 65 73 68 7 7 6
English Language Learner 0 0 0 0 0 0 0 0 0 0 0 0
Adult Secondary Education (ASE) 31 26 28 5 0 1 34 37 44 0 4 6
College - 2 Year degree - - - - - - - - - - - -
College - 4 Year degree - - - - - - - - - - - -
Title 1 - - - - - - - - - - - -
Educational Sub Total 105 82 96 21 3 13 194 213 210 23 28 24
Vocational
Auto Body - - - - - - - - - - - -
Automotive Technology - - - - - - - - - - - -
Barbering - - - - - - - - - - - -
Career Technologies3 15 15 15 15 13 13 15 0 17 14 0 16
Commercial Custodian 16 17 19 8 1 4 17 19 23 1 4 6
Construction Occupations 0 0 0 0 0 0 20 22 18 2 2 6
Cosmetology - - - - - - - - - - - -
Culinary Arts 21 19 20 3 2 2 - - - - - -
Electronics - - - - - - - - - - - -
Equine4 - - - - - - - - - - - -
Graphic Arts/Print Management - - - - - - - - - - - -
Horticulture 15 16 16 0 0 1 19 16 20 1 1 7
HVAC - - - - - - - - - - - -
Manage First - - - - - - - - - - - -
Nail Tech4 - - - - - - - - - - - -
Remedial Bridge - - - - - - - - - - - -
Restaurant Management - - - - - - - - - - - -
Tech Related Math - - - - - - - - - - - -
Warehousing - - - - - - - - - - - -
Welding - - - - - - 16 16 17 1 2 3
Vocational Sub Total 67 67 70 26 16 20 87 73 95 19 9 38
Educational & Vocational Total 172 149 166 47 19 33 281 286 305 42 37 62
Educational and Vocational Program Participation As of August 31, 2018
Taylorville Vandalia
Participants1
Completers2
Participants1
Completers2
Table 3

Illinois Department of Corrections Quarterly Report - October 1, 2018
Educational
Jun Jul Aug Jun Jul Aug Jun Jul Aug Jun Jul Aug
Adult Basic Education (ABE) 91 101 75 2 4 7 173 216 140 25 20 24
Advanced ABE 40 48 57 0 0 0 54 53 61 1 2 3
English Language Learner 0 0 0 0 0 0 0 0 0 0 0 0
Adult Secondary Education (ASE) 30 26 28 0 2 2 25 26 27 5 4 0
College - 2 Year degree - - - - - - 77 76 75 0 8 6
College - 4 Year degree - - - - - - - - - - - -
Title 1 - - - - - - - - - - - -
Educational Sub Total 161 175 160 2 6 9 329 371 303 31 34 33
Vocational
Auto Body 16 16 15 6 0 7 - - - - - -
Automotive Technology 17 18 19 1 1 1 17 19 23 1 2 0
Barbering - - - - - - - - - - - -
Career Technologies3 0 0 0 0 0 0 0 11 14 0 10 9
Commercial Custodian 17 17 18 8 1 0 - - - - - -
Construction Occupations - - - - - - 15 15 18 3 1 5
Cosmetology 16 16 18 0 0 0 - - - - - -
Culinary Arts - - - - - - 15 20 17 9 4 2
Electronics - - - - - - - - - - - -
Equine4 - - - - - - - - - - - -
Graphic Arts/Print Management - - - - - - - - - - - -
Horticulture - - - - - - 0 0 0 0 0 0
HVAC - - - - - - - - - - - -
Manage First - - - - - - - - - - - -
Nail Tech4 - - - - - - - - - - - -
Remedial Bridge - - - - - - - - - - - -
Restaurant Management - - - - - - - - - - - -
Tech Related Math - - - - - - - - - - - -
Warehousing - - - - - - - - - - - -
Welding - - - - - - - - - - - -
Vocational Sub Total 66 67 70 15 2 8 47 65 72 13 17 16
Educational & Vocational Total 227 242 230 17 8 17 376 436 375 44 51 49
Educational and Vocational Program Participation As of August 31, 2018
Vienna Western Illinois
Participants1
Completers2
Participants1
Completers2
Table 3

Illinois Department of Corrections Quarterly Report - October 1, 2018
Educational 1Participant numbers are cumulative totals of all offenders
that spent time in the course.
Jun Jul Aug Jun Jul Aug 2ASE Completers have passed all 4 required tests. Offenders
Adult Basic Education (ABE) 2,304 2,136 2,135 243 219 250 who are mandated to take the ABE are completers when
Advanced ABE 1,238 1,283 1,273 66 96 88 they have either finished the 90 day program or scored a
English Language Learner 42 17 16 2 1 1 6.0 on the T.A.B.E. Career technologies participants are comp-
Adult Secondary Education (ASE) 1,138 1,071 1,158 87 43 69 leters when the student completes the 20 day course requirement.
College - 2 Year degree 417 368 435 9 9 8 All other course completers are determined by the student
College - 4 Year degree - - - - - - completing the required curriculum with satisfactory or better
Title 1 - - - - - - progress.
Educational Sub Total 5,139 4,875 5,017 407 368 416 3Career Technologies - This course provides students with
Vocational orientation for transitioning from education to careers
Auto Body 33 34 33 8 2 11 including interview techniques, resume writing, job search
Automotive Technology 80 87 99 3 16 7 strategies, personal growth and finance.
Barbering 19 26 25 0 0 0 4Vocational numbers for Equine and Nail Tech have been
Career Technologies3 119 130 171 112 103 142 added to table.
Commercial Custodian 208 215 222 44 30 30 5Dixon STC and Stateville Farm’s numbers are included
Construction Occupations 169 187 191 11 29 31 with the parent facility.
Cosmetology 24 24 31 2 1 0 6Text in parenthesis is the parent facility for the program.
Culinary Arts 165 182 175 21 24 17 PNK = Pinckneyville; VIE = Vienna; JAC = Jacksonville
Electronics 0 0 0 0 0 0 IIP = Impact Incarceration Program
Equine4 0 0 0 0 0 0 Note:
Graphic Arts/Print Management 0 0 0 0 0 0 Some offenders may be counted in multiple classes
Horticulture 161 168 173 9 22 24 and repeated in multiple months.
HVAC 0 0 0 0 0 0 Drop outs are included in the cumulative numbers.
Manage First 0 0 0 0 0 0 Dashes (-) are indicated where the programming is not
Nail Tech4 11 12 13 10 0 0 available for that facility.
Remedial Bridge 31 33 43 7 5 16 Zeroes (0) indicate that programming was available, but no
Restaurant Management 0 0 0 0 0 0 students were enrolled.
Tech Related Math 0 0 0 0 0 0 *Due to the uniqueness of course offerings at Kewanee, Logan,
Warehousing 61 74 72 5 22 15 and Murphysboro Life Skills Reentry Centers (LSRC),
Welding 45 44 44 1 2 8 separate tables have been added, see tables 3a - 3c.
Vocational Sub Total 1,126 1,216 1,292 233 256 301 Source: Educational Department Access Database
Educational & Vocational Total 6,265 6,091 6,309 640 624 717
Educational and Vocational Program Participation As of August 31, 2018
Facility Totals
Participants1
Completers2
Table 3

Illinois Department of Corrections Quarterly Report - October 1, 2018
Course Name Participants Completers1 Participants Completers
1 Participants Completers1 Participants Completers
1
Adult Living2 11 11 21 21 22 22 54 54
Advanced Microsoft Office3 7 7 6 6 5 5 18 18
Basic Language Arts4 0 0 0 0 0 0 0 0
Basic Math5 7 7 18 18 15 15 40 40
Book Study6 0 0 8 8 0 0 8 8
Communications I7 29 29 22 22 23 23 74 74
Communications II 0 0 0 0 0 0 0 0
Computer Concepts8 22 22 22 22 23 23 67 67
Coping Through Art9 0 0 8 8 0 0 8 8
Creative Expressions 0 0 6 6 10 10 16 16
Financial Literacy I10 33 33 22 22 22 22 77 77
Financial Literacy II 11 11 19 19 24 24 54 54
Interpersonal Skills11 22 22 23 23 33 33 78 78
Keyboarding12 22 22 22 22 33 33 77 77
Microsoft Excel13 12 12 14 14 6 6 32 32
Microsoft Word14 10 10 0 0 12 12 22 22
Obtaining & Maintaining a Job15 34 34 22 22 22 22 78 78
Orientation16 24 24 33 33 0 0 57 57
Practical Math I17 0 0 0 0 0 0 0 0
Practical Math II 0 0 0 0 0 0 0 0
Practical Math III 0 0 0 0 0 0 0 0
Practical Math IV 0 0 0 0 0 0 0 0
Reading for Entertainment18 0 0 0 0 5 5 5 5
Rules of the Road19 0 0 20 20 0 0 20 20
Service Learning20 8 8 0 0 0 0 8 8
30 Ways to Shine as a New Employee21 11 11 0 0 16 16 27 27
Wellness22 11 11 11 11 19 19 41 41
Adult Secondary Education (ASE) 59 2 60 3 63 1 182 6
Course Totals 333 276 357 300 353 291 1043 867
Program Completions23 44 22 23 89
Kewanee Life Skills Reentry Center Participation and Completion As of August 31, 2018
June July August Totals
Table 3a

Illinois Department of Corrections Quarterly Report - October 1, 2018
College Vocational Programming Participants Completers1 Participants Completers
1 Participants Completers1 Participants Completers
1
Restaurant Management 8 0 12 0 11 2 31 2
Custodial Maintenance 0 0 5 0 5 0 10 0
College Academic Programming
Psychology 271 30 0 29 29 0 0 59 29
Humanities 151 0 0 0 0 0 0 0 0
Music 229 0 0 0 0 0 0 0 0
1Course completer is a student who demonstrates mastery of 75% or more of all skill, knowledge, and objectives presented in the course.
2Adult Living allows students to practice practical skills needed for everyday survival and success.
3Advanced Microsoft Office potentially leads to Microsoft Office Certification.
4Students will receive support in the development of Language Arts skills necessary to be successful in the High School Equivalency course.
5Students will receive support in the development of Math skills necessary to be successful in the High School Equivalency course.
6Student will read and discuss books relevant to the skills they learn in the KLSRC re-entry program.
7Communications teaches students to communicate in informal and formal settings.
8Computer Concepts introduces the concept and purpose of computer operating systems while providing an overview of functions and practical uses.
9Coping Through Art and Creative Expressions teaches expressive arts for self-examination through creative activities to learn better thought management and feeling expression techniques.
10Financial Literacy gives an introduction to personal finance and economy.
11Interpersonal Skills examines nine essential interpersonal skills to compare and explore them through the lives of historical figures and stories.
12Keyboarding introduces students to proper use of a keyboard as well as basic grammar.
13Microsoft Excel teaches basic spreadsheet manipulation and applications.
14Microsoft Word teaches the creation of textual documents.
15Obtaining and Maintaining a Job allows students to perfect their written and oral communication skills and learn the professionalism needed to acquire and keep a job.
16Orientation introduces the student to the basics of KLSRC living and develops each students schedule of courses.
17Practical Math teaches geometry and its everyday uses as it pertains to simple construction.
18Reading for Entertainment focuses on the entertainment value of reading various genres in print.
19Rules of the Road acts as a refresher and update of Illinois driving laws and regulations.
20Service Learning is an experiential course in which offenders engage in activities that address individual and community needs.
2130 Ways to Shine as a New Employee teaches skills essential to being successful at a new job.
22Wellness teaches the basics of healthy living and eating to develop a personal wellness plan.
Computer Concepts, Obtaining and Maintaining a Job, Communications I, Interpersonal Skills, and Financial Literacy I.
23Program Completer is a student who completes or demonstrates mastery through previous coursework or life experience of the following mandatory courses: Orientation, Keyboarding,
Kewanee Life Skills Reentry Center Participation and Completion As of August 31, 2018
June July August Totals
Table 3a

Illinois Department of Corrections Quarterly Report - October 1, 2018
Course Name Participants Completers1 Participants Completers
1 Participants Completers1 Participants Completers
1
Moving On2 - - - - 0 0 0 0
Helping Women Recover3 - - - - 0 0 0 0
A Woman's Way Through 12 Steps4 - - - - 0 0 0 0
Lifesmart5 - - - - 0 0 0 0
Seeking Safety⁶ - - - - 0 0 0 0
Orientation⁷ - - - - 54 54 54 54
Course Totals 54 54 54 54
Program Completions8 0 0
1Course completer is a student who demonstrates mastery of 75% or more of all skill, knowledge, and objectives presented in the course.
3 Helping Women Recover-Substance Abuse program addressing addiction and relationship issues.
4 A Woman's Way through 12 Steps-substance abuse program to help women in recovery.
5 LifeSmart-Educational class regarding health and wellness issue specific to women.
6 Seeking Safety-Cognitive Behavioral Program to address coping with trauma and addiction.
7 Orientation-introduction to the program and goals developed for the women to address in LLSRC.
8 Program Completer is a student who completes or demonstrates mastery through previous coursework or life experience of the following mandatory courses: Orientation, Keyboarding,
Computer Concepts, Obtaining and Maintaining a Job, Communications I, Interpersonal Skills, and Financial Literacy I.
2 Moving On-Cognitive Behavioral Program helping women visualize and achieve a positive future.
Logan Life Skills Reentry Center Participation and Completion As of August 31, 2018
June July August Totals
Table 3b

Illinois Department of Corrections Quarterly Report - October 1, 2018
Course Name Participants Completers22 Participants Completers
22 Participants Completers22 Participants Completers
22
Communications I (CORE/retake)1 0 0 13 13 9 9 22 22
Communications II2 0 0 0 0 0 0 0 0
Communications III3 0 0 0 0 0 0 0 0
Computers (CORE/retake)4 0 0 13 13 10 10 23 23
Coping Through Art5 0 0 0 0 0 0 0 0
Adult Secondary Education (ASE)6 2 0 4 0 7 0 13 0
Adult Basic Education (ABE)7 1 0 1 0 5 0 7 0
Developmental Writing8 0 0 0 0 0 0 0 0
Digital Citizenship9 0 0 0 0 0 0 0 0
Microsoft Office10 0 0 0 0 7 7 7 7
Health & Wellness11 0 0 0 0 0 0 0 0
Obtaining & Maintaining A Job12 10 10 0 0 0 0 10 10
Life Skills/Job Skills (CORE/retake)13 0 0 13 13 8 8 21 21
Study Skills14 0 0 0 0 0 0 0 0
Orientation15 0 0 0 0 0 0 0 0
Practical Math I16 5 5 0 0 0 0 5 5
Practical Math II17 0 0 0 0 0 0 0 0
Reading for Entertainment18 0 0 0 0 0 0 0 0
Reading for Information19 0 0 0 0 0 0 0 0
Financial Literacy I20 4 4 8 7 11 11 23 22
Financial Literacy II20 0 0 0 0 0 0 0 0
Financial Literacy III20 0 0 0 0 0 0 0 0
Rules of the Road21 0 0 6 6 0 0 6 6
Course Totals 0 0 58 52 57 45 137 116
Program Completions23 0 0 0 0
College Vocational Programming
Construction Management 0 0 0 0 0 0 0 0
Horticulture Business Management 0 0 0 0 0 0 0 0
Manufacturing Skills 0 0 0 0 0 0 0 0
College Academic Programming - - - - - - - -
Murphysboro Life Skills Reentry Center Participation and Completion As of August 31, 2018
June July August Totals
Table 3c

Illinois Department of Corrections Quarterly Report - October 1, 2018
1This program will allow participants to develop effective communications skills to utilize in real world situations.
2Provide participants with an opportunity to present an informative speech, a persuasive speech and the special occasion speech.
3Emphasize the interview process and developing a speech.
4This program is intended to increase student’s finger dexterity, skill and proficiencies necessary for quick and accurate information processing on any keyboard.
5Teaches expressive arts for self-examination through creative activities to learn better thought management and feeling expression techniques.
6Provides an opportunity for individuals to enhance their language and writing skills and prepare students to take the official GED test.
7This course is designed provide participants with the skills and knowledge to improve their TABE score.
8This program will provide participants the opportunity to learn the basic sentence structure and grammar.
9 Provides information to Offenders to use digital tools in everyday life.
10Teaches basic creation and use of Microsoft Office Suite programs.
11This course will provide participants with the basics of healthy living. Participants will develop a personalized wellness plan.
12Obtaining and Maintaining a Job allows students to perfect their written and oral communication skills and learn the professionalism needed to acquire and keep a job.
13This program is designed to improve interpersonal skills, explore occupational options and build skills needed to obtain and maintain employment.
14Teaches useful study tips and techniques.
15Orientation introduces the student to the basics of MLSRC living and develops each students schedule of courses.
16These programs will examine practical, everyday uses of Mathematics, with each level concentrating on different concepts and skills.
17These programs will examine practical, everyday uses of Mathematics, with each level concentrating on different concepts and skills.
18This program focuses on the entertainment value of reading various genres in print. Recreational reading will be shown as a positive use of leisure time.
19This program focuses on the informational value of reading various print. Informational reading will be shown as a useful and productive tool.
sound financial planning.
22Course completer is a student who demonstrates mastery of 75% or more of all skill, knowledge, and objectives presented in the course.
Life Skills/Job Skills & Computers.
that allow the participant to display real life investigation and insight into financial management. The participants will use mathematical operations and skills to solve problems involving interest, investment, and
21This is a refresher program and update of Illinois driving laws and regulations, and driver’s license requirements. It will cover the information you must know to pass the written test of traffic laws and signs in
order to obtain basic driving privileges. It includes information on driver’s license, driver license laws, traffic safety issues and general information regarding Illinois traffic laws and ordinances.
23Program Completer is a student who completes or demonstrates mastery through previous coursework or life experience of the following mandatory courses: Orientation, Communications 1,
20These programs will provide participants with the basics on financial practices and literacy. Topics such as goal setting, money management, insurance policies and consumer rights will be coupled with projects
Table 3c

Illinois Department of Corrections Quarterly Report - October 1, 2018
Capacity by FacilityAs of August 31, 2018
Facility
Current
PopulationCurrent Percent
Estimated
August 2018
Estimated
February
2019
Big Muddy River Correctional Center 1,526 1,957 78% 1,957 1,957
Centralia Correctional Center 1,432 1,572 91% 1,572 1,572
Danville Correctional Center 1,727 1,860 93% 1,860 1,860
Decatur Correctional Center (female) 488 788 62% 788 788
Dixon Correctional Center 2,220 2,529 88% 2,529 2,529
East Moline Correctional Center 1,334 1,467 91% 1,467 1,467
Elgin Treatment Center 14 44 32% 44 44
Graham Correctional Center 1,898 2,013 94% 2,013 2,013
Hill Correctional Center 1,643 1,867 88% 1,867 1,867
Illinois River Correctional Center 1,873 2,094 89% 2,094 2,094
Jacksonville Correctional Center 1,351 1,628 83% 1,628 1,628
Joliet Treatment Center 115 544 21% 544 544
Kewanee Life Skills Reentry Center 280 382 73% 382 382
Lawrence Correctional Center 1,932 2,458 79% 2,458 2,458
Lincoln Correctional Center 806 1,019 79% 1,019 1,019
Logan Correctional Center (female) 1,709 2,130 80% 2,130 2,130
Menard Correctional Center 3,216 3,880 83% 3,880 3,880
Murphysboro Life Skills Reentry Center 54 240 23% 240 240
Pinckneyville Correctional Center 2,023 2,964 68% 2,964 2,964
Pontiac Correctional Center 1,239 2,351 53% 2,351 2,351
Robinson Correctional Center 1,194 1,223 98% 1,223 1,223
Shawnee Correctional Center 1,638 2,149 76% 2,149 2,149
Sheridan Correctional Center 1,734 2,107 82% 2,107 2,107
Southwestern Correctional Center 620 705 88% 705 705
Stateville Correctional Center 2,866 3,771 76% 3,771 3,771
Taylorville Correctional Center 1,060 1,221 87% 1,221 1,221
Vandalia Correctional Center 1,242 1,310 95% 1,310 1,310
Vienna Correctional Center 1,137 1,963 58% 1,963 1,963
Western Illinois Correctional Center 1,337 2,175 61% 2,175 2,175
Correctional Center Subtotal 39,708 50,411 79% 50,411 50,411
Crossroads Adult Transition Center2
338 340 99% 340 340
Fox Valley Adult Transition Center (female) 129 130 99% 130 130
North Lawndale Adult Transition Center2
195 200 98% 200 200
Peoria Adult Transition Center 241 248 97% 248 248
Adult Transition Center Subtotal 903 918 98% 918 918
Electronic Detention 48 0 0 0 0
Federal/Other State3
60 0 0 0 0
Women's Treatment Center 1 10 10% 10 10
In-Transit 1 0 - 0 0
Total 40,721 51,339 79% 51,339 51,339
1 Operational Capacity is the total number of beds at a facility.
2 Contractually-operated Adult Transition Center
3 Illinois inmates placed in facilities managed by other states or the federal government.
Note: Data entry delay may cause some discrepancy with other counts.
Note: Elgin Treatment Center opened on April 2, 2018.
Logan Life Skills Reentry Center (LSRC) started orientation in August of 2018 and
is being reported under it's parent facility.
Murphysboro Life Skills Reentry Center (LSRC) opened on April 16, 2018.
Note: Work camps, IIP's, and R&C's are combined with their parent facilities.
Sources: Data retrieved from OERHP101 Housing Availability Report and Planning & Research Extract Files.
Operational Capacity1
Table 4

Illinois Department of Corrections Quarterly Report - October 1, 2018
Facility Population by Cell Type
As of August 31, 2018
Facility Number Percent Number Percent Number Percent Number Percent Total
Big Muddy River Correctional Center 3 0% 1,509 99% 14 1% 0 0% 1,526
Centralia Correctional Center 6 0% 1,416 99% 10 1% 0 0% 1,432
Danville Correctional Center 2 0% 1,715 99% 10 1% 0 0% 1,727
Decatur Correctional Center (female) 7 1% 15 3% 466 95% 0 0% 488
Dixon Correctional Center 345 16% 1,338 60% 536 24% 1 0% 2,220
East Moline Correctional Center 267 20% 407 30% 661 50% 0 0% 1,335
Elgin Treatment Center 14 100% 0 0% 0 0% 0 0% 14
Graham Correctional Center 3 0% 1,864 98% 31 2% 0 0% 1,898
Hill Correctional Center 2 0% 1,636 100% 5 0% 0 0% 1,643
Illinois River Correctional Center 4 0% 1,834 98% 34 2% 0 0% 1,872
Jacksonville Correctional Center 11 1% 0 0% 1,341 99% 0 0% 1,352
Joliet Treatment Center 27 21% 102 79% 0 0% 0 0% 129
Kewanee Life Skills Reentry Center 0 0% 280 100% 0 0% 0 0% 280
Lawrence Correctional Center 3 0% 1,919 99% 10 1% 0 0% 1,932
Lincoln Correctional Center 8 1% 0 0% 798 99% 0 0% 806
Logan Correctional Center (female) 31 2% 548 32% 1,130 66% 0 0% 1,709
Menard Correctional Center 97 3% 3,095 96% 23 1% 0 0% 3,215
Murphysboro Life Skills Reentry Center 0 0% 0 0% 53 100% 0 0% 53
Pinckneyville Correctional Center 12 1% 1,957 94% 108 5% 0 0% 2,077
Pontiac Correctional Center 323 26% 915 74% 1 0% 0 0% 1,239
Robinson Correctional Center 15 1% 0 0% 1,179 99% 0 0% 1,194
Shawnee Correctional Center 19 1% 1,620 99% 0 0% 1 0% 1,640
Sheridan Correctional Center 5 0% 1,687 97% 42 2% 0 0% 1,734
Southwestern Illinois Correctional Center 6 1% 0 0% 614 99% 0 0% 620
Stateville Correctional Center 309 11% 2,549 89% 10 0% 0 0% 2,868
Taylorville Correctional Center 2 0% 0 0% 1,058 100% 0 0% 1,060
Vandalia Correctional Center 1 0% 18 1% 1,223 98% 0 0% 1,242
Vienna Correctional Center 8 1% 1,098 97% 30 3% 0 0% 1,136
Western Illinois Correctional Center 48 4% 1,266 95% 23 2% 0 0% 1,337
Total 1,578 4% 28,788 72% 9,410 24% 2 0% 39,778
Note: Elgin Treatment Center opened on April 2, 2018.
Logan Life Skills Reentry Center (LSRC) started orientation in August of 2018 and is being reported under it's parent facility.
Murphysboro Life Skills Reentry Center (LSRC) opened on April 16, 2018.
Note: Work camps, IIP's, and R&C's are combined with their parent facilities.
Source: Data retrieved from OERHP105 Resident Housing Report
Note: In December 2015 IDOC initiated a major IT transition moving from a DOS-based offender tracking system to a modern, web-based
tracking system. During the transition, some traditional population counts and other measures were not collected or needed validation. Therefore,
the OERHP105 Resident Housing Report from December 2015 to current is still under the validation process; data counts are estimates and
subject to change. Contact the Planning & Research Unit with any questions.
Multi-CelledDouble-CelledSingle-Celled Uncelled1
1 Uncelled refers to when an inmate has been brought into a facility, but not assigned to a cell when the Offender 360 Housing Report was run.
Note: Data entry delay may cause some discrepancy with other counts.
Table 5

Illinois Department of Corrections Quarterly Report - October 1, 2018
Facility Floor Space
As of August 31, 2018
Facility
Approximate
Square Feet
per Inmate
Big Muddy River Correctional Center 31
Centralia Correctional Center 35
Danville Correctional Center 33
Decatur Correctional Center (female) 56
Dixon Correctional Center 38
East Moline Correctional Center 38
Elgin Treatment Center 84
Graham Correctional Center 28
Hill Correctional Center 27
Illinois River Correctional Center 27
Jacksonville Correctional Center 44
Joliet Treatment Center 85
Kewanee Life Skills Reentry Center 35
Lawrence Correctional Center 35
Lincoln Correctional Center 44
Logan Correctional Center (female) 37
Menard Correctional Center 32
Murphysboro Life Skills Reentry Center 50
Pinckneyville Correctional Center 28
Pontiac Correctional Center 28
Robinson Correctional Center 48
Shawnee Correctional Center 34
Sheridan Correctional Center 63
Southwestern Illinois Correctional Center 48
Stateville Correctional Center 34
Taylorville Correctional Center 44
Vandalia Correctional Center 22
Vienna Correctional Center 37
Western Illinois Correctional Center 27
Average 43
Note: The approximate distribution of floor space per inmate only includes minimum actual
living area of the average offender. This does not include dayrooms, control rooms,
janitor closets, plumbing chases, showers, laundry rooms, ADA cells, and various offices.
Note: Elgin Treatment Center opened on April 2, 2018.
Logan Life Skills Reentry Center (LSRC) started orientation in August of 2018 and
is being reported under it's parent facility.
Murphysboro Life Skills Reentry Center (LSRC) opened on April 16, 2018.
Note: Work camps, IIP's, and R&C's are combined with their parent facilities.
Source: Department of Corrections Capacity and Population Data
Table 6

Illinois Department of Corrections Quarterly Report - October 1, 2018
Facility Staff RatiosAs of August 31, 2018
Facility
Big Muddy River Correctional Center 6.0:1 4.7:1 0.167:1 0.215:1
Centralia Correctional Center 4.7:1 3.7:1 0.214:1 0.272:1
Danville Correctional Center 7.2:1 4.8:1 0.140:1 0.209:1
Decatur Correctional Center (female) 3.6:1 2.3:1 0.281:1 0.436:1
Dixon Correctional Center 4.3:1 3.4:1 0.233:1 0.297:1
East Moline Correctional Center 5.7:1 4.1:1 0.177:1 0.241:1
Elgin Treatment Center 0.2:1 0.1:1 5.571:1 6.786:1
Graham Correctional Center 5.7:1 4.3:1 0.176:1 0.234:1
Hill Correctional Center 7.6:1 5.6:1 0.132:1 0.179:1
Illinois River Correctional Center 6.6:1 5.2:1 0.151:1 0.193:1
Jacksonville Correctional Center 4.6:1 3.5:1 0.218:1 0.289:1
Joliet Treatment Center 0.6:1 0.5:1 1.574:1 2.016:1
Kewanee Life Skills Reentry Center 2.5:1 1.6:1 0.404:1 0.607:1
Lawrence Correctional Center 5.8:1 4.6:1 0.172:1 0.215:1
Lincoln Correctional Center (female) 5.3:1 4.0:1 0.188:1 0.250:1
Logan Correctional Center 4.2:1 3.4:1 0.236:1 0.292:1
Menard Correctional Center 4.6:1 3.5:1 0.218:1 0.286:1
Murphysboro Life Skills Reentry Center 0.7:1 0.5:1 1.444:1 1.944:1
Pinckneyville Correctional Center 4.8:1 3.3:1 0.207:1 0.307:1
Pontiac Correctional Center 1.7:1 1.4:1 0.581:1 0.693:1
Robinson Correctional Center 6.5:1 4.7:1 0.153:1 0.212:1
Shawnee Correctional Center 7.1:1 5.3:1 0.141:1 0.190:1
Sheridan Correctional Center 5.8:1 4.4:1 0.174:1 0.228:1
Southwestern Illinois Correctional Center 3.5:1 2.6:1 0.288:1 0.386:1
Stateville Correctional Center 3.0:1 2.4:1 0.337:1 0.420:1
Taylorville Correctional Center 5.7:1 4.1:1 0.175:1 0.244:1
Vandalia Correctional Center 4.6:1 3.3:1 0.217:1 0.299:1
Vienna Correctional Center 4.2:1 3.0:1 0.240:1 0.338:1
Western Illinois Correctional Center 4.7:1 3.6:1 0.213:1 0.276:1
Average 4.5:1 3.4:1 0.224:1 0.294:1
Note: Reflects the end of month number of staff and inmate population on August 31, 2018.
Note: Elgin Treatment Center opened on April 2, 2018.
Logan Life Skills Reentry Center (LSRC) started orientation in August of 2018 and is being reported under it's parent facility.
Murphysboro Life Skills Reentry Center (LSRC) opened on April 16, 2018.
Note: Work camps, IIP's, and R&C's are combined with their parent facilities.
Source: Department of Corrections Data; Operations Management Report
Inmate-to-Security
Staff Ratio
Inmate-to-Total
Staff Ratio
Security Staff per
Inmate Ratio
Total Staff per
Inmate Ratio
Table 7

Illinois Department of Corrections Quarterly Report - October 1, 2018
Capital Projects Currently Funded
Location
Project
Completion
Date
Phase-in
Date Beds Phased-in
Full
Occupancy
Date
Total Number
of Beds
No current capital projects
Table 8
Illinois Department of Corrections Quarterly Report - October 1, 2018
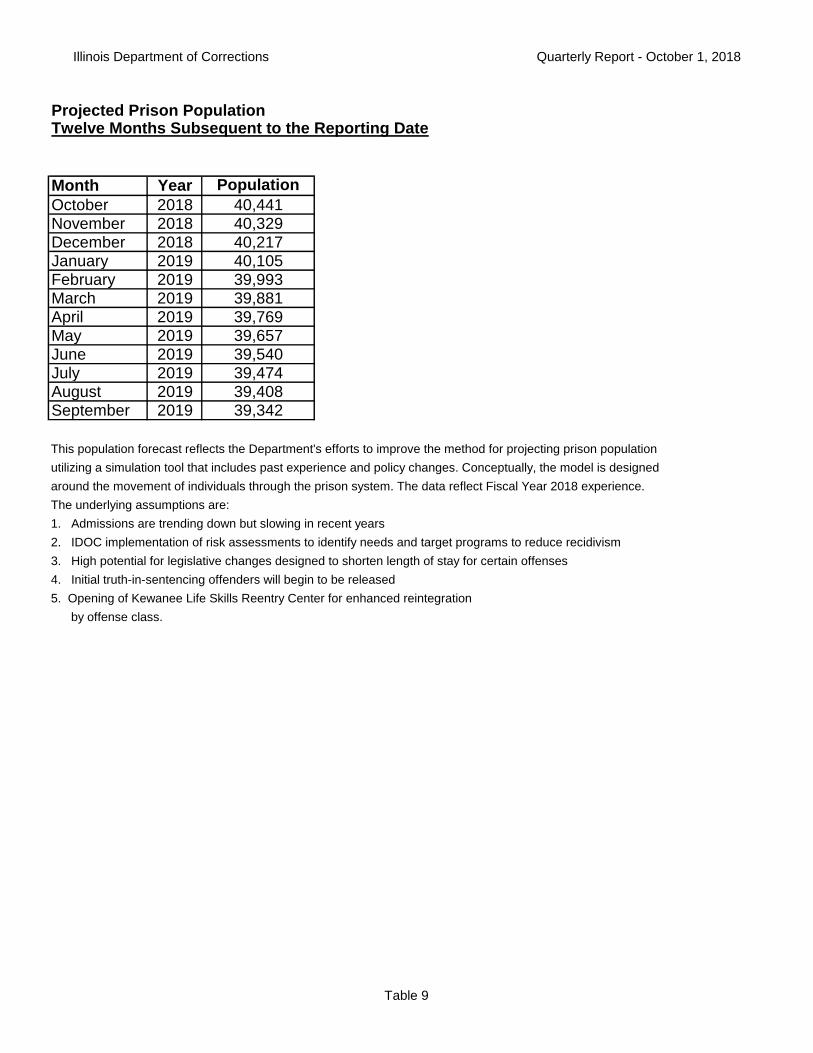
Projected Prison PopulationTwelve Months Subsequent to the Reporting Date
Month Year Population
October 2018 40,441November 2018 40,329December 2018 40,217January 2019 40,105February 2019 39,993March 2019 39,881April 2019 39,769
May 2019 39,657June 2019 39,540July 2019 39,474August 2019 39,408September 2019 39,342
This population forecast reflects the Department's efforts to improve the method for projecting prison population
utilizing a simulation tool that includes past experience and policy changes. Conceptually, the model is designed
around the movement of individuals through the prison system. The data reflect Fiscal Year 2018 experience.
The underlying assumptions are:
1. Admissions are trending down but slowing in recent years
2. IDOC implementation of risk assessments to identify needs and target programs to reduce recidivism
3. High potential for legislative changes designed to shorten length of stay for certain offenses
4. Initial truth-in-sentencing offenders will begin to be released
5. Opening of Kewanee Life Skills Reentry Center for enhanced reintegration
by offense class.
Table 9

Illinois Department of Corrections Quarterly Report - October 1, 2018
Population Projection Comparison
Created in February 2017
Month Year
Actual
Population*
Population
Projection Difference
Percent
Difference
June 2017 43,075 42,726 349 0.82%
July 2017 42,856 42,573 283 0.66%
August 2017 42,654 42,420 234 0.55%
September 2017 42,418 42,267 151 0.36%
October 2017 42,415 42,114 301 0.71%
November 2017 42,126 41,961 165 0.39%
December 2017 41,427 41,808 -381 -0.91%
January 2018 41,095 41,655 -560 -1.34%
February 2018 40,924 41,502 -578 -1.39%
March 2018 41,130 41,349 -219 -0.53%
April 2018 40,952 41,196 -244 -0.59%
May 2018 40,991 41,043 -52 -0.13%
June 2018 40,872 40,889 -17 -0.04%
July 2018 40,786 40,777 9 0.02%
August 2018 40,721 40,665 56 0.14%
* Actual Population is retrieved from the OERPC101 Adult Daily Population Report
Source: Historical Department of Corrections Population Forecasts
Table 9a
Illinois Department of Corrections Quarterly Report - October 1, 2018
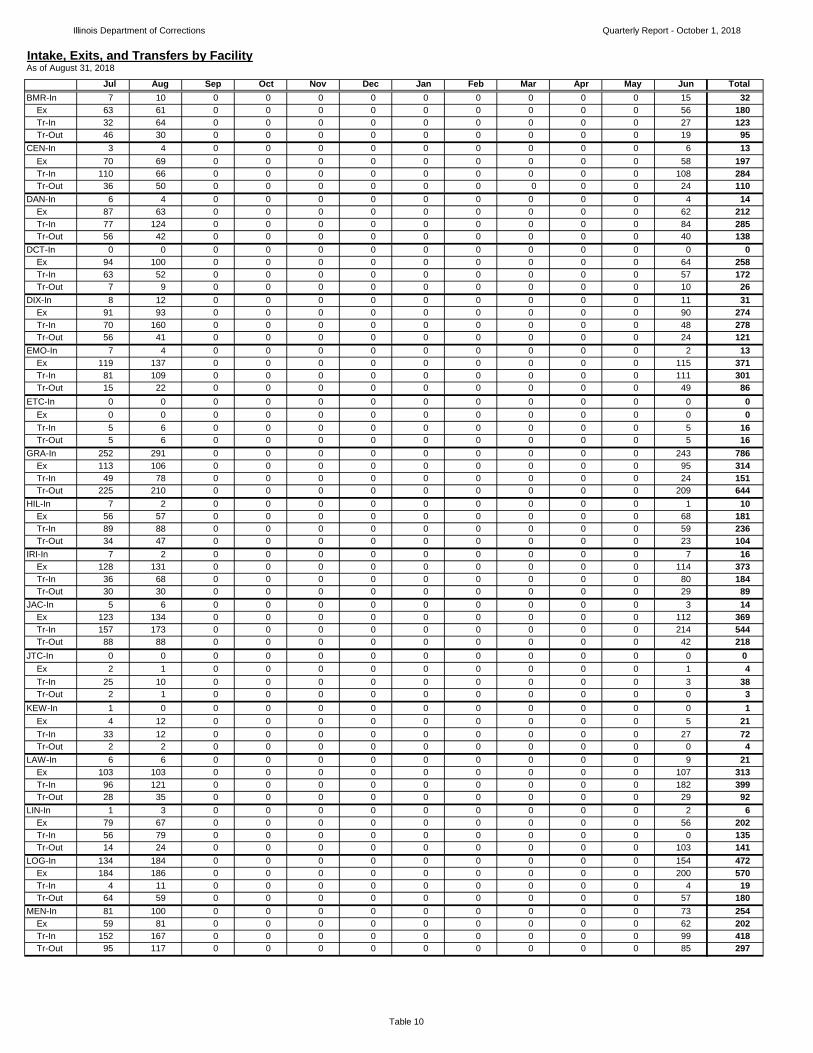
Intake, Exits, and Transfers by FacilityAs of August 31, 2018
Jul Aug Sep Oct Nov Dec Jan Feb Mar Apr May Jun Total
BMR-In 7 10 0 0 0 0 0 0 0 0 0 15 32
Ex 63 61 0 0 0 0 0 0 0 0 0 56 180
Tr-In 32 64 0 0 0 0 0 0 0 0 0 27 123
Tr-Out 46 30 0 0 0 0 0 0 0 0 0 19 95
CEN-In 3 4 0 0 0 0 0 0 0 0 0 6 13
Ex 70 69 0 0 0 0 0 0 0 0 0 58 197
Tr-In 110 66 0 0 0 0 0 0 0 0 0 108 284
Tr-Out 36 50 0 0 0 0 0 0 0 0 0 24 110
DAN-In 6 4 0 0 0 0 0 0 0 0 0 4 14
Ex 87 63 0 0 0 0 0 0 0 0 0 62 212
Tr-In 77 124 0 0 0 0 0 0 0 0 0 84 285
Tr-Out 56 42 0 0 0 0 0 0 0 0 0 40 138
DCT-In 0 0 0 0 0 0 0 0 0 0 0 0 0
Ex 94 100 0 0 0 0 0 0 0 0 0 64 258
Tr-In 63 52 0 0 0 0 0 0 0 0 0 57 172
Tr-Out 7 9 0 0 0 0 0 0 0 0 0 10 26
DIX-In 8 12 0 0 0 0 0 0 0 0 0 11 31
Ex 91 93 0 0 0 0 0 0 0 0 0 90 274
Tr-In 70 160 0 0 0 0 0 0 0 0 0 48 278
Tr-Out 56 41 0 0 0 0 0 0 0 0 0 24 121
EMO-In 7 4 0 0 0 0 0 0 0 0 0 2 13
Ex 119 137 0 0 0 0 0 0 0 0 0 115 371
Tr-In 81 109 0 0 0 0 0 0 0 0 0 111 301
Tr-Out 15 22 0 0 0 0 0 0 0 0 0 49 86
ETC-In 0 0 0 0 0 0 0 0 0 0 0 0 0
Ex 0 0 0 0 0 0 0 0 0 0 0 0 0
Tr-In 5 6 0 0 0 0 0 0 0 0 0 5 16
Tr-Out 5 6 0 0 0 0 0 0 0 0 0 5 16
GRA-In 252 291 0 0 0 0 0 0 0 0 0 243 786
Ex 113 106 0 0 0 0 0 0 0 0 0 95 314
Tr-In 49 78 0 0 0 0 0 0 0 0 0 24 151
Tr-Out 225 210 0 0 0 0 0 0 0 0 0 209 644
HIL-In 7 2 0 0 0 0 0 0 0 0 0 1 10
Ex 56 57 0 0 0 0 0 0 0 0 0 68 181
Tr-In 89 88 0 0 0 0 0 0 0 0 0 59 236
Tr-Out 34 47 0 0 0 0 0 0 0 0 0 23 104
IRI-In 7 2 0 0 0 0 0 0 0 0 0 7 16
Ex 128 131 0 0 0 0 0 0 0 0 0 114 373
Tr-In 36 68 0 0 0 0 0 0 0 0 0 80 184
Tr-Out 30 30 0 0 0 0 0 0 0 0 0 29 89
JAC-In 5 6 0 0 0 0 0 0 0 0 0 3 14
Ex 123 134 0 0 0 0 0 0 0 0 0 112 369
Tr-In 157 173 0 0 0 0 0 0 0 0 0 214 544
Tr-Out 88 88 0 0 0 0 0 0 0 0 0 42 218
JTC-In 0 0 0 0 0 0 0 0 0 0 0 0 0
Ex 2 1 0 0 0 0 0 0 0 0 0 1 4
Tr-In 25 10 0 0 0 0 0 0 0 0 0 3 38
Tr-Out 2 1 0 0 0 0 0 0 0 0 0 0 3
KEW-In 1 0 0 0 0 0 0 0 0 0 0 0 1
Ex 4 12 0 0 0 0 0 0 0 0 0 5 21
Tr-In 33 12 0 0 0 0 0 0 0 0 0 27 72
Tr-Out 2 2 0 0 0 0 0 0 0 0 0 0 4
LAW-In 6 6 0 0 0 0 0 0 0 0 0 9 21
Ex 103 103 0 0 0 0 0 0 0 0 0 107 313
Tr-In 96 121 0 0 0 0 0 0 0 0 0 182 399
Tr-Out 28 35 0 0 0 0 0 0 0 0 0 29 92
LIN-In 1 3 0 0 0 0 0 0 0 0 0 2 6
Ex 79 67 0 0 0 0 0 0 0 0 0 56 202
Tr-In 56 79 0 0 0 0 0 0 0 0 0 0 135
Tr-Out 14 24 0 0 0 0 0 0 0 0 0 103 141
LOG-In 134 184 0 0 0 0 0 0 0 0 0 154 472
Ex 184 186 0 0 0 0 0 0 0 0 0 200 570
Tr-In 4 11 0 0 0 0 0 0 0 0 0 4 19
Tr-Out 64 59 0 0 0 0 0 0 0 0 0 57 180
MEN-In 81 100 0 0 0 0 0 0 0 0 0 73 254
Ex 59 81 0 0 0 0 0 0 0 0 0 62 202
Tr-In 152 167 0 0 0 0 0 0 0 0 0 99 418
Tr-Out 95 117 0 0 0 0 0 0 0 0 0 85 297
Table 10

Illinois Department of Corrections Quarterly Report - October 1, 2018
Intake, Exits, and Transfers by FacilityAs of August 31, 2018
Jul Aug Sep Oct Nov Dec Jan Feb Mar Apr May Jun Total
MUR-In 0 0 0 0 0 0 0 0 0 0 0 0 0
Ex 0 0 0 0 0 0 0 0 0 0 0 0 0
Tr-In 13 13 0 0 0 0 0 0 0 0 0 14 40
Tr-Out 1 1 0 0 0 0 0 0 0 0 0 1 3
PNK-In 4 7 0 0 0 0 0 0 0 0 0 10 21
Ex 158 173 0 0 0 0 0 0 0 0 0 166 497
Tr-In 229 216 0 0 0 0 0 0 0 0 0 171 616
Tr-Out 65 64 0 0 0 0 0 0 0 0 0 35 164
PON-In 5 5 0 0 0 0 0 0 0 0 0 5 15
Ex 33 35 0 0 0 0 0 0 0 0 0 44 112
Tr-In 29 18 0 0 0 0 0 0 0 0 0 62 109
Tr-Out 47 109 0 0 0 0 0 0 0 0 0 31 187
ROB-In 5 14 0 0 0 0 0 0 0 0 0 8 27
Ex 83 106 0 0 0 0 0 0 0 0 0 72 261
Tr-In 153 109 0 0 0 0 0 0 0 0 0 103 365
Tr-Out 86 44 0 0 0 0 0 0 0 0 0 49 179
SHA-In 6 4 0 0 0 0 0 0 0 0 0 7 17
Ex 110 116 0 0 0 0 0 0 0 0 0 112 338
Tr-In 140 127 0 0 0 0 0 0 0 0 0 152 419
Tr-Out 66 59 0 0 0 0 0 0 0 0 0 42 167
SHE-In 0 0 0 0 0 0 0 0 0 0 0 0 0
Ex 207 147 0 0 0 0 0 0 0 0 0 128 482
Tr-In 148 119 0 0 0 0 0 0 0 0 0 98 365
Tr-Out 28 46 0 0 0 0 0 0 0 0 0 24 98
STA-In 1,389 1,474 0 0 0 0 0 0 0 0 0 1,357 4220
Ex 596 678 0 0 0 0 0 0 0 0 0 600 1874
Tr-In 210 321 0 0 0 0 0 0 0 0 0 264 795
Tr-Out 1,200 1,291 0 0 0 0 0 0 0 0 0 1,241 3732
SWC-In 0 0 0 0 0 0 0 0 0 0 0 0 0
Ex 112 77 0 0 0 0 0 0 0 0 0 97 286
Tr-In 62 21 0 0 0 0 0 0 0 0 0 49 132
Tr-Out 12 17 0 0 0 0 0 0 0 0 0 13 42
TAY-In 2 10 0 0 0 0 0 0 0 0 0 9 21
Ex 71 73 0 0 0 0 0 0 0 0 0 59 203
Tr-In 36 51 0 0 0 0 0 0 0 0 0 45 132
Tr-Out 26 23 0 0 0 0 0 0 0 0 0 18 67
VAN-In 4 8 0 0 0 0 0 0 0 0 0 4 16
Ex 232 202 0 0 0 0 0 0 0 0 0 183 617
Tr-In 219 145 0 0 0 0 0 0 0 0 0 160 524
Tr-Out 42 52 0 0 0 0 0 0 0 0 0 73 167
VIE-In 3 2 0 0 0 0 0 0 0 0 0 2 7
Ex 132 161 0 0 0 0 0 0 0 0 0 133 426
Tr-In 91 114 0 0 0 0 0 0 0 0 0 120 325
Tr-Out 40 51 0 0 0 0 0 0 0 0 0 62 153
WIL-In 3 6 0 0 0 0 0 0 0 0 0 5 14
Ex 94 83 0 0 0 0 0 0 0 0 0 117 294
Tr-In 0 5 0 0 0 0 0 0 0 0 0 15 20
Tr-Out 40 78 0 0 0 0 0 0 0 0 0 49 167
TOT-In 1,946 2,158 0 0 0 0 0 0 0 0 0 1,937 6,041
Ex 3,203 3,252 0 0 0 0 0 0 0 0 0 2,976 9,431
Tr-In 2,465 2,647 0 0 0 0 0 0 0 0 0 2,385 7,497
Tr-Out 2,456 2,648 0 0 0 0 0 0 0 0 0 2,386 7,490
In = Intake; Ex = Exit; Tr-In = Transfers In; Tr-Out = Transfers Out
Note: The Department of Corrections manages its population from a total system perspective. Provided in Table 10 are historical
intake (court + supervision violators), exits (adult transition center, Mandatory Supervised Release, parole, discharge, death),
data on inter-institutional transfers in and inter-institutional transfers out.
Note: Elgin Treatment Center opened on April 2, 2018.
Logan Life Skills Reentry Center (LSRC) started orientation in August of 2018 and is being reported under it's parent facility.
Murphysboro Life Skills Reentry Center (LSRC) opened on April 16, 2018.
Note: Work camps, IIP's, and R&C's are combined with their parent facilities.
Source: Data retrieved from O360.
Table 10
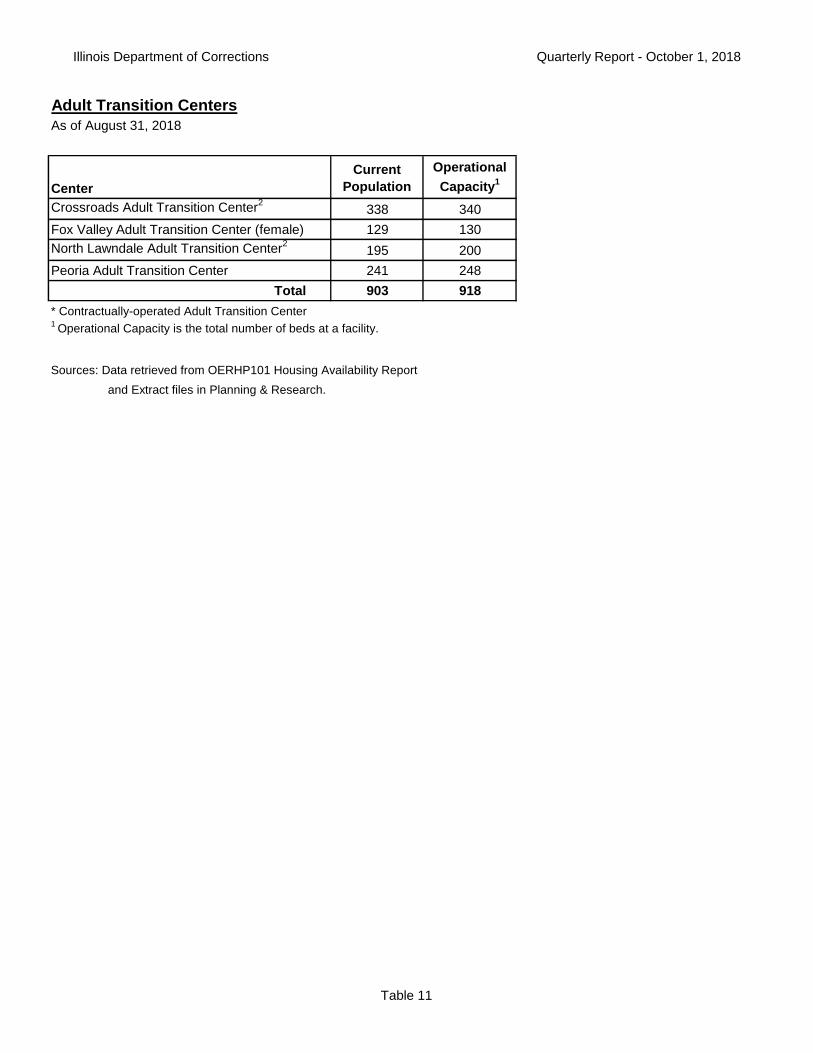
Illinois Department of Corrections Quarterly Report - October 1, 2018
Adult Transition Centers
As of August 31, 2018
Center
Current
Population
Operational
Capacity1
Crossroads Adult Transition Center2
338 340
Fox Valley Adult Transition Center (female) 129 130
North Lawndale Adult Transition Center2
195 200
Peoria Adult Transition Center 241 248
Total 903 918
* Contractually-operated Adult Transition Center1
Operational Capacity is the total number of beds at a facility.
Sources: Data retrieved from OERHP101 Housing Availability Report
and Extract files in Planning & Research.
Table 11

http://www.idoc.state.il.us/
1301 Concordia Court
ILLINOIS DEPARTMENT OF CORRECTIONS
P.O. Box 19277
Springfield, IL 62794-9277
Tel: (217) 558-2200
TDD: (800) 526-0844