Quarterly report on InflatIon December 2012 · Quarterly report on InflatIon DeCeMBer 20125...
88
QUARTERLY REPORT ON INFLATION December 2012
Transcript of Quarterly report on InflatIon December 2012 · Quarterly report on InflatIon DeCeMBer 20125...

Quarterly report on InflatIonDecember 2012

Quarterly report on InflatIonDecember 2012

Published by the Magyar Nemzeti Bank
Publisher in charge: dr. András Simon, Head of Communications
8−9 Szabadság tér, H-1850 Budapest
www.mnb.hu
ISSN 1418-8716 (online)

Quarterly report on inflation • december 2012 3
Act CCVIII of 2011 on the Magyar Nemzeti Bank, defines the primary objective of Hungary’s central bank as the achievement
and maintenance of price stability. Low inflation allows the economy to function more effectively, contributes to better
economic growth over time and helps to moderate cyclical fluctuations in output and employment.
In the inflation targeting system, since August 2005 the Bank has sought to attain price stability by ensuring an inflation
rate near the 3 per cent medium-term objective. The Monetary Council, the supreme decision-making body of the Magyar
Nemzeti Bank, performs a comprehensive review of the expected development of inflation every three months, in order
to establish the monetary conditions consistent with achieving the inflation target. The Council’s decision is the result of
careful consideration of a wide range of factors, including an assessment of prospective economic developments, the
inflation outlook, money and capital market trends and risks to stability.
In order to provide the public with clear insight into the operation of monetary policy and to enhance transparency, the
Bank publishes the information available at the time of making its monetary policy decisions. The Report presents the
inflation forecasts prepared by the Monetary Strategy and Economic Analysis, Financial Analysis and Financial Stability
departments, as well as the macroeconomic developments underlying these forecasts. The Report is published quarterly.
The forecasts of the Monetary Strategy and Economic Analysis and Financial Analysis departments are based on assumption
of endogenous monetary policy. In respect of economic variables exogenous to monetary policy, the forecasting rules used
in previous issues of the Report are applied.
The analyses in this Report were prepared by staff in the MNB’s Monetary Strategy and Economic Analysis and Financial
Analysis departments and Financial Stability department. From chapters 1 to 4 and 6 and 7 were prepared under the
general direction of Ágnes Csermely, Director while chapter 5 was directed by Áron Gereben, Director. The project was
managed by Barnabás Virág, Senior Economist of Monetary Strategy and Economic Analysis. The Report was approved for
publication by Ferenc Karvalits Deputy Governor.
Primary contributors to this Report include: Judit Antal, Dániel Baksa, Gergely Baksay, Tamás Berki, Katalin Bodnár, Iván
Csaba, Orsolya Csortos, Bálint Dancsik, Gergely Fábián, Csaba Fehér, Áron Gereben, Mihály Hoffmann, Dániel Horváth,
Zsuzsanna Hosszú, Emese Hudák, Zsuzsa Kékesi, Gábor Kiss, Norbert Kiss M., Regina Kiss, Tamás Kiss, Péter Koroknai, Zsolt
Kovalszky, Balázs Kóczián, Balázs Krusper, Henrik Kucsera, Zsolt Kuti, Kristóf Lehmann, Rita Lénárt-Odorán, Zsolt Lovas,
Miklós Lukács, Ádám Martonosi, György Molnár, Zsolt Oláh, Gábor Pellényi, Olivér Rácz, István Schindler, Gábor Dániel
Soós, Lajos Szabó, Katalin Szilágyi, Bálint Tamás, Daniella Tóth, Máté Barnabás Tóth, Judit Várhegyi, Viktor Várpalotai,
Barnabás Virág, Balázs Vonnák.
Other contributors to the analyses and forecasts in this Report include various staff members of the Monetary Strategy
and Economic Analysis and the Financial Analysis departments.
The Report incorporates valuable input from the Monetary Council’s comments. The projections and policy considerations,
however, reflect the views of staff in the Monetary Strategy and Economic Analysis and the Financial Analysis departments
and do not necessarily reflect those of the Monetary Council or the MNB.
The projections are based on information available in the period to 12 December 2012.
Published by the Magyar Nemzeti Bank
Publisher in charge: dr. András Simon, Head of Communications
8−9 Szabadság tér, H-1850 Budapest
www.mnb.hu
ISSN 1418-8716 (online)

Quarterly report on inflation • december 2012 55
Contents
the statement of the Monetary Council about the overview of economic
developments and monetary policy assessment 7
1 Inflation and real economy outlook 12
1.1 Inflation forecast 13
1.2 Real economy outlook 16
1.3 Labour market forecast 19
2 effects of alternative scenarios on our forecast 23
3 Macroeconomic overview 25
3.1 The international environment 25
3.2 Aggregate demand 31
3.3 Production and potential output 37
3.4 Employment and labour market 40
3.5 Cyclical position of the economy 43
3.6 Costs and inflation 45
4 financial markets and lending 51
4.1 Trends in the domestic financial market 51
4.2 Interest rate conditions in the financial intermediary system 56
5 Balance position of the economy 59
5.1 External balance and financing 59
5.2 Forecast for Hungary’s external balance position 61
5.3 Fiscal developments 64
6 Special topics 70
6.1 Factors explaining the productivity shortfall 70
7 technical annex: Decomposition of the 2012 and 2013 average inflation 76
Boxes and Special topics in the report, 1998−2011 77

MAGYAR NEMZETI BANK
QuARTERlY REpoRT oN INflATIoN • dEcEMBER 20126
list of boxes
Key important reasons for the change in our 2013 inflation forecast 14
Effects of the long-term increase in corporate tax burdens 18
Changes in Hungary’s export market share in recent years 34
Possible reasons of increasing employment in the labour force survey 41
Effects of administrative wage increases on private sector wages 49
Impact of the regulation governing uncovered European sovereign CDS deals on CDS premia 55
Expected trends in central bank P&L 68

Quarterly report on inflation • december 2012 7
Monetary polICy over the paSt Quarter
In the period from September to November, the Monetary Council reduced the central bank base rate in three successive
steps, by a total of 75 basis points. The Council’s decisions reflected the view that, looking forward, weak domestic
demand would have a substantial disinflationary impact on the economy, which would increasingly dominate inflation
developments as the cost shocks keeping inflation high in the short term dissipated, thereby helping to meet the Bank’s
inflation target. Global risk appetite increased significantly during this period, contributing to a marked decline in
Hungarian risk premia and opening up additional room for manoeuvre in monetary policy.
In its November press release, the Monetary Council indicated that it would consider a further reduction in interest rates
if the improvement in financial market sentiment continued and the medium-term outlook for inflation was consistent
with the Bank’s 3 per cent target.
MaCroeConoMIC DevelopMentS anD outlook
Over the past quarter, the international environment was marked by strongly divergent trends. Financial market sentiment
improved, while the euro-area economy fell back into recession this year and the outlook for global activity deteriorated.
Official announcements on the ongoing crisis management efforts in Europe and further quantitative easing by the US
Federal Reserve both contributed to the increase in investor risk appetite. The Monetary Council expects that the
measures taken by European countries to help manage the crisis in the euro area will live up to the expectations and that
activity on the Continent will recover gradually over the next two years.
Turning to developments in the domestic economy, there has also been a contrast between improving perceptions of risk
and subdued real activity. Output continued to fall in the second and third quarters, though less so than in the first
quarter. Domestic and external factors both contributed to the decline in GDP. While the slowdown in external markets
continues to hinder Hungarian export growth, actions to reduce private and public debts accumulated in the period prior
to the financial crisis, tight credit conditions and the uncertain business environment act as a persistent drag on domestic
demand. Meanwhile, risk premia on Hungarian assets fell sharply amid signs of increasing global risk appetite.
In the Monetary Council’s judgement, the outlook for economic growth has deteriorated recently and output is likely to
grow only modestly over the next two years. Exports are expected to remain the primary source of growth even as
external demand continues to soften, while domestic demand will remain weak. Domestic balance-sheet deleveraging will
continue, with consumption and investment likely to fall further, mainly due to tight credit conditions and the uncertain
business environment, followed by a gradual recovery from 2014. The potential output of the Hungarian economy is likely
to increase very modestly over the next two years, reflecting the sustained weakness in investment and persistently high
unemployment.
the statement of the Monetary Council about the overview of economic developments and monetary policy assessment

MAGYAR NEMZETI BANK
QuARTERlY REpoRT oN INflATIoN • dEcEMBER 20128
Labour market activity has strengthened gradually in recent years, but companies have limited ability to absorb the excess
supply of labour from the market in a weak demand environment. The rate of earnings growth has picked up sharply this
year, with the administrative measures at the start of the year playing a major role. The introduction of the wage
compensation scheme for companies cushioned the upward impact of high earnings growth on costs. Nevertheless, unit
labour costs increased, leading to a deterioration in corporate profitability.
In the Council’s judgement, the rise in unemployment in recent years partly reflects permanent structural problems, but
the labour market is likely to remain loose in the period ahead, even taking account of this factor. In addition to the weak
outlook for growth and companies’ poor profitability, the increases in the minimum wage and the guaranteed minimum
wage for skilled workers are also impeding a recovery in employment, which is only likely to start in the private sector in
2014. Although the job protection scheme to be launched next year is expected to lower the costs of employing labour
under the programme, the Government’s measures, which result in a deterioration in private sector profitability, suggest
that companies will continue to adjust going forward.
The consumer price index has remained persistently above the inflation target this year, despite the recessionary
environment. The high rate of inflation mainly reflects the effects of the commodity price shocks and the Government’s
indirect tax increases, while the pace of underlying inflation remains moderate. Looking ahead, inflation is expected to
slow significantly in the short term, mainly reflecting movements in items excluded from the core measure. In the medium
term, however, the burden placed on companies by the administrative measures and the minimum wage increase will
strengthen the pass-through of higher costs to prices, which in turn may generate cost-push inflationary pressure along
the entire production chain.
In terms of the outlook for inflation, there is significant uncertainty about the extent and timing of the pass-through of
higher corporate costs to prices in the wake of those measures and the ability of weak domestic demand to offset this.
In the Monetary Council’s judgement, Hungary’s net external financing capacity is likely to rise further in the coming
years. This improvement in the economy’s external position will reflect the steady increase in the surplus on goods and
services and higher inflows of EU transfers. However, the negative income balance is likely to deteriorate further.
In 2012 and 2013, the fiscal deficit is expected to be broadly consistent with the Government’s target. The measures
announced in recent months are likely to lead to a significant improvement in the fiscal balance in 2013. There is
considerable uncertainty about the expected size of deficit in 2014. The Government’s commitment to maintaining a low
fiscal deficit path may contribute to long-term fiscal sustainability, but the slowdown in potential growth may have the
opposite effect.
Maintaining its earlier position, the Council continues to consider it crucial that an agreement between the Government
and the European Union and International Monetary Fund be reached, as this would contribute to a sustained improvement
in risk perceptions and a decline in yields as well as to the sustainability of government debt and would help support
lending activity and improve the investment climate.
Monetary polICy ConSIDeratIonS
The macroeconomic outlook is surrounded by a considerable degree of uncertainty. With a negative output gap and
inflation remaining at high levels, the latest government measures will raise companies’ production costs. One key issue
in terms of the medium-term inflation outlook relevant for monetary policy is the ability of the corporate sector to adjust
to the increase in production costs against the backdrop of a weaker outlook for growth.
The sustained decline in profitability may prompt companies to cut back further on investment expenditure, which in turn
may lead to a slowdown in potential output growth. In the short run, given the amount of capital available to them,
companies may choose to restore profitability by improving productivity and reducing wage costs. Furthermore, they may
attempt to pass on increased costs into prices, which in turn may imply higher consumer prices. The relative strength of
these adjustment channels depends on the extent to which the availability of unused capacity is able to exert discipline
on price and wage-setting and inflation expectations are well-anchored. The aim of monetary policy is to ensure that this

Quarterly report on inflation • december 2012 9
THE STATEMENT OF THE MONETARy COUNCIL
adjustment takes place against the background of moderate wage and price dynamics, in order to make it possible to meet
the 3 per cent inflation target in the medium term. The Monetary Council will closely monitor developments in tax-
adjusted inflation.
In the Monetary Council’s judgement, the potential growth rate of the Hungarian economy has fallen significantly recently,
reflecting the postponement of investment decisions and financing constraints on companies; there is, however,
considerable uncertainty about the magnitude of the reduction in productive capacity available to businesses. If the supply
side of the economy has been damaged only to a smaller extent, companies will have less room to pass on increased costs
into prices, due to the stronger disinflationary impact of unused capacities. All this may result in more moderate inflation
in the medium term, which is more consistent with a looser monetary policy. By contrast, if companies expect the high
inflation environment of recent years to persist, the passing on of cost pressures to prices may be stronger. At the same
time, economic agents’ higher inflation expectations may also affect wage-setting, in addition to price-setting decisions,
which in turn would impede the recovery in profitability in the medium term and would merely lead to a higher nominal
path. Corporate adjustment through higher price and wage dynamics can be prevented by tightening monetary policy.
The room for manoeuvre in monetary policy is materially influenced by perceptions of the risks associated with the
economy, which have fallen significantly in recent months, mainly reflecting global factors. Looking ahead, the Council
judges that there are both upside and downside risks to changes in risk perceptions. The contrast between weak global
economic activity and strong risk appetite in international financial markets warrants a cautious monetary policy stance.
At the same time, progress with the institutional reforms in the euro area, the reduction in fiscal risks in the US as well
as expectations related to the success of domestic fiscal consolidation may increase the room for interest rate policy
manoeuvre in Hungary.
In the Council’s assessment, the high level of excess capacity in the economy offsets medium-term inflationary risks. This
is supported by the fact that underlying inflation remains moderate and inflation is kept high by transient factors. In the
weak demand environment, the corporate sector can adjust to the upward effects of the Government measures on costs
only through moderate price increases. Given the slack conditions in the labour market, the rate of earnings growth is
likely to slow as the effects of administrative measures fade. Taking these factors into account, the inflation target can
be met even if monetary conditions are eased. The Council will consider a further reduction in interest rates only if the
improvement in financial market sentiment continues and incoming data confirm that the inflation target is achievable on
the horizon relevant for monetary policy.
MAGYAR NEMZETI BANK
QuARTERlY REpoRT oN INflATIoN • dEcEMBER 201210
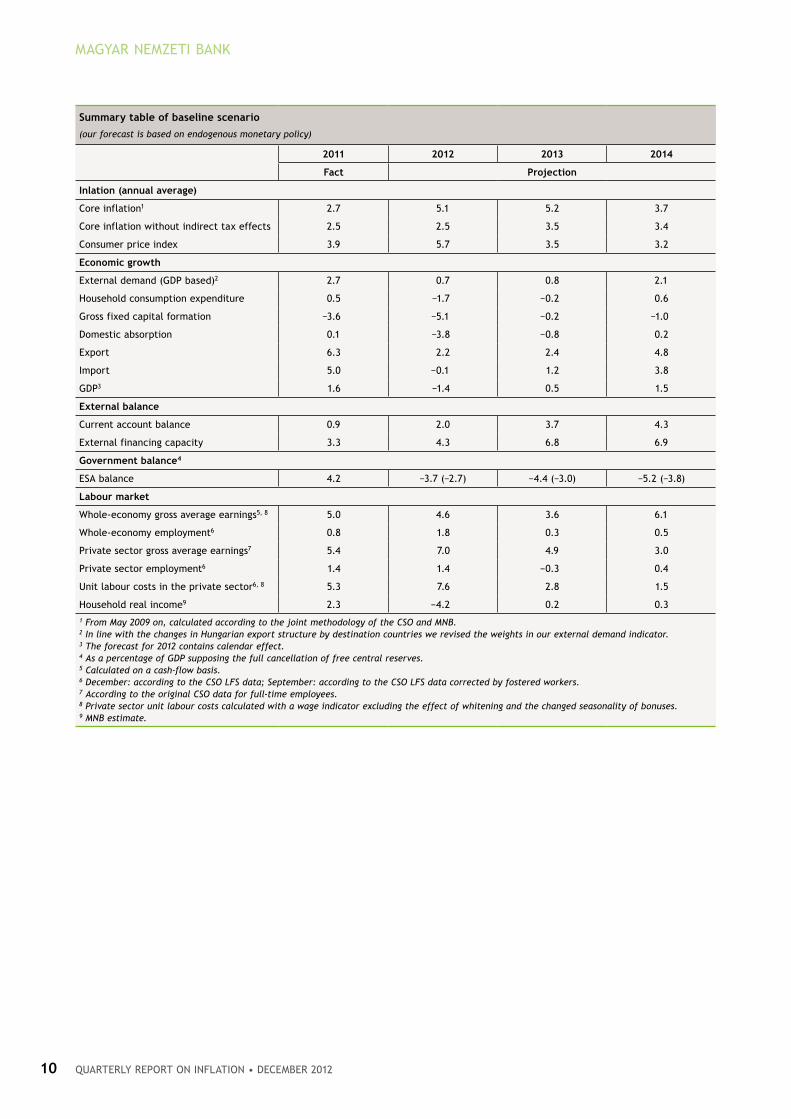
Summary table of baseline scenario
(our forecast is based on endogenous monetary policy)
2011 2012 2013 2014
fact projection
Inlation (annual average)
Core inflation1 2.7 5.1 5.2 3.7
Core inflation without indirect tax effects 2.5 2.5 3.5 3.4
Consumer price index 3.9 5.7 3.5 3.2
economic growth
External demand (GDP based)2 2.7 0.7 0.8 2.1
Household consumption expenditure 0.5 −1.7 −0.2 0.6
Gross fixed capital formation −3.6 −5.1 −0.2 −1.0
Domestic absorption 0.1 −3.8 −0.8 0.2
Export 6.3 2.2 2.4 4.8
Import 5.0 −0.1 1.2 3.8
GDP3 1.6 −1.4 0.5 1.5
external balance
Current account balance 0.9 2.0 3.7 4.3
External financing capacity 3.3 4.3 6.8 6.9
Government balance4
ESA balance 4.2 −3.7 (−2.7) −4.4 (−3.0) −5.2 (−3.8)
labour market
Whole-economy gross average earnings5, 8 5.0 4.6 3.6 6.1
Whole-economy employment6 0.8 1.8 0.3 0.5
Private sector gross average earnings7 5.4 7.0 4.9 3.0
Private sector employment6 1.4 1.4 −0.3 0.4
Unit labour costs in the private sector6, 8 5.3 7.6 2.8 1.5
Household real income9 2.3 −4.2 0.2 0.31 From May 2009 on, calculated according to the joint methodology of the CSO and MNB.2 In line with the changes in Hungarian export structure by destination countries we revised the weights in our external demand indicator. 3 The forecast for 2012 contains calendar effect.4 As a percentage of GDP supposing the full cancellation of free central reserves.5 Calculated on a cash-flow basis.6 December: according to the CSO LFS data; September: according to the CSO LFS data corrected by fostered workers.7 According to the original CSO data for full-time employees.8 Private sector unit labour costs calculated with a wage indicator excluding the effect of whitening and the changed seasonality of bonuses.9 MNB estimate.

Quarterly report on inflation • december 2012 11
The staff forecast is founded on an endogenous interest rate path and is based on the Monetary Policy Model developed
by the MNB.1 In this model, monetary policy reactions are mainly influenced by the expected deviations in inflation from
the medium-term inflation target over the time horizon relevant for monetary policy and by our picture of the cyclical
position of the economy. Staff have calibrated the sensitivity of the reaction function to individual variables on the basis
of past decisions of the Monetary Council and international experience. The forecasts of the staff are based on assumptions
in a number of areas. Considering that the assumptions applied involve a high degree of uncertainty, the Council also takes
into account further information, in addition to the results of the model. Accordingly, while the interest rate path implied
by the model may provide valuable information for the decisions of the Monetary Council, it does not necessarily coincide
with the decisions of the Council at all times.
1 For more details on the model, see Chapter 6.1 of the March 2011 issue of the Quarterly Report on Inflation and the following study: Ágnes HorvÁtH, Csaba Köber and Katalin szilÁgyi (2011), “MPM − The Magyar Nemzeti Bank’s monetary policy model”, MNB Bulletin, June.

Quarterly report on inflation • december 201212
The Hungarian economy continues to be characterised by weak activity. The latest macroeconomic data shows that
domestic demand continues to be subdued, while the economic performance of Hungary’s export markets is also declining.
The economy has considerable excess capacity and the output gap is negative. Indirect tax and commodity price increases
have kept inflation above the 3 per cent target this year, in spite of the disinflationary effect of weak demand. Employment
continued to expand despite the recessionary environment, while administrative measures lead to generally high wage
dynamics. The increase in unit labour cost, rising commodity prices and the taxes burdening certain sectors resulted in a
deterioration in corporate profitability.
The recently announced government measures ensure the achievement of the 2013 fiscal deficit target, mainly through a
sustained increase in the tax burden on the private sector. Administrative wage increases that exceed growth in
productivity may also result in an increase in firms’ production costs. Accordingly, our forecast is determined by the
weakening business conditions and the adjustment of companies to government measures. The cost-increasing effect of
the measures that affect specific sectors are fed into the corporate sector as a whole through the partial pass-through of
the burdens. Companies may react to the further weakening in the income position partly through restraining employment
and wages and partly by raising their sales prices. In the weak demand environment, pass-through into consumer prices
may remain gradual, but over the forecast horizon the cost pressure may result in wide-ranging price increases in the
consumer basket. On the one hand, the deteriorating profitability due to cut-backs in investment results in a further
decline in domestic demand, and on the other hand, due to its unfavourable effect on production capacities, it also reduces
the potential growth rate. The reduction of wage costs may primarily be reflected in lower wage increases of employees
not affected by the minimum wage increase and restraint in regular non-wage benefits.
Despite the weak demand conditions the purchasing power of households will increase in 2013 with government measures
playing a major role. However, the uncertain economic environment, persistently weak lending activity and the continued
reduction of the debt accumulated prior to the crisis will moderate domestic demand for years, while only a slow pick-up
is expected in Hungary’s external markets. In line with the above, following this year’s downturn, only moderate economic
growth is expected over the forecast horizon. Output will remain below its potential level throughout the period.
The decrease in household energy prices will significantly reduce consumer price inflation in the short run. However, the
rise in the production costs of firms will gradually increase underlying inflation from middle of next year. Following partial
pass-through of the increased costs, the effect of the negative output gap will prevail, thus the inflation target can be
achieved in the second half of 2014.
The macroeconomic factors that determine the interest rate path consistent with the baseline forecast continue to point
in opposite directions. The negative output gap in itself, would justify a looser monetary policy stance. The increase in
production costs of the corporate sector works against the disinflationary effect of the negative output gap. In the baseline
scenario of the forecast, we assume that − despite the weak demand conditions − firms adjust partly through their pricing
−, which leads to inflation pressures. However the size and the time-profile of the pass-through of cost increases are
surrounded by significant uncertainty. Looking at the first half of the horizon in our baseline forecast, the factors pointing
in the direction of tightening and easing broadly cancel each other out. Room for decreasing the interest rate will be
available when cost push inflation dissipates.
1 Inflation and real economy outlook

Quarterly report on inflation • december 2012 13
Our inflation forecast is determined by the feed-through of
the effect of cost shocks, the production cost-increasing
effect of government tax measures and the output gap,
which is negative over the entire forecast horizon. Compared
to the September forecast, we expect considerably lower
inflation over the short run (for details see Box 1-1).
Although medium-term inflationary pressure strengthened
due to the increase in production costs, inflation may
remain close to the 3 per cent target over 2013 as well,
thanks to steadily more favourable developments in non-
core inflation items, mainly as a result of government
measures (Chart 1-1).
Developments in the prices of non-core inflation items are
lower over the entire forecast horizon compared to our
September forecast. Most of the recent increase in
agricultural commodity prices has already appeared in the
inflation of unprocessed food, and thus no further price
increases are expected in this product group. With the
appearance of the new harvest, prices may even reflect
some correction in the second half of 2013. Mainly as a
result of the appreciation of the forint vis-a-vis the US
dollar, oil prices have declined since September, a trend
which may continue in the coming years on the basis of
futures prices. In line with the government’s announcements,
a 10 per cent reduction may take place in the prices of gas,
electricity and district heating for households as of January
2013, considerably reducing the overall consumer price
index as well (Chart 1-2).
The pricing of processed goods and services is determined
by the feed-through of the high agricultural commodity
prices and the production cost-increasing effects of
government measures. The feed-through effect of high
agricultural commodity prices has already been reflected in
processed food prices in recent months. These developments
may continue at the beginning of next year as well.
According to the adopted budget, the tax burden on
1.1 Inflation forecast
Inflation may decline considerably over the short run, due mainly to the announced reduction of regulated prices. Core
inflation, however, may gradually rise in the medium term, as the considerable increase in the corporate tax burden −
feeding through the production chain − may result in elevated inflationary pressure in an increasingly large part of the
consumer basket. With cost pressure appearing in the medium term and the price-reducing effect of weak demand
prevailing over the entire forecast horizon, the inflation target can be achieved in the second half of 2014.
Chart 1-1
fan chart of the inflation forecast
−1
0
1
2
3
4
5
6
7
8
−1
0
1
2
3
4
5
6
7
8
2008 2009 2010 2011 2012 2013 2014
Per cent Per cent
Inflation target
Chart 1-2
CpI forecast
0
2
4
6
8
10
12
0
2
4
6
8
10
12
2001
2002
2003
2004
2005
2006
2007
2008
2009
2010
2011
2012
2013
2014
Per centPer cent
CPICPI excluding indirect taxes and subsidies

MAGYAR NEMZETI BANK
QuARTERlY REpoRT oN INflATIoN • dEcEMBER 201214
companies may increase permanently. The increasing tax
burden on specific sectors results in a rise in costs in an
increasingly broad part of the production chain. According
to our forecast, over the short run, companies will react to
the deterioration in profitability stemming from the
elevated costs mainly by restraining wages and to some
extent the number of employees. In the medium term,
however, in parallel with an upturn in demand, the effect
of shifting a part of the cost increase will also appear in an
increase in consumer prices. The output gap, although
closing gradually, will remain negative over the entire
forecast horizon, and therefore the price-restraining effect
of weak demand will prevail over the entire period. Core
inflation, however, will still remain high, and inflation will
decline only slowly in the medium term (Chart 1-3).
As a result of all of these factors, inflation is forecast to be
somewhat above the 3 per cent target both this year and
next year. With the interest rate path assumed in the
forecast, the inflation target may be achieved in the second
half of 2014 (Table 1-1). The factors behind the change in
our 2013 inflation forecast are explained in detail in Box 1-1.
table 1-1
Details of the inflation forecast
2011 2012 2013 2014
Core inflation 2.7 5.1 5.2 3.7
non-core inflation
Unprocessed food 4.3 6.8 5.9 4.0
Gasoline and market energy 13.8 11.9 0.2 1.3
Regulated prices 4.0 4.7 −1.0 2.3
Total 6.4 6.8 0.4 2.3
Consumer price index 3.9 5.7 3.5 3.2
Chart 1-3
Decomposition of the inflation forecast
−1
0
1
2
3
4
5
6
7
8
−1
0
1
2
3
4
5
6
7
8
2008 2009 2010 2011 2012 2013 2014
Per centPer cent
Core inflationNon-core inflationIndirect tax effectConsumer price index
In our current inflation forecast, we project a 3.5 per cent rate of inflation for 2013, while in September we expected a considerably
higher inflation of 5.0 per cent. The unusual size of this revision results from several factors, with factors exogenous in terms of the
forecast playing the leading role.
• The most important factor is the Government’s announcement that regulated energy prices (gas, electricity, district heating) will
decline by 10 per cent as of 1 January. Taking into account the significant weight of the items concerned, this measure reduces our
inflation forecast by more than 1 percentage point.
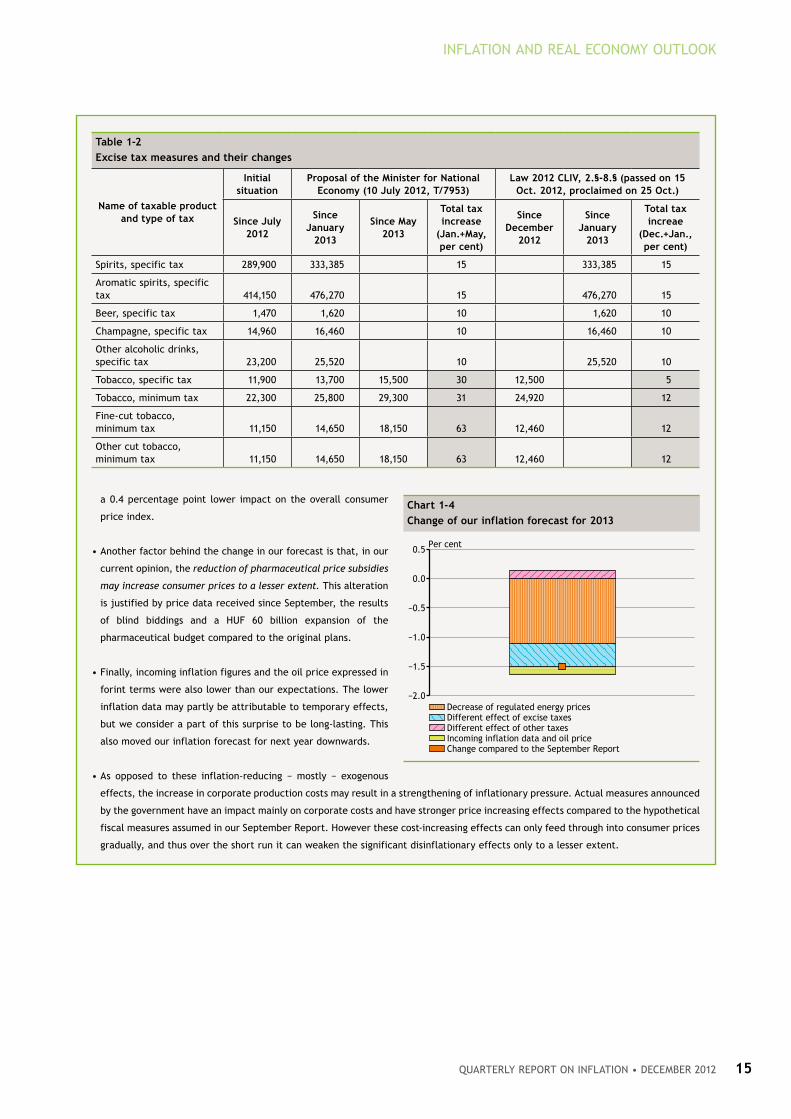
• In addition to the above measure, the change in the excise tax regulations also plays an important role. Our September forecast was
based on the assumption that − in accordance with the bill submitted as a proposal by the Government in July − significant alcohol
and tobacco excise tax increases would take place in January and May 2013 (see Table 1-2). In October, the National Assembly
amended the bill, and then adopted its amended version. Under the amendment, the excise tax on tobacco products increased to a
much lesser extent, and the measure entered into effect in one step, in December 2012. No amendment took place in the case of
alcohol products. The change in the magnitude of the excise tax increase in the indirect tax measures that affect inflation justified
Box 1-1
key important reasons for the change in our 2013 inflation forecast
Quarterly report on inflation • december 2012 15
INFLATION AND REAL ECONOMy OUTLOOK
a 0.4 percentage point lower impact on the overall consumer
price index.
• Another factor behind the change in our forecast is that, in our
current opinion, the reduction of pharmaceutical price subsidies
may increase consumer prices to a lesser extent. This alteration
is justified by price data received since September, the results
of blind biddings and a HUF 60 billion expansion of the
pharmaceutical budget compared to the original plans.
• Finally, incoming inflation figures and the oil price expressed in
forint terms were also lower than our expectations. The lower
inflation data may partly be attributable to temporary effects,
but we consider a part of this surprise to be long-lasting. This
also moved our inflation forecast for next year downwards.
• As opposed to these inflation-reducing − mostly − exogenous
effects, the increase in corporate production costs may result in a strengthening of inflationary pressure. Actual measures announced
by the government have an impact mainly on corporate costs and have stronger price increasing effects compared to the hypothetical
fiscal measures assumed in our September Report. However these cost-increasing effects can only feed through into consumer prices
gradually, and thus over the short run it can weaken the significant disinflationary effects only to a lesser extent.
table 1-2
excise tax measures and their changes
name of taxable product and type of tax
Initial situation
proposal of the Minister for national economy (10 July 2012, t/7953)
law 2012 ClIv, 2.§-8.§ (passed on 15 oct. 2012, proclaimed on 25 oct.)
Since July 2012
Since January
2013
Since May 2013
total tax increase
(Jan.+May, per cent)
Since December
2012
Since January
2013
total tax increae
(Dec.+Jan., per cent)
Spirits, specific tax 289,900 333,385 15 333,385 15
Aromatic spirits, specific tax 414,150 476,270 15 476,270 15
Beer, specific tax 1,470 1,620 10 1,620 10
Champagne, specific tax 14,960 16,460 10 16,460 10
Other alcoholic drinks, specific tax 23,200 25,520 10 25,520 10
Tobacco, specific tax 11,900 13,700 15,500 30 12,500 5
Tobacco, minimum tax 22,300 25,800 29,300 31 24,920 12
Fine-cut tobacco, minimum tax 11,150 14,650 18,150 63 12,460 12
Other cut tobacco, minimum tax 11,150 14,650 18,150 63 12,460 12
Chart 1-4
Change of our inflation forecast for 2013
−2.0
−1.5
−1.0
−0.5
0.0
0.5Per cent
Decrease of regulated energy pricesDifferent effect of excise taxesDifferent effect of other taxesIncoming inflation data and oil priceChange compared to the September Report

Quarterly report on inflation • december 201216
Over the past three quarters, GDP has declined. This
recession is explained by a simultaneous contraction in
external and domestic demand. In both Hungary and its
export markets, weak demand is mainly attributable to
fiscal balance-improving measures, tight lending conditions
and the uncertainty related to medium-term prospects.
More robust growth in Hungary’s export markets is only
expected to be seen in 2014, whereas lending conditions
may remain tight over the entire forecast horizon.
In line with developments in global economic activity,
export growth is only likely to pick up in 2013. There has
been no significant expansion in the market share of
Hungarian exports in recent years. Looking ahead, even
with the new automotive industry capacities, only a slight
increase in export market share is expected (for more
details, see Box 3-1 [Chart 1-6]).
Tight conditions continue to prevail in lending. Compared to
our September forecast, the increase in the magnitude of
the transaction tax and the switch to a permanent bank tax
significantly impairs the expected lending activity of the
financial intermediary system. As a result of all this, we
have carried out a downward revision of our forecast
scenario in both the corporate and household segments; we
still do not expect any pick-up in lending over the forecast
horizon (Chart 1-7).
Consumption will decrease this year, as a result of a decline
in the real value of earnings and financial transfers, the
continued balance sheet adjustment and tight lending
conditions. Real income of households, however, will
increase again next year, which is attributable to the joint
effect of several factors. Fiscal adjustment measures only
have a moderate direct impact on households’ incomes,
1.2 real economy outlook
According to our forecast, the output of the Hungarian economy will decline this year and will probably grow only slowly
in 2013 as well. Growth continues to be driven by net exports, but the expansion in exports is expected to be slower than
in the past, due to the generally deteriorating outlook for international economic activity. Domestic demand remains
persistently weak. Consumption and investment may continue to decline both this year and next year as a result of
domestic agents’ protracted balance-sheet adjustments, tight lending conditions and the uncertain economic environment.
The increase in the tax burden on the private sector also points to a decline in investment. With unemployment remaining
at a high level and investment activity persistently slack, potential economic growth may also remain subdued for a
prolonged period.
Chart 1-5
fan chart of the GDp forecast
−8
−7
−6
−5
−4
−3
−2
−1
0
1
2
3
4
5
−8
−7
−6
−5
−4
−3
−2
−1
0
1
2
3
4
5
2008 2009 2010 2011 2012 2013 2014
Per cent Per cent
Chart 1-6
Changes in export market share
−15
−10
−5
0
5
10
15
20
−15
−10
−5
0
5
10
15
20
2000
2001
2002
2003
2004
2005
2006
2007
2008
2009
2010
2011
2012
2013
2014
Per centPer cent
Export market shareExportExternal demand

Quarterly report on inflation • december 2012 17
INFLATION AND REAL ECONOMy OUTLOOK
while their purchasing power is increased markedly by the
decline in inflation due to the reduction of energy prices.
Next year’s minimum wage increase will add to the income
of those with low earnings, while the rise in pensions will
also exceed inflation. The expansion in real incomes may
partly be offset by companies’ reaction to the increase in
their tax burden resulting from the measures, i.e. a gradual
reduction in labour costs.
Growing real income points to an expansion in consumption.
However, due to the continued balance-sheet adjustment,
uncertain prospects for economic activity and tight credit
conditions, households are expected to save a portion of
the additional income or use it for debt reduction.
Therefore, consumption may remain close to the current
low level, while households’ net saving rate may remain
high over the entire forecast horizon (Chart 1-8).
Investment activity will decline considerably in 2012 and
may continue to shrink somewhat in 2013. Over the forecast
horizon investment activity in the private and government
sectors is expected to diverge. In the private sector
investment performance is expected to remain subdued for
a prolonged period. Corporate investment activity is
strongly limited by the unfavourable economic prospects
and the persistently tight credit conditions. In addition,
companies may react to the permanent increase in the tax
burden by cut-backs in investment, resulting in a further
decline in investment activity and keeping the investment
rate at a historically low level. During balance-sheet
adjustment, households are expected to adjust more
strongly through their accumulation of savings than through
their consumption expenditures. In the case of government
investment, the projects financed by EU funds may lead to
substantial growth, particularly in 2013.
There continues to be considerable excess capacity in the
economy. The output gap gradually closes over the forecast
horizon, but will remain negative for the entire period.
Companies will react to the production cost-increasing
measures partly by restraining their investment activity,
which, looking ahead, will reduce the supply capacities of
the economy. Therefore, we expect low potential growth
for a prolonged period of time in our forecast (Chart 1-9).
Chart 1-7
our forecast for household and corporate lending
−300
−200
−100
0
100
200
300
400
500
600
2005 2008 2011 2014
HUF Bn
Firms net borrowing
−800−700−600−500−400−300−200−100
0100200300400500
2005 2008 2011 2014
HUF Bn
Households net borrowing
Chart 1-8
use of household income
65
70
75
80
85
90
95
−15
−10
−5
0
5
10
15
20
25
2000
2001
2002
2003
2004
2005
2006
2007
2008
2009
2010
2011
2012
2013
2014
Percentage of PDI Percentage of PDI
Net financial saving rateInvestment rateConsumption rate (right-hand scale)
Chart 1-9
Changes in GDp growth
−12
−10
−8
−6
−4
−2
0
2
4
6
8
−12
−10
−8
−6
−4
−2
0
2
4
6
8
2004 2005 2006 2007 2008 2009 2010 2011 2012 2013 2014
Per centPer cent
Final consumption of householdsActual final consumption of governmentGross fixed capital formationChanges in inventoriesNet exportGDP

MAGYAR NEMZETI BANK
QuARTERlY REpoRT oN INflATIoN • dEcEMBER 201218
During 2012, the Government took numerous measures to improve the fiscal balance. A considerable portion of these measures
changed the sector-specific taxes originally intended to be temporary into permanent sources of revenue. These taxes which are
becoming permanent or are increasing will now impair corporate profitability not only temporarily, but over the long term as well.
Although the job protection plan entails significant tax cuts for the companies involved, the balance of the all new tax measures on
the corporate sector is negative. In addition, the considerable increase of the minimum wage in 2012-13 raises the operating cost of
firms further. The total cost increase of firms compared to 2011 exceeds 2 per cent of GDP.
Although the tax increase primarily affects only a handful of sectors and their products, operating costs are expected to rise in the
entire private sector due to strong and far-reaching input-output linkages.
Companies can react to the temporary and permanent tax measures in different ways. If they consider the tax temporary, over the
short run they may accept a decline in their profit, expecting that their profitability will be restored over the long term. In this case,
they may offset the short-term loss in profit mainly by cost savings, and less by price increases. However, if the taxes are permanent,
they need to adjust to restore the long-term return on investments. Therefore, companies may switch over to more labour-intensive
production and may expand their capacities more slowly over the long term. All of this entails persistently lower investment activity.
Earlier research conducted by the MNB also confirms that investment reacts to a permanent change in corporate profitability much
more intensively than to temporary shocks.2 The slower growth of productive capacity also hinders employment growth. Finally,
companies may attempt to shift a portion of the permanent taxes to their consumers, which results in an increase in inflation. This
kind of pass-through may primarily become possible in the case of transaction-based taxes (such as telecommunication tax, financial
transaction duty, electronic road toll), because they increase the marginal cost of producer companies as well.
Over our forecast horizon, the most important question is the speed of pass-through of the taxes to consumers. According to our
baseline scenario, in the weak demand environment the pass-through can only be partial and protracted over time. Therefore, the
increase in corporate tax burdens raises core inflation only gradually, in parallel with the closing of the output gap; cuts in operating
costs also contribute to restoring profitability.
In the alternative scenarios of the forecast, the significance of the channels of profit adjustment varies. With a higher nominal path,
there is more room for the pass-through of the taxes to consumer prices in the near term already. On the other hand, the possibilities
of price increases are more limited in a cyclical position that is weaker than the baseline scenario, thus labour costs need to adjust
more.
Box 1-2
effects of the long-term increase in corporate tax burdens
2 reiff, Á. (2010), “Firm-level adjustment costs and aggregate investment dynamics − Estimation on Hungarian data”, MNB Working Papers, 2010/2.
Quarterly report on inflation • december 2012 19
In the period under review, in parallel with the unfavourable
business conditions, a deterioration in profitability was
observed; a decline in value added and an increase in
employment also contributed to this. The assessment of the
increase in the number of employed is surrounded by
significant uncertainty; both cyclical and structural reasons
may have played a role in it (for details, see Box 3-2).
The number of those employed by larger companies, which
account for a considerable portion of output, has remained
practically unchanged since the crisis, and the increase in
employment was typical of small companies (less than 10
people). Past experience indicates that small firms may
flexibly adjust their workforce to changes in business
activity; therefore, in the forecast they are expected to
reduce employment in order to improve productivity.
Administrative wage increases in 2012 and 2013 have a
lasting impact on nominal wages; however the direct effect
of these measures is offset to a large extent by the
government’s job protection plan. Nonetheless, the effects
feeding through on the salary scale may result in wage
increases deviating from developments in productivity in
the private sector companies. Based on the 2012 experience,
in order to maintain their internal wage differentiation,
companies may carry out pay rises even in earning
categories which were not directly affected by the
administrative measures.
Companies may react to the unfavourable business
conditions and the deterioration in profitability due to the
growing tax burden on the private sector by restraining
wage dynamics. Although unemployment followed a
gradually rising trend during the crisis, the labour market
environment remains loose over the forecast horizon.
Therefore, in our forecast, after the effect of the
administrative measures fades out we expect moderate
wage increases, restraining of non-wage benefits and
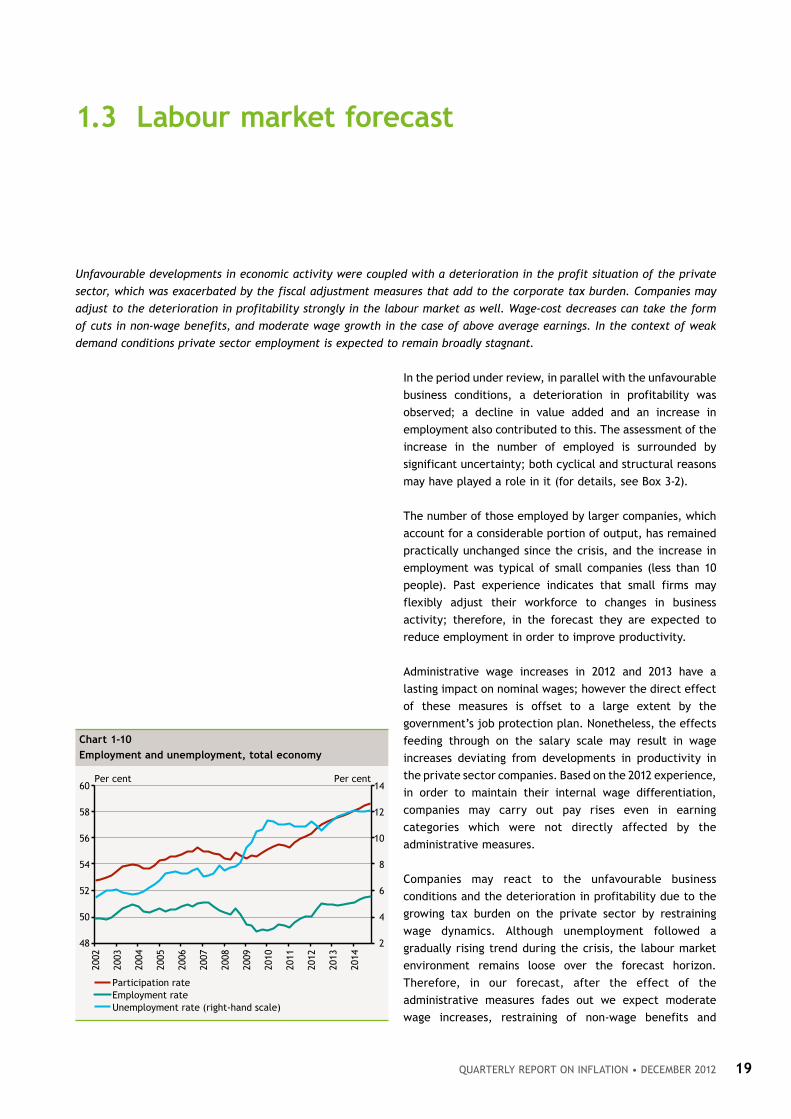
1.3 labour market forecast
Unfavourable developments in economic activity were coupled with a deterioration in the profit situation of the private
sector, which was exacerbated by the fiscal adjustment measures that add to the corporate tax burden. Companies may
adjust to the deterioration in profitability strongly in the labour market as well. Wage-cost decreases can take the form
of cuts in non-wage benefits, and moderate wage growth in the case of above average earnings. In the context of weak
demand conditions private sector employment is expected to remain broadly stagnant.
Chart 1-10
employment and unemployment, total economy
2
4
6
8
10
12
14
48
50
52
54
56
58
60
2002
2003
2004
2005
2006
2007
2008
2009
2010
2011
2012
2013
2014
Per centPer cent
Participation rateEmployment rateUnemployment rate (right-hand scale)
MAGYAR NEMZETI BANK
QuARTERlY REpoRT oN INflATIoN • dEcEMBER 201220
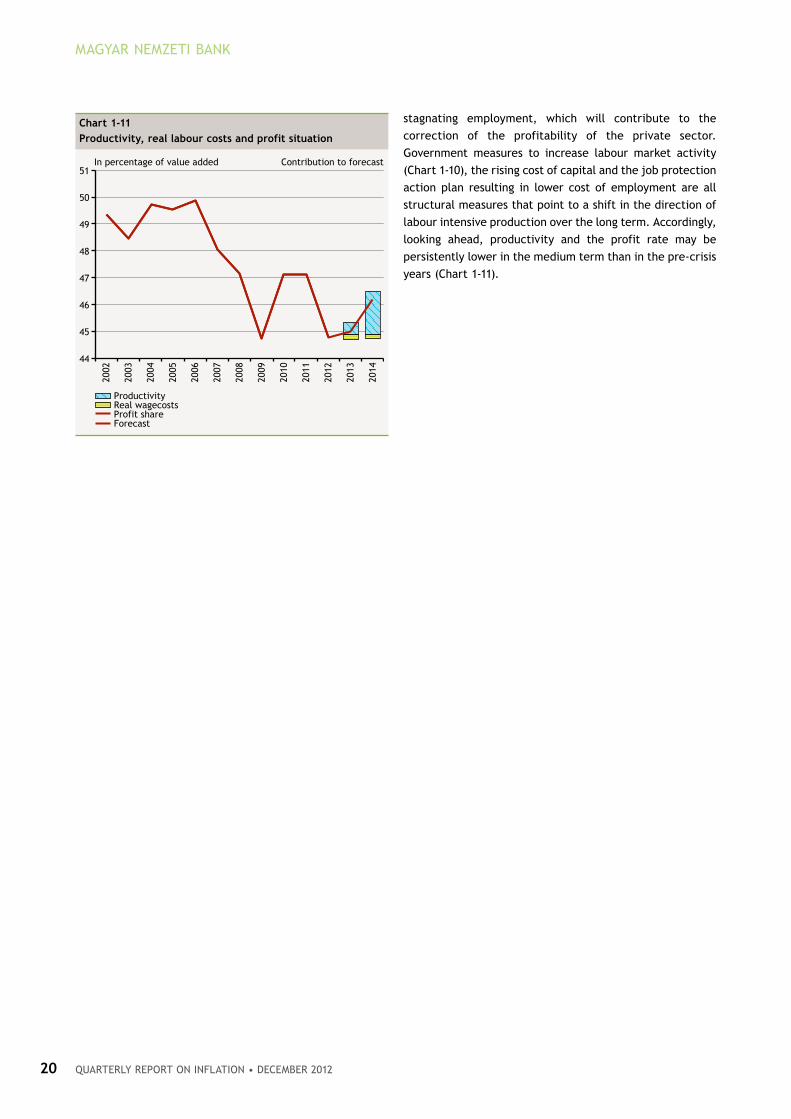
stagnating employment, which will contribute to the
correction of the profitability of the private sector.
Government measures to increase labour market activity
(Chart 1-10), the rising cost of capital and the job protection
action plan resulting in lower cost of employment are all
structural measures that point to a shift in the direction of
labour intensive production over the long term. Accordingly,
looking ahead, productivity and the profit rate may be
persistently lower in the medium term than in the pre-crisis
years (Chart 1-11).
Chart 1-11
productivity, real labour costs and profit situation
44
45
46
47
48
49
50
51
2002
2003
2004
2005
2006
2007
2008
2009
2010
2011
2012
2013
2014
Contribution to forecastIn percentage of value added
ProductivityReal wagecosts
ForecastProfit share
Quarterly report on inflation • december 2012 21
INFLATION AND REAL ECONOMy OUTLOOK
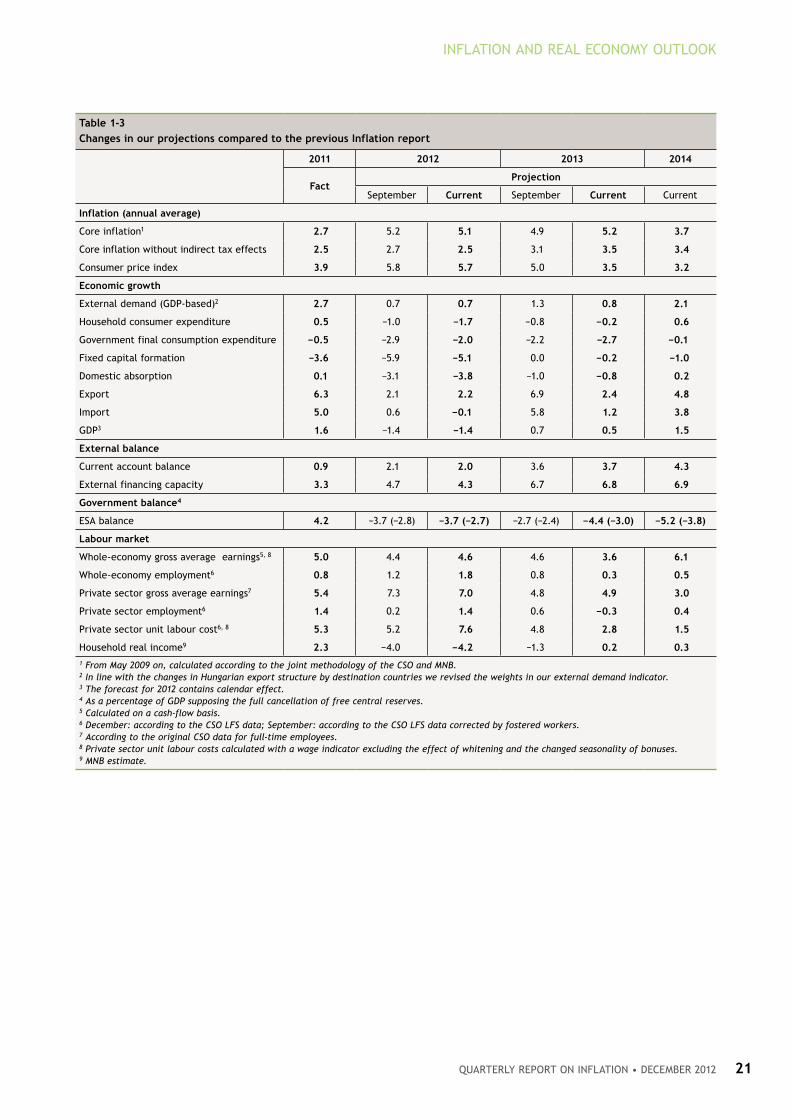
table 1-3
Changes in our projections compared to the previous Inflation report
2011 2012 2013 2014
factprojection
September Current September Current Current
Inflation (annual average)
Core inflation1 2.7 5.2 5.1 4.9 5.2 3.7
Core inflation without indirect tax effects 2.5 2.7 2.5 3.1 3.5 3.4
Consumer price index 3.9 5.8 5.7 5.0 3.5 3.2
economic growth
External demand (GDP-based)2 2.7 0.7 0.7 1.3 0.8 2.1
Household consumer expenditure 0.5 −1.0 −1.7 −0.8 −0.2 0.6
Government final consumption expenditure −0.5 −2.9 −2.0 −2.2 −2.7 −0.1
Fixed capital formation −3.6 −5.9 −5.1 0.0 −0.2 −1.0
Domestic absorption 0.1 −3.1 −3.8 −1.0 −0.8 0.2
Export 6.3 2.1 2.2 6.9 2.4 4.8
Import 5.0 0.6 −0.1 5.8 1.2 3.8
GDP3 1.6 −1.4 −1.4 0.7 0.5 1.5
external balance
Current account balance 0.9 2.1 2.0 3.6 3.7 4.3
External financing capacity 3.3 4.7 4.3 6.7 6.8 6.9
Government balance4
ESA balance 4.2 −3.7 (−2.8) −3.7 (−2.7) −2.7 (−2.4) −4.4 (−3.0) −5.2 (−3.8)
labour market
Whole-economy gross average earnings5, 8 5.0 4.4 4.6 4.6 3.6 6.1
Whole-economy employment6 0.8 1.2 1.8 0.8 0.3 0.5
Private sector gross average earnings7 5.4 7.3 7.0 4.8 4.9 3.0
Private sector employment6 1.4 0.2 1.4 0.6 −0.3 0.4
Private sector unit labour cost6, 8 5.3 5.2 7.6 4.8 2.8 1.5
Household real income9 2.3 −4.0 −4.2 −1.3 0.2 0.3
1 From May 2009 on, calculated according to the joint methodology of the CSO and MNB.2 In line with the changes in Hungarian export structure by destination countries we revised the weights in our external demand indicator. 3 The forecast for 2012 contains calendar effect.4 As a percentage of GDP supposing the full cancellation of free central reserves.5 Calculated on a cash-flow basis.6 December: according to the CSO LFS data; September: according to the CSO LFS data corrected by fostered workers.7 According to the original CSO data for full-time employees.8 Private sector unit labour costs calculated with a wage indicator excluding the effect of whitening and the changed seasonality of bonuses.9 MNB estimate.
MAGYAR NEMZETI BANK
QuARTERlY REpoRT oN INflATIoN • dEcEMBER 201222
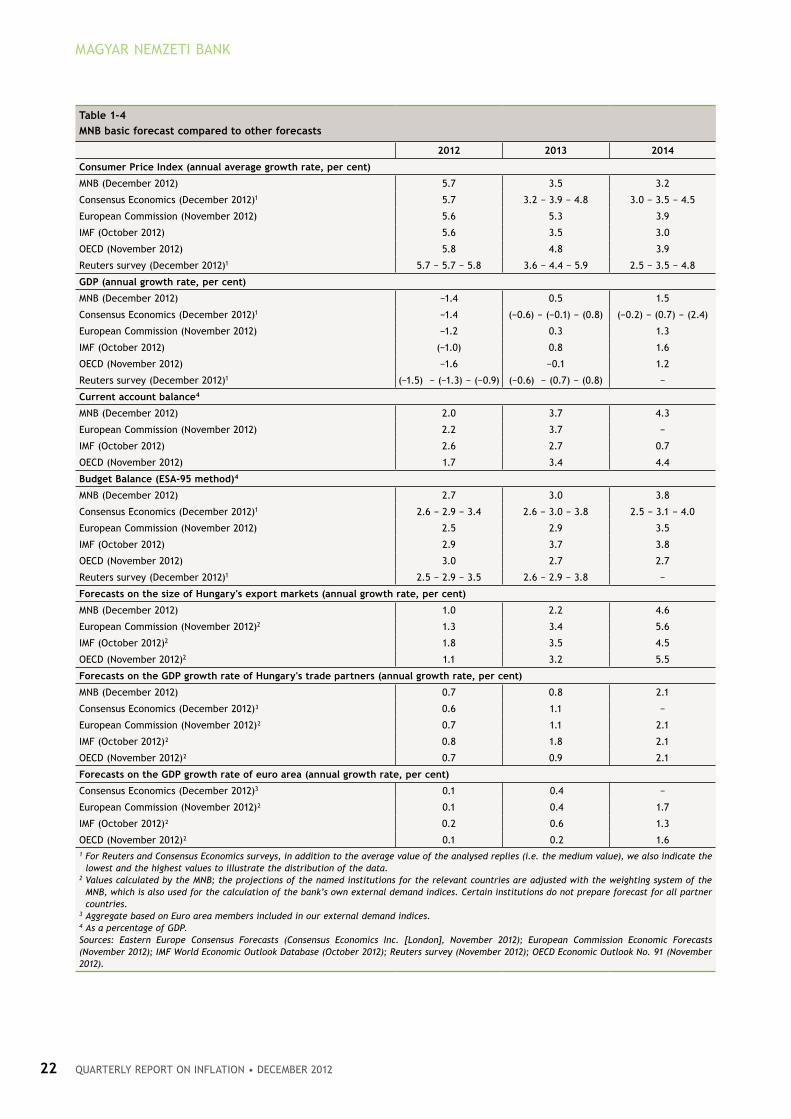
table 1-4
MnB basic forecast compared to other forecasts
2012 2013 2014
Consumer price Index (annual average growth rate, per cent)
MNB (December 2012) 5.7 3.5 3.2
Consensus Economics (December 2012)1 5.7 3.2 − 3.9 − 4.8 3.0 − 3.5 − 4.5
European Commission (November 2012) 5.6 5.3 3.9
IMF (October 2012) 5.6 3.5 3.0
OECD (November 2012) 5.8 4.8 3.9
Reuters survey (December 2012)1 5.7 − 5.7 − 5.8 3.6 − 4.4 − 5.9 2.5 − 3.5 − 4.8
GDp (annual growth rate, per cent)
MNB (December 2012) −1.4 0.5 1.5
Consensus Economics (December 2012)1 −1.4 (−0.6) − (−0.1) − (0.8) (−0.2) − (0.7) − (2.4)
European Commission (November 2012) −1.2 0.3 1.3
IMF (October 2012) (−1.0) 0.8 1.6
OECD (November 2012) −1.6 −0.1 1.2
Reuters survey (December 2012)1 (−1.5) − (−1.3) − (−0.9) (−0.6) − (0.7) − (0.8) −
Current account balance4
MNB (December 2012) 2.0 3.7 4.3
European Commission (November 2012) 2.2 3.7 −
IMF (October 2012) 2.6 2.7 0.7
OECD (November 2012) 1.7 3.4 4.4
Budget Balance (eSa-95 method)4
MNB (December 2012) 2.7 3.0 3.8
Consensus Economics (December 2012)1 2.6 − 2.9 − 3.4 2.6 − 3.0 − 3.8 2.5 − 3.1 − 4.0
European Commission (November 2012) 2.5 2.9 3.5
IMF (October 2012) 2.9 3.7 3.8
OECD (November 2012) 3.0 2.7 2.7
Reuters survey (December 2012)1 2.5 − 2.9 − 3.5 2.6 − 2.9 − 3.8 −
forecasts on the size of hungary's export markets (annual growth rate, per cent)
MNB (December 2012) 1.0 2.2 4.6
European Commission (November 2012)2 1.3 3.4 5.6
IMF (October 2012)2 1.8 3.5 4.5
OECD (November 2012)2 1.1 3.2 5.5
forecasts on the GDp growth rate of hungary's trade partners (annual growth rate, per cent)
MNB (December 2012) 0.7 0.8 2.1
Consensus Economics (December 2012)³ 0.6 1.1 −
European Commission (November 2012)² 0.7 1.1 2.1
IMF (October 2012)² 0.8 1.8 2.1
OECD (November 2012)² 0.7 0.9 2.1
forecasts on the GDp growth rate of euro area (annual growth rate, per cent)
Consensus Economics (December 2012)3 0.1 0.4 −
European Commission (November 2012)² 0.1 0.4 1.7
IMF (October 2012)² 0.2 0.6 1.3
OECD (November 2012)² 0.1 0.2 1.61 For Reuters and Consensus Economics surveys, in addition to the average value of the analysed replies (i.e. the medium value), we also indicate the
lowest and the highest values to illustrate the distribution of the data.2 Values calculated by the MNB; the projections of the named institutions for the relevant countries are adjusted with the weighting system of the
MNB, which is also used for the calculation of the bank’s own external demand indices. Certain institutions do not prepare forecast for all partner countries.
3 Aggregate based on Euro area members included in our external demand indices.4 As a percentage of GDP. Sources: Eastern Europe Consensus Forecasts (Consensus Economics Inc. [London], November 2012); European Commission Economic Forecasts (November 2012); IMF World Economic Outlook Database (October 2012); Reuters survey (November 2012); OECD Economic Outlook No. 91 (November 2012).

Quarterly report on inflation • december 2012 23
Despite relatively moderate underlying inflation
developments, inflation in Hungary has been persistently
and considerably above the target for a long period of time,
which is partly attributable to the continuous, significant
cost shocks to the economy in the past (food and oil price
increases as well as tax measures with inflationary effects).
This raises the possibility that the role of the inflation
target in anchoring expectations has weakened, and that
the pass-through of further continuous cost shocks into
inflation expectations may result in stronger second-round
effects.
Fiscal adjustment measures and the further increase in the
minimum wage result in an additional rise in production
costs for the corporate sector. If companies expect a higher
inflation trend, they will react to the cost increase by
raising their prices, and in this case they may be more
permissive in determining nominal wages as well. This risk
is also strengthened by the considerable increase in
minimum wages. The higher nominal path requires tighter
monetary conditions, to attenuate the inflationary effect of
the stronger feed-through of costs. In this scenario, growth
is somewhat lower than in the baseline scenario, and
inflation will reach the target more slowly (Chart 2-1).
In recent years, inflation has generally been influenced by
two divergent developments. Cost shocks increased
inflation, while the loose labour market and weak domestic
demand had an opposite effect. In the economy, long-term
supply is determined by the production capacities existing
2 effects of alternative scenarios on our forecast
The Monetary Council assesses that risk perception of domestic assets is a considerable risk factor, and developments in
risk premium are surrounded by two-sided risks. In addition, the Monetary Council selected two scenarios, which − in their
opinion − can best capture the relevant risks in terms of conducting monetary policy in the future. The alternative
scenarios present the uncertainty related to anchoring inflation expectations and the cyclical position of the economy. The
continuous cost shocks and persistently above-target inflation suggest that the role of the inflation target in anchoring
expectations has weakened, which may result in the production cost increases triggered by government measures passing
through into prices more strongly. Accordingly, the first scenario is characterised by a higher nominal path, which requires
tighter monetary policy than in the baseline scenario over the forecast horizon. There is considerable uncertainty about
the potential output estimate, and accordingly it is possible that the decline in production capacities was lower than the
assumption in the baseline scenario. In this case, the wider output gap has a stronger disinflationary effect. Consequently,
it may be possible to achieve the inflation target even with looser monetary conditions in 2014.
Chart 2-1
the impact of the risk scenarios on our inflation forecast
(2010 Q1− 2014 Q4)
2.0
2.5
3.0
3.5
4.0
4.5
5.0
5.5
6.0
6.5
2010 2011 2012 2013 2014
Per cent
Base scenarioWider output gapHigher nominal path
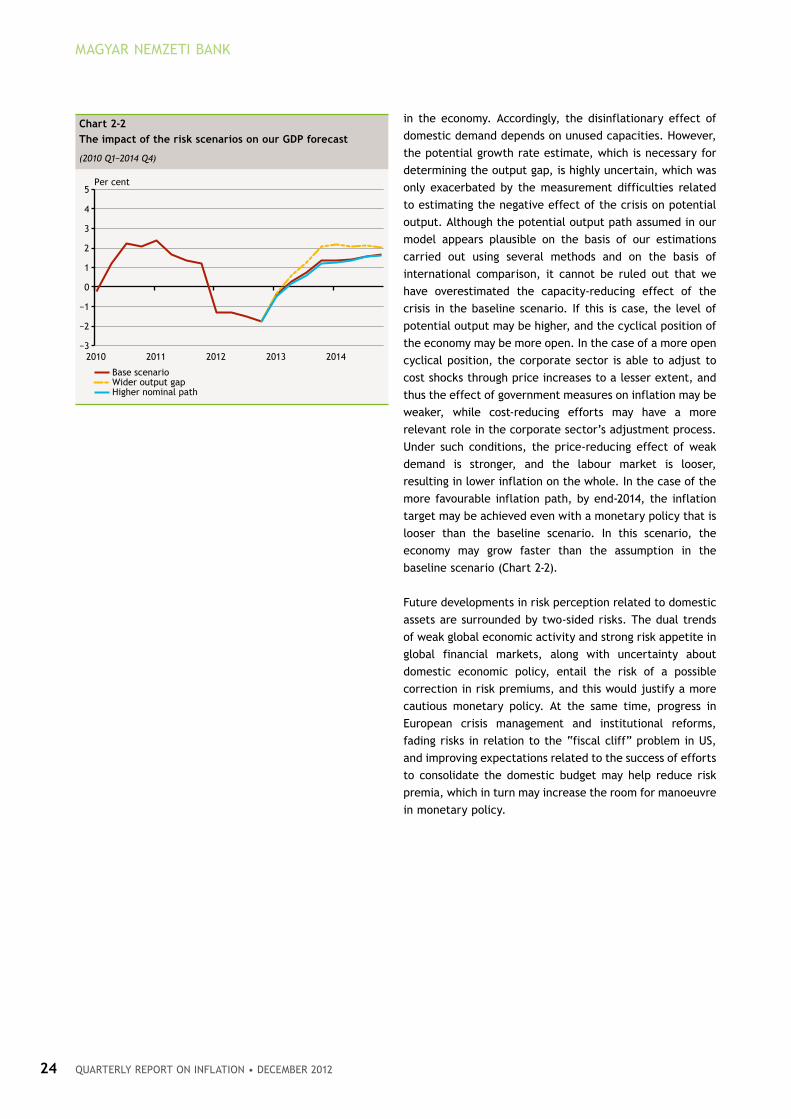
MAGYAR NEMZETI BANK
QuARTERlY REpoRT oN INflATIoN • dEcEMBER 201224
in the economy. Accordingly, the disinflationary effect of
domestic demand depends on unused capacities. However,
the potential growth rate estimate, which is necessary for
determining the output gap, is highly uncertain, which was
only exacerbated by the measurement difficulties related
to estimating the negative effect of the crisis on potential
output. Although the potential output path assumed in our
model appears plausible on the basis of our estimations
carried out using several methods and on the basis of
international comparison, it cannot be ruled out that we
have overestimated the capacity-reducing effect of the
crisis in the baseline scenario. If this is case, the level of
potential output may be higher, and the cyclical position of
the economy may be more open. In the case of a more open
cyclical position, the corporate sector is able to adjust to
cost shocks through price increases to a lesser extent, and
thus the effect of government measures on inflation may be
weaker, while cost-reducing efforts may have a more
relevant role in the corporate sector’s adjustment process.
Under such conditions, the price-reducing effect of weak
demand is stronger, and the labour market is looser,
resulting in lower inflation on the whole. In the case of the
more favourable inflation path, by end-2014, the inflation
target may be achieved even with a monetary policy that is
looser than the baseline scenario. In this scenario, the
economy may grow faster than the assumption in the
baseline scenario (Chart 2-2).
Future developments in risk perception related to domestic
assets are surrounded by two-sided risks. The dual trends
of weak global economic activity and strong risk appetite in
global financial markets, along with uncertainty about
domestic economic policy, entail the risk of a possible
correction in risk premiums, and this would justify a more
cautious monetary policy. At the same time, progress in
European crisis management and institutional reforms,
fading risks in relation to the “fiscal cliff” problem in US,
and improving expectations related to the success of efforts
to consolidate the domestic budget may help reduce risk
premia, which in turn may increase the room for manoeuvre
in monetary policy.
Chart 2-2
the impact of the risk scenarios on our GDp forecast
(2010 Q1−2014 Q4)
−3
−2
−1
0
1
2
3
4
5
2010 2011 2012 2013 2014
Per cent
Base scenarioWider output gapHigher nominal path
Quarterly report on inflation • december 2012 25
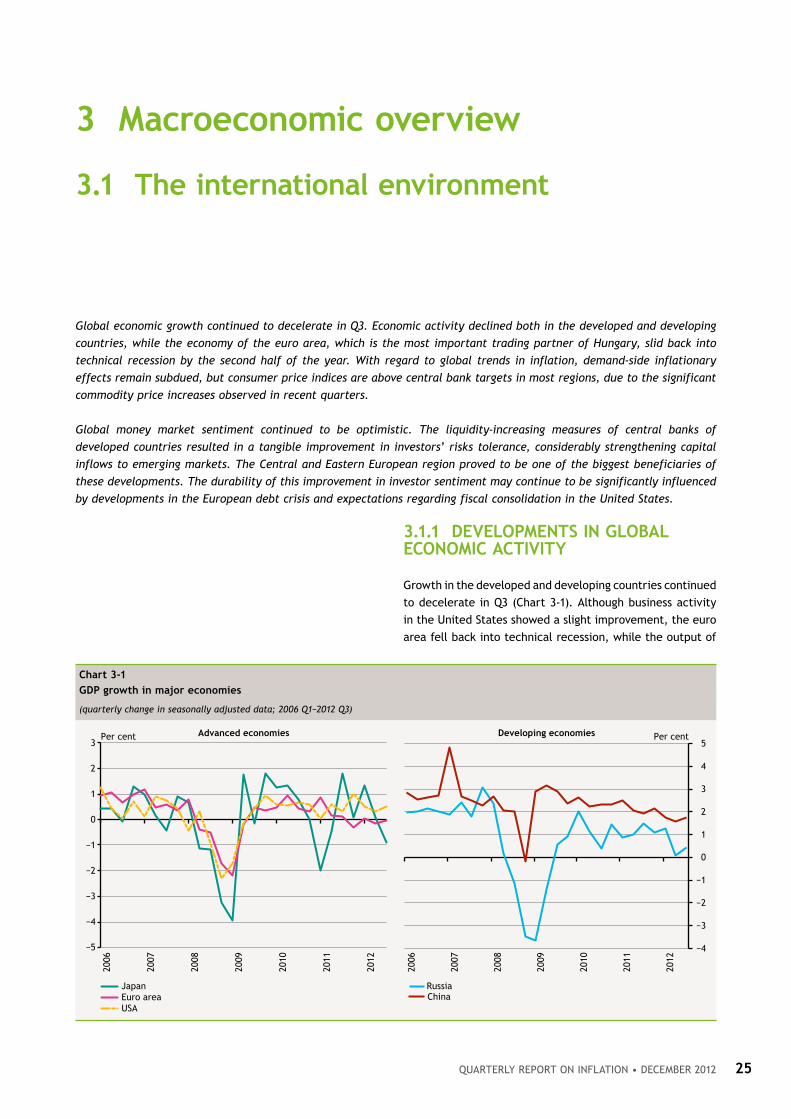
3.1.1 DevelopMentS In GloBal eConoMIC aCtIvIty
Growth in the developed and developing countries continued
to decelerate in Q3 (Chart 3-1). Although business activity
in the United States showed a slight improvement, the euro
area fell back into technical recession, while the output of
3 Macroeconomic overview
3.1 the international environment
Global economic growth continued to decelerate in Q3. Economic activity declined both in the developed and developing
countries, while the economy of the euro area, which is the most important trading partner of Hungary, slid back into
technical recession by the second half of the year. With regard to global trends in inflation, demand-side inflationary
effects remain subdued, but consumer price indices are above central bank targets in most regions, due to the significant
commodity price increases observed in recent quarters.
Global money market sentiment continued to be optimistic. The liquidity-increasing measures of central banks of
developed countries resulted in a tangible improvement in investors’ risks tolerance, considerably strengthening capital
inflows to emerging markets. The Central and Eastern European region proved to be one of the biggest beneficiaries of
these developments. The durability of this improvement in investor sentiment may continue to be significantly influenced
by developments in the European debt crisis and expectations regarding fiscal consolidation in the United States.
Chart 3-1
GDp growth in major economies
(quarterly change in seasonally adjusted data; 2006 Q1−2012 Q3)
−5
−4
−3
−2
−1
0
1
2
3
2006
2007
2008
2009
2010
2011
2012
Advanced economiesPer cent
−4
−3
−2
−1
0
1
2
3
4
5
2006
2007
2008
2009
2010
2011
2012
Developing economies Per cent
JapanEuro areaUSA
RussiaChina

MAGYAR NEMZETI BANK
QuARTERlY REpoRT oN INflATIoN • dEcEMBER 201226
the Japanese economy declined in Q3. The average growth
rate slowed down in emerging countries with close trade
relations with the developed economies (and thus in the
Central and Eastern European region as well). In terms of
global economic prospects, the US fiscal cliff and the
developments in the European debt crisis continue to be
the most important risks.
The US economy continued to grow in Q3, as GDP expanded
by 2.5 per cent on a year-on-year basis. Weakening demand
and households’ protracted deleveraging are steadily
slowing down economic recovery, whereas the disturbances
caused by Hurricane Sandy resulted in a temporary decline
in output. In an environment of weak economic activity, the
latest liquidity expansion measures of the Fed focus on the
stabilisation of growth. Short-term leading indicators point
to mild strengthening in activity and consumption, whilst
the mid-term growth outlooks remain weak. The Fed is
working to support a durable improvement in growth and
employment by broadening its liquidity expansion programs
and with its long-term commitment to low Fed funds rates,
as expressed in the announced explicit unemployment rate
and inflation figures. Temporal growth prospects in the US
will primarily be influenced by the development of fiscal
policy following the presidential election. The extent and
structure of fiscal consolidation due to the debt ceiling may
have a significant impact on both global growth and risk
tolerance.
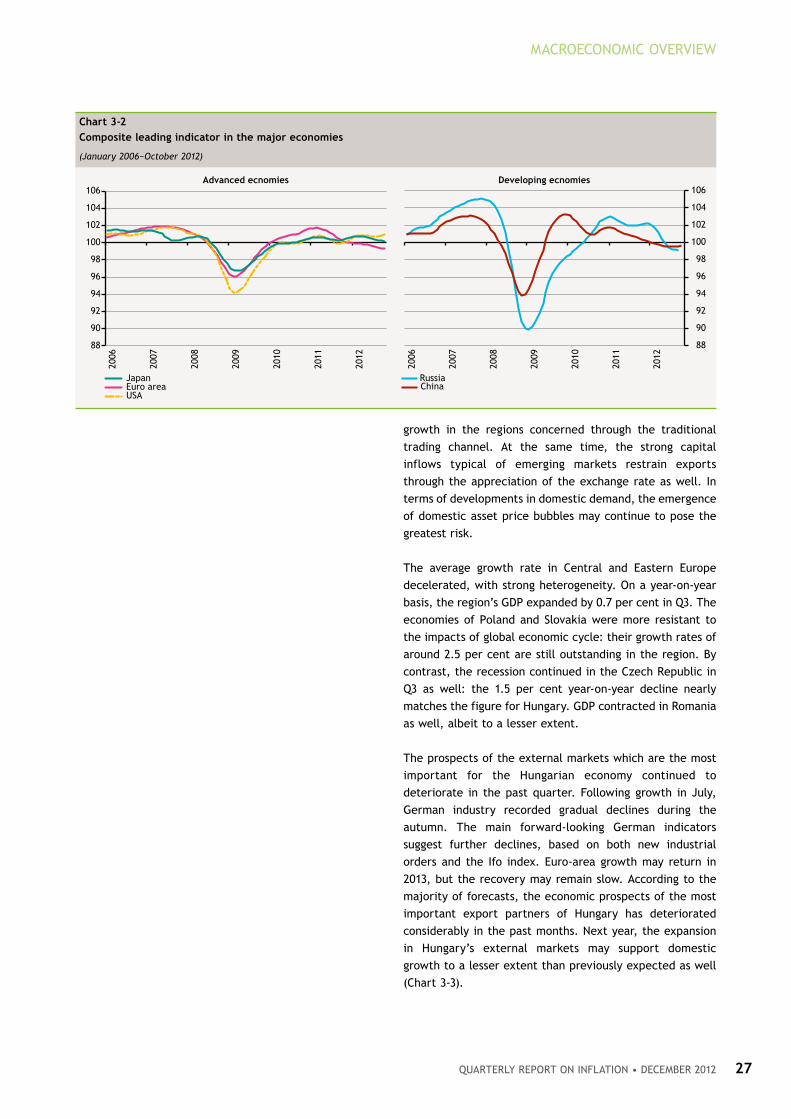
Euro-area GDP declined by 0.6 per cent on a year-on-year
basis, and thus the economy of the euro area slipped into
recession by mid-year. Growth trends continue to be
characterised by strong duality: the output of periphery
countries is declining considerably, while the economies of
core countries are proving to be more resistant. However,
during the past quarter the slowdown in growth became
increasingly obvious in this group of economies as well. The
most important forward-looking business cycle indicators
fell to a three-year low in September, and did not show any
substantial adjustment until November (Chart 3-2), thus,
the recession may continue until the end of the year.
Weakening global economic activity and the ongoing
process of deleveraging − especially in countries with high
debt levels − will continue to restrain growth in the region
in the years to come, and consequently, the recovery after
the recession may remain subdued over the entire forecast
horizon.
In the largest emerging countries, growth continued to
decelerate, albeit from high rates. Growth in China declined
to 7.4 per cent in Q3. The slowdown in economic activity
was mainly attributable to weaker expansion in export
sales. Fading demand in developed economies slows down
Quarterly report on inflation • december 2012 27
MACROECONOMIC OVERVIEW
growth in the regions concerned through the traditional
trading channel. At the same time, the strong capital
inflows typical of emerging markets restrain exports
through the appreciation of the exchange rate as well. In
terms of developments in domestic demand, the emergence
of domestic asset price bubbles may continue to pose the
greatest risk.
The average growth rate in Central and Eastern Europe
decelerated, with strong heterogeneity. On a year-on-year
basis, the region’s GDP expanded by 0.7 per cent in Q3. The
economies of Poland and Slovakia were more resistant to
the impacts of global economic cycle: their growth rates of
around 2.5 per cent are still outstanding in the region. By
contrast, the recession continued in the Czech Republic in
Q3 as well: the 1.5 per cent year-on-year decline nearly
matches the figure for Hungary. GDP contracted in Romania
as well, albeit to a lesser extent.
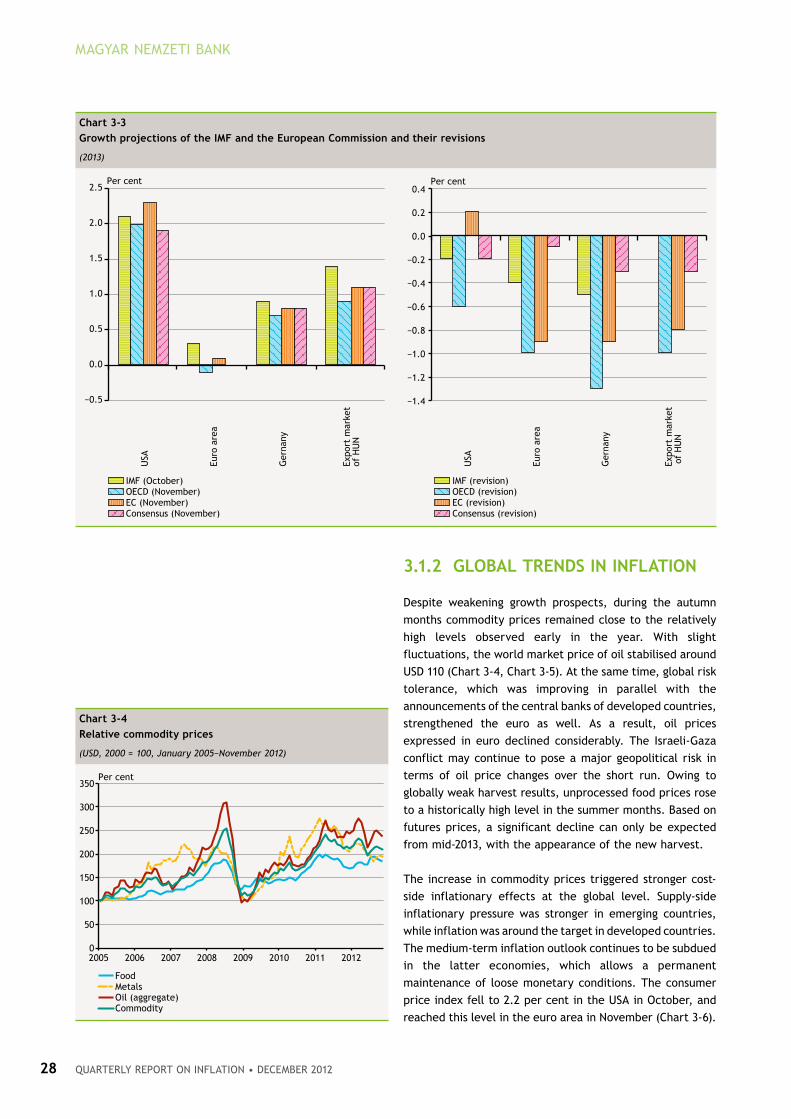
The prospects of the external markets which are the most
important for the Hungarian economy continued to
deteriorate in the past quarter. Following growth in July,
German industry recorded gradual declines during the
autumn. The main forward-looking German indicators
suggest further declines, based on both new industrial
orders and the Ifo index. Euro-area growth may return in
2013, but the recovery may remain slow. According to the
majority of forecasts, the economic prospects of the most
important export partners of Hungary has deteriorated
considerably in the past months. Next year, the expansion
in Hungary’s external markets may support domestic
growth to a lesser extent than previously expected as well
(Chart 3-3).
Chart 3-2
Composite leading indicator in the major economies
(January 2006−October 2012)
88
90
92
94
96
98
100
102
104
106
2006
2007
2008
2009
2010
2011
2012
Advanced ecnomies
88
90
92
94
96
98
100
102
104
106
2006
2007
2008
2009
2010
2011
2012
Developing ecnomies
JapanEuro areaUSA
RussiaChina
MAGYAR NEMZETI BANK
QuARTERlY REpoRT oN INflATIoN • dEcEMBER 201228
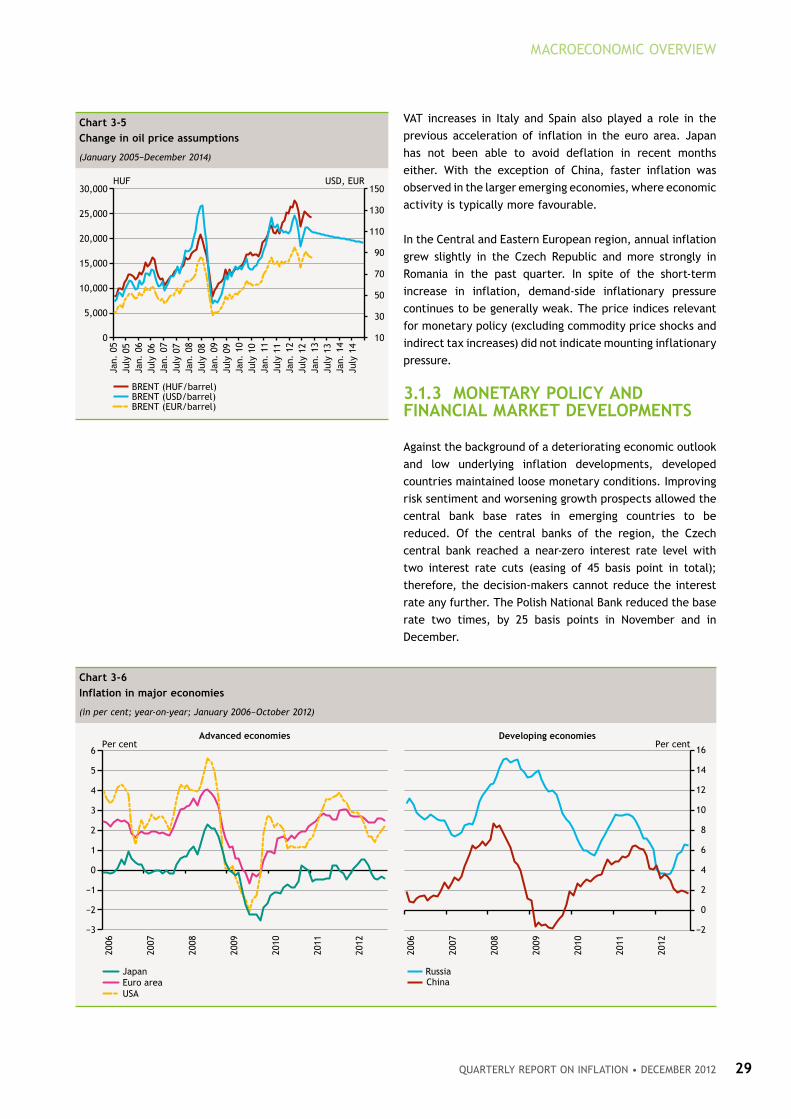
3.1.2 GloBal trenDS In InflatIon
Despite weakening growth prospects, during the autumn
months commodity prices remained close to the relatively
high levels observed early in the year. With slight
fluctuations, the world market price of oil stabilised around
USD 110 (Chart 3-4, Chart 3-5). At the same time, global risk
tolerance, which was improving in parallel with the
announcements of the central banks of developed countries,
strengthened the euro as well. As a result, oil prices
expressed in euro declined considerably. The Israeli-Gaza
conflict may continue to pose a major geopolitical risk in
terms of oil price changes over the short run. Owing to
globally weak harvest results, unprocessed food prices rose
to a historically high level in the summer months. Based on
futures prices, a significant decline can only be expected
from mid-2013, with the appearance of the new harvest.
The increase in commodity prices triggered stronger cost-
side inflationary effects at the global level. Supply-side
inflationary pressure was stronger in emerging countries,
while inflation was around the target in developed countries.
The medium-term inflation outlook continues to be subdued
in the latter economies, which allows a permanent
maintenance of loose monetary conditions. The consumer
price index fell to 2.2 per cent in the USA in October, and
reached this level in the euro area in November (Chart 3-6).
Chart 3-3
Growth projections of the IMf and the european Commission and their revisions
(2013)
−0.5
0.0
0.5
1.0
1.5
2.0
2.5
USA
Euro
are
a
Ger
nany
Expo
rt m
arke
tof
HU
N
Per cent
IMF (October)OECD (November)EC (November)Consensus (November)
IMF (revision)OECD (revision)EC (revision)Consensus (revision)
−1.4
−1.2
−1.0
−0.8
−0.6
−0.4
−0.2
0.0
0.2
0.4
USA
Euro
are
a
Ger
nany
Expo
rt m
arke
t o
f H
UN
Per cent
Chart 3-4
relative commodity prices
(USD, 2000 = 100, January 2005−November 2012)
0
50
100
150
200
250
300
350
2005 2006 2007 2008 2009 2010 2011 2012
Per cent
FoodMetalsOil (aggregate)Commodity
Quarterly report on inflation • december 2012 29
MACROECONOMIC OVERVIEW
VAT increases in Italy and Spain also played a role in the
previous acceleration of inflation in the euro area. Japan
has not been able to avoid deflation in recent months
either. With the exception of China, faster inflation was
observed in the larger emerging economies, where economic
activity is typically more favourable.
In the Central and Eastern European region, annual inflation
grew slightly in the Czech Republic and more strongly in
Romania in the past quarter. In spite of the short-term
increase in inflation, demand-side inflationary pressure
continues to be generally weak. The price indices relevant
for monetary policy (excluding commodity price shocks and
indirect tax increases) did not indicate mounting inflationary
pressure.
3.1.3 Monetary polICy anD fInanCIal Market DevelopMentS
Against the background of a deteriorating economic outlook
and low underlying inflation developments, developed
countries maintained loose monetary conditions. Improving
risk sentiment and worsening growth prospects allowed the
central bank base rates in emerging countries to be
reduced. Of the central banks of the region, the Czech
central bank reached a near-zero interest rate level with
two interest rate cuts (easing of 45 basis point in total);
therefore, the decision-makers cannot reduce the interest
rate any further. The Polish National Bank reduced the base
rate two times, by 25 basis points in November and in
December.
Chart 3-5
Change in oil price assumptions
(January 2005−December 2014)
10
30
50
70
90
110
130
150
0
5,000
10,000
15,000
20,000
25,000
30,000
Jan.
05
July
05
Jan.
06
July
06
Jan.
07
July
07
Jan.
08
July
08
Jan.
09
July
09
Jan.
10
July
10
Jan.
11
July
11
Jan.
12
July
12
Jan.
13
July
13
Jan.
14
July
14
USD, EURHUF
BRENT (HUF/barrel)BRENT (USD/barrel)BRENT (EUR/barrel)
Chart 3-6
Inflation in major economies
(in per cent; year-on-year; January 2006−October 2012)
−3
−2
−1
0
1
2
3
4
5
6
2006
2007
2008
2009
2010
2011
2012
Per centAdvanced economies
−2
0
2
4
6
8
10
12
14
16
2006
2007
2008
2009
2010
2011
2012
Per centDeveloping economies
JapanEuro areaUSA
RussiaChina

MAGYAR NEMZETI BANK
QuARTERlY REpoRT oN INflATIoN • dEcEMBER 201230
Sentiment on the global financial market continued to be
optimistic in recent months. The positive effects of the
earlier liquidity providing and/or crisis management
measures undertaken by the major central banks were felt
in the autumn months as well (Chart 3-7, Chart 3-8).
Emerging markets benefited considerably from the ample
liquidity: capital inflows into these markets increased
markedly, reducing risk premia on the assets of these
countries. The EU regulation on uncovered CDS transactions
also contributed to the above development in the Central
and Eastern European EU Member States. Until November,
as a result of this technical effect, a greater decline in
premia was observed in our region, compared to other
emerging regions (Chart 3-9).
Developments in the European debt crisis had a much
smaller influence on market sentiment than in the first half
of the year. Although there has been some progress recently
(e.g. the Greek agreement), several outstanding problems
have not been solved in a satisfactory manner (e.g. budget
sustainability in Spain or the banking union issue). At
present, markets are mainly concentrate on the talks
regarding the US fiscal adjustment and the changes in
global growth prospects.
Chart 3-7
Changes in interbank and swap market spreads
−180−160−140−120−100−80−60−40−20
020
102030405060708090
100110
1 Se
p. 1
123
Sep
. 11
17 O
ct.
118
Nov
. 11
30 N
ov.
1122
Dec
. 11
13 J
an.
126
Feb.
12
28 F
eb.
1221
Mar
. 12
12 A
pr.
124
May
12
28 M
ay 1
219
Jun
e 12
11 J
uly
122
Aug
. 12
24 A
ug.
1217
Sep
. 12
9 O
ct.
1231
Oct
. 12
22 N
ov.
12
Basis pointsBasis points
EURIBOR-OIS spreadEUR/USD 3 month basis swap spread (right-hand scale)
Chart 3-8
Developments in major stock market indices
−15−10−505
1015202530
−15−10−505
1015202530
1 Se
p. 1
122
Sep
. 11
13 O
ct.
113
Nov
. 11
24 N
ov.
1115
Dec
. 11
5 Ja
n. 1
226
Jan
. 12
16 F
eb.
128
Mar
. 12
29 M
ar.
1219
Apr
. 12
10 M
ay 1
26
June
12
27 J
une
1218
Jul
y 12
8 Aug
. 12
29 A
ug.
1219
Sep
. 12
10 O
ct.
1231
Oct
. 12
21 N
ov.
12
Per cent Per cent
Frankfurt (DAX)SP 500Tokio (NIKKEI)
Chart 3-9
Changes in risk indices
0
5
10
15
20
25
30
35
40
45
0
50
100
150
200
250
300
350
400
450
1 Jan. 2012 1 Apr. 2012 1 July 2012 1 Oct. 2012
CEE CDSEMBIVIX (right-hand scale)
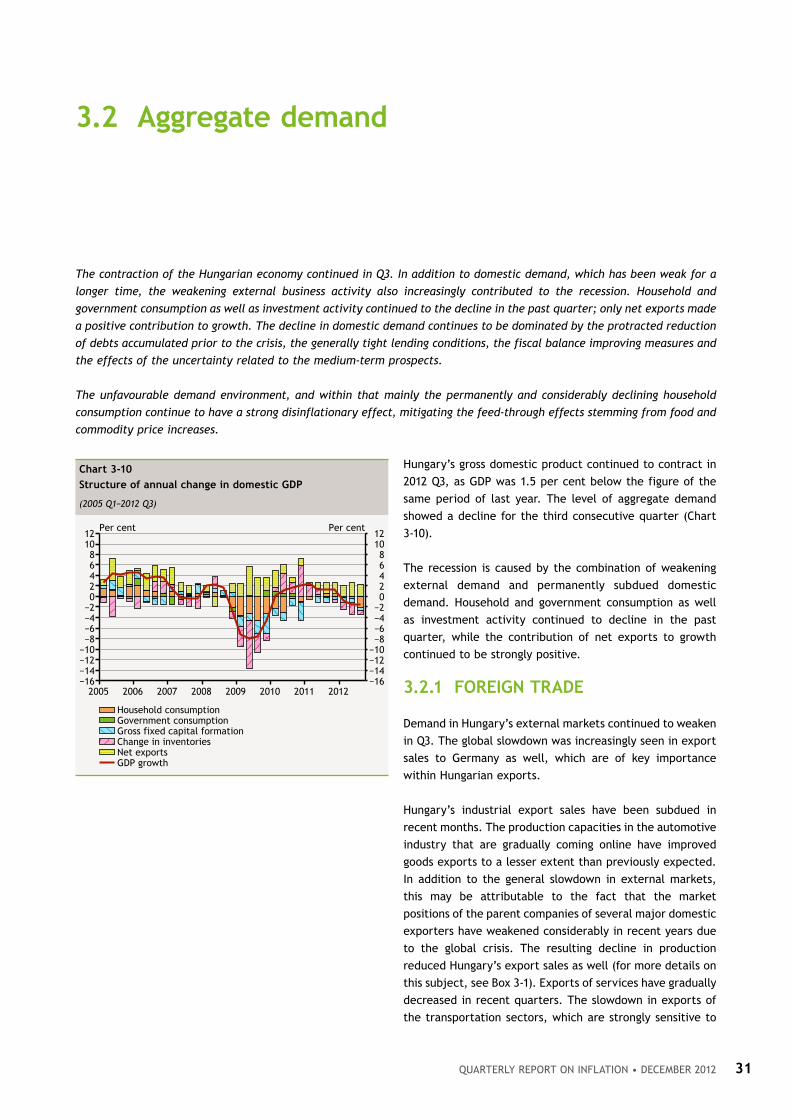
Quarterly report on inflation • december 2012 31
Hungary’s gross domestic product continued to contract in
2012 Q3, as GDP was 1.5 per cent below the figure of the
same period of last year. The level of aggregate demand
showed a decline for the third consecutive quarter (Chart
3-10).
The recession is caused by the combination of weakening
external demand and permanently subdued domestic
demand. Household and government consumption as well
as investment activity continued to decline in the past
quarter, while the contribution of net exports to growth
continued to be strongly positive.
3.2.1 foreIGn traDe
Demand in Hungary’s external markets continued to weaken
in Q3. The global slowdown was increasingly seen in export
sales to Germany as well, which are of key importance
within Hungarian exports.
Hungary’s industrial export sales have been subdued in
recent months. The production capacities in the automotive
industry that are gradually coming online have improved
goods exports to a lesser extent than previously expected.
In addition to the general slowdown in external markets,
this may be attributable to the fact that the market
positions of the parent companies of several major domestic
exporters have weakened considerably in recent years due
to the global crisis. The resulting decline in production
reduced Hungary’s export sales as well (for more details on
this subject, see Box 3-1). Exports of services have gradually
decreased in recent quarters. The slowdown in exports of
the transportation sectors, which are strongly sensitive to
3.2 aggregate demand
The contraction of the Hungarian economy continued in Q3. In addition to domestic demand, which has been weak for a
longer time, the weakening external business activity also increasingly contributed to the recession. Household and
government consumption as well as investment activity continued to the decline in the past quarter; only net exports made
a positive contribution to growth. The decline in domestic demand continues to be dominated by the protracted reduction
of debts accumulated prior to the crisis, the generally tight lending conditions, the fiscal balance improving measures and
the effects of the uncertainty related to the medium-term prospects.
The unfavourable demand environment, and within that mainly the permanently and considerably declining household
consumption continue to have a strong disinflationary effect, mitigating the feed-through effects stemming from food and
commodity price increases.
Chart 3-10
Structure of annual change in domestic GDp
(2005 Q1−2012 Q3)
−16−14−12−10−8−6−4−202468
1012
−16−14−12−10−8−6−4−202468
1012
2005 2006 2007 2008 2009 2010 2011 2012
Per centPer cent
Household consumptionGovernment consumptionGross fixed capital formationChange in inventoriesNet exportsGDP growth

MAGYAR NEMZETI BANK
QuARTERlY REpoRT oN INflATIoN • dEcEMBER 201232
external market cycles, also contributed to the slower
dynamics, along with the more subdued expansion in
tourism revenues (Chart 3-11). Net exports increased in Q3
as well. Main factor behind the increase in net exports was
weak demand for imports.
3.1.2 houSeholD ConSuMptIon
Household consumption declined considerably in Q3. The
most important macroeconomic factors that determine
consumption generally contributed to restraining household
demand. Despite an expansion in employment and a
significant increase in wages in the competitive sector, the
real net wage bill continued to decline. Administrative wage
increases in lower earning categories offset the impact of
the tax measures taken at beginning of the year, but
accelerating inflation generally eroded real incomes. The
household confidence indicator remained unchanged over
the last half year, but remains at a historically low level
(Chart 3-12).
Household behaviour continues to be determined by the
gradual reduction of debts accumulated before the crisis.
Households continued to be net repayers of debt in Q3 as
well. Following the early repayment programme,
outstanding household loans declined in all loan categories
nearly to the same extent in Q2 and Q3. No major shift was
observed in newly disbursed loans in the past months
either; banks’ lending activity was at a historically low
level (Chart 3-13).
During recent months, the currency structure of household
loans was significantly influenced by the conversion of
foreign exchange loans ninety days past due into forints.
Within the framework of the government programme, banks
cancelled one quarter of the foreign exchange loans of the
households that met the relevant conditions, with the
remaining portion converted into forint loans. Cancellation
of a part of the loan debt also resulted in a visible change
in the monthly figures. Compared to total outstanding
household loans, however, the converted amount is not
significant, especially in relation to the effects of the early
repayment programme that took place at the beginning of
the year.
3.1.3 prIvate InveStMent
Against the background of a weak demand outlook and
increasingly tight lending conditions, domestic income
owners continue to be characterised by cautious investment
activity (Chart 3-14). Private investment continued to
decline in Q3 as well, although more slowly than before.
Chart 3-11
Changes in the volumes of goods and services exports
(2005 Q1−2012 Q3)
−30−25−20−15−10−505
10152025
−30−25−20−15−10−505
10152025
2005
2006
2007
2008
2009
2010
2011
2012
Per centPer cent
Exports of goodsExports of servicesAll exports
Chart 3-12
Changes in retail sales, earnings and the consumer confidence index
−70
−60
−50
−40
−30
−20
−10
0
10
−20
−15
−10
−5
0
5
10
July
05
Mar
. 06
Nov
. 06
July
07
Mar
. 08
Nov
. 08
July
09
Mar
. 10
Nov
. 10
July
11
Mar
. 12
Nov
. 12
Balance indicatorAnnual change (per cent)
Retail salesReal net wage billConsumer confidence (right-hand scale)
Chart 3-13
net quarterly change in outstanding domestic loans to households; breakdown by loan purpose
(2005 Q1−2012 Q3)
−800−700−600−500−400−300−200−100
0100200300400500
−800−700−600−500−400−300−200−100
0100200300400500
2005 2006 2007 2008 2009 2010 2011 2012
HUF BnHUF Bn
Net flow, bank loans for house purchaseNet flow, consumer and other bank loansNet flow, nonbank loans for house purchaseNet flow, consumer and other nonbank loansNet flow, total domestic loans

Quarterly report on inflation • december 2012 33
Corporate investment was characterised by the dual trends
of the past period. Underlying investment developments
continue to be weak in the majority of sectors, and within
that mainly among those that produce for the domestic
market. Because of the persistently weak, highly uncertain
prospects, the corporate sector’s interest in new investments
is weak. At the same time, in certain manufacturing sectors
the large individual automotive investment projects, which
are progressing as scheduled, continue to result in
considerable investment activity.
In 2012 Q3, the corporate lending activity of the domestic
financial intermediary system continued to decline,
although to a lesser extent than in the previous periods
(Chart 3-15). There was a drop in both short-term and long-
term corporate loans; the decline in outstanding loans
amounted to a total HUF 82 billion. No significant
improvement was observed either on the demand side or
supply side in terms of the factors that fundamentally
determine corporate lending developments. With the
steadily weak investment requirement, demand for long-
term loans continued to be subdued among companies, and
the deterioration in industrial production restrained short-
term borrowing as well. On the supply side, the maintenance
of the strict lending conditions of the banking sector and
further slight tightening3 of such conditions is also hindering
growth in lending.
Household investment continued to decline in Q3. Based on
housing market indicators, the construction and sale of new
homes was also close to a historical low. The trend of the
number of new building permits indicates historically low
activity in the coming quarters as well (Chart 3-16). In
parallel with the introduction of the interest rate subsidy
schemes, a slight easing of lending conditions started on the
supply side. By contrast, no improvement has been seen in
the volume of new lending compared to the historical low
observed in Q2. Developments in lending to households
tend to be determined by the demand side. Following the
earlier debt accumulation, the balance-sheet adjustment
process presumably continues to be an important element
in the behaviour of households, which considerably reduces
the investment activity of this sector.
3.2.4 InventorIeS
Uncertain growth prospects and tight corporate lending
conditions continue to justify the maintenance of the tight
inventory management typical since the crisis in the private
sector. Due to unfavourable weather conditions and
considerable drought damage, the reduction of agricultural
MACROECONOMIC OVERVIEW
Chart 3-14
Whole-economy investment in machinery
(2001 Q1−2012 Q3; year-on-year)
−30−25−20−15−10−505
10152025
−30−25−20−15−10−505
10152025
2001
2002
2003
2004
2005
2006
2007
2008
2009
2010
2011
2012
Per centPer cent
Gross fixed capital formationBuilding investment (58 per cent)Machinery and equipment investment (40 per cent)
Chart 3-15
net quarterly change in outstanding domestic loans to corporations; breakdown by maturity
(2005 Q1−2012 Q3)
−300
−200
−100
0
100
200
300
400
500
−300
−200
−100
0
100
200
300
400
500
2005 2006 2007 2008 2009 2010 2011 2012
HUF Bn HUF Bn
Net flow, long-term bank loansNet flow, short-term bank loansNet flow, long-term nonbank loansNet flow, short-term nonbank loansNet flow, total domestic loans
Chart 3-16
Construction of new housing and number of building permits issued quarterly
(2001 Q1−2012 Q3)
02,0004,0006,0008,000
10,00012,00014,00016,00018,000
02,0004,0006,0008,000
10,00012,00014,00016,00018,000
2001
2002
2003
2004
2005
2006
2007
2008
2009
2010
2011
2012
Number of dwelingsNumber of dwelings
Number of dwellings put to useNumber of new dwelling construction permits
3 Based on the November 2012 Lending Survey conducted by the MNB.
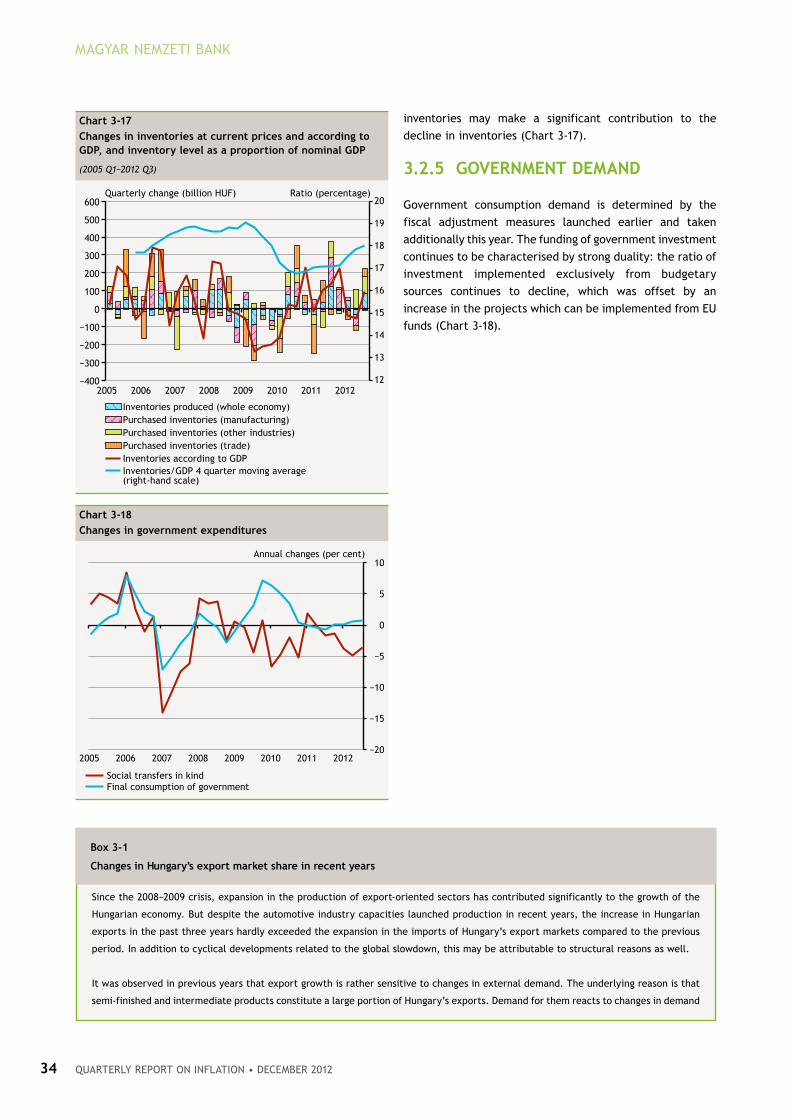
MAGYAR NEMZETI BANK
QuARTERlY REpoRT oN INflATIoN • dEcEMBER 201234
inventories may make a significant contribution to the
decline in inventories (Chart 3-17).
3.2.5 GovernMent DeManD
Government consumption demand is determined by the
fiscal adjustment measures launched earlier and taken
additionally this year. The funding of government investment
continues to be characterised by strong duality: the ratio of
investment implemented exclusively from budgetary
sources continues to decline, which was offset by an
increase in the projects which can be implemented from EU
funds (Chart 3-18).
Chart 3-17
Changes in inventories at current prices and according to GDp, and inventory level as a proportion of nominal GDp
(2005 Q1−2012 Q3)
12
13
14
15
16
17
18
19
20
−400
−300
−200
−100
0
100
200
300
400
500
600
2005 2006 2007 2008 2009 2010 2011 2012
Ratio (percentage)Quarterly change (billion HUF)
Inventories produced (whole economy)Purchased inventories (manufacturing)Purchased inventories (other industries)Purchased inventories (trade)Inventories according to GDPInventories/GDP 4 quarter moving average(right-hand scale)
Chart 3-18
Changes in government expenditures
−20
−15
−10
−5
0
5
10
2005 2006 2007 2008 2009 2010 2011 2012
Annual changes (per cent)
Social transfers in kindFinal consumption of government
Since the 2008−2009 crisis, expansion in the production of export-oriented sectors has contributed significantly to the growth of the
Hungarian economy. But despite the automotive industry capacities launched production in recent years, the increase in Hungarian
exports in the past three years hardly exceeded the expansion in the imports of Hungary’s export markets compared to the previous
period. In addition to cyclical developments related to the global slowdown, this may be attributable to structural reasons as well.
It was observed in previous years that export growth is rather sensitive to changes in external demand. The underlying reason is that
semi-finished and intermediate products constitute a large portion of Hungary’s exports. Demand for them reacts to changes in demand
Box 3-1
Changes in hungary’s export market share in recent years

Quarterly report on inflation • december 2012 35
MACROECONOMIC OVERVIEW
in a much more sensitive manner than the demand for consumer goods.4 Accordingly, a slowdown in global economic activity entails a
slowdown in Hungary’s export market share, while pick-ups in economic activity result in increases in the export market share.
The deceleration in export dynamics exceeded that of Hungary’s competitors in the region, which may indicate a relative deterioration
in Hungary’s competitiveness. Most often this is measured by the change in export market share, i.e. the quotient of Hungary’s exports
and the imports of its export markets (Chart 3-19 and 3-20). In the pre-crisis years, Hungary’s export market share increased by an
annual rate of 4–5 per cent on average. At the beginning of the crisis, the real exchange rate of the forint depreciated considerably,
contributing to an expansion in Hungary’s market share at the turn of 2009−2010. Since 2010 H2, however, average growth of merely
0.5 per cent was observed. Based on earlier domestic and international experiences, the Mercedes factory starting production and the
depreciation of the real exchange rate at the beginning of the year would have justified an increase in the export market share. There
may be several factors behind the subdued dynamics of the export market share.
During the global slowdown, several large Hungarian exporters have struggled with competitiveness problems, resulting in
reorganisations and reductions in production (e.g. Nokia, Flextronics) or even bankruptcy (e.g. Elcoteq, Malév). This is confirmed by
the fact that since the crisis, the share prices of the largest Hungarian exporters (and/or of their international parent companies) have
often underperformed the share prices of their competitors in the sector (Chart 3-21). Accordingly, the protracted weakness of
Hungary’s export market share may be related to the major Hungarian exporters’ deteriorating competitive position at the global level.
Compared with that of neighbouring countries, Hungary’s ability to attract capital deteriorated in the past decade. Not only does this
mean that dynamically developing companies preferred to settle in the neighbouring countries in recent years, it also means that some
of the ones that had settled in Hungary before moved their production to other countries. The share of Hungary in foreign investment
in manufacturing accumulated in the region declined between 2000 and 2009. Missing foreign investment may also have played a role
in the continuous decline in the manufacturing investment rate (Chart 3-22). Moreover, since the crisis, manufacturing investment
activity has continued to decline due to the credit crunch and a fall in propensity to invest, despite the large investment projects in
the automotive industry. This may indicate that, in addition to deteriorating external demand, structural problems may also be behind
the declining export performance.
The increase in Hungary’s export market share is fundamentally limited by the ongoing global balance-sheet adjustment (both in the
private and public sectors), which reduces borrowing from both the demand and supply sides, and thus the volume of investment as
Chart 3-19
Changes in hungary’s export market share
(based on volumes)
−20
−15
−10
−5
0
5
10
15
20
25
−20
−15
−10
−5
0
5
10
15
20
25
1999
2000
2001
2002
2003
2004
2005
2006
2007
2008
2009
2010
2011
2012
Annual changes (per cent) Annual changes (per cent)
Export market shareExportExternal demand
Chart 3-20
Changes of the export market share in the region
(based on value data)
90
100
110
120
130
140
150
90
100
110
120
130
140
150
2005 2006 2007 2008 2009 2010 2011
2005 = 1002005 = 100
Czech RepublicHungaryPolandRomaniaSlovakia
4 Pu CHen (2010), Trade Volatility and Intermediate Goods.
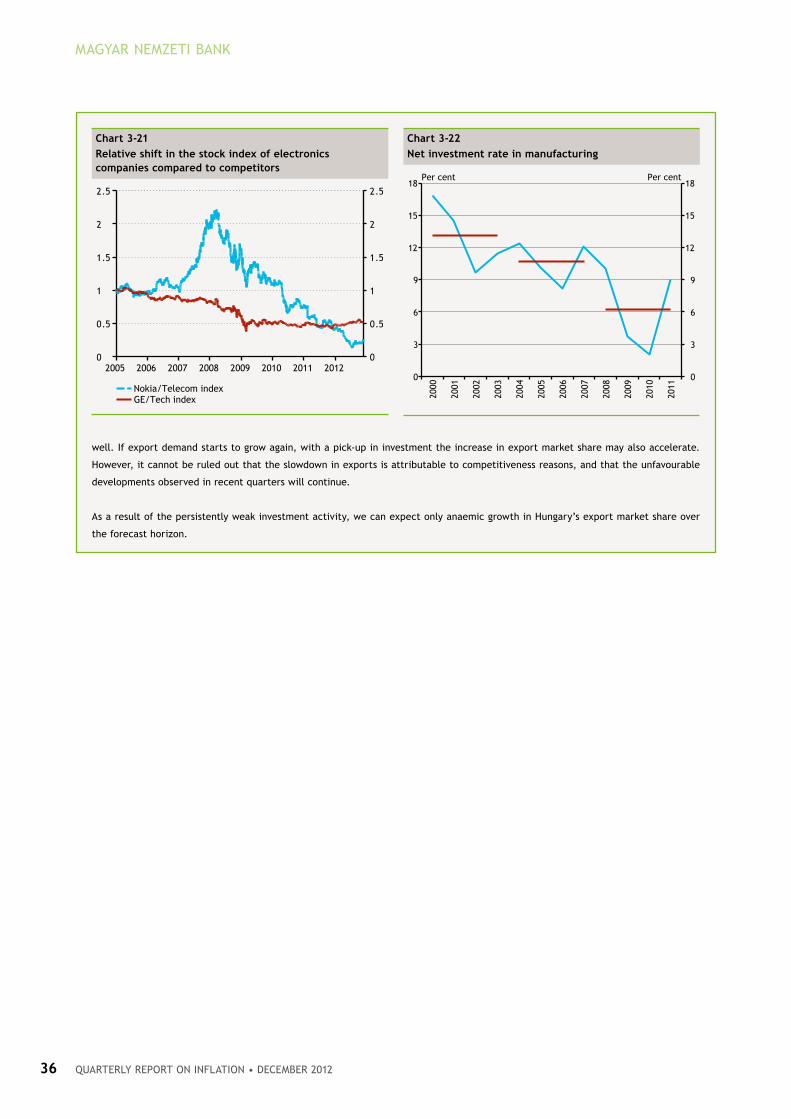
MAGYAR NEMZETI BANK
QuARTERlY REpoRT oN INflATIoN • dEcEMBER 201236
well. If export demand starts to grow again, with a pick-up in investment the increase in export market share may also accelerate.
However, it cannot be ruled out that the slowdown in exports is attributable to competitiveness reasons, and that the unfavourable
developments observed in recent quarters will continue.
As a result of the persistently weak investment activity, we can expect only anaemic growth in Hungary’s export market share over
the forecast horizon.
Chart 3-21
relative shift in the stock index of electronics companies compared to competitors
0
0.5
1
1.5
2
2.5
0
0.5
1
1.5
2
2.5
2005 2006 2007 2008 2009 2010 2011 2012
Nokia/Telecom indexGE/Tech index
Chart 3-22
net investment rate in manufacturing
0
3
6
9
12
15
18
0
3
6
9
12
15
18
2000
2001
2002
2003
2004
2005
2006
2007
2008
2009
2010
2011
Per cent Per cent

Quarterly report on inflation • december 2012 37
Domestic output continued to contract in Q3 as well,
although more slowly than at the beginning of the year. GDP
declined by 0.2 percentage points compared to the previous
quarter. Decelerating growth was observed in sectors
producing for the domestic market as well as those
producing for external markets. The slowdown in Hungary’s
export markets resulted in a fall in output even in the
export-oriented production sectors which had previously
shown dynamic performance. The performance of sectors
producing for the domestic market remained generally
weak. Value added in agriculture declined considerably due
to the drought conditions, which had a significant impact on
developments in whole-economy output, despite the low
weight of the sector (Chart 3-23).
After stagnating in Q3, industrial production declined
markedly in October. The performance of the chemical
industry improved, thanks to the adjustment of one-off
effects from the summer, which were mainly related to the
partial and planned closure of the MOL oil refinery. At the
same time, in the machine industry, growth in vehicle
manufacturing, which had lasted for several months, came
to a halt. Although a shift expansion was carried out in the
Kecskemét plant of Mercedes as of September, its result is
expected to only be reflected in the Q4 data. In line with
the generally weakening business conditions, the decline in
production was typical of a wider range of sectors. The
downturn in the production of the electronics sector
continues to be strong. Compared to earlier months,
prospects for domestic industry deteriorated; following the
outliers in March and April, in the autumn months new
orders fell below the levels observed early in the year,
while new German orders also declined slightly. Overall,
until the end of the year no major change is expected in the
3.3 production and potential output
Economic output continued to slightly decline in 2012 Q3. In parallel with the persistently subdued performance of the
sectors producing for the domestic market, the weakening external economic activity resulted in an increasingly
pronounced fall in production in the industrial sectors as well. Due to extremely unfavourable weather conditions, the
agricultural crop failure reduced whole economy output markedly.
The persistently weak investment activity and the steadily high rate of unemployment continue to call attention to the
structural weaknesses of economic growth. The expansion of the supply capacities of the economy has slowed down
considerably in recent years. The slower expansion of supply capacities may reduce the disinflationary effects of the weak
demand.
Chart 3-23
Structure of annual change in domestic GDp
(2005 Q1−2012 Q3)
−8
−6
−4
−2
0
2
4
6
−4
−3
−2
−1
0
1
2
3
2005
2006
2007
2008
2009
2010
2011
2012
Q1
2012
Q3
2012
Q3
Per centPer cent
Private sector without agricultureAgricultureGovernmentGDP at market prices (QoQ)
Chart 3-24
Industrial production, new orders and the eSI confidence indicator*
(2005 Q1−2012 Q3)
−4
−2
0
2
4
−50−40−30−20−10
01020304050
2005 2006 2007 2008 2009 2010 2011 2012
Per centPer cent
Production of industyNew ordersESI (right-hand scale)
* The ESI series is normalized.
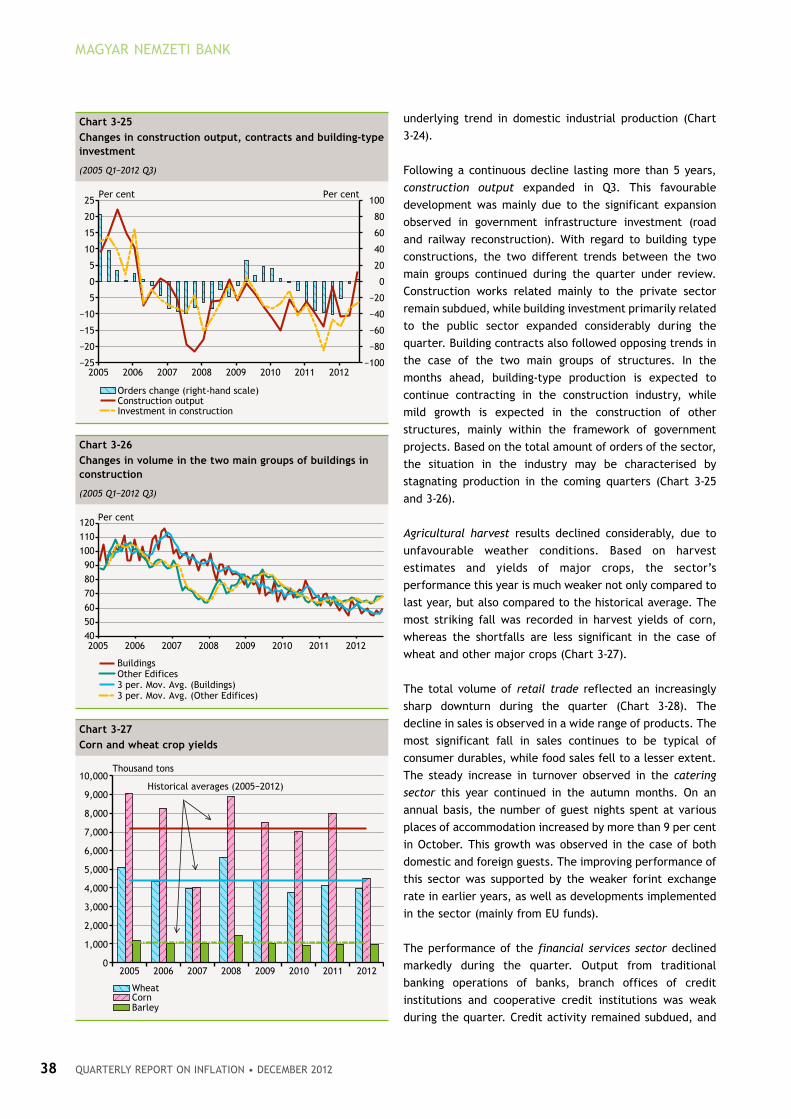
MAGYAR NEMZETI BANK
QuARTERlY REpoRT oN INflATIoN • dEcEMBER 201238
underlying trend in domestic industrial production (Chart
3-24).
Following a continuous decline lasting more than 5 years,
construction output expanded in Q3. This favourable
development was mainly due to the significant expansion
observed in government infrastructure investment (road
and railway reconstruction). With regard to building type
constructions, the two different trends between the two
main groups continued during the quarter under review.
Construction works related mainly to the private sector
remain subdued, while building investment primarily related
to the public sector expanded considerably during the
quarter. Building contracts also followed opposing trends in
the case of the two main groups of structures. In the
months ahead, building-type production is expected to
continue contracting in the construction industry, while
mild growth is expected in the construction of other
structures, mainly within the framework of government
projects. Based on the total amount of orders of the sector,
the situation in the industry may be characterised by
stagnating production in the coming quarters (Chart 3-25
and 3-26).
Agricultural harvest results declined considerably, due to
unfavourable weather conditions. Based on harvest
estimates and yields of major crops, the sector’s
performance this year is much weaker not only compared to
last year, but also compared to the historical average. The
most striking fall was recorded in harvest yields of corn,
whereas the shortfalls are less significant in the case of
wheat and other major crops (Chart 3-27).
The total volume of retail trade reflected an increasingly
sharp downturn during the quarter (Chart 3-28). The
decline in sales is observed in a wide range of products. The
most significant fall in sales continues to be typical of
consumer durables, while food sales fell to a lesser extent.
The steady increase in turnover observed in the catering
sector this year continued in the autumn months. On an
annual basis, the number of guest nights spent at various
places of accommodation increased by more than 9 per cent
in October. This growth was observed in the case of both
domestic and foreign guests. The improving performance of
this sector was supported by the weaker forint exchange
rate in earlier years, as well as developments implemented
in the sector (mainly from EU funds).
The performance of the financial services sector declined
markedly during the quarter. Output from traditional
banking operations of banks, branch offices of credit
institutions and cooperative credit institutions was weak
during the quarter. Credit activity remained subdued, and
Chart 3-25
Changes in construction output, contracts and building-type investment
(2005 Q1−2012 Q3)
−100
−80
−60
−40
−20
0
20
40
60
80
100
−25
−20
−15
−10
5
0
5
10
15
20
25
2005 2006 2007 2008 2009 2010 2011 2012
Per centPer cent
Orders change (right-hand scale)Construction outputInvestment in construction
Chart 3-26
Changes in volume in the two main groups of buildings in construction
(2005 Q1−2012 Q3)
40
50
60
70
80
90
100
110
120
2005 2006 2007 2008 2009 2010 2011 2012
Per cent
BuildingsOther Edifices3 per. Mov. Avg. (Buildings)3 per. Mov. Avg. (Other Edifices)
Chart 3-27
Corn and wheat crop yields
0
1,000
2,000
3,000
4,000
5,000
6,000
7,000
8,000
9,000
10,000
2005 2006 2007 2008 2009 2010 2011 2012
Thousand tons
WheatCornBarley
Historical averages (2005−2012)

Quarterly report on inflation • december 2012 39
MACROECONOMIC OVERVIEW
the income of insurer companies declined because of the
fall in premiums.
Our view of the potential level of output remained
unchanged compared to the situation described in the
September issue of the Quarterly Report on Inflation. The
new capacity-increasing investment projects implemented
in the automotive industry are still unable to fully offset the
broad-based decline observed in investment. Accordingly,
the growth rate of capital stock may have continued to
decline this year. So far, the pick-up in labour supply
observed in recent years has mainly been reflected in the
increase in public employment, which is characterised by
lower productivity. The unemployment rate declined this
year, but remains at a high level, which may pose a risk in
terms of the rise in permanent unemployment. Overall, the
developments observed both in the labour market and
capital accumulation suggest a sustained deceleration in
potential growth (Chart 3-29).
Chart 3-28
Monthly dynamics in retail sales
−25
−20
−15
−10
−5
0
5
10
15
20
25
−25
−20
−15
−10
−5
0
5
10
15
20
25
2005 2006 2007 2008 2009 2010 2011 2012
Per centPer cent
Monthly changeTrendMoving average (3 monthly)
Chart 3-29
Changes in potential growth
−1
0
1
2
3
4
5
1996 1998 2000 2002 2004 2006 2008 2010 2012
Per cent
Growth contribution of capitalGrowth contribution of TFPGrowth contribution of working hoursPotencial growth
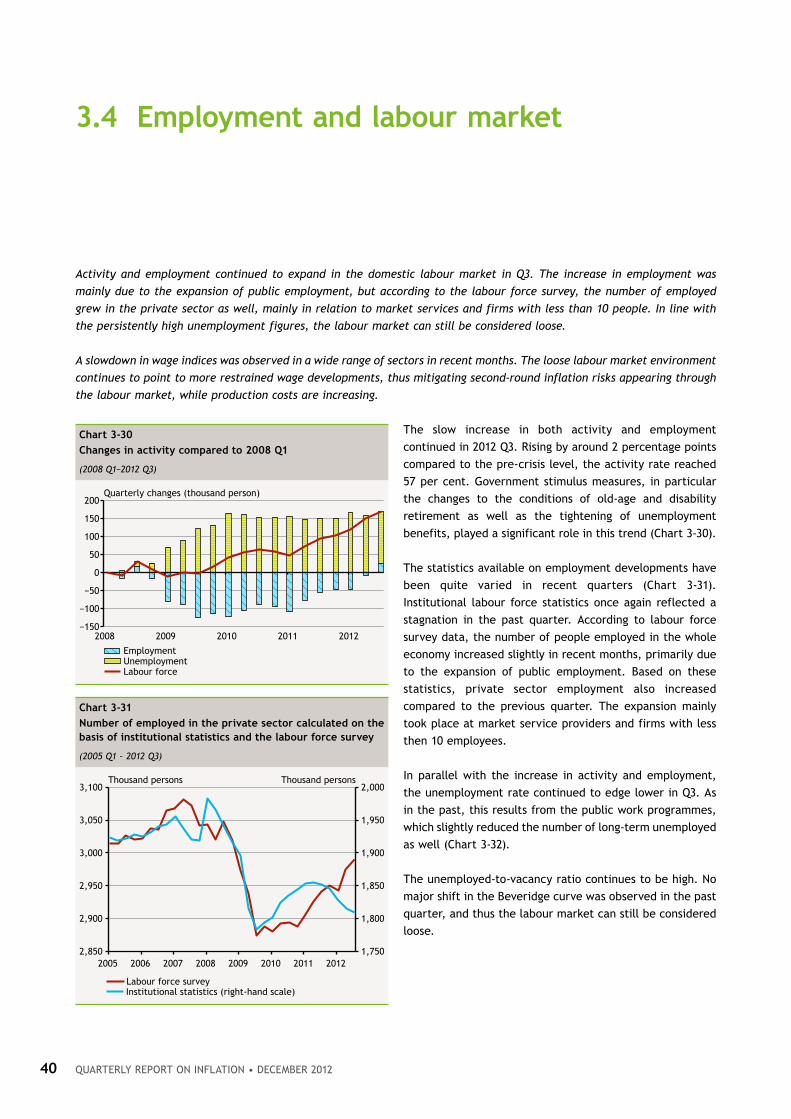
Quarterly report on inflation • december 201240
The slow increase in both activity and employment
continued in 2012 Q3. Rising by around 2 percentage points
compared to the pre-crisis level, the activity rate reached
57 per cent. Government stimulus measures, in particular
the changes to the conditions of old-age and disability
retirement as well as the tightening of unemployment
benefits, played a significant role in this trend (Chart 3-30).
The statistics available on employment developments have
been quite varied in recent quarters (Chart 3-31).
Institutional labour force statistics once again reflected a
stagnation in the past quarter. According to labour force
survey data, the number of people employed in the whole
economy increased slightly in recent months, primarily due
to the expansion of public employment. Based on these
statistics, private sector employment also increased
compared to the previous quarter. The expansion mainly
took place at market service providers and firms with less
then 10 employees.
In parallel with the increase in activity and employment,
the unemployment rate continued to edge lower in Q3. As
in the past, this results from the public work programmes,
which slightly reduced the number of long-term unemployed
as well (Chart 3-32).
The unemployed-to-vacancy ratio continues to be high. No
major shift in the Beveridge curve was observed in the past
quarter, and thus the labour market can still be considered
loose.
3.4 employment and labour market
Activity and employment continued to expand in the domestic labour market in Q3. The increase in employment was
mainly due to the expansion of public employment, but according to the labour force survey, the number of employed
grew in the private sector as well, mainly in relation to market services and firms with less than 10 people. In line with
the persistently high unemployment figures, the labour market can still be considered loose.
A slowdown in wage indices was observed in a wide range of sectors in recent months. The loose labour market environment
continues to point to more restrained wage developments, thus mitigating second-round inflation risks appearing through
the labour market, while production costs are increasing.
Chart 3-30
Changes in activity compared to 2008 Q1
(2008 Q1−2012 Q3)
−150
−100
−50
0
50
100
150
200
2008 2009 2010 2011 2012
Quarterly changes (thousand person)
EmploymentUnemploymentLabour force
Chart 3-31
number of employed in the private sector calculated on the basis of institutional statistics and the labour force survey
(2005 Q1 – 2012 Q3)
1,750
1,800
1,850
1,900
1,950
2,000
2,850
2,900
2,950
3,000
3,050
3,100
2005 2006 2007 2008 2009 2010 2011 2012
Thousand personsThousand persons
Labour force surveyInstitutional statistics (right-hand scale)

Quarterly report on inflation • december 2012 41
MACROECONOMIC OVERVIEW
Chart 3-32
unemployment rates
(2005 Q1−2012 Q3)
2.0
2.5
3.0
3.5
4.0
4.5
5.0
5.5
6
7
8
9
10
11
12
2005 2006 2007 2008 2009 2010 2011 2012
Per centPer cent
Unemployment rateLong-term unemployment rate (right-hand scale)
The differences between various employment statistics were discussed in a box in the September issue of the Quarterly Report on
Inflation. The uncertainty experienced in employment statistics also makes the calculation of reliable productivity indicators difficult.
It is important to understand the differences between the two types of statistics for this reason as well.
Data from institutional statistics (IS) and the labour force survey (LFS) are available for measuring the number of employees. The LFS
is based on individual inquiries and represents the domestic labour market as a whole, whereas the IS contain data provided by
enterprises that employ more than 4 people and by budgetary institutions. In addition, there are other methodological differences as
well between the two types of statistics. Of these differences, it is important to emphasise that the LFS is able to capture the number
of people employed in public work programmes only with a high degree of uncertainty; consequently, their classification into sectors
is also uncertain.
LFS data have already reflected a steady expansion of employment in the private sector since 2011, while according to the IS the
number of employed has been declining since mid-2011.
One of the reasons for the difference between the data for the
number of employed may be the different recording of public
employment. In the IS, the number of people in the non-profit
sector and the number of public workers are separated from the
private sector. However, since 2009 developments in employment
in the non-profit sector have showed strong co-movement with
developments in public worker employment, indicating that some
of the public workers are employed through non-profit companies.
At the same time, non-profit enterprises cannot be separated in
the LFS; they appear as a part of the competitive sector, and this
may explain the differences between the two types of statistics.
Another reason for the difference between the employment
statistics may be that the statistics cover different scopes of
companies. Based on the individual-level data of the LFS, it is
possible to calculate the change in number of employees in
categories according to the number of employed. According to
these statistics, since the peak of the crisis, employment has
expanded considerably (by some 75,000 people) again among
Box 3-2
possible reasons of increasing employment in the labour force survey
Chart 3-33
number of employees in the private sector according to company size
(seasonally adjusted quarterly LFS data)
−100
−80
−60
−40
−20
0
20
40
−100
−80
−60
−40
−20
0
20
40
2005 2006 2007 2008 2009 2010 2011 2012
Under 10 employeesOver 10 employees
Change compared toQ3 2008 (thousand employees)
Change compared toQ3 2008
(thousand employees)

MAGYAR NEMZETI BANK
QuARTERlY REpoRT oN INflATIoN • dEcEMBER 201242
micro enterprises that employ less than 10 registered employees (see Chart 3-33). As a result, the number of people employed by these
companies was close to pre-crisis levels by the middle of this year. By contrast, employment at larger companies was unable to move
from the levels typically seen at the peak of the crisis. Micro enterprises are not covered by the IS, so their expansion does not
influence the changes in IS statistics.
The expansion of employment at micro enterprises contrasts with the developments in economic activity. However, only very little
data and with relatively high measurement uncertainty are available for this scope of companies. In addition, the proportion of black
employment and grey or black economic activities is greater among these companies, which also impairs data quality (for detailed data
and their impact on productivity calculation see the special topic entitled Factors explaining the productivity shortfall.)
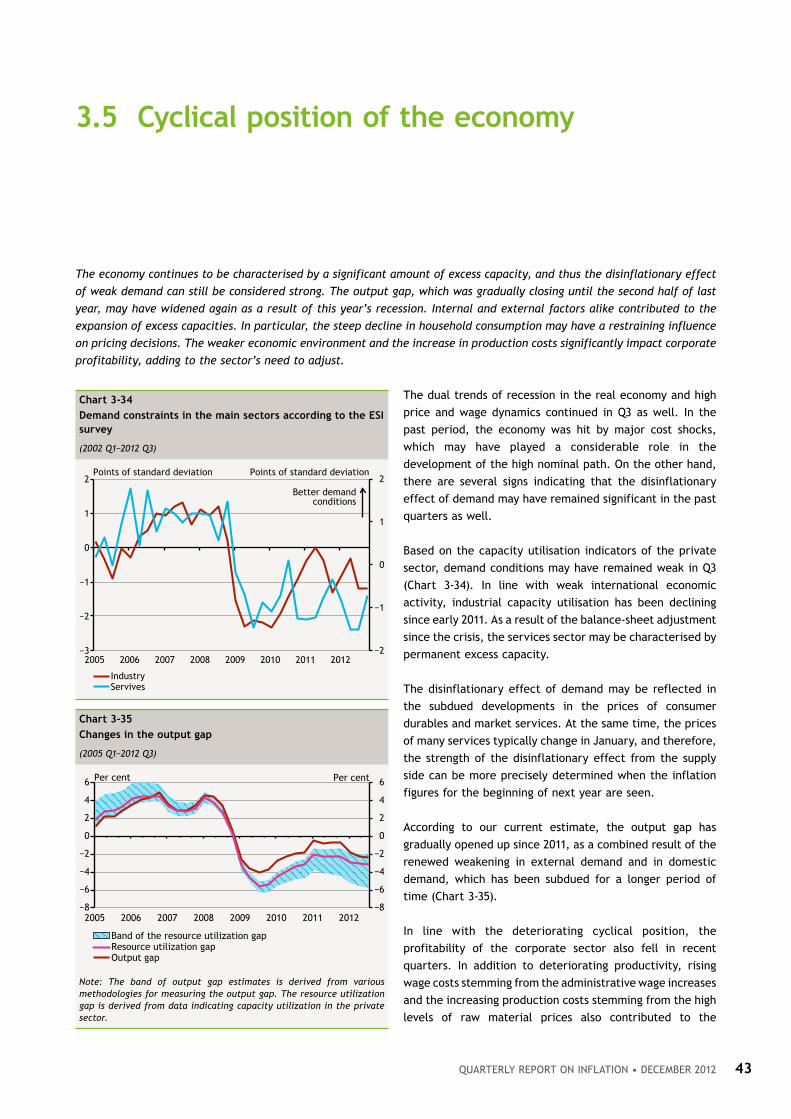
Quarterly report on inflation • december 2012 43
The dual trends of recession in the real economy and high
price and wage dynamics continued in Q3 as well. In the
past period, the economy was hit by major cost shocks,
which may have played a considerable role in the
development of the high nominal path. On the other hand,
there are several signs indicating that the disinflationary
effect of demand may have remained significant in the past
quarters as well.
Based on the capacity utilisation indicators of the private
sector, demand conditions may have remained weak in Q3
(Chart 3-34). In line with weak international economic
activity, industrial capacity utilisation has been declining
since early 2011. As a result of the balance-sheet adjustment
since the crisis, the services sector may be characterised by
permanent excess capacity.
The disinflationary effect of demand may be reflected in
the subdued developments in the prices of consumer
durables and market services. At the same time, the prices
of many services typically change in January, and therefore,
the strength of the disinflationary effect from the supply
side can be more precisely determined when the inflation
figures for the beginning of next year are seen.
According to our current estimate, the output gap has
gradually opened up since 2011, as a combined result of the
renewed weakening in external demand and in domestic
demand, which has been subdued for a longer period of
time (Chart 3-35).
In line with the deteriorating cyclical position, the
profitability of the corporate sector also fell in recent
quarters. In addition to deteriorating productivity, rising
wage costs stemming from the administrative wage increases
and the increasing production costs stemming from the high
levels of raw material prices also contributed to the
3.5 Cyclical position of the economy
The economy continues to be characterised by a significant amount of excess capacity, and thus the disinflationary effect
of weak demand can still be considered strong. The output gap, which was gradually closing until the second half of last
year, may have widened again as a result of this year’s recession. Internal and external factors alike contributed to the
expansion of excess capacities. In particular, the steep decline in household consumption may have a restraining influence
on pricing decisions. The weaker economic environment and the increase in production costs significantly impact corporate
profitability, adding to the sector’s need to adjust.
Chart 3-34
Demand constraints in the main sectors according to the eSI survey
(2002 Q1−2012 Q3)
−2
−1
0
1
2
−3
−2
−1
0
1
2
2005 2006 2007 2008 2009 2010 2011 2012
Points of standard deviationPoints of standard deviation
IndustryServives
Better demandconditions
Chart 3-35
Changes in the output gap
(2005 Q1−2012 Q3)
−8
−6
−4
−2
0
2
4
6
−8
−6
−4
−2
0
2
4
6
2005 2006 2007 2008 2009 2010 2011 2012
Per centPer cent
Band of the resource utilization gapResource utilization gapOutput gap
Note: The band of output gap estimates is derived from various methodologies for measuring the output gap. The resource utilization gap is derived from data indicating capacity utilization in the private sector.
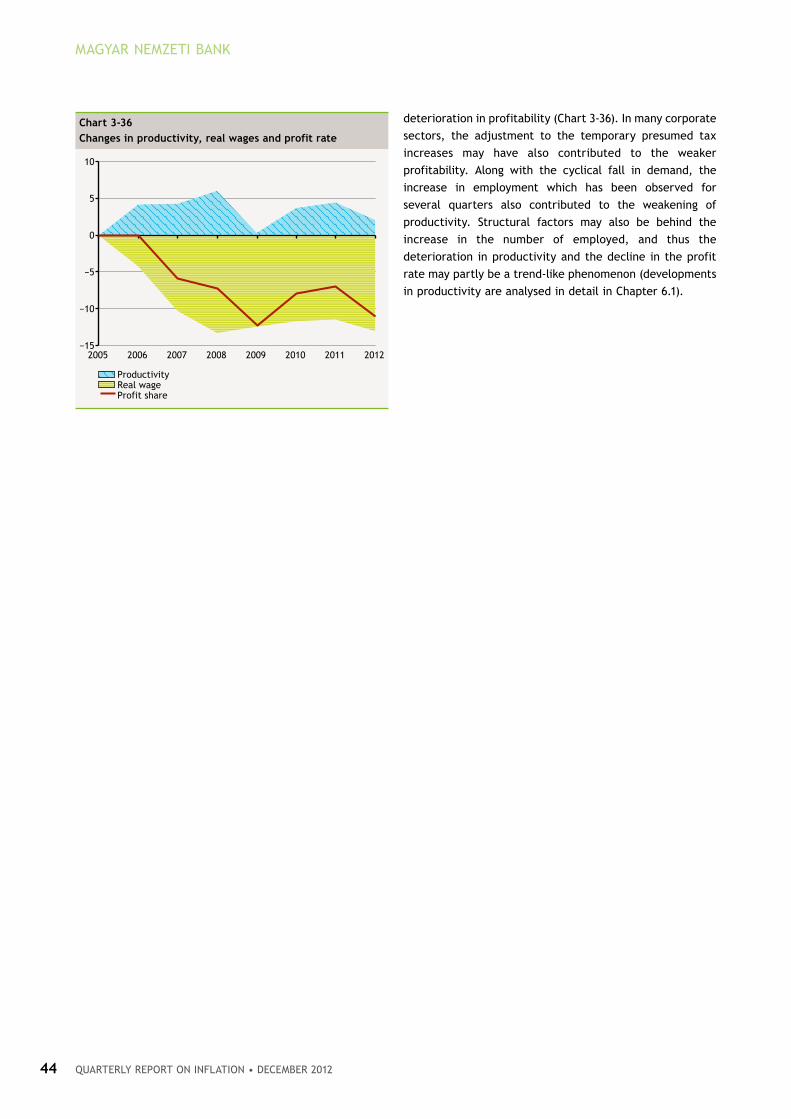
MAGYAR NEMZETI BANK
QuARTERlY REpoRT oN INflATIoN • dEcEMBER 201244
deterioration in profitability (Chart 3-36). In many corporate
sectors, the adjustment to the temporary presumed tax
increases may have also contributed to the weaker
profitability. Along with the cyclical fall in demand, the
increase in employment which has been observed for
several quarters also contributed to the weakening of
productivity. Structural factors may also be behind the
increase in the number of employed, and thus the
deterioration in productivity and the decline in the profit
rate may partly be a trend-like phenomenon (developments
in productivity are analysed in detail in Chapter 6.1).
Chart 3-36
Changes in productivity, real wages and profit rate
−15
−10
−5
0
5
10
2005 2006 2007 2008 2009 2010 2011 2012
ProductivityReal wageProfit share

Quarterly report on inflation • december 2012 45
3.6.1 WaGeS
In September 2012, regular earnings increased by 4.3 per
cent in the whole economy and by 6.8 per cent in the
private sector, while they declined by 1.7 per cent in the
general government (including employees in public work
schemes). Following a significant wage increase early in the
year, the wage index of the private sector has declined in
recent months (Chart 3-37). Slower wage dynamics were
especially apparent in manufacturing, which may also have
been attributable to the mid-year changes to regulations
concerning shift compensation and to the decline in
industrial production in the autumn (Chart 3-38).
Regular earnings increased by an average of 8 per cent in
H1, which was attributable to the administrative measures
entering into force at the beginning of the year. The
measures resulted in a surge in the wage index, mainly for
employees with low earnings. However, wages of employees
in higher earning categories, which were not directly
affected by the measures, also increased; the compensation
provided by the government did not cover these wages (a
more detailed overview of the subject can be found in Box
3-3).
Inflationary pressures from the labour market may be offset
by several factors. Companies continue to cut back non-
regular pay components. Non-wage benefits in the private
sector (primarily meal vouchers) are more than 10 per cent
lower than level of payments observed last year. In
addition, the widespread use of government wage
compensation also contributed to a reduction in cost
3.6 Costs and inflation
Following the September peak, annual consumer price inflation decelerated significantly in the autumn months. The decline
in the price index was mainly attributable to falling fuel prices. Although to a lesser extent, the decline in inflationary
pressure was also reflected in the indicators of underlying inflation, which show the strong disinflationary effects of the
continuing contraction in domestic demand. In addition to weak demand, the forint exchange rate, which stabilised at a
stronger level in the past half year compared to the level observed at the beginning of the year, also helped mitigate
underlying inflation.
Following a significant acceleration early in the year, the wage index of the private sector declined in recent months. The
government wage compensation offset the direct cost-increasing effects of the administrative wage increases, but in the
private sector the effects feeding through the salary scale resulted in wage increases that decoupled from developments in
productivity. In the short run, rising unit labour costs may force further adjustment on the part of the companies concerned.
Chart 3-37
Changes in regular gross monthly average earnings in the private sector
(January 2005−September 2012)
0
2
4
6
8
10
12
2005 2006 2007 2008 2009 2010 2011 2012
Per cent
ManufacturingServices
Chart 3-38
regular monthly earnings
(January 2004−September 2012)
−3−2−10123456
Jan.
Feb.
Mar
.
Apr
.
May
June
July
Aug
.
Sep.
Oct
.
Nov
.
Dec
.
Per cent
200420052006200720082009201020112012
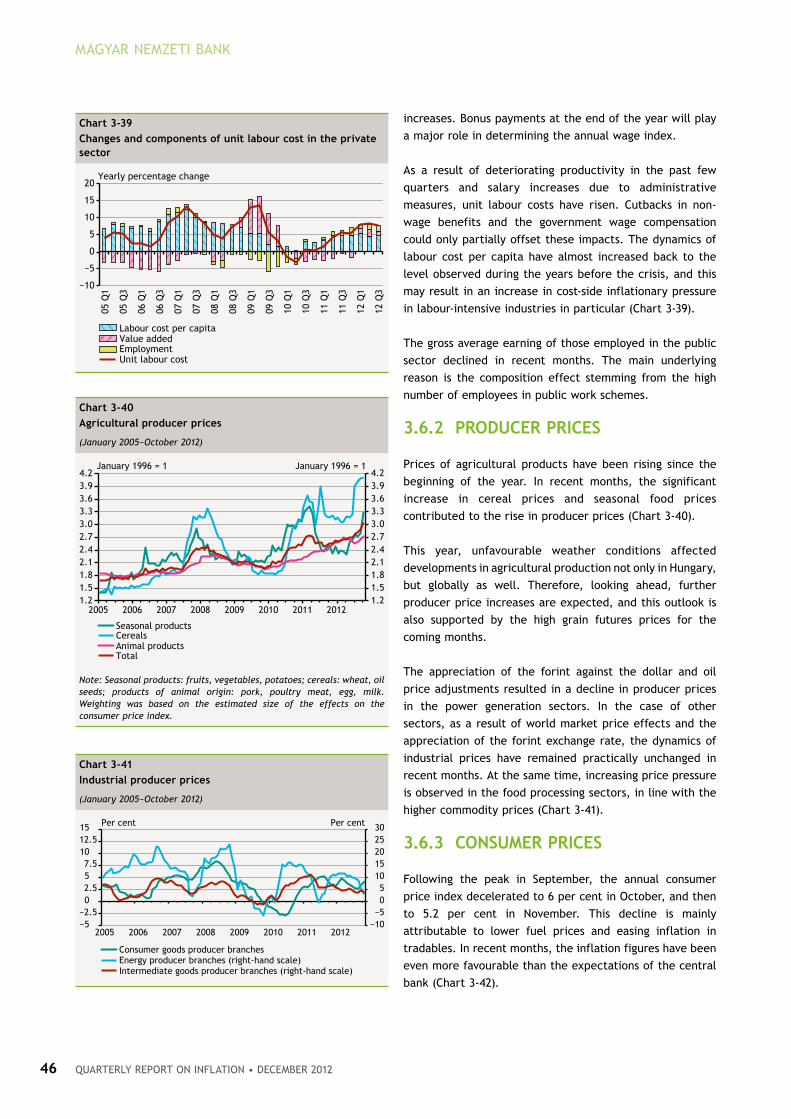
MAGYAR NEMZETI BANK
QuARTERlY REpoRT oN INflATIoN • dEcEMBER 201246
increases. Bonus payments at the end of the year will play
a major role in determining the annual wage index.
As a result of deteriorating productivity in the past few
quarters and salary increases due to administrative
measures, unit labour costs have risen. Cutbacks in non-
wage benefits and the government wage compensation
could only partially offset these impacts. The dynamics of
labour cost per capita have almost increased back to the
level observed during the years before the crisis, and this
may result in an increase in cost-side inflationary pressure
in labour-intensive industries in particular (Chart 3-39).
The gross average earning of those employed in the public
sector declined in recent months. The main underlying
reason is the composition effect stemming from the high
number of employees in public work schemes.
3.6.2 proDuCer prICeS
Prices of agricultural products have been rising since the
beginning of the year. In recent months, the significant
increase in cereal prices and seasonal food prices
contributed to the rise in producer prices (Chart 3-40).
This year, unfavourable weather conditions affected
developments in agricultural production not only in Hungary,
but globally as well. Therefore, looking ahead, further
producer price increases are expected, and this outlook is
also supported by the high grain futures prices for the
coming months.
The appreciation of the forint against the dollar and oil
price adjustments resulted in a decline in producer prices
in the power generation sectors. In the case of other
sectors, as a result of world market price effects and the
appreciation of the forint exchange rate, the dynamics of
industrial prices have remained practically unchanged in
recent months. At the same time, increasing price pressure
is observed in the food processing sectors, in line with the
higher commodity prices (Chart 3-41).
3.6.3 ConSuMer prICeS
Following the peak in September, the annual consumer
price index decelerated to 6 per cent in October, and then
to 5.2 per cent in November. This decline is mainly
attributable to lower fuel prices and easing inflation in
tradables. In recent months, the inflation figures have been
even more favourable than the expectations of the central
bank (Chart 3-42).
Chart 3-39
Changes and components of unit labour cost in the private sector
−10
−5
0
5
10
15
20
05 Q
1
05 Q
3
06 Q
1
06 Q
3
07 Q
1
07 Q
3
08 Q
1
08 Q
3
09 Q
1
09 Q
3
10 Q
1
10 Q
3
11 Q
1
11 Q
3
12 Q
1
12 Q
3
Yearly percentage change
Labour cost per capitaValue addedEmploymentUnit labour cost
Chart 3-40
agricultural producer prices
(January 2005−October 2012)
1.21.51.82.12.42.73.03.33.63.94.2
1.21.51.82.12.42.73.03.33.63.94.2
2005 2006 2007 2008 2009 2010 2011 2012
January 1996 = 1 January 1996 = 1
Seasonal productsCerealsAnimal productsTotal
Note: Seasonal products: fruits, vegetables, potatoes; cereals: wheat, oil seeds; products of animal origin: pork, poultry meat, egg, milk. Weighting was based on the estimated size of the effects on the consumer price index.
Chart 3-41
Industrial producer prices
(January 2005−October 2012)
−10−505
1015202530
−5−2.502.557.5
1012.515
2005 2006 2007 2008 2009 2010 2011 2012
Per centPer cent
Consumer goods producer branchesEnergy producer branches (right-hand scale)Intermediate goods producer branches (right-hand scale)

Quarterly report on inflation • december 2012 47
MACROECONOMIC OVERVIEW
Indirect tax increases at the beginning of the year and cost
shocks (unprocessed food and fuel prices) continued to
contribute strongly to the elevated inflation figures, which
are also high by international comparison. Indicators of
underlying inflation, which exclude these effects, paint a
more favourable picture. Demand-sensitive inflation has
decreased slightly since the middle of the year (Chart 3-43).
While the indicator had previously been high by regional
standards, the measures have dropped to levels consistent
with that of low-inflation countries in the past few quarters,
in line with the continuing decline in domestic demand
(Chart 3-44).
Tradables inflation in the past months was determined by
the exchange rate, which was stronger than at the
beginning of the year, and by weak demand. Durable goods
prices continue to decline. This product group is
characterised by subdued price developments, which may
be explained by an environment of weak demand. The
stronger forint exchange rate may have fed into the prices
of non-durable goods as well; in addition, annual inflation
in this category was also influenced by one-off factors
(significant drop in airfares).
Since February, monthly inflation in market services
excluding tax changes has been more favourable, compared
to the usual seasonality. As a result, the annual index of
market services is historically low. The rise in the annual
index for October was caused by base effects. The
development of prices of market services may reflect the
strong price-reducing effect of weak domestic demand. At
the same time, it is important to note that services are
rarely repriced at the end of the year. Therefore, the
figures for the first months of next year may provide
definitive information on the magnitude of the inflationary
pressure in this segment (Chart 3-45).
In line with producer prices, the prices of food products
which are sensitive to cost shocks increased sharply in
recent months. Changes in the prices of unprocessed food
were affected by this year’s unfavourable weather, which
led to significant rises in the prices of seasonal products
(vegetables, fruits and potato). In the case of processed
food, in addition to the rising producer price pressure, the
previous quarter’s high level of fuel prices also contributes
to the price increases. In spite of the increasing cost
pressure, for the time being only a slight acceleration can
be observed in consumer prices. Within this range of
products, the prices of processed meat products have
increased the most significantly to date. The slow feed-
through of cost shocks indicates that the decline in
household demand may constrain retailers’ pricing decisions
in the food market as well. Nevertheless, as a result of raw
Chart 3-42
Decomposition of the consumer price index
(January 2005−November 2012)
2005 2006 2007 2008 2009 2010 2011 2012−2
0
2
4
6
8
10Percentage point
OthersFood and energyPrimary effects of government measuresCPI
Chart 3-43
Developments in the consumer price index and core inflation excluding tax changes and in demand sensitive inflation
(January 2005−November 2012)
0
1
2
3
4
5
6
7
8
0
1
2
3
4
5
6
7
8
2005 2006 2007 2008 2009 2010 2011 2012
Per centPer cent
CPI excluding indirect tax effectCore inflation excluding indirect tax effectDemand sensitive inflation
Chart 3-44
Development of demand sensitive inflation in the region
(January 2008−October 2012)
−3
−2
−1
0
1
2
3
4
5
6
7
−3
−2
−1
0
1
2
3
4
5
6
7
2008 2009 2010 2011 2012
Per centPer cent
Czech RepublicHungaryPolandRomaniaSlovakia

MAGYAR NEMZETI BANK
QuARTERlY REpoRT oN INflATIoN • dEcEMBER 201248
food price increases, processed food price inflation may
continue to rise in the coming months.
The significant appreciation of the forint against the US
dollar has resulted in a substantial decline in fuel prices in
recent months. As during the whole year, regulated energy
prices continue to be characterised by subdued price
dynamics. Within pharmaceutical products, despite the
reduction of price subsidies, prices of subsidised medicines
increased to a lesser extent.5 The price increase stemming
from the reduction of subsidies may have been partly offset
by the new pricing mechanism (e.g. blind bidding) introduced
at the beginning of the year.
Overall, in the past period, it was mainly cost shocks
(unprocessed food and fuel prices) which contributed to
developments in inflation. At the same time, moderate
price increases were observed in a wide range of products.
Looking ahead, demand-side inflationary pressure may
remain subdued in the coming months as well. Strong
declines in fuel prices and a slowdown in unprocessed food
price increases may result in improving developments in
inflation over the short run.
3.6.4 InflatIon expeCtatIonS
Following a decline in the middle of the year, households’
inflation expectations increased (Chart 3-47). The higher
commodity prices in recent months and the announced
government measures may have also contributed to this
increase. Despite the stronger exchange rate and the
moderate increase in utility prices, households’ inflation
perceptions continue to be at a high level. The uncertainty
of perceptions related to the expected inflation environment
also increased in accordance with the strong volatility of
inflation seen in recent quarters.
In terms of short-term prospective developments in
consumer prices, the expectations of the retail trade sector
regarding sales prices are a key factor. Following a mid-year
increase, expectations declined slightly, which may indicate
that the disinflationary effects of weak demand may
continue to act as a strong constraint on the pricing
decisions of the sector (Chart 3-48).
5 Presumably, the reduction of subsidies will rather result in the withdrawal of the products concerned from the Hungarian market.
Chart 3-45
tradables and market services inflation
(January 2005−November 2012)
−1
0
1
2
3
4
5
6
7
−1
0
1
2
3
4
5
6
7
2005 2006 2007 2008 2009 2010 2011 2012
Per centPer cent
Market servicesTradables
Chart 3-46
range of underlying inflation indicators
(January 2005−November 2012)
−2
−1
0
1
2
3
4
5
6
7
8
2005 2006 2007 2008 2009 2010 2011 2012
Per cent
Chart 3-47
households’ inflation expectations
(January 2005 – November 2012)
0
2
4
6
8
10
12
14
0
2
4
6
8
10
12
14
2005 2006 2007 2008 2009 2010 2011 2012
Per centPer cent
Inflation target
Range of inflation expectationsActual inflation
Source: MNB calculations based on data from the EU Commission.

Quarterly report on inflation • december 2012 49
MACROECONOMIC OVERVIEW
Chart 3-48
expected changes in retail sales prices in the next 3 months* and actual inflation
(January 2005−November 2012)
−0.8
0.0
0.8
1.6
2.4
3.2
4.0
0
15
30
45
60
75
90
2005 2006 2007 2008 2009 2010 2011 2012
Per centBalance
BalanceChange of 3 months average of CPI (right-hand scale)
* The balance is the difference between the proportions of corporations expecting price increase and price decrease.
The administrative wage increases (minimum wage increase and guaranteed wage minimum increase) which entered into force in 2012
contributed significantly to the increase in gross average earnings, both indirectly and directly. The measures resulted in a surge in the
wage index, mainly for employees with low earnings. However, the wages of persons employed in higher earning categories not directly
affected by the measures also increased, and the compensation provided by the government did not cover these wages. The measures
render analysis of wage developments in 2012 more difficult, and therefore, the aforementioned effects are quantified in this box.
We used the 2011 Wage Tariff Survey of the National Employment
Service to estimate the direct effect. We calculated the size of
the direct impact of the measures on the wage index on the basis
of the number and the wage bill of employees who earn the
minimum wage and the guaranteed wage minimum in the private
sector. Its value represents approximately 2.4 percentage points
in the 2012 wage index of the private sector.
Among those with high earnings, one possible reason for the feed-
through effect is that companies strive to maintain the relationship
between employees’ relative productivity and relative wages. In
addition, another possible explanation is whitening (the reported
wage bill approaches the real wage bill). In the aforementioned
cases, when the wages of those who earn less are raised, the
wages of those with higher earnings are also increased in order to
maintain the differences across wages within the company (wage
compression). Tightness may also be an alternative explanation
for the second-round effect among employees with higher
Box 3-3
effects of administrative wage increases on private sector wages
Chart 3-49
Increase in gross average earnings at various wage levels in the private sector
0
1
2
3
4
5
6
7
Gross average earnings in private sector
Per cent
Gross average earnings excluding all effects of the administrative wage hikeSpillover effect of the administrative wage hike (above the average wage)Technical effect of the administrative wage hike

MAGYAR NEMZETI BANK
QuARTERlY REpoRT oN INflATIoN • dEcEMBER 201250
qualifications. Accordingly, the feed-through effects of administrative measures may explain around 1.1 percentage points of this year’s
wage index, which may be considered an upper estimate due to the alternative explanation. This increase already appears in those
earning categories that are not included in the wage compensation, i.e. at companies it appears in full as an increase in wage costs
(Chart 3-49).
According to our calculations, the 2012 wage index figure which excludes the administrative measures and better captures underlying
wage developments is around 3.7 per cent. The second-round effect observed among employees with higher earnings is added to it.
Accordingly, the effective wage cost increased by some 4–5 per cent, which can be considered high during a recession and requires
adjustment. The adjustment could already be observed in the wage figures of recent months.

Quarterly report on inflation • december 2012 51
4.1.1 rISk perCeptIon of hunGary
Improvements in the global investment environment and a
one-off technical impact are the likely causes of the
reduction in the perception of Hungarian sovereign risk over
the past three months (for more information, see the Box
4-1). Over the period as a whole, country-specific factors
have also been a positive contributor, although to a lesser
extent. However, this favourable development did not
materialise consistently: in the first half of October, similar
to other countries in the region, perceptions of the
Hungarian sovereign risk improved rapidly and markedly
relative to the previous period. By contrast, CDS premia
moved in the opposite direction between the second half of
October and mid-November (Chart 4-1 and 4-2), when
domestic instruments slightly underperformed the region.
That said, there has been some improvement over the past
one month.
The improvement in the global environment reflected in
part the outcome of crisis management in the euro area.
Market tensions were eased by successful bond auctions in
euro-area periphery countries, recent agreements on Greece
and the lower-than-expected needs for recapitalisation of
Spain’s banking system. Furthermore, enhancement of the
quantitative easing programs of major central banks also
contributed to the increase in global risk appetite.
4 financial markets and lending
4.1 trends in the domestic financial market
Since September 2012, improvements in the global investment environment and a one-off technical impact have led to a
significant reduction in perceptions of Hungarian sovereign risk. This may reflect favourable developments in crisis
management in the euro area as well as a broader quantitative easing policy of central banks. Apart from a few minor
deviations, domestic risk premia followed global market trends. As regards domestic events, Hungary’s market perception
was favourably influenced by the first fiscal adjustment package announced in early October, whereas the second package
had a negative impact on Hungary’s market perception. The EUR/HUF exchange rate has responded mainly to global
sentiment over the past three months; domestic events are only likely to have exerted a stronger impact for short periods.
Similarly, Hungary’s downgrade in late November only exerted a temporary impact on the EUR/HUF exchange rate. CDS
premia for Hungary also narrowed significantly, by close to 80 basis points, although the country decoupled from regional
trends in a negative direction during a certain part of the period under review. Benchmark yields on forint government
securities also declined, while government securities held by non-residents reached another record high, rising above HUF
5,000 billion. This means that non-resident market participants account for 45 per cent of total holdings of forint-
denominated Treasury bills and bonds.
Chart 4-1
5-year sovereign credit default swap premia in the region
200250300350400450500550600650700750800
200250300350400450500550600650700750800
1 Se
p. 1
123
Sep
11
17 O
ct.
118
Nov
. 11
30 N
ov.
1122
Dec
. 11
13 J
an.
126
Feb.
12
28 F
eb.
1221
Mar
. 12
12 A
pr.
124
May
12
28 M
ay 1
219
Jun
e 12
11 J
uly
122
Aug
. 12
24 A
ug.
1217
Sep
. 12
9 O
ct.
1231
Oct
. 12
22 N
ov.
12
Basis pointsBasis points
HungaryRomaniaCroatia

MAGYAR NEMZETI BANK
QuARTERlY REpoRT oN INflATIoN • dEcEMBER 201252
A more benign global sentiment led to a reduction in the
risk premia on risky assets. yields on the government
securities and the CDS premia of euro-area periphery
countries narrowed, and in particular yields on Greek
securities declined markedly. By early December, stock
market indexes in developed markets had offset the slight
decline experienced around the middle of the period, and
for the period as a whole commodity prices declined
modestly.
Apart from a few minor deviations, domestic risk premia
followed global market trends. Hungary’s 5-year CDS
premium dropped from 370 basis points at the beginning of
the period to close to 290 basis points by the end. Before
mid-October, the premium moved broadly together with
the premia of other countries in the region with risks
similar to Hungary, but it then subsequently started to
decouple from them: whilst risk premia in Croatia and
Romania were broadly flat in this period, premia in Hungary
rose by 70 basis points by mid-November, reaching a level
of 320 basis points. However, there has been a slight decline
over the past one month, with the domestic risk premium
moving together with regional trends again (Chart 4-3).
As regards domestic events, the first fiscal adjustment
package announced in early October was clearly well
received by analysts. However, the second adjustment
package had an opposite effect; it tended to worsen the
market’s perceptions of Hungarian sovereign risk. This was
further aggravated by the government’s conflicting
communication regarding the IMF negotiations as well as
the resultant negative analyst opinions.
4.1.2 fx Market trenDS
The EUR/HUF exchange rate mainly responded to global
sentiment over the past three months, and domestic events
are likely to have exerted a stronger impact only for short
periods. The exchange rate of the forint moved within a
relatively narrow band, between EUR/HUF 277 and EUR/
HUF 286 in the period. Regarding domestic events, it was
mainly the news of the measures aimed at reducing the
deficit announced in early and mid-October and the related
communication that had a significant impact. At that
juncture, there was a shift in the positive direction in the
exchange rate of the forint relative to the Polish zloty
serving as a benchmark; in early November, the two
currencies started to move closely with each other again.
Although the market continued to respond to news about
the IMF negotiations, it only triggered smaller swings in the
forint exchange rate. In addition, Hungary’s downgrading in
late November also only had a temporary impact on the
EUR/HUF exchange rate; likewise, worse-than-expected
Chart 4-2
factors of domestic 5-year sovereign credit default swap premia
200250300350400450500550600650700750
−350−300−250−200−150−100−50
050
100
2 Ja
n. 1
218
Jan
. 12
3 Fe
b. 1
221
Feb
. 12
8 M
ar.
1226
Mar
. 12
11 A
pr.
1227
Apr
. 12
15 M
ay 1
231
May
12
18 J
une
124
July
12
20 J
uly
127
Aug
. 12
23 A
ug.
1210
Sep
. 12
26 S
ep.
1212
Oct
. 12
30 O
ct.
1215
Nov
. 12
3 D
ec.
12
Basis pointsBasis points
External componentCountry-specific componentHungarian CDS spread (right-hand scale)
Note: For a description of the employed decomposition methodology, see Kocsis and Nagy (2011), A decomposition of sovereign CDS premia, MNB Bulletin, October.
Chart 4-3
Changes in 5-year CDS premia in the region
−250−150−5050
150250350450550
−250−150−5050
150250350450550
Hun
gary
Cro
atia
Rom
ania
Bulg
aria
Cze
ch R
epub
lic
Pola
nd
Rus
sia
Slov
enia
Basis pointsBasis points
CDS spread(12 December)Change since 17 September
Chart 4-4
premia on 5-year eur-denominated bonds in the region
50100150200250300350400
100200300400500600700800900
1,000
1 Se
p. 1
123
Sep
. 11
17 O
ct.
118
Nov
. 11
30 N
ov.
1122
Dec
. 11
13 J
an.
126
Feb.
12
28 F
eb.
1221
Mar
. 12
12 A
pr.
124
May
12
28 M
ay 1
219
Jun
e 12
11 J
uly
122
Aug
. 12
24 A
ug.
1217
Sep
. 12
9 O
ct.
1231
Oct
. 12
22 N
ov.
12
Basis pointsBasis points
HungaryRomaniaPoland (right-hand scale)
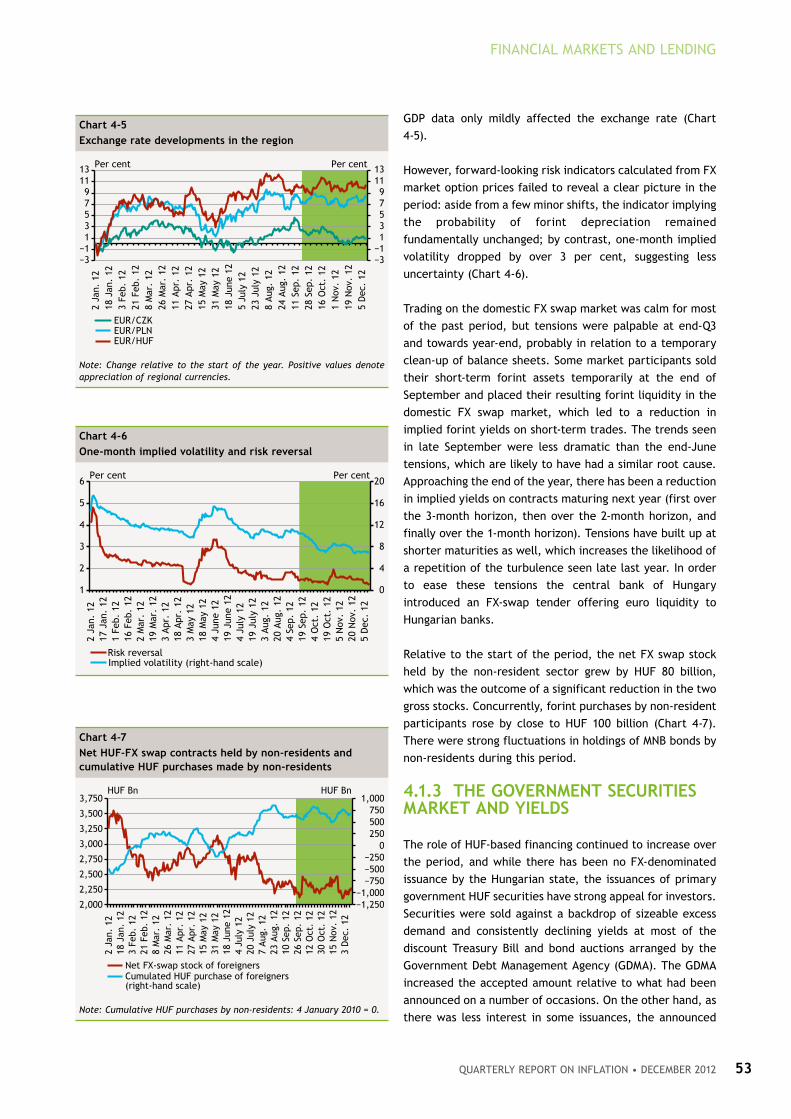
Quarterly report on inflation • december 2012 53
FINANCIAL MARKETS AND LENDING
GDP data only mildly affected the exchange rate (Chart
4-5).
However, forward-looking risk indicators calculated from FX
market option prices failed to reveal a clear picture in the
period: aside from a few minor shifts, the indicator implying
the probability of forint depreciation remained
fundamentally unchanged; by contrast, one-month implied
volatility dropped by over 3 per cent, suggesting less
uncertainty (Chart 4-6).
Trading on the domestic FX swap market was calm for most
of the past period, but tensions were palpable at end-Q3
and towards year-end, probably in relation to a temporary
clean-up of balance sheets. Some market participants sold
their short-term forint assets temporarily at the end of
September and placed their resulting forint liquidity in the
domestic FX swap market, which led to a reduction in
implied forint yields on short-term trades. The trends seen
in late September were less dramatic than the end-June
tensions, which are likely to have had a similar root cause.
Approaching the end of the year, there has been a reduction
in implied yields on contracts maturing next year (first over
the 3-month horizon, then over the 2-month horizon, and
finally over the 1-month horizon). Tensions have built up at
shorter maturities as well, which increases the likelihood of
a repetition of the turbulence seen late last year. In order
to ease these tensions the central bank of Hungary
introduced an FX-swap tender offering euro liquidity to
Hungarian banks.
Relative to the start of the period, the net FX swap stock
held by the non-resident sector grew by HUF 80 billion,
which was the outcome of a significant reduction in the two
gross stocks. Concurrently, forint purchases by non-resident
participants rose by close to HUF 100 billion (Chart 4-7).
There were strong fluctuations in holdings of MNB bonds by
non-residents during this period.
4.1.3 the GovernMent SeCurItIeS Market anD yIelDS
The role of HUF-based financing continued to increase over
the period, and while there has been no FX-denominated
issuance by the Hungarian state, the issuances of primary
government HUF securities have strong appeal for investors.
Securities were sold against a backdrop of sizeable excess
demand and consistently declining yields at most of the
discount Treasury Bill and bond auctions arranged by the
Government Debt Management Agency (GDMA). The GDMA
increased the accepted amount relative to what had been
announced on a number of occasions. On the other hand, as
there was less interest in some issuances, the announced
Chart 4-5
exchange rate developments in the region
EUR/CZKEUR/PLNEUR/HUF
−3−113579
1113
−3−113579
1113
2 Ja
n. 1
218
Jan
. 12
3 Fe
b. 1
221
Feb
. 12
8 M
ar.
1226
Mar
. 12
11 A
pr.
1227
Apr
. 12
15 M
ay 1
231
May
12
18 J
une
125
July
12
23 J
uly
128
Aug
. 12
24 A
ug.
1211
Sep
. 12
28 S
ep.
1216
Oct
. 12
1 N
ov.
1219
Nov
. 12
5 D
ec.
12
Per cent Per cent
Note: Change relative to the start of the year. Positive values denote appreciation of regional currencies.
Chart 4-6
one-month implied volatility and risk reversal
0
4
8
12
16
20
1
2
3
4
5
6
2 Ja
n. 1
217
Jan
. 12
1 Fe
b. 1
216
Feb
. 12
2 M
ar.
1219
Mar
. 12
3 Apr
. 12
18 A
pr.
123
May
12
18 M
ay 1
24
June
12
19 J
une
124
July
12
19 J
uly
123
Aug
. 12
20 A
ug.
124
Sep.
12
19 S
ep.
124
Oct
. 12
19 O
ct.
125
Nov
. 12
20 N
ov.
125
Dec
. 12
Per centPer cent
Risk reversalImplied volatility (right-hand scale)
Chart 4-7
net huf-fx swap contracts held by non-residents and cumulative huf purchases made by non-residents
−1,250−1,000
−750−500−250
0250500750
1,000
2,000
2,250
2,500
2,750
3,000
3,250
3,500
3,750
2 Ja
n. 1
218
Jan
. 12
3 Fe
b. 1
221
Feb
. 12
8 M
ar.
1226
Mar
. 12
11 A
pr.
1227
Apr
. 12
15 M
ay 1
231
May
12
18 J
une
124
July
12
20 J
uly
127
Aug
. 12
23 A
ug.
1210
Sep
. 12
26 S
ep.
1212
Oct
. 12
30 O
ct.
1215
Nov
. 12
3 D
ec.
12
HUF BnHUF Bn
Net FX-swap stock of foreignersCumulated HUF purchase of foreigners (right-hand scale)
Note: Cumulative HUF purchases by non-residents: 4 January 2010 = 0.
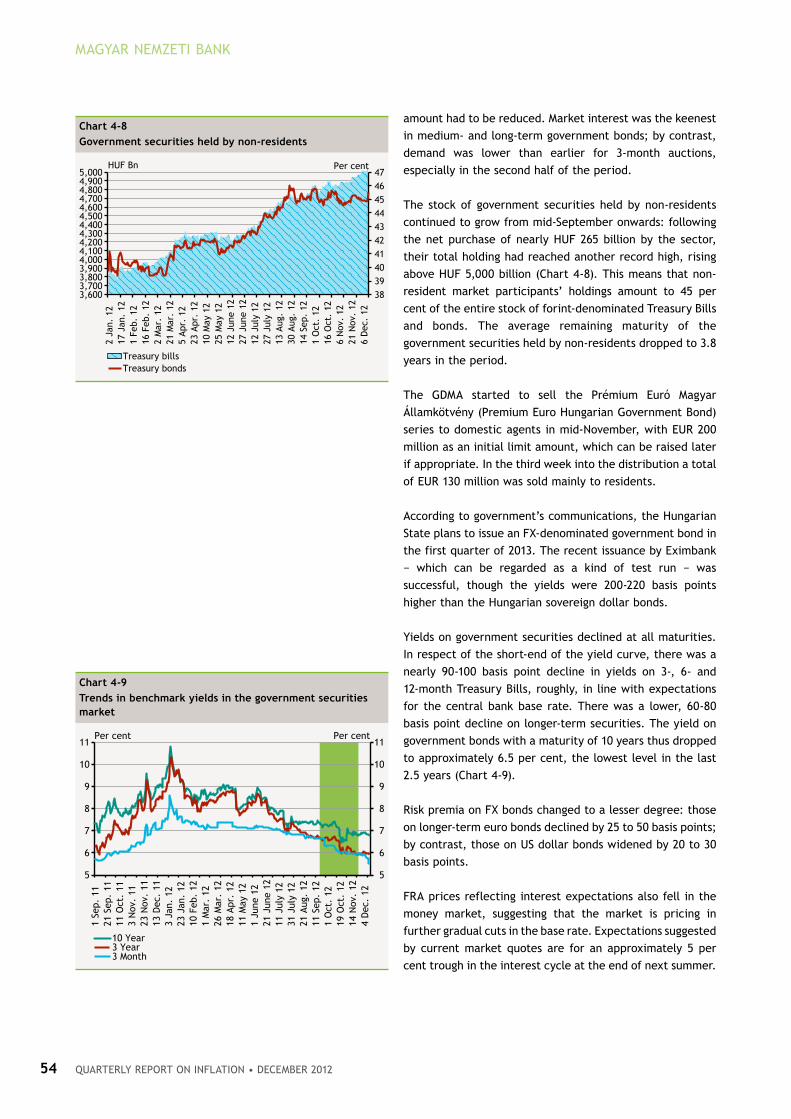
MAGYAR NEMZETI BANK
QuARTERlY REpoRT oN INflATIoN • dEcEMBER 201254
amount had to be reduced. Market interest was the keenest
in medium- and long-term government bonds; by contrast,
demand was lower than earlier for 3-month auctions,
especially in the second half of the period.
The stock of government securities held by non-residents
continued to grow from mid-September onwards: following
the net purchase of nearly HUF 265 billion by the sector,
their total holding had reached another record high, rising
above HUF 5,000 billion (Chart 4-8). This means that non-
resident market participants’ holdings amount to 45 per
cent of the entire stock of forint-denominated Treasury Bills
and bonds. The average remaining maturity of the
government securities held by non-residents dropped to 3.8
years in the period.
The GDMA started to sell the Prémium Euró Magyar
Államkötvény (Premium Euro Hungarian Government Bond)
series to domestic agents in mid-November, with EUR 200
million as an initial limit amount, which can be raised later
if appropriate. In the third week into the distribution a total
of EUR 130 million was sold mainly to residents.
According to government’s communications, the Hungarian
State plans to issue an FX-denominated government bond in
the first quarter of 2013. The recent issuance by Eximbank
− which can be regarded as a kind of test run − was
successful, though the yields were 200-220 basis points
higher than the Hungarian sovereign dollar bonds.
yields on government securities declined at all maturities.
In respect of the short-end of the yield curve, there was a
nearly 90-100 basis point decline in yields on 3-, 6- and
12-month Treasury Bills, roughly, in line with expectations
for the central bank base rate. There was a lower, 60-80
basis point decline on longer-term securities. The yield on
government bonds with a maturity of 10 years thus dropped
to approximately 6.5 per cent, the lowest level in the last
2.5 years (Chart 4-9).
Risk premia on FX bonds changed to a lesser degree: those
on longer-term euro bonds declined by 25 to 50 basis points;
by contrast, those on US dollar bonds widened by 20 to 30
basis points.
FRA prices reflecting interest expectations also fell in the
money market, suggesting that the market is pricing in
further gradual cuts in the base rate. Expectations suggested
by current market quotes are for an approximately 5 per
cent trough in the interest cycle at the end of next summer.
Chart 4-8
Government securities held by non-residents
38
39
40
41
42
43
44
45
46
47
3,6003,7003,8003,9004,0004,1004,2004,3004,4004,5004,6004,7004,8004,9005,000
2 Ja
n. 1
217
Jan
. 12
1 Fe
b. 1
216
Feb
. 12
2 M
ar.
1221
Mar
. 12
5 Apr
. 12
23 A
pr.
1210
May
12
25 M
ay 1
212
Jun
e 12
27 J
une
1212
Jul
y 12
27 J
uly
1213
Aug
. 12
30 A
ug.
1214
Sep
. 12
1 O
ct.
1216
Oct
. 12
6 N
ov.
1221
Nov
. 12
6 D
ec.
12
Per centHUF Bn
Treasury billsTreasury bonds
Chart 4-9
trends in benchmark yields in the government securities market
5
6
7
8
9
10
11
5
6
7
8
9
10
11
1 Se
p. 1
121
Sep
. 11
11 O
ct.
113
Nov
. 11
23 N
ov.
1113
Dec
. 11
3 Ja
n. 1
223
Jan
. 12
10 F
eb.
121
Mar
. 12
26 M
ar.
1218
Apr
. 12
11 M
ay 1
21
June
12
21 J
une
1211
Jul
y 12
31 J
uly
1221
Aug
. 12
11 S
ep.
121
Oct
. 12
19 O
ct.
1214
Nov
. 12
4 D
ec.
12
Per centPer cent
10 Year3 Year3 Month

Quarterly report on inflation • december 2012 55
FINANCIAL MARKETS AND LENDING
The regulation governing the ban on uncovered European sovereign CDS positions entered into force in the EU on 1 November 2012.
The overall purpose of the EU regulation is to harmonise at a community level the measures taken by the individual member states by
means of a consolidated and consistent regulatory framework. The regulation bans uncovered short-term share and sovereign bond
deals as well as CDS transactions concluded for purposes other than hedging.
What are the most important issues governed by the regulation?
• It standardises the definition of short and long positions in shares and sovereign bonds.
• It defines the meaning of uncovered positions in the case of sovereign CDS.
• It stipulates a reporting obligation for sizeable net short positions in shares and sovereign bonds.
• It imposes limitations on uncovered short-term share and sovereign bond deals and CDS transactions.
• It designates the authorities with competence in respect of the measures set out in the regulation and sets out the remit of
interventions by the individual authorities and the European Securities Markets Authority (ESMA).
• It identifies the participants and situations exempt from the ban (market makers, primary market operations and securities the
principal market of which is outside the EU) as well as the guidelines according to which the individual authorities can decide on a
temporary suspension of limitations.
Before the regulation entered into force, the obligation to unwind existing positions had already significantly reduced premia (the
CEEMEA SovX6 had dropped from 240 basis points to 180 basis points by late October; the reduction was due mostly to a sharp fall in
the premia for the EU member states affected by the regulation). Some experts expected distortions in pricing in respect of the period
after 1 November as a response to the drying-up of the market. An increasingly large number of analyses pointed out that that CDS
premia on EU sovereigns had become a less reliable-than-earlier measure of risk perceptions.
In addition to more optimistic market sentiment, this recently adopted regulation has also contributed to a marked fall in the CDS
premia of the CEE member states of the EU over the short term. Hungary’s risk premia declined by 185 basis points in September and
October, in line with regional trends: in Romania and Croatia, where premia were similar to Hungary’s, they fell by 185 and 200 basis
points, respectively.
This reduction in the premia of the region came to a halt by the second half of October, and the CDS premia of the CEE member states
of the EU started to move closely with premia in other regions again.
However, this materialised slightly differently in Hungary: CDS premia for Hungary rose to 320 basis points by mid-November, and then
started to fall gradually, moving in line with the CDS premia in other countries in the region. Such temporary departure from regional
trends and the CDS decomposition methodology intending to quantify it (see Chart 4-2) probably suggest that the increase can be
attributed country-specific factors rather than adjustments for an earlier technical impact.
Box 4-1
Impact of the regulation governing uncovered european sovereign CDS deals on CDS premia
6 CEEMEA SovX is a composite index derived from the 15 most liquid sovereign credit default swaps for emerging Europe, the Middle East and Africa.

Quarterly report on inflation • december 201256
4.2.1 CreDIt ConDItIonS of Corporate loanS
Based on transactions, the interest rate on corporate forint
loans smoothed by the 3-month moving average declined
from 9.8 per cent in July to 9.3 per cent in October (Chart
4-10). This took place in parallel with a similar decline in
the interbank rate (3-month BUBOR). Following the rise
observed during 2012, the smoothed spread over the
interbank rate slightly declined in the autumn, from 2.6
percentage points to 2.5 percentage points (Chart 4-11),
which is the average level of the past two years.
In the case of EUR-denominated loans, the interest rate
level declined slightly, from 3.5 per cent to 3.4 per cent. In
the meantime, the interbank rate (3-month EURIBOR) fell to
a greater extent, and thus the interest rate spread
increased to 3.1 percentage points by October (Chart 4-11).
According to the Lending Survey, corporate credit conditions
tightened further in 2012 Q3. A net 22 per cent of banks8
indicated tightening, in relation to a wide range of conditions.
Similarly to the survey of the previous quarter, responding
banks mainly cited unfavourable economic prospects and
industry-specific problems as factors contributing to
tightening. Based on banks’ responses, no further tightening
is expected in corporate credit conditions in the coming half
year. However, no easing can be expected either, so the
current tight conditions may continue to prevail.
4.2 Interest rate conditions in the financial intermediary system
According to the Lending Survey,7 in the household segment a further adjustment took place following broad-based
tightening, while tightening continued in the corporate segment. Interest rates on HUF-denominated corporate loans
declined markedly, whereas those on EUR loans declined slightly between July and October 2012, but due to strict non-
price conditions, only a narrower range of companies may benefit from the more favourable forint interest rates. Within
the household segment, only the annual percentage rate of charge (APR) on housing mortgage loans dropped, while the
interest rate and the interest rate spread remain at high levels. The APR on home equity loans did not change in the past
quarter, while an increase was observed in the case of unsecured consumer loans. The one-year real interest rate dropped
to a historical low as a result of the decline in government securities yields and deposit rates as well as of an increase in
inflation expectations.
Chart 4-10
Interest rates on corporate loans by denomination
0
2
4
6
8
10
12
14
16
0
2
4
6
8
10
12
14
16
2005 2006 2007 2008 2009 2010 2011 2012
Per centPer cent
Interest rate of HUF-denominated loansInterest rate of EUR-denominated loans
7 http://english.mnb.hu/Root/Dokumentumtar/ENMNB/Penzugyi_stabilitas/hitelezesi_felmeres/201211/SLO_201211_en.pdf8 The difference between tightening and easing banks weighted by market share. The ratio does not show the magnitude of tightening/easing.

Quarterly report on inflation • december 2012 57
FINANCIAL MARKETS AND LENDING
Both the Lending Survey and the interest rate statistics of
transactions carried out are needed for the assessment of
enterprises’ credit market circumstances. The Lending
Survey shows developments in credit supply constraints,
which determine whether the given company is creditworthy,
whereas the interest rate statistics contain the conditions
for companies that proved to be creditworthy. Overall, due
to the tight credit conditions, only a narrower range of
enterprises may benefit from the more favourable interest
rates.
4.2.2 CreDIt ConDItIonS of houSeholD loanS
In the case of housing mortgage loan transactions, the
annual percentage rate of charge (APR) smoothed by the
three-month moving average declined somewhat compared
to the previous quarter, from 12.1 per cent in July to 11.8
per cent (Chart 4-12). The interest rate spread and interest
rate of traditional commercial bank transactions (excluding
home savings and loan associations), which have a significant
weight in new lending, are roughly 1 percentage point
higher than that. In parallel with a decline in the reference
interest rate, the interest rate spread over the BUBOR
remained unchanged at around 5 percentage points (Chart
4-13). It may have played a significant role in the decline in
the interest rate that since the introduction of transparent
pricing the schemes tied to a reference interest rate
represent a considerable weight in new lending.
Nevertheless, interest rates and interest rate spreads are at
historically high levels. In the case of housing loans, the
state interest rate subsidy may result in some decline in the
high interest rate level. Accordingly, the client’s interest
burden may be around 8–9 per cent for five years.9
Within consumer loans, no decline was perceived in the
case of home equity loans; the APR continues to be around
the level of 15 per cent. The declining reference interest
rate was offset by an increase in the spread, which
exceeded 8 percentage points. This behaviour, which is
different from that of housing loans, may be attributable to
the very strong concentration typical of the segment.
Following a decline in 2012 Q2, smoothed APR data on
unsecured consumer loans increased slightly, from 27.7 per
cent in June to 28.6 per cent in October. The increase was
mainly attributable to hire purchase loans.
In the Lending Survey, nearly a net 20 per cent of banks
reported that they had eased credit conditions of housing
Chart 4-11
Interest rate spreads on corporate loans by denomination
−1.0−0.50.00.51.01.52.02.53.03.54.0
−1.0−0.50.00.51.01.52.02.53.03.54.0
2005 2006 2007 2008 2009 2010 2011 2012
Per centPer cent
Interest rate spread of euro-denominated loansDeposit rate spread of euro-denominated loansInterest rate spread of HUF-denominated loansDeposit rate spread of HUF-denominated loans
Note: The spread on the moving average of the 3-month BUBOR and EURIBOR, respectively. Source: MNB.
Chart 4-12
annual percentage rate (apr) on forint-based housing and consumer loans
5
10
15
20
25
30
35
5
10
15
20
25
30
35
2005 2006 2007 2008 2009 2010 2011 2012
Per cent
Home equity loans
Housing loans
Other (unsecured) loans
Housing loans (excl. HSLA)
Per cent
Note: Interest rates smoothed by the 3-month moving average. HSLA stands for home savings and loan associations. Prior to 2009 HUF-denominated mortgage lending was marginal. Source: MNB.
Chart 4-13
Interest rate spreads over the 3-month BuBor
−2
0
2
4
6
8
10
−2
0
2
4
6
8
10
2005 2006 2007 2008 2009 2010 2011 2012
Per centPer cent
Home equity loans
Housing loans
Deposit
Housing loans (excl. HSLA)
Note: Spreads smoothed by the 3-month moving average. HSLA stands for home savings and loan associations. Prior to 2009 HUF-denominated mortgage lending was marginal. Source: MNB.
9 It is important to mention that the future upswing in the interest rate subsidy will only be seen in the volume of new lending; it will not appear in the interest rate levels reported by banks, because they report the interest rates together with the interest rate subsidy to the MNB.

MAGYAR NEMZETI BANK
QuARTERlY REpoRT oN INflATIoN • dEcEMBER 201258
loans and 9 per cent in the case of consumer loans in 2012
Q3. Accordingly, adjustment continued following the
tightening observed at end-2011. Based on expectations for
the coming half year, further adjustment may only take
place in consumer loans.
4.2.3 DevelopMentS In real IntereSt rateS
Since the previous Quarterly Report on Inflation, the one-
year real interest rate calculated on the basis of government
securities yields declined considerably, from 2.6 per cent in
July 2012 to 1.4 per cent in October (Chart 4-15). The
change was partly attributable to the continuing decrease
in the one-year government securities yield, and partly to
an increase in inflation expectations. The real interest rate
calculated from deposit rates with maturities of up to one
year also declined from 2.3 per cent to 1.4 per cent in the
period under review. The October level of the real interest
rate can be considered historically low.
Chart 4-14
Changes in credit conditions in the household segment
−80−60−40−20
020406080
100
−80−60−40−20
020406080
100
05 H
1
06 H
2
08 H
1
09 Q
2
10 Q
1
10 Q
4
11 Q
3
12 Q
2
06 H
1
07 H
2
09 Q
1
09 Q
4
10 Q
3
11 Q
2
12 Q
1
13 Q
1 (e
.)
Housing loans Consumer loans
Per centPer cent
TIG
HTEN
ING
LOO
SEN
ING
Note: Net percentage balance of respondents reporting tightening/easing credit conditions weighted by market share.Source: MNB Lending Survey based on banks’ responses.
Chart 4-15
forward-looking real interest rates
−1
0
1
2
3
4
5
6
7
8
−1
0
1
2
3
4
5
6
7
8
2005 2006 2007 2008 2009 2010 2011 2012
Per centPer cent
1-year real interest rate based on deposit rates**1-year real interest rate based on zero coupon yield*
* Based on the one-year forward-looking inflation expectations of analysts calculated by the MNB using the 1-year zero coupon yields and the Reuters poll. ** Based on one-year forward-looking inflation expectations of analysts calculated by the MNB using bank deposit rates with maturity up to 1 year (corporate and household weighted) and the Reuters poll.

Quarterly report on inflation • december 2012 59
5.1.1 DevelopMentS In the external BalanCe of hunGary
The external financing capacity of the Hungarian economy
rose to a historic peak (3.6 per cent of GDP) in 2012 Q2, and
according to our preliminary data the increase in the trade
surplus may have continued in Q3 as well. This increase was
mainly attributable to the growing surplus on the balance of
goods and services, while the slightly higher deficit on the
income balance was offset by a marginally higher surplus on
the transfer balance (Chart 5-1).
The improvement in the balance of goods and services
continued to reflect the duality that is typical of the
Hungarian economy. Weak domestic demand (consumption
and investment) resulted in low imports, while − partly as a
result of the pick-up in automotive production − the growth
rate of exports slightly exceeded that of imports, despite
the slowdown in external economic activity.
At the same time, the inflow of EU transfers fell short of our
expectations. In H1, a mere EUR 1.2 billion appeared on the
transfer balance, compared to EUR 1.5 billion in the same
period last year. The lower inflow represents a risk in terms
of the fulfilment of our forecast for the external financing
capacity of the economy, as we expect higher EU transfer
inflows for this year compared to last year.
5 Balance position of the economy
5.1 external balance and financing
The external financing capacity of the Hungarian economy continued to increase in 2012 Q2. The increase was mainly
attributable to the growing surplus on the balance of goods and services, while the lower-than-expected inflow of EU
transfers was reflected in the more moderate increase in the transfer balance. Our preliminary data suggest that the
increase in the external surplus may have continued in Q3 as well. In parallel with the massive external financing surplus,
the outflow of foreign funds continued. In the last quarters the decline in debt type liabilities was mainly related to the
banking sector. As a result of the outflow of funds, by the end of Q2, Hungary’s gross and net external debt indicators
declined to the level observed immediately prior to the crisis.
Chart 5-1
Changes in external financing capacity
(seasonally adjusted values; as a proportion of GDP)
−10
−8
−6
−4
−2
0
2
4
6
8
10
12
−10
−8
−6
−4
−2
0
2
4
6
8
10
12
2006 2007 2008 2009 2010 2011 2012
Per cent Per cent
Balance of goods and servicesIncome balanceTransfer balanceExternal financing capacity
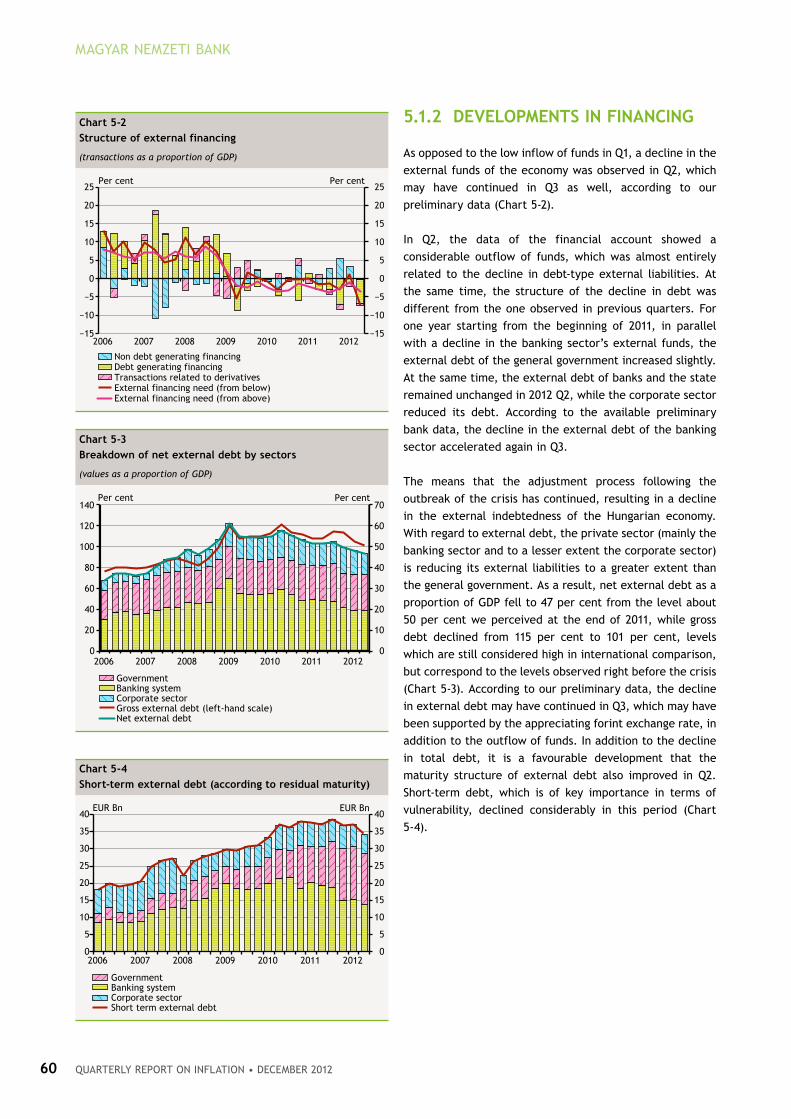
MAGYAR NEMZETI BANK
QuARTERlY REpoRT oN INflATIoN • dEcEMBER 201260
5.1.2 DevelopMentS In fInanCInG
As opposed to the low inflow of funds in Q1, a decline in the
external funds of the economy was observed in Q2, which
may have continued in Q3 as well, according to our
preliminary data (Chart 5-2).
In Q2, the data of the financial account showed a
considerable outflow of funds, which was almost entirely
related to the decline in debt-type external liabilities. At
the same time, the structure of the decline in debt was
different from the one observed in previous quarters. For
one year starting from the beginning of 2011, in parallel
with a decline in the banking sector’s external funds, the
external debt of the general government increased slightly.
At the same time, the external debt of banks and the state
remained unchanged in 2012 Q2, while the corporate sector
reduced its debt. According to the available preliminary
bank data, the decline in the external debt of the banking
sector accelerated again in Q3.
The means that the adjustment process following the
outbreak of the crisis has continued, resulting in a decline
in the external indebtedness of the Hungarian economy.
With regard to external debt, the private sector (mainly the
banking sector and to a lesser extent the corporate sector)
is reducing its external liabilities to a greater extent than
the general government. As a result, net external debt as a
proportion of GDP fell to 47 per cent from the level about
50 per cent we perceived at the end of 2011, while gross
debt declined from 115 per cent to 101 per cent, levels
which are still considered high in international comparison,
but correspond to the levels observed right before the crisis
(Chart 5-3). According to our preliminary data, the decline
in external debt may have continued in Q3, which may have
been supported by the appreciating forint exchange rate, in
addition to the outflow of funds. In addition to the decline
in total debt, it is a favourable development that the
maturity structure of external debt also improved in Q2.
Short-term debt, which is of key importance in terms of
vulnerability, declined considerably in this period (Chart
5-4).
Chart 5-2
Structure of external financing
(transactions as a proportion of GDP)
−15
−10
−5
0
5
10
15
20
25
−15
−10
−5
0
5
10
15
20
25
2006 2007 2008 2009 2010 2011 2012
Per centPer cent
Non debt generating financingDebt generating financingTransactions related to derivativesExternal financing need (from below)External financing need (from above)
Chart 5-3
Breakdown of net external debt by sectors
(values as a proportion of GDP)
0
10
20
30
40
50
60
70
0
20
40
60
80
100
120
140
2006 2007 2008 2009 2010 2011 2012
Per centPer cent
GovernmentBanking systemCorporate sectorGross external debt (left-hand scale)Net external debt
Chart 5-4
Short-term external debt (according to residual maturity)
0
5
10
15
20
25
30
35
40
0
5
10
15
20
25
30
35
40
2006 2007 2008 2009 2010 2011 2012
EUR BnEUR Bn
GovernmentBanking systemCorporate sectorShort term external debt

Quarterly report on inflation • december 2012 61
The external financing capacity of the Hungarian economy
may continue to increase this year, and this process may
continue in the coming two years as well. At the same time,
compared to the September issue of the Quarterly Report
on Inflation, our expectations concerning the improvement
in Hungary’s external balance position in 2012 have declined
somewhat, due mainly to the change in the transfer
balance.
The surplus of goods and services increased this year to
around 8 per cent as a proportion of GDP and may continue
to grow in the coming years, reflecting − in addition to the
still weak domestic demand factors and the growing
external demand − the export-increasing effect of the
automotive investment projects that are launching
production (Chart 5-5).
Although this year’s inflows of EU transfers were well below
our expectations and this reduced our forecast as well, the
transfer balance may continue to significantly contribute to
the high financing surplus in the coming years.10 As a result
of the expected persistently low international interest rate
environment and the declining external debt, no major
change is expected in the deficit on the income balance
until end-2014.
Examining the developments in the external balance
through the changes in the savings of domestic sectors, it
can be concluded that in 2012 and 2013 the continued
5.2 forecast for hungary’s external balance position
The external financing capacity of Hungary may continue to rise in the coming years, which is mainly attributable to the
steadily growing surplus on the balance of goods and services. Following the increase, the growth in Hungary’s external
financing capacity may stop at around 7 per cent in 2014. It is primarily the further increase in the savings of the corporate
sector which will contribute to the high external financing capacity. Households’ savings will decline marginally, and the
low deficit of the general government this year may increase in 2013, which may be followed by a stagnation in 2014. If
our forecast is fulfilled, the external financing capacity of Hungary may be among the highest in the European Union in
2013 and 2014, and at the same time Hungary may prove to be one of the Member States that achieves the largest
improvement compared to the pre-crisis level. Hungary’s growing external surplus is also reflected in the expected
improvement in the country’s external debt and liability indicators.
Chart 5-5
Changes in external financing capacity
(as a proportion of GDP)
−12−10−8−6−4−202468
10121416
−12−10−8−6−4−202468
10121416
2004 2005 2006 2007 2008 2009 2010 2011 2012 2013 2014
Per centPer cent
Balance of goods and servicesIncome balanceTransfer balance*External position (current and capital account)External position (from financing side)
Note: The sum of the balance of the current transfers and the capital account balance.
10 At the same time, a declining transfer balance is expected for 2014, mainly due to the beginning of the new EU budget period.

MAGYAR NEMZETI BANK
QuARTERlY REpoRT oN INflATIoN • dEcEMBER 201262
increase in Hungary’s external surplus is primarily
determined by the rising savings of the corporate sector,
while households’ savings declined slightly, and the financing
requirement of the general government may increase to a
lesser extent in 2013.11 We expect stabilising developments
for 2014: without further measures, the general government
SNA-type deficit may remain stable, while we do not expect
significant change in the net savings position of the
household and corporate sector (Chart 5-6).
According to the European Commission’s autumn forecast,
as a result of the continued improvement in Hungary’s
external balance position, following the Netherlands,
Hungary will have the highest net financing capacity by
2014. In addition, examining the developments over a
longer period of time, it can also be concluded that among
the EU Member States the most significant external balance
improvement compared to the pre-crisis level is also
expected to take place in Hungary. At the same time, it is
also important to add that the improvement in the external
balance position was also coupled with a considerable drop
in domestic demand (Chart 5-7).
The growing external surplus also results in a decline in
stock indicators.12 According to our forecast, both Hungary’s
external liabilities and, within that, Hungary’s external debt
may decline considerably in the coming years. By end-2013,
Hungary’s net external debt, which is extremely high in
international comparison at present, may sink close to 35
per cent of GDP, i.e. close to the European average.
However, it still exceeds the average of countries at a
similar level of development. The decline in Hungary’s
external indebtedness continues to be mainly attributable
to the continued adjustment of the private sector (banking
system and corporate sector) (Chart 5-8).
Chart 5-6
Changes in financing capacities of sectors
(as a proportion of GDP)
−14−12−10−8−6−4−202468
1012
−14−12−10−8−6−4−202468
1012
2004 2005 2006 2007 2008 2009 2010 2011 2012 2013 2014
Per centPer cent
Augmented SNA-balance*Household sector**CorporationsExternal position (current and capital account)External position (from financing side)
* In addition to the central government, the augmented general government includes local governments, ÁPV Ltd., institutions discharging quasi-fiscal duties (MÁV, BKV), the MNB and authorities implementing capital projects initiated and controlled by the government but formally implemented under PPP schemes. The augmented SNA deficit takes into account private pension savings. ** Net financing capacity of households consistent with the SNA deficit does not contain the pension savings of those who return to the public pension system. The official financing capacity (shown in the financial account) is different from the data in the chart.
Chart 5-7
pre-crisis financing capacity and the changes in external financing capacity expected in the coming years in eu Member States
(as a proportion of GDP; averages of 2003−2007 and 2012−2014)
BE
DEEE IE
EL
ES FRIT
CY
LUMT
NL
ATPT
SISK
FIBGCZ
DK
LV LT
HU
PLRO
SE
UK
−15
−10
−5
0
5
10
15
−15 −10 −5 0 5 10 15
Average net lending 2012−2014 as a proportion of GDP
Net lending before the crisis (average of 2003−2007, as a proportion of GDP)
Improvingnet lending
Deterioratingnet lending
11 The financing position of the general government and the private sector was affected by a number of one-off factors in 2011. The statistical settlement of the private pension fund scheme, the disbursement of real yields, the VAT refunded to companies as a result of a European Court decision and the change in the personal income tax system all added to the private sector’s income, a considerable portion of which was channelled into savings.
12 In the past quarters, the cumulative error of the balance of payments (Net errors and omissions, NEO) declined considerably, as a result which our forecast for financing data also already indicates external fund outflows similar to the real economy forecast and thus a stronger-than-earlier decline in external liabilities and debt.
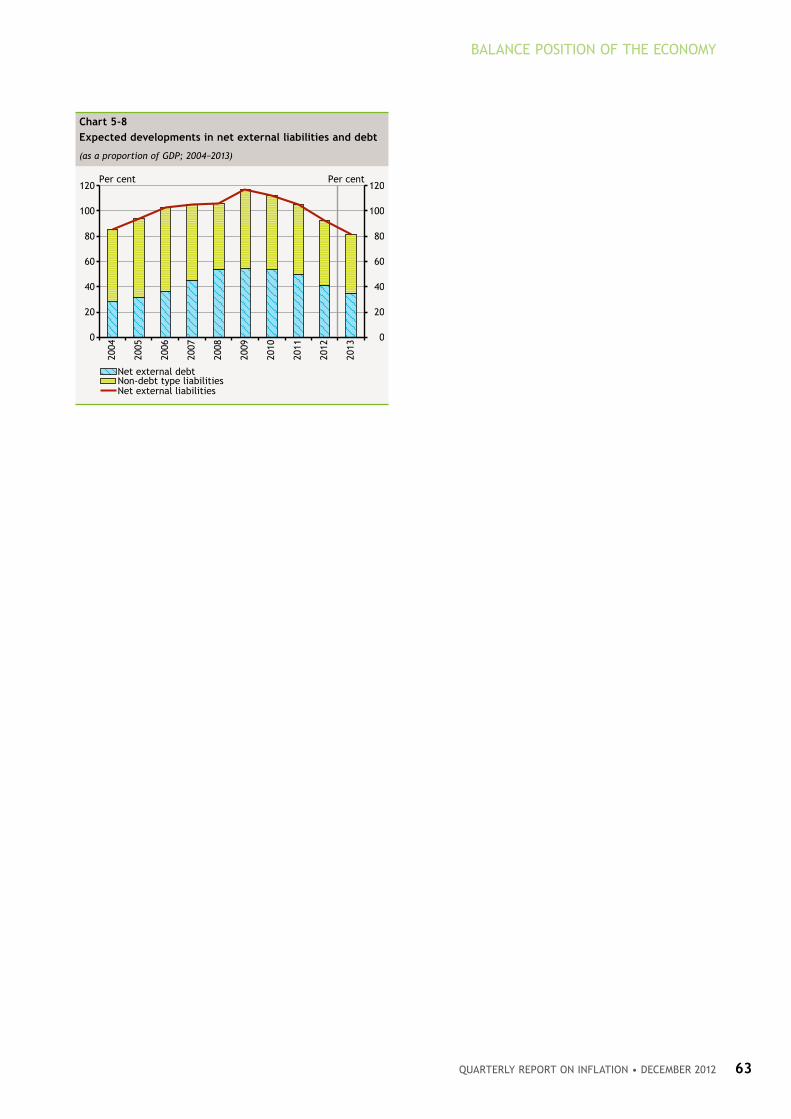
Quarterly report on inflation • december 2012 63
BALANCE POSITION OF THE ECONOMy
Chart 5-8
expected developments in net external liabilities and debt
(as a proportion of GDP; 2004−2013)
0
20
40
60
80
100
120
0
20
40
60
80
100
120
2004
2005
2006
2007
2008
2009
2010
2011
2012
2013
Per centPer cent
Net external debtNon-debt type liabilitiesNet external liabilities
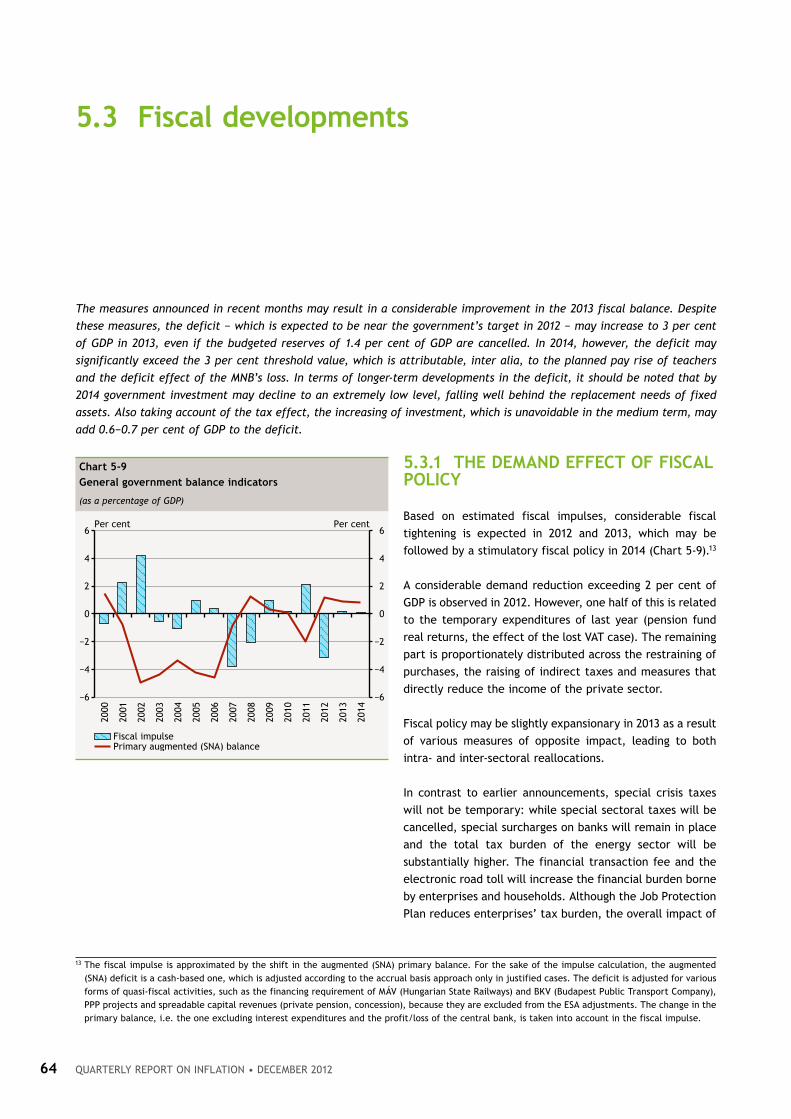
Quarterly report on inflation • december 201264
5.3.1 the DeManD effeCt of fISCal polICy
Based on estimated fiscal impulses, considerable fiscal
tightening is expected in 2012 and 2013, which may be
followed by a stimulatory fiscal policy in 2014 (Chart 5-9).13
A considerable demand reduction exceeding 2 per cent of
GDP is observed in 2012. However, one half of this is related
to the temporary expenditures of last year (pension fund
real returns, the effect of the lost VAT case). The remaining
part is proportionately distributed across the restraining of
purchases, the raising of indirect taxes and measures that
directly reduce the income of the private sector.
Fiscal policy may be slightly expansionary in 2013 as a result
of various measures of opposite impact, leading to both
intra- and inter-sectoral reallocations.
In contrast to earlier announcements, special crisis taxes
will not be temporary: while special sectoral taxes will be
cancelled, special surcharges on banks will remain in place
and the total tax burden of the energy sector will be
substantially higher. The financial transaction fee and the
electronic road toll will increase the financial burden borne
by enterprises and households. Although the Job Protection
Plan reduces enterprises’ tax burden, the overall impact of
5.3 fiscal developments
The measures announced in recent months may result in a considerable improvement in the 2013 fiscal balance. Despite
these measures, the deficit − which is expected to be near the government’s target in 2012 − may increase to 3 per cent
of GDP in 2013, even if the budgeted reserves of 1.4 per cent of GDP are cancelled. In 2014, however, the deficit may
significantly exceed the 3 per cent threshold value, which is attributable, inter alia, to the planned pay rise of teachers
and the deficit effect of the MNB’s loss. In terms of longer-term developments in the deficit, it should be noted that by
2014 government investment may decline to an extremely low level, falling well behind the replacement needs of fixed
assets. Also taking account of the tax effect, the increasing of investment, which is unavoidable in the medium term, may
add 0.6−0.7 per cent of GDP to the deficit.
Chart 5-9
General government balance indicators
(as a percentage of GDP)
−6
−4
−2
0
2
4
6
−6
−4
−2
0
2
4
6
2000
2001
2002
2003
2004
2005
2006
2007
2008
2009
2010
2011
2012
2013
2014
Per centPer cent
Fiscal impulsePrimary augmented (SNA) balance
13 The fiscal impulse is approximated by the shift in the augmented (SNA) primary balance. For the sake of the impulse calculation, the augmented (SNA) deficit is a cash-based one, which is adjusted according to the accrual basis approach only in justified cases. The deficit is adjusted for various forms of quasi-fiscal activities, such as the financing requirement of MÁV (Hungarian State Railways) and BKV (Budapest Public Transport Company), PPP projects and spreadable capital revenues (private pension, concession), because they are excluded from the ESA adjustments. The change in the primary balance, i.e. the one excluding interest expenditures and the profit/loss of the central bank, is taken into account in the fiscal impulse.

Quarterly report on inflation • december 2012 65
BALANCE POSITION OF THE ECONOMy
the measures announced in 2012 represent a tax increase
which will be reflected in the sectors expected revenue as
well. Fiscal policy will, at the same, increase household
income: in addition to the termination of the “half
supergrossing” of the personal income tax, high pension
indexation will also compensate the household sector for
the cancellation of the ceiling on employee pension
contributions.14
In 2014, fiscal policy may remain mildly expansionary., One
element of this is the increase of teachers’ salaries which is
expected to add 0.5 per cent of GDP to households’
disposable income in net terms.
5.3.2 DevelopMent of General GovernMent BalanCe InDICatorS
Our 2012 fiscal forecast has barely changed since September.
As a result of macroeconomic and fiscal developments and
the measures affecting this year (blocking), the deficit
declined to 2.7 per cent (Table 5-1).15
Deficit reducing measures in relation to 2013 were
announced in several steps in recent months. In addition,
we also re-estimated the effect of earlier measures.
Accordingly, our rule-based forecast improved by a total
HUF 319 billion, i.e. 1.1 per cent of GDP (Table 5-2).
The deficit reduction in 2013 is mainly attributable to
revenue-side measures which will either maintan or increase
enterprises’current taxes. At the same time, the net
(excluding tax content) impact of expenditures-side
measures is approximately zero. A temporary expenditure
reduction of 0.2 per cent of GDP is expected from delaying
14 The increase in pension benefits’ real value is attributable to the indexation prescribed in the budget act which exceeds the rate of inflation.15 The September Inflation Report assumed that − in line with the government’s declared intentions − a significant adjustment would take place in order
to reduce the 2013 deficit: our hypothetical scenario included, therefore, an adjustment equal to 1.4 per cent of GDP. The measures announced since September actually reduce the deficit by 1.1 per cent of GDP.
table 5-1
General government balance indicators
(as a percentage of GDP)
2012 2013 2014
ESA deficit 2.7 3.0 3.8
Augmented (SNA) deficit 2.9 3.5 3.6
Cyclical component (MNB) 0.4 0.5 0.4
Cyclically-adjusted augmented (SNA) balance 2.5 3.0 3.2
memo: ESA deficit in 2012 September inflation report, assuming hypothetical adjustment 2.8 2.4 n. a.
Note: Complete cancellation of the reserves serving the purpose of ensuring the balance target was assumed upon calculation of the balance indicators.
table 5-2
estimated effect of measures announced following publication of the September issue of the Quarterly report on Inflation
(HUF billion)
2013
1. Revenue increasing measure 1.3
2. Revenue reduction (gambling tax, lower excise tax increase) −0.2
3. Expenditure reduction (without tax and contribution content)* 0.2
4. Expenditure increasing measure (without tax and contribution content) −0.2
5. total (1+2−3+4) 1.1
* Of which HUF 73 billion is a temporary effect, because the pay rise of teachers will be implemented in the whole year 2014.

MAGYAR NEMZETI BANK
QuARTERlY REpoRT oN INflATIoN • dEcEMBER 201266
teachers’ salary increase, but this is offset by the permanent
increases in expenditures (e.g. pharmaceutical subsidies).
Regarding the planned and expected effects of the
measures, the greatest difference can be identified in
relation to the financial transaction tax and the efficiency
of tax collection.
In terms of its amount, the change in the financial
transaction duty is the measure that has the greatest
effect. Based on the analysis of micro data, total revenue
of HUF 197 billion is expected from the private sector,
whereas in the case of the Hungarian State Treasury the
total balance improving revenue is estimated to amount to
HUF 20 billion.
The budget expects significant revenue from improving the
efficiency of tax collection. Our rule-based forecast only
takes into account sufficiently detailed additional revenues
whose effect can be estimated, e.g. the reverse VAT to be
introduced.
In summary, the substantial revenue shortfall (in comparison
with the budget) may be offset by the National Protection
Fund, equal to 1.4 per cent of GDP. Our projections are
based on the assumption that these reserves will be
cancelled.
Our rule-based forecast is based on announcements made
so far and indicates that the 2014 deficit will be substantially
above 3 per cent of GDP. The government’s commitment to
reducing the deficit may indicate that further fiscal
measures can be expected in the future. The uncertainties
surrounding the size, composition and timing of such
measures, however, prevents us from incorporating a
hypothetical adjustment into our forecast.
The deterioration in the balance projected for 2014 is
primarily the result of teachers’ pay rises, the disappearance
of one-off property revenues (concession)16 and the
settlement of the central bank loss (see Box 5-1). The
balance is improved by the whole-year effect of the e-road
toll. A further decline in deficit amounting to 0.2 per cent
of GDP is caused by minor items, such as decreases in
housing subsidy, fare subsidy, EU payment and honouring of
guarantees. The decline in EU support is fully reflected by
the fall in material and investment expenditures.
16 We assumed that the concession related to the frequency will appear in 2013, instead of 2012.

Quarterly report on inflation • december 2012 67
BALANCE POSITION OF THE ECONOMy
As opposed to the surge in the ESA deficit in 2014, a gradual
deterioration is observed in developments in the augmented
(SNA) deficit and the cyclically adjusted SNA deficit.
Namely, these indicators show the 2013 central bank loss
already in 2013.
The level of the cyclically adjusted indicator is more
favourable, as it takes into account that the tax revenue
corresponding to 0.4−0.5 per cent of GDP will improve the
balance in the medium term. However, it does not contain
the additional expenditure that is unavoidable in the
medium term and stems from the fact that by 2014
investment will already fall short of the replacement need
of fixed assets by 1 per cent of GDP, and all this − also
taking account of the impact on taxes − may impair the
balance by 0.6−0.7 per cent.
Our forecast is surrounded by significant risks in 2013 and
2014. Unfavourable court decisions (communications sector
surtax) may result in additional expenditures, and additional
revenues may originate from an increase in the efficiency
of tax collection, where, as a rule, only the measures that
can be priced were taken into account.
5.3.3 expeCteD DevelopMent of puBlIC DeBt
Assuming that the current foreign exchange rate remains
flat on the forecast horizon, the public debt-to-GDP ratio
may decrease from 81.4 per cent at the end of last year to
77 per cent in 2012, mainly due to the appreciation of HUF
exchange rate. Regardless of the 3 per cent deficit in 2013,
the debt ratio is not likely to continue to decrease, because
of the relatively modest growth in nominal GDP. Despite
assuming the cancellation of the free reserves in the budget
in each year, the deficit and growth forecast project a slight
increase of the debt ratio in 2014 (Chart 5-10).
Two factors have reduced the expected debt path since our
previous forecast. First, of the debt of local governments
with less than 5,000 inhabitants, the central government
intends to prepay HUF 100 billion in December 2012.
Second, the significant amount of foreign currency
borrowing planned for 2012 did not take place, and the
foreign currency borrowing that fails to materialise is only
partly substituted by the introduction of the currency bond
for households and increased borrowing in forints.
Accordingly, both debt and the government’s financing
reserves may be lower than previously assumed.
One technical factor influencing this outlook is that we now
project the FX debt based on the current forint exchange
rate, which significantly lowered the level of public debt.
Chart 5-10
Gross public debt at constant, end-2011 exchange rate
(as a percentage of GDP)
50
55
60
65
70
75
80
85
50
55
60
65
70
75
80
85
2004 2005 2006 2007 2008 2009 2010 2011 2012 2013 2014
Per centPer cent
Assuming the use of all assets from pension fund portfolio and FX deposits of the government until 2013Assuming the use of no assets and deposits

MAGYAR NEMZETI BANK
QuARTERlY REpoRT oN INflATIoN • dEcEMBER 201268
On the other hand, the decrease in nominal GDP increased
the debt path over the entire forecast horizon.
The financing reserve available for the government
originates mainly from the unused portion of the IMF-EU
loan and the private pension fund portfolio; it declined in
the past period, and is also lower than previously expected
in our projection. This is partly attributable to the factors
that reduce debt as well, such as the currency bond issue
that will not take place and the partial prepayment of local
government debt. On the other hand, acquisition of the E.
ON Group’s natural gas industry interests will also reduce
reserves, which will not influence gross debt, but will limit
the assets available for debt reduction. Using the remaining
reserves, it will be possible to reduce government debt by
a further 2−2.5 per cent of GDP by the end of the period.
However, as a result of the increase in financing risks in the
crisis period, the raising of reserves is a more typical trend
in the neighbouring countries.
The significant rise in central bank losses expected to materialise
in 2013 will adversely affect the 2014 fiscal deficit. The central
bank’s P&L is mainly subject to monetary policy objectives and
selected instruments as well as domestic and global economic
trends. The objective of the MNB as set forth in the Central Bank
Act is to achieve price stability; therefore, in implementing
monetary policy, it cannot be driven by developments in central
bank P&L (Chart 5-11).
A rise in the losses incurred by the MNB is associated with the fact
that FX reserves have been rising steeply since the onset of the
crisis. In a global situation characterised by uncertainty at the
outbreak of the crisis Hungary was only able to finance itself with
the FX loan borrowed from the IMF/EU. As state expenditure was
denominated in forint, the state converted the foreign currency
it had received as a loan into forint with the MNB. As a result, FX
reserves grew on the asset side of the central bank’s balance
sheet and so did the state’s forint deposits on the liabilities side.
In response to disbursements by the state, liquidity rose in the economy. Banks channelled this increased liquidity to the MNB in the
form of two-week bills. Thus, the FX loan borrowed by the state led to an increase in central bank reserves and a rapid rise in the
stock of MNB bills. The increase in FX reserves was also in line with non-resident investors’ expectations stemming from a rise in the
country’s short-term external debt and increased distrust; but for such increased reserves, the economy could not have been financed
or only against the payment of much higher risk premia.
The reason why high FX reserves hurt interest income is that the central bank is paid euro interest on FX reserves, but it pays interest
on the MNB bills placed with it at the key policy rate, which is higher than the euro interest rate. A higher base rate was justified by
high risk premia charged due to the uncertainty surrounding Hungarian assets as well as the intention to achieve the inflation target.
Box 5-1
expected trends in central bank p&l
Chart 5-11
trends in central bank p&l
−250
−200
−150
−100
−50
0
50
100
150
200
−250
−200
−150
−100
−50
0
50
100
150
200
2002 2004 2006 2008 2010 2012 2014
HUF Bn HUF Bn
Net interest income and realised profit arising from financial operationsNet income arising from exchange rate changesOperating costs and expensesProfit/loss for the year

Quarterly report on inflation • december 2012 69
BALANCE POSITION OF THE ECONOMy
Although the rise in FX reserves materialised in 2008 and 2009, massive interest losses originating from the structure of the central
bank’s balance sheet and higher HUF interest triggered by higher risk premia have not led to significant central bank losses over the
past years. Fundamentally, this is attributable to two factors:
• One is that the central bank sold foreign currency to banks in order to avoid extreme exchange rate fluctuations in response to the
early repayments of FX loans. As the exchange rate of the euro in the market during the sale was higher than the average buying
rate of the FX reserves, the MNB earned approximately HUF 100 billion in exchange rate gains in the course of the early repayment
programme.
• The other factor that mitigated losses temporarily was that the FX reserves also include securities that were purchased at a price
higher than their nominal value at a higher interest rate. It follows that higher interest income in the past is coupled with losses at
future maturities; thus, overall, this process postpones the impact of market interest rate developments on the P&L.
The losses incurred by the MNB affect the fiscal balance only if retained earnings fail to cover the central bank’s current year losses.
Owing to its earlier profitable operation, the central bank has accumulated profit reserves, which has enabled it to finance the losses
that it has incurred so far. Even the losses incurred in 2012 are likely to be covered from the reserves. Accordingly, the fiscal balance
is expected to be first affected in 2014 only (by the losses in 2013, which are likely to amount to 0.6 percentage point of GDP).
Nevertheless, there are numerous risks surrounding the forecast for central bank P&L. If the exchange rate path and the interest rate
path, the two factors that affect P&L the most, fail to fall in line with our expectations, then the losses incurred by the MNB may also
depart from the levels we have projected.

Quarterly report on inflation • december 201270
Assessments of productivity in the private sector have become increasingly uncertain over recent quarters. Based on data
indicative for the whole economy, there has recently been a significant deterioration in productivity. As wages in the
private sector have so far been unable to counterbalance this deterioration (as a result, in part, of administrative wage
raises), unit labour costs have risen materially in the sector.
This uncertainty is reflected by the different labour statistics17 painting a sharply contradicting picture of private sector
employment in the recent past. We pointed out this phenomenon in the September Report, but could not provide a sound
economic explanation at the time, though. Now we seek to offer such explanation, drawing up a list of the consequences
that the possible explanations may have in respect of our forecast.
6.1.1 the DIaGnoSIS
Private sector productivity is the ratio of the value added generated by the sector and the amount of labour used for this
purpose. The employment figures disclosed in both the institutional survey (IS) and the labour force survey (LFS) can be
used to measure labour input. The two statistics have shown an increasingly conflicting picture of private sector
productivity since last year (Chart 6-1).
As the IS data show co-movement with the deterioration in
the sector’s output more closely, productivity calculated on
the basis of IS conforms to the modest growth experienced
subsequent to the recovery (2012 Q3). By contrast, the LFS
figures suggest a continuous rise in employment since 2011;
as a result, productivity has been steadily deteriorating
since then, running counter to trends during the recovery.
The September Report already tackled the issue of the
factors that may underlie the expansion in private sector
employment suggested by the LFS. At the time, we were of
the opinion that the widening gap between employment
data was limited to the services sector; however, we could
not identify any deeper interconnections on the basis of the
data available to us then.
6 Special topics
6.1 factors explaining the productivity shortfall
17 The Central Statistical Office (CSO) publishes two types of statistics for the purpose of measuring employment. One is an individual questionnaire-based labour survey (LFS) and the other is institutional statistics based on data reported by companies and budgetary institutions (IS). IS private sector data, contrary to similar LFS statistics, do not include, among other things, data on persons working fewer than 60 hours per month, micro enterprises, the non-profit sector and those working in the informal economy. The two types of statistics usually coincide in respect of developments in private sector employment; over shorter horizons, however, there may be differences between the two surveys.
Chart 6-1
private sector productivity according to different labour statistics
(seasonally adjusted quarterly data)
98
100
102
104
106
108
110
2005 2006 2007 2008 2009 2010 2011 2012
Labour force surveyInstitutional survey
2009 Q1 = 100

Quarterly report on inflation • december 2012 71
SPECIAL TOPICS
Based on the individual data received since then, we have
found a marked discrepancy between the behaviour of
micro-enterprises18 and that of corporations larger in size.
The numbers employed in the private sector fell
considerably (by a total of 150,000) in the first years of the
crisis. By contrast, employment has risen by about 75,000
in the micro-enterprise segment since the peak of the
crisis, thus approximating pre-crisis levels by mid-2012.
There has been no marked shift in the staffing levels of
large corporations from the levels seen at the trough of the
crisis (Chart 6-2).
Companies employing fewer than 10 persons account for
close to 40 per cent of private sector employment, but only
slightly over 10 per cent of the sector’s value added. There
has been a shift in sector employment towards small
companies in the past quarters, which has exerted a
negative composition effect on productivity indicators
measured over the entire sector.
6.1.2 poSSIBle explanatIonS
Several explanations can be offered for the deterioration in productivity stemming from an increase in employment in the
segment of small enterprises. In terms of the possible consequences, there are three major groups: statistical measurement
problems, temporary shocks and the consequences of a structural transition of the Hungarian economy. The deterioration
in productivity may be due to a statistical measurement problem, in which case it leaves the operation of the economy
unaffected and disappears over time with no consequences whatsoever. If, however, the deterioration in productivity is
attributable to temporary shocks, adjustment should materialise already in the short term. This may result in a significant
fall in private sector employment up to the point where the loss of profit arising from a deterioration in productivity is
recouped. Finally, the deterioration in productivity may be due to a permanent restructuring of the economy towards a
more labour-intensive production structure with lower labour productivity. In the latter case, adjustments warranted by
temporary shocks are likely to be much more restrained in the real and nominal processes, as productivity and profitability
are only partially restored in the corporate sector in this scenario.
6.1.3 MeaSureMent proBleMS
What renders the understanding of the marked deterioration in productivity difficult is that its root causes are linked to
a corporate segment (micro-enterprises) on which only few data are available and even the available data are surrounded
with relatively large measurement-related uncertainty. Furthermore, it is this segment where the percentage of
underground economic employment and grey or black economic activity is higher, which also compromises data quality.
It may also be the case that estimates for the value added generated by micro-enterprises do not measure actual demand
for businesses properly.
An explanation is offered by a statistical recording difference between the two employment statistics. Institutional
statistics record the non-profit sector separately. A similar distinction is not possible in the labour survey. As a result, the
Labour Force Survey includes those employed by non-profit companies providing other than public administrative,
educational or human healthcare services in the private sector. IS statistics for non-profit companies have been tracking
18 Our studies prove that the upper limit for the size of micro-enterprises should be 10 employees, because it is the very limit where corporate behaviour starts to become distinctly different. Considering the fact that the IS sample also includes companies employing at least 5 persons, the question arises why there has been no similar rise in the 5 to 10 employment category also included in the IS. This is likely to be the outcome of the fact that the IS does not include those employed in the informal economy. As black market employment is common among micro-enterprises, it cannot be ruled out that even companies actually larger than 5 employees are excluded from the institutional sample of the CSO.
Chart 6-2
private sector employment by company size
(seasonally adjusted quarterly LFS data)
−100
−80
−60
−40
−20
0
20
40
−100
−80
−60
−40
−20
0
20
40
2005 2006 2007 2008 2009 2010 2011 2012
Under 10 employeesOver 10 employees
Change compared to Q3 2008 (thousand employees)
Change comparedto Q3 2008
(thousand employees)

MAGYAR NEMZETI BANK
QuARTERlY REpoRT oN INflATIoN • dEcEMBER 201272
trends in public work employment closely since 2009,
suggesting that some of those employed in the public work
programmes are employed via non-profit companies. A
comparison of IS employment data also including data for
non-profit companies with LFS data for private sector
employment may offer an explanation for nearly half of the
difference meaning 70,000 persons that has materialised in
2012, though even this adjustment fails to offer an
explanation for the significant rise in employment seen
before 2012 (Chart 6-3).
It also cannot be ruled out, that small companies have a
better financial situation in fact, than what one can observe
in aggregate data. Certain changes in taxation (e.g. the
reduction in corporate taxes) in force since 2010 may have
improved the after-tax profits of smaller companies via the
easing of corporate burdens, which, in turn, is likely to have
been used to fund the expansion in employment. On the
other hand, overall, changes in taxes on labour (e.g.
cancellation of the tax credits) and administrative wage
increases19 raised the relative employment costs of low-income earners in the same period, which made employment more
expensive for small businesses, because they typically employ these individuals. However the net effect of these tax
legislations could improve permanently the financial situation of smaller companies.
Other, directly unobserved funds also include EU funds. Based on the data provided by the National Development Agency,
the amount of EU funds awarded expressly to micro-enterprises under the economic development operational programme
has nearly doubled, while the number of the companies concerned has grown over 3.5-fold. The sum of all the awarded
operative programmes increased HUF 103,7 billions by this year from 49,7 billion forints in 2010. The current European
budget cycle will end in 2013. However further payments are expected to boom till than, the positive employment effect
of these sources could be only temporary.
6.1.4 SIGnS of teMporary ShoCkS
In order to perform a more in-depth analysis of trends in productivity, we used the decomposition below, which can be
performed separately for companies with less than 10 employees and larger companies, due to the composition changes:
where Y denotes the sector’s value added,20 L is the number of employees, H is working hours per capita and ∆ denotes
annual change. Accordingly, L ∙ H denotes the labour used in the sector. Using the number of working hours enables us to
examine both extensive limits to corporate adjustment (i.e. changes in employment) and adjustments through changes in
employment intensity.
Based on the above, it can be observed that trends in corporate productivity suggest larger swings (higher volatility) and
slower adjustment for them (greater persistence). This is attributable to fluctuations in the value added of larger
Chart 6-3
private sector productivity based on employment statistics
(seasonally adjusted quarterly labour force and institutional survey data)
−200
−150
−100
−50
0
50
2008 2009 2010 2011 2012
Change compared to 2008 Q3 (thousand employees)
Labour force survey (headline)Institutional survey (business sector + non-profit)Institutional survey (business sector)
19 However the government implemented the instrument of wagecompensation in order to offset the cost raising effects of the legislations of labour-taxes in 2012, it conditioned this instrument on an expected wage increasing scheme, which should have covered by employers up to 5 per cent. This condition increased the labourcosts of low income earner employees for even those who participated the wage-compensation programme.
20 For the decomposition of the value added of the two company groups only yearly data are available in the micro-database of the tax authority. In order to generate quarterly data, we decomposed the yearly value added date in such a way that ratio of the VAs in the two groups equals the yearly averages observed in the database of the tax authority.

Quarterly report on inflation • december 2012 73
SPECIAL TOPICS
corporations to which these companies respond only
moderately in terms of labour used. Another phenomenon
regarding adjustment is that companies respond almost
immediately at the intensive threshold (e.g. by reducing the
number of working hours through the reclassification of
staff into the part-time category when demand is weaker);
by contrast, adjustment occurs with even a 2- to 3-quarter
lag at the extensive threshold, when demand is persistently
weaker. Contrary to micro-enterprises, larger companies
usually have such reserves that enable them to protect
their existing labour force, i.e. in effect, their accumulated
company-specific human capital, over shorter terms. This
can be reasonable, because the reproduction of this type of
capital may, in some cases, prove to be more expensive
than the short-term financial losses stemming from labour-
hoarding (Chart 6-4).
There are more moderate swings and less persistence in the
productivity of micro-companies. This may be due to the
fact that although the size of the shocks to value added is
similar to that of the shocks affecting larger companies,
employment-related responses are stronger in the micro-
segment. Some authors like Brock and Evans (1989) or Cravo
(2011) showed that the response to temporary shocks of
small companies (especially in emerging markets) is way more elastic than larger ones.
As, in many cases, labour shedding in the micro-segment is synonymous with the discontinuation of business operation;
neither intensive adjustment nor labour-hoarding is common among micro-enterprises. The number of the working hours
per capita has been decreasing almost consistently over the past seven years irrespective of short-term developments in
the business cycle, thus improving productivity.
In recent quarters, productivity has deteriorated recently mainly in the segment of businesses employing fewer than 10
persons, to which increase in employment in this segment has been the main contributing factor. As this has been only
partly offset by shorter working hours per capita, productivity measured by total hours worked has continued to
deteriorate in the past nearly one year.
Quarters preceding the slowdown of 2012 were characterised by promising growth expectations, which may provided a
basis to the employment raisings. The relapse of external demand may contributed to the deterioration of productivity,
to which companies were able to adjust with delays. If, however, temporary shocks also play a part in the deterioration
of productivity, corporations are likely to make significant layoffs already in the short run, once such shocks have worn
off.
This can be confirmed by the fact, that micro enterprises because of their small size are attached to external markets
through larger companies, hence negative demand shocks that hit these bigger firms exert their effect on small companies
with a delay. Such a lag may be even longer as there is also a delay in corporations’ employment response relative to
developments in their value added.
The above explanation is somewhat challenged by the fact that, although the deterioration in productivity used to be the
result of reduction in value added, it was triggered by higher employment in mid-2011; by contrast, demand is likely to
have started to decline early this year.
Chart 6-4
Decomposition of private sector productivity by corporate size
(seasonally adjusted quarterly LS and tax authority data and MNB estimates)
−15
−10
−5
0
5
10
−15
−10
−5
0
5
10
2005
2006
2007
2008
2009
2010
2011
2012
2005
2006
2007
2008
2009
2010
2011
Year percentage change Year percentage change
Value addedEmploymentHours per employeeProductivity
under 10 employees over 10 employees
Note: The contribution of employment and that of working hours to productivity carry opposite signs, i.e. an increase in working hours leads to a deterioration in productivity.
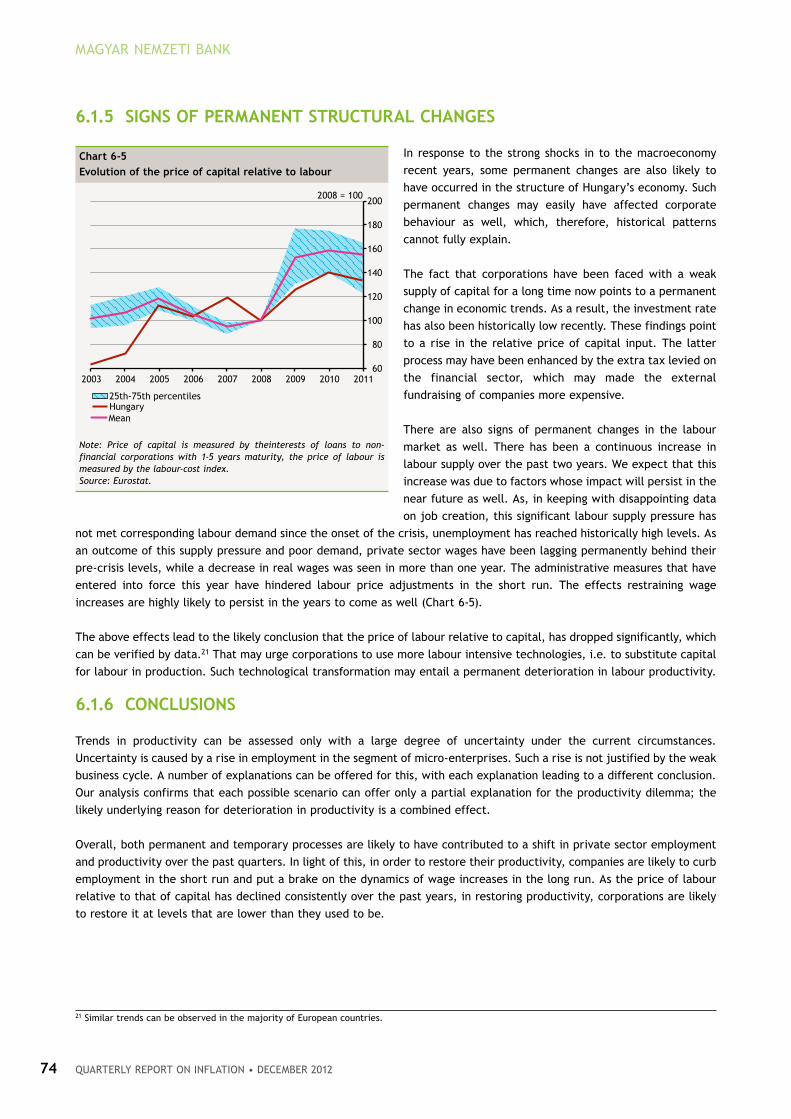
MAGYAR NEMZETI BANK
QuARTERlY REpoRT oN INflATIoN • dEcEMBER 201274
6.1.5 SIGnS of perManent StruCtural ChanGeS
In response to the strong shocks in to the macroeconomy
recent years, some permanent changes are also likely to
have occurred in the structure of Hungary’s economy. Such
permanent changes may easily have affected corporate
behaviour as well, which, therefore, historical patterns
cannot fully explain.
The fact that corporations have been faced with a weak
supply of capital for a long time now points to a permanent
change in economic trends. As a result, the investment rate
has also been historically low recently. These findings point
to a rise in the relative price of capital input. The latter
process may have been enhanced by the extra tax levied on
the financial sector, which may made the external
fundraising of companies more expensive.
There are also signs of permanent changes in the labour
market as well. There has been a continuous increase in
labour supply over the past two years. We expect that this
increase was due to factors whose impact will persist in the
near future as well. As, in keeping with disappointing data
on job creation, this significant labour supply pressure has
not met corresponding labour demand since the onset of the crisis, unemployment has reached historically high levels. As
an outcome of this supply pressure and poor demand, private sector wages have been lagging permanently behind their
pre-crisis levels, while a decrease in real wages was seen in more than one year. The administrative measures that have
entered into force this year have hindered labour price adjustments in the short run. The effects restraining wage
increases are highly likely to persist in the years to come as well (Chart 6-5).
The above effects lead to the likely conclusion that the price of labour relative to capital, has dropped significantly, which
can be verified by data.21 That may urge corporations to use more labour intensive technologies, i.e. to substitute capital
for labour in production. Such technological transformation may entail a permanent deterioration in labour productivity.
6.1.6 ConCluSIonS
Trends in productivity can be assessed only with a large degree of uncertainty under the current circumstances.
Uncertainty is caused by a rise in employment in the segment of micro-enterprises. Such a rise is not justified by the weak
business cycle. A number of explanations can be offered for this, with each explanation leading to a different conclusion.
Our analysis confirms that each possible scenario can offer only a partial explanation for the productivity dilemma; the
likely underlying reason for deterioration in productivity is a combined effect.
Overall, both permanent and temporary processes are likely to have contributed to a shift in private sector employment
and productivity over the past quarters. In light of this, in order to restore their productivity, companies are likely to curb
employment in the short run and put a brake on the dynamics of wage increases in the long run. As the price of labour
relative to that of capital has declined consistently over the past years, in restoring productivity, corporations are likely
to restore it at levels that are lower than they used to be.
Chart 6-5
evolution of the price of capital relative to labour
60
80
100
120
140
160
180
200
2003 2004 2005 2006 2007 2008 2009 2010 2011
2008 = 100
25th-75th percentilesHungaryMean
Note: Price of capital is measured by theinterests of loans to non-financial corporations with 1-5 years maturity, the price of labour is measured by the labour-cost index. Source: Eurostat.
21 Similar trends can be observed in the majority of European countries.
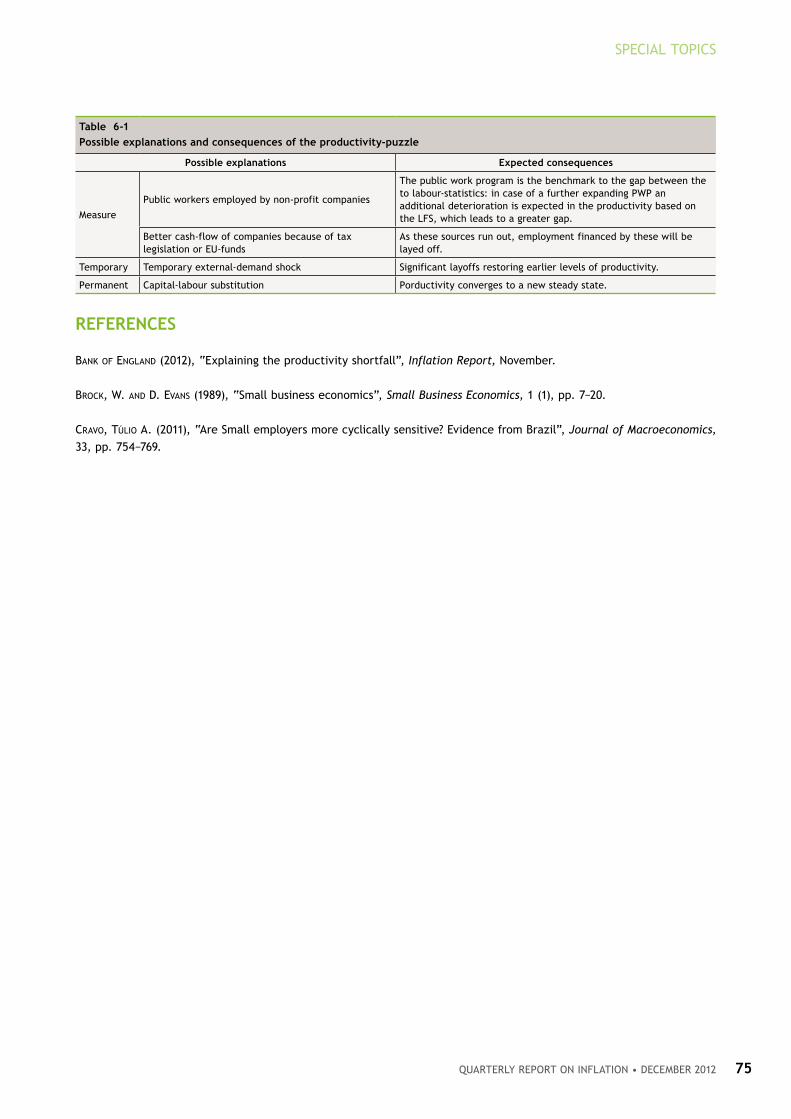
Quarterly report on inflation • december 2012 75
SPECIAL TOPICS
referenCeS
banK of england (2012), “Explaining the productivity shortfall”, Inflation Report, November.
broCK, W. and d. evans (1989), “Small business economics”, Small Business Economics, 1 (1), pp. 7−20.
Cravo, túlio a. (2011), “Are Small employers more cyclically sensitive? Evidence from Brazil”, Journal of Macroeconomics,
33, pp. 754−769.
table 6-1
possible explanations and consequences of the productivity-puzzle
possible explanations expected consequences
Measure
Public workers employed by non-profit companies
The public work program is the benchmark to the gap between the to labour-statistics: in case of a further expanding PWP an additional deterioration is expected in the productivity based on the LFS, which leads to a greater gap.
Better cash-flow of companies because of tax legislation or EU-funds
As these sources run out, employment financed by these will be layed off.
Temporary Temporary external-demand shock Significant layoffs restoring earlier levels of productivity.
Permanent Capital-labour substitution Porductivity converges to a new steady state.
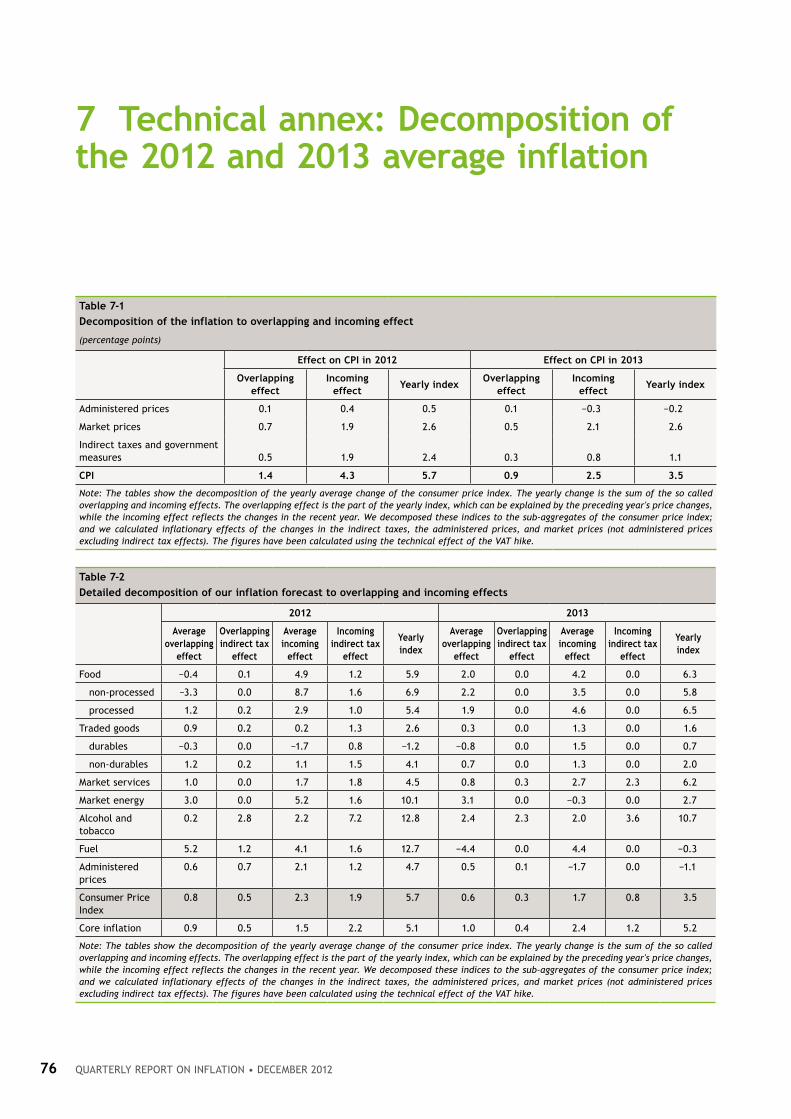
QuARTERlY REpoRT oN INflATIoN • dEcEMBER 201276
7 technical annex: Decomposition of the 2012 and 2013 average inflation
table 7-1
Decomposition of the inflation to overlapping and incoming effect
(percentage points)
effect on CpI in 2012 effect on CpI in 2013
overlapping effect
Incoming effect
yearly indexoverlapping
effectIncoming
effectyearly index
Administered prices 0.1 0.4 0.5 0.1 −0.3 −0.2
Market prices 0.7 1.9 2.6 0.5 2.1 2.6
Indirect taxes and government measures 0.5 1.9 2.4 0.3 0.8 1.1
CpI 1.4 4.3 5.7 0.9 2.5 3.5
Note: The tables show the decomposition of the yearly average change of the consumer price index. The yearly change is the sum of the so called overlapping and incoming effects. The overlapping effect is the part of the yearly index, which can be explained by the preceding year's price changes, while the incoming effect reflects the changes in the recent year. We decomposed these indices to the sub-aggregates of the consumer price index; and we calculated inflationary effects of the changes in the indirect taxes, the administered prices, and market prices (not administered prices excluding indirect tax effects). The figures have been calculated using the technical effect of the VAT hike.
table 7-2
Detailed decomposition of our inflation forecast to overlapping and incoming effects
2012 2013
average overlapping
effect
overlapping indirect tax
effect
average incoming
effect
Incoming indirect tax
effect
yearly index
average overlapping
effect
overlapping indirect tax
effect
average incoming
effect
Incoming indirect tax
effect
yearly index
Food −0.4 0.1 4.9 1.2 5.9 2.0 0.0 4.2 0.0 6.3
non-processed −3.3 0.0 8.7 1.6 6.9 2.2 0.0 3.5 0.0 5.8
processed 1.2 0.2 2.9 1.0 5.4 1.9 0.0 4.6 0.0 6.5
Traded goods 0.9 0.2 0.2 1.3 2.6 0.3 0.0 1.3 0.0 1.6
durables −0.3 0.0 −1.7 0.8 −1.2 −0.8 0.0 1.5 0.0 0.7
non-durables 1.2 0.2 1.1 1.5 4.1 0.7 0.0 1.3 0.0 2.0
Market services 1.0 0.0 1.7 1.8 4.5 0.8 0.3 2.7 2.3 6.2
Market energy 3.0 0.0 5.2 1.6 10.1 3.1 0.0 −0.3 0.0 2.7
Alcohol and tobacco
0.2 2.8 2.2 7.2 12.8 2.4 2.3 2.0 3.6 10.7
Fuel 5.2 1.2 4.1 1.6 12.7 −4.4 0.0 4.4 0.0 −0.3
Administered prices
0.6 0.7 2.1 1.2 4.7 0.5 0.1 −1.7 0.0 −1.1
Consumer Price Index
0.8 0.5 2.3 1.9 5.7 0.6 0.3 1.7 0.8 3.5
Core inflation 0.9 0.5 1.5 2.2 5.1 1.0 0.4 2.4 1.2 5.2
Note: The tables show the decomposition of the yearly average change of the consumer price index. The yearly change is the sum of the so called overlapping and incoming effects. The overlapping effect is the part of the yearly index, which can be explained by the preceding year's price changes, while the incoming effect reflects the changes in the recent year. We decomposed these indices to the sub-aggregates of the consumer price index; and we calculated inflationary effects of the changes in the indirect taxes, the administered prices, and market prices (not administered prices excluding indirect tax effects). The figures have been calculated using the technical effect of the VAT hike.

Quarterly report on inflation • december 2012 77
november 1998Changes in the central bank’s monetary instruments 23
Wage inflation − the rise in average wages 62
Wage increases and inflation 63
Impact of international financial crises on Hungary 85
March 1999The effect of derivative FX markets and portfolio reallocation of commercial banks on the demand for forints 20
What lies behind the recent rise in the claimant count unemployment figure? 34
June 1999New classification for the analysis of the consumer price index 14
Price increase in telephone services 18
Forecasting output inventory investment 32
Correction for the effect of deferred public sector 13th month payments 39
What explains the difference between trade balances based on customs and balance of payments statistics? 44
September 1999Indicators reflecting the trend of inflation 14
The consumer price index: a measure of the cost of living or the inflationary process? 18
Development in transaction money demand in the south European countries 28
Why are quarterly data used for the assessment of foreign trade? 37
The impact of demographic processes on labour market indicators 41
What explains the surprising expansion in employment? 42
Do we interpret wage inflation properly? 45
December 1999Core inflation: Comparison of indicators computed by the National Bank of Hungary and the Central Statistical Office 18
Owner occupied housing: service or industrial product? 20
Activity of commercial banks in the foreign exchange futures market 26
March 2000The effect of the base period price level on twelve-month price indices − the case of petrol prices 19
The Government’s anti-inflationary programme in the light of the January CPI data and prospective price measures
over 2000 taken within the regulated category 21
The impact of the currency basket swap on the competitiveness of domestic producers 51
June 2000How is inflation convergence towards the euro area measured? 14
Inflation convergence towards the euro area by product categories 15
Changes in the central bank’s monetary instruments 23
Transactions by the banking system in the foreign exchange markets in 2000 Q2 26
Boxes and Special topics in the report, 1998−2012
MAGYAR NEMZETI BANK
QuARTERlY REpoRT oN INflATIoN • dEcEMBER 201278
Coincidence indicator of the external cyclical position 39
How is the wage inflation index of the MNB calculated? 47
September 2000Background of calculating monetary conditions 20
Foreign exchange market activities of the banking system in 2000 Q3 25
December 2000Changes in the classification methodology of industrial goods and market-priced services 25
Different methods for calculating the real rate of interest 27
Changes in central bank instruments 28
Foreign exchange market activities of the banking system in the period of September to November 31
Hours worked in Hungarian manufacturing in an international comparison 53
Composition effect within the manufacturing price-based real exchange rate 57
March 2001Foreign exchange market activities of the banking system from December 2000 to February 2001 30
Estimating effective labour reserves 50
august 2001Assumptions of the central projection 31
New system of monetary policy 35
Forecasting methodology 37
Inflationary effect of exchange rate changes 38
november 2001Assumptions of the central projection 35
The effects of fiscal policy on Hungary’s economic growth and external balance in 2001−02. 39
Estimating the permanent exchange rate of forint in the May−August period 41
How do we prepare the Quarterly Report on Inflation? 41
february 2002Assumptions of the central projection 45
The effect of the revision of GDP data on the Bank’s forecasts 50
Method for projecting unprocessed food prices 52
What do we know about inventories in Hungary? 53
august 2002Assumptions of the central projection 16
The exchange rate pass-through to domestic prices − model calculations 50
How important is the Hungarian inflation differential vis-à-vis Europe? 51
How do central banks in Central Europe forecast inflation? 52
An analysis on the potential effects of EU entry on Hungarian food prices 53
A handbook on Hungarian economic data 54
The economic consequences of adopting the euro 55
november 2002Changes in the central projection under a variety of scenarios 14
What do business wage expectations show? 40
Should we expect a revision to 2002 GDP data? 41
Quarterly report on inflation • december 2012 79
BOXES AND SPECIAL TOPICS IN THE REPORT, 1998−2012
february 2003Assumptions underlying the central projection 12
The speculative attack of January 2003 and its antecedents 39
Macroeconomic effects of the 2001−2004 fiscal policy − model simulations 43
What role is monetary policy likely to have played in disinflation? 46
What do detailed Czech and Polish inflation data show? 48
The impact of world recession on certain European economies 50
Inflation expectations for end-2002, following band widening in 2001 52
May 2003Assumptions underlying the central projection 20
Tax and price approximation criteria affecting inflation 77
Revisions to the forecast of external demand 79
august 2003Assumptions underlying the central projection 20
How are the announced changes in indirect taxes likely to affect inflation? 71
Principles of the rules-based fiscal forecast 76
Estimates of the output gap in Hungary 78
november 2003Major assumptions in the current and the August Report 21
Revised data on GDP in 2002 73
Questions and answers: Recording of reinvested earnings 75
Estimates for non-residential capital stock in Hungary 78
february 2004Major assumptions in the current and in the November Report 34
An analysis of the performance of inflation forecasts for December 2003 73
Disinflationary effects of a slowdown in consumption 76
The macroeconomic effects of changes in housing loan subsidies 78
What do we learn from the 1999 indirect tax increase in Slovakia? 80
Indicators of general government deficit 84
May 2004Summary table of underlying assumptions 27
Background information on the projections 73
The Quarterly Projections Model (N.E.M.) 80
A methodology for the accrual basis calculation of interest balance 82
External demand vs. real exchange rate impact in the 89
New method for eliminating the distorting effects of minimum wage increases 91
What does the fan chart show? 95
august 2004Summary table of major assumptions 43
Changes to the structure of the Report 51
How persistent is the recent rise in manufacturing productivity? 66
Calendar effects in economic time series 69
The effects of economic cycles on the general government balance 73
The effect of the global crude oil market prices on Hungarian economy 75
The optimal rate of inflation in Hungary 80
On the timing of interest rate decisions 81

MAGYAR NEMZETI BANK
QuARTERlY REpoRT oN INflATIoN • dEcEMBER 201280
november 2004Summary table of major assumptions determining the central scenario 42
PPP projects from a macroeconomic perspective 65
Issues in households’ behaviour in 2004 H1 67
How do macroeconomic news affect money markets? 71
Interest rate pass-through in Hungary 74
Why are the cash flow-based interest expenditures of the government budget for 2004 expected to exceed
the amount laid down in the Budget Act? 76
february 2005Major assumptions determining the central scenario 53
The assessment of the accuracy of our forecast for December 2004 82
Structural political challenges related to the adoption of the euro: fiscal policy 89
Stylised facts in the consumer price statistics: communication price developments 90
How does interest rate policy affect economic growth and inflation? Results from a VAR approach 95
May 2005Major assumptions determining the main scenario 53
Assessment of the performance of the MNB’s growth projections 78
Factors that may explain the recent rise of unemployment 81
Stylised facts in consumer price statistics: durable goods 86
Short-term effects of accession to the EU − food products 91
Economic fluctuations in Central and Eastern Europe 96
Effects of the Gripen Agreement on 2006−2007 macroeconomic data 99
august 2005Boxes:
Uncertainties surrounding the GDP 28
Prices of unprocessed foods in the region 35
Our assumptions and the fragility of the main scenario 39
The effect of certain recently announced measures to be taken by the governmenton our forecast 47
The effect of the Gripen fighter plane procurement on our forecast 48
Impact of data revisions 51
Risks involved in projecting the expenditures of budgetary units and institutions 56
Questions concerning developments in imports and the external balance 61
Special topics:
Background information on the projections 47
Developments in general government deficit indicators 54
Developments in the external balance 59
The macroeconomic effects of the 2006 VAT reduction 64
Assessment of the impacts of the envisaged minimum wage increase 68
november 2005Question marks regarding German economic activity 14
Assumptions 35
The effect of recent oil price rise on domestic CPI 39
Delaying expenditures related to interest subsidies of mortgage loans 51
May 2006About the growth in external demand 21
How significant is the 2006 minimum wage shock? 29
To what extent the VAT rate cut is reflected in consumer prices? 31
On the price increase of unprocessed foods in early 2006 34
Quarterly report on inflation • december 2012 81
BOXES AND SPECIAL TOPICS IN THE REPORT, 1998−2012
Assumptions 39
Uncertainties surrounding the inflationary effects of changes in the exchange rate 39
Taking the costs of the pension reform into account in the budget 53
august 2006Assumptions 15
2007−2008: Households’ consumption behaviour 17
Primary inflationary effects of fiscal measures 20
november 2006Which factors rendered the measurement of underlying inflationary trends difficult during the previous quarter? 32
Assumptions 41
Means of risk assessment: contingency reserves 56
Revisions made in current account statistics 58
february 2007Impacts of changes in the applied methodology and of data revisions in the national accounts 7
Assessment of the January inflation figures 12
Changes in major assumptions relative to the November Report 15
Expected developments in regulated prices 16
May 2007How good is Hungarian export performance in a regional comparison? 20
From the gross average wage-index of the CSO to trend wages reflecting the economic cycle 26
A Survey on corporate wage policies 29
Where did trend inflation stand during the first quarter? 30
Assumptions underlying the central projection 35
Assumptions applied in our forecast 49
Methodology of the fiscal fan chart 53
august 2007How do we estimate trend wage dynamics 17
Changes in major assumptions relative to the May Report 19
The effect of the change in our assumption regarding agricultural producer prices on our forecast 30
november 2007Downturn in the construction sector 10
A discussion of the trend indicator capturing fundamental processes in wages 25
What can explain the persistently high inflation of services? 34
The US mortgage market crisis and possible ramifications for financial stability 41
Different estimates of output and consumption gaps 50
Changes in our forecast relative to the August Report 55
Which factors are behind the change in our projection for the 2007 ESA budget deficit? 67
february 2008Effect of OÉT (National Interest Reconciliation Council) agreements on wages 16
Changes in our basic assumptions 22
May 2008Methodological issues regarding wage developments 20
What is behind the increase in international commodity prices? 24
Our assumptions 41
Use of risk paths in international practice 44

MAGYAR NEMZETI BANK
QuARTERlY REpoRT oN INflATIoN • dEcEMBER 201282
august 2008Developments in real household income at the beginning of 2008 13
Some thoughts on the correlation between wage statistics and whitening 16
To what extent did free labour market capacities grow in the last period? 19
Changes in the central projection 27
How does the Hungarian economy respond to nominal exchange rate appreciation? Simulations with the NEM model 28
Why has there been no marked disinflation since early 2007, i.e. does a sluggish economy affect inflation trends? 31
november 2008Our basic assumptions 32
february 2009The basic assumptions of our forecast 33
The macroeconomic effect of the fiscal measures 34
May 2009Basic assumptions of our forecast 37
Government measures and their macroeconomic effects 39
Are Hungarian debt dynamics sustainable? 57
august 2009Quantification of perceived and expected inflation 24
Basic assumptions of our forecast 41
Revision of potential output 43
november 2009Inventory developments in the whole-economy 20
Measures of underlying inflation 25
Changes in our basic assumptions 43
Indicators to measure capacity utilisation 46
The orienting role of the wage recommendations of the OÉT 50
Main driving forces behind the change in our forecast 60
Impact of the revisions conducted in the balance of payments 65
february 2010The effects of car scrappage schemes on domestic and European industrial production 17
Revision of CSO national account’s data 22
Labour hoarding during the crisis 26
Changes in our basic assumptions 45
The effect of the update of weights on annual inflation 50
June 2010Possible effects of the euro effective exchange rate on domestic activity 16
Main factors determining households’ consumption–savings behaviour during the crisis 21
The effect of the change in pension fund regulations on the financial position of households and the general
government 25
Briefly about the new macroeconometric model used in our forecast 45
Changes in our basic assumptions 46
Revisions of developments in the potential growth of the Hungarian economy expected over our forecast period 48
The forecast performance of our oil price assumptions 55

Quarterly report on inflation • december 2012 83
BOXES AND SPECIAL TOPICS IN THE REPORT, 1998−2012
august 2010Projected effects of European fiscal consolidation measures on growth in Hungary’s trading partners 16
What was behind the acceleration of wages in manufacturing at the beginning of the year? 25
Changes in our basic assumptions 43
Effects of the 29-point government package of measures on our forecast 45
Expected macroeconomic effect of the flat-rate tax system 47
Settlement of the government package of measures, forecasting rules 60
Comparison of our current forecast with the 2010 Budgetary Act and the May 2010 forecast 64
november 2010Impact of the revisions in the balance of payments 21
Alternative indicators for measuring wage inflation 24
Changes in our basic assumptions 40
Expected economic effect of major manufacturing industry investment projects in Hungary 42
Impact of PIT measures on household incomes and household consumption/savings patterns 44
Impact of the announced government measures on potential GDP 46
Short-term macroeconomic effects of sector-specific extra taxes 54
Comparison to the draft budget 67
Our technical assumption with respect to the wealth effect of returning private pension fund members 67
The expected effect of planned reconstruction in the pension system 68
March 2011Role of the endogenous policy rate path in forecasts 15
How were the impacts of the Széll Kálmán plan taken into account in our macroeconomic forecast? 18
Effect of national account revisions 39
The impact of the reform of the pension system on statistical accounting 57
Impact of return from private pension funds on the medium-term general government position 61
The forecast method of budget items of the rule-based scenario for 2012 66
June 2011The impact of household energy (natural gas and distant heating) regulation on the consumer price index 15
The impact of the fixed exchange rate programme point of the Home Protection Action Plan on household lending 18
September 2011Impact of the measures affecting indirect taxes and the effect of the transformation of the energy price
subsidisation system on our forecast of the consumer price index 14
Impact of the heretofore announced 2012 fiscal measures on our macroeconomic baseline scenario 23
Fiscal impacts of the announced measures 71
December 2011Main external assumptions underlying our forecast 15
The impact of measures affecting wage costs on inflation and household income 21
Household developments in the first three quarters of 2011 43
The revision of national accounts and on the change in our assessment of potential growth 46
Revisions in the balance of payments 56
March 2012The probable macroeconomic effects of expected fiscal measures aim to hold the 2012−2013 deficit target 19
Deleveraging in the European banking sector 35
Impact of the VAT rate increase in January 2012 on inflation 52
MAGYAR NEMZETI BANK
QuARTERlY REpoRT oN INflATIoN • dEcEMBER 201284
June 2012Crisis management in Europe 29
Recession and recovery − growth patterns following the crisis in an international comparison 33
Analysis of investment behaviour in a sectoral breakdown 37
September 2012The effect of administrative measures on the wage index of the private sector 16
Technical forecast assumptions regarding the package of measures ensuring the attainability of the deficit target 19
Impact of the new state interest rate subsidy scheme on our lending forecast 22
Factors behind the improvement of financial market sentiment despite the deteriorating macroeconomic indicators 33
What explains the recent weakness of industrial production? 40
Contradictions in employment figures? The interpretation of this year’s employment data 43
The pass-through of the food price shock into consumer prices 50
December 2012Key important reasons for the change in our 2013 inflation forecast 14
Effects of the long-term increase in corporate tax burdens 18
Changes in Hungary’s export market share in recent years 34
Possible reasons of increasing employment in the labour force survey 41
Effects of administrative wage increases on private sector wages 49
Impact of the regulation governing uncovered European sovereign CDS deals on CDS premia 55
Expected trends in central bank P&l 68

Quarterly report on InflatIon
December 2012
Print: D-plus
H−1037 Budapest, Csillaghegyi út 19−21.