Quarterly Progress Scientific Report
37
QPSR of the numediart research program, Vol. 4, No. 3, September 2011 Quarterly Progress Scientific Report Vol. 4, No. 3, September 2011 T. Dutoit (Editor) i
Transcript of Quarterly Progress Scientific Report

QPSR of the numediart research program, Vol. 4, No. 3, September 2011
Quarterly ProgressScientific ReportVol. 4, No. 3, September 2011
T. Dutoit (Editor)
i

Published online by:Université de Mons (UMONS)Laboratoire de Théorie des Circuits et Traitement du Signal (TCTS)http://tcts.fpms.ac.be
ISSN:2032-5398 (printed)2032-538X (online)
Credits:Editor: Thierry Dutoit (UMONS/TCTS)LATEX editor: Christian Frisson (UMONS/TCTS), using LATEX’s confproc class (by V. Verfaille)
All copyrights remain with the authors.
numediart homepage: http://numediart.orgContact: [email protected]

QPSR of the numediart research program, Vol. 4, No. 3, September 2011
Preface
The numediart Institute for New Media Art Technology was founded in 2010 by the University of Mons(UMONS), as an extension of the eponymous research programme funded by the Walloon Region (1997-2012). Building upon MONS 2015 dynamics (Mons will be the European Capital of Culture in 2015),the Institute shall organize internationally-renowned scientific training and research activities in the areaof new media art technology. The topics covered by the Institute are the following: audio, image, video,gesture, and bio-signal processing, for applications in which the interaction between man and machine aimsat creating emotions.
The activities of the Institute are coordinated by a strategic board, the numediart Consortium, whichcounts some fifteen members coming from the world of research, arts, entertainment, and industry. TheConsortium meets every three months and ensures optimal adequacy between the research projects carriedout by the Institute and the regional needs so as to foster scientific, economic and cultural development.
The numediart Programme is structured around three R&D themes: HyFORGE, for content-based hy-permedia navigation; COMEDIA, for body and media interaction, and COPI, for digital luthery. The Pro-gramme consists of a series of short term projects (3-6-months; 3-4 projects running simultaneously), a oneweek mid-term "hands on" workshop, and a final public presentation. Projects proposals are made by seniorresearchers who carry them out and who are members of the Follow-up Committee, which meets once amonth.
iii

QPSR of the numediart research program, Vol. 4, No. 3, September 2011
This fifteenth session of numediart projects was held from July to September 2011.
NUMEDIART took part to the 1-month eNTERFACE’11 Workshop in Plzen, Tchequia, from Au-gust 1st to 26th.
We took part to two of the 5 projects, respectively dedicated to collaborative vocal puppetry and tocollaborative social gaming using a 3D camera.
eNTERFACE’11was hosted byUniversity of WestBohemia.
It was the first occasion for our teams from Mons to collaborate with researchers in Plzen, preparingMONS2015 ad PZLEN2015 (Mons and Plzen will both be EU capitals of culture in 2015). Otherprojects will follow...
iv

QPSR of the numediart research program, Vol. 4, No. 3, September 2011
Projects
Session #15 (Jul-Sep 2011)
13 Project #15.1: Guitar As ControllerLoïc Reboursière, Otso Lähdeoja, Ricardo Chesini Bose, Thomas Drugman, Stéphane Dupont, Cécile Picard-Limpens, Nicolas Riche
27 Project #15.2: RT-MediaCycle : Towards a real-time use of MediaCycle in performances and video installationsXavier Siebert, Stéphane Dupont, Christian Frisson, Bernard Delcourt
31 Project #15.3: MAGE / pHTS in Collaborative Vocal Puppetry (CoVoP) - Multi-User Performative HMM-basedVoice Synthesis on Distributed PlatformsMaria Astrinaki, Onur Babacan, Nicolas d’Alessandro, Thierry Dutoit, Sidney Fels
37 Project #15.4: Kinact: a Saliency-based Social GameMatei Mancas, Radhwan Ben Madhkour, Dominique De Beul, Julien Leroy, Nicolas Riche, Yves P. Rybarczyk,François Zajéga
43 Index of Authors
v

QPSR of the numediart research program, Vol. 4, No. 3, September 2011
vi

QPSR of the numediart research program, Vol. 4, No. 3, September 2011
GUITAR AS CONTROLLER
Loïc Reboursière 1, Otso Lähdeoja 1, Ricardo Chesini Bose 2,Thomas Drugman 1, Stéphane Dupont 1, Cécile Picard-Limpens 1,3, Nicolas Riche 1
1 Laboratoire de Théorie des Circuits et Traitement du Signal (TCTS), Faculté Polytechnique de Mons (FPMs), Belgique2 Service Electronique et Microélectronique (SEMI), Faculté Polytechnique de Mons (FPMs), Belgique
3 Groupe d’Intéraction Musicale (MINT), Haute École de Musique de Genève (HEMGE), Suisse
ABSTRACT
In this project we present a series of algorithms developed to de-tect the following guitar playing techniques : bend, hammer-on,pull-off, slide, palm muting, harmonic, plucking point. Via the de-tection of these information, the instrument can be extended as anatural way to control external content (i.e. loops, audio effects,videos, light changes, etc.). The guitar used is a Godin Multiacwith an under-saddle RMC hexaphonic piezo pickup (one pickupper string, i.e six mono signals, one per string). Two exhaustivedatabases have been recorded by two different guitarists with dif-ferent playing technics (finger style picking and plectrum stylepicking) to test the different algorithms.
Off-line implementation of the algorithms are showing goodresults. A global implementation on a dedicated software seemsto be the solution to provide a more robust solution to real-timehexaphonic use. Implementation on FPGA have been investigatedas well, in order to asses the problem of the big amount of process-ing power needed for hexaphonic detection.
KEYWORDS
Guitar audio analysis, playing techniques, hexaphonic pickup, con-troller.
1. INTRODUCTION
The guitar has maintained a close relationship with technologi-cal innovation throughout its history, from acoustic to electric andnow to virtual [3]. Beyond the guitar, this virtuality has affected theway we play instruments in general. The appearance of the MIDInorm was a main event in the establishment of a communicationbetween computers and traditional instruments. With an increasedmerging of the two, instruments became more and more interfacesto control computational sound processing or (multi-)media ele-ments. The example of a MIDI keyboard controlling a sampler isone of the many examples that can be found for several years inelectronic music.
The term ”augmented instrument” is generally used for signi-fying a traditional (acoustic) instrument with added sonic possi-bilities. The augmentation can be physical like John Cage’s sonicresearch on prepared pianos, but nowadays the term has acquireda more computational signification: the use of digital audio to en-hance the sonic possibilities of a given instrument as well as theuse of sensors and/or signal analysis algorithms to give extra andexpressive controls to the player [16].
During this project, we focused on the latter kind of augmenta-tion and more particularly on the audio signal analysis algorithms,in order to transform the guitar into a multi-media controller. We
concentrated on the guitar’s playing techniques as a source for con-trolling data, so that the guitarist’s playing gestures could be usedto control or trigger any external type of media or effects.
It has to be noticed here that our system could be comparedto existing technologies like the Axon AX 50 [24] or the RolandVG-99 system [19]. These systems retrieve information, like onsetdetection and pitch-related data fitting the MIDI norm. Playingtechnics such as harmonics and palm-muted notes are absent asthey don’t have any translation in the MIDI norm. Based on afeature analysis of the raw audio from the guitar, our approach isbroader and more complete than that of the MIDI, including all themajor playing techniques used on the guitar.
2. SETUP
In order to work on the algorithms to detect the playing technicsof a guitarist, we started out by recording two extensive databasesplayed by two different guitar players. One was playing with afinger picking technique and the other one with a plectrum.
The guitar used for the recording was a Godin Multiac [8] ny-lon string guitar, equipped with custom RMC hexaphonic piezopickups. Keith McMillen String Port [14] was used as the interfacebetween the hexaphonic pickup and the computer and set up witha sampling frequency of 44 100Hz and 16 bits of depth. Sevenchannels of audio were used; one for each string and a summed6-string mono channel.
Each one of the guitarists recorded twelve sets of data, cover-ing all of the playing techniques detailed in section 3, with threelevels of attack amplitude, including all the notes between the openstrings and until the sixteenth fret.
Once the recordings were done, the segmentation part wasachieved first using Matlab and the MIR Toolbox [15]. However,in the end, the most effective method was to put markers by handusing Sonic Visualizer software [11] and then use the time code ofthese markers to segment automatically the source files.
3. EXTRACTION OF PLAYING ARTICULATIONS
The articulations used to play the guitar can vary a lot from oneguitarist to another as well as from one style to another. JonathanNorton compiled a list of all the articulations that can be foundin classical guitar playing [18] . The articulations we specificallyworked on are listed and defined (using Norton’s compiled defini-tions) below :
• hammer-on: firmly fret a note with left-hand finger with-out plucking the string with the right hand
• pull-off: after fretting a note with the left-hand finger, thesame finger plucks the string with a downward motion
41

QPSR of the numediart research program, Vol. 4, No. 3, September 2011
• bend: after fretting a note with the left-hand finger, thesame finger pushes or pulls the string without lifting
• slide / glissando: after fretting a note with left-hand finger,the same finger slides to a new note without lifting
• harmonic (natural): Slightly fret a note on a node with theleft hand, pluck the string with the right hand and then re-lease
• palm mute: pluck the string while lightly touching thestring with the side of the right palm near the bridge
• plucking point: the point where the right hand pluck thestring. This articulation is equivalent to the term bright-ness used in Norton’s list. The description is as follows :plucking near the bridge creates a brighter tone and nearthe fingerboard a warmer tone. In classical guitar littera-ture the traditional italian terminology is: sul tasto (on thefretboard) and ponticello (near the bridge).
Our project made a wide use of pitch detection in order tohelp characterizing most of the articulations cited above. It hasto be pointed out that we did not develop any pitch detector al-gorithm, as this question is a fairly well-known problem in signalprocessing. The existing algorithms, may they be based on tempo-ral or frequential techniques, gave good results on guitar signals.Therefore it didn’t seem relevant to put our efforts in developingours.
Our algorithmic approach of the articulation detection of a gui-tarist is described in figure 1. The diagram emphasizes the discrim-ination between right-hand and left-hand attack as the first impor-tant element leading to the detection of all the articulations. Pitchdetection, on its side helps characterizing all the playing technics.
After explaining how we achieve onset detection (section 4)and right-hand / left-hand attack discrimination (section 4.3), thedocument will focus on detection of the left-hand articulations(section 5) and then on the right-hand ones (section 6). Anotherapproach using the spectral modeling synthesis technics has beeninvestigated; the results are shown in section 8. Real-time imple-mentation using Max MSP software is discussed in section 9 andfirst steps on hardware implementation are described in section 10.
Figure 1: Diagram of the articulations detection algorithm
4. ONSET DETECTION
Onset detection is a specific problem within the area of music in-formation retrieval, and can be the first step in a system designed
to interpret an audio file in terms of its relevant musical events andits characteristics. Onset detectors can also be useful for triggeringaudio effects or other events. Due to its importance, it has been thefocus of quantitative evaluations benchmarks, in particular throughthe Music Information Retrieval Evaluation eXchange (MIREX),where it has been present from 2005 onwards until 2011 [17].
As a general scheme for describing onset detection approaches,one can say that they consist in three steps [1]. First, the audiosignal is pre-processed in order to accentuate certain aspects im-portant to the detection task, including filtering, separation intofrequency bands, or separation between transient and steady-stateportions of the signal. Then, the amount of data from the processedsignal is reduced in order to obtain a lower sample rate ”onset de-tection function”, generally where the onsets manifest themselvesas peaks. Finally, as those detection functions are designed to pro-duce high output values during musical onsets or abrupt events,thresholding and/or peak-picking can be applied to isolate the po-tential onsets. The following section will focus a bit more on thereduction function step. More information on onset detection canbe found also in [2].
4.1. Reduction functions
In terms of reduction, a large range of approaches have been pro-posed, including those based on amplitude or energy envelopes(as well as their time derivatives, in the linear or log domains),short-time Fourier transforms, and probability models as well asmachine learning.
Short-time Fourier transforms (STFTs), in particular the am-plitude or power spectra, or the phase spectra, or else the wholecomplex spectra, have been used in multiple papers and systems.A well known approach consists of considering the high-frequencycontent of the signal by linearly weighting each bin in propor-tion to its frequency, hence emphasizing the high-frequencies typ-ical to discontinuous portions, and especially onsets [12]. Differ-ent weighting functions have been proposed. A more general ap-proach consists of considering changes in the spectrum and formu-late detection functions as distances between consecutive STFTs,such as the so-called spectral flux approach when distance is com-puted between successive power spectra. Variants of these meth-ods make use of different distance measures as well as rectifica-tion and smoothing schemes. Discontinuities in the evolution ofthe phase spectra, and more recently of the complex spectra [28],have also been showed beneficial for onset detection.
Several improvements to this category of approaches have beenproposed earlier. Psychoacoustically motivated approaches suchas taking into account the equal loudness contours [4] have provedto be of interest. In [5], variants are proposed in terms of fre-quency bins weighting and rectification. Adaptive whitening ofthe power spectra has also been tested successfully in [22] as apre-processing step prior to computing distances between succes-sive STFTs, providing for more robustness to various sound cate-gories. Nonnegative matrix factorization has also been proposedand tested as a pre-processing step [29]. Finally, in [25], magni-tude and phase spectra are considered also in combination to theuse of pitch deviation.
The use of probability models has also been considered inthe literature. These consist in inferring the likelihood of onsetsgiven available observations as well as a model of the signal. Su-pervised machine learning approaches (including those based ongaussian mixture models, support vector machines, artificial neu-ral networks) can also be used, and have actually been shown to
42

QPSR of the numediart research program, Vol. 4, No. 3, September 2011
outperform more traditional reduction approaches [10], althoughthey are expected to fail when applied on signal or instrument cat-egories that have not been taken into account during the trainingof the detector.
4.2. Evaluation
As mentioned above, evaluation and the collection of ground truthdata are important issue [23, 13]. Evaluation campaigns with pub-lished results have been carried out, and a few publicly availablecorpora can be found too, for instance in [25], where the eval-uation compares algorithms on range of musical material cate-gories, namely bowed string instruments, wind instruments, com-plex mixed music, and pitched percussive instruments, the lateractually including acoustic guitar sequences in those evaluations.Such pitched percussive sounds, similar to percussive instruments,constitute the least difficult category for onset detection, with apublished F-Measure of 90% using the best configuration (in [25]),while for complex mixtures and wind instruments, the figure goesdown to 80%, and for bowed strings, it drops to a F-Measure of76%.
Here, we have been comparing a range of approaches on theguitar database collected for this project. Evaluation is performedusing the approach proposed in [25] and with a tolerance of plusor minus 50 ms on the timing of the detected onset to still be con-sidered as valid when compared to the reference (hand annotated)onset. Such a large tolerance value is necessary here essentiallybecause the manual annotation used as a reference is not alwaysvery accurate in terms of timing. Practically however, the methodswe compare here are more accurate with detection timing errorgenerally below half of an analysis frame (hence below 12 ms inour case).
The method we have been comparing cover a range of 18 vari-ants of amplitude-based methods (including in the energy, log-energy domains, and their time derivatives) and short-time Fouriertransforms based methods (including spectral flux in different do-mains, phase-based methods and their variants using amplitudeweighting, and complex-based methods). We have not been us-ing methods requiring a pitch estimation.
We used the monophonic recordings of the guitar signals, andoptimized the detection threshold for peak F-measure for each de-tection method individually. Table 1 presents the results for thefour best performing methods, and provide the peak F-measure onthe whole data set, as well as recall values for 4 categories of at-tacks: right-hand attack, harmonic, hammer-on, pull-off.
The four best performing methods on this data were:
• A spectral flux approach operating on the amplitude bins ofthe STFTs
• A phase divergence based approach using weighting ac-cording the the STFTs bin amplitudes
• Two methods simply making use of the amplitude of thesignal along time
We observe however that if the detection of right hand (includingwith harmonics) attacks is generally not a problem, the detectionof hammer-on and pull-off attacks is better achieved using STFTs-based methods. Indeed, a significant part of those left-hand at-tacks do not show any amplitude increase at all. Finally, the bestperforming approach has an F-measure above 96% with a recallclose to 100% for right-hand attacks, 99% for hammer-ons, and amoderate 88% for pull-offs. Some further research would hence
be necessary to understand how pull-offs can be better detected(without having recourse to pitch information).
4.3. Discrimination between left and right hand attacks
Once an onset has been detected, it is necessary to determine whetherthe attack was produced by the right or by the left hand. The righthand produces "normal" plucked attacks (finger or pick), (whichcan be further categorized as muted, bridge, soundhole, and fret-board attacks). The left hand produces two types of "legato" at-tacks: hammer-ons and pull-offs.
We experimented a method for determining right hand attacksby detecting characteristic signs of finger/pick attacks in the wave-form. As the string is plucked, the vibratory regime of the string ismomentarily stopped, resulting in a trough in the signal envelope2. The trough is shorter for pick attack than for finger attacks, butit is still well apparent in the graphical waveform presentation.
Figure 2: On the top, two notes played with no left-hand articu-lations. One can see the trough in the amplitude between the twonotes. On the bottom, the first note is played normally and thesecond one with a hammer-on. No trough is present
.
The detection of a "gap" in the signal envelope is adjacent tothe detection of an onset. The right hand attack criteria is thusdouble; an onset preceded by a short trough in the signal.
A method of "gap" detection was implemented in Max/MSP,based on a time-domain envelope follower. The application con-tinuously samples 100ms windows of signal envelope data. Whenan onset is detected, the ongoing window is polled in order to de-tect a "gap", i.e. series of values below a fixed threshold. The
43

QPSR of the numediart research program, Vol. 4, No. 3, September 2011
Method F-measure Right-hand Recall Harmonic Recall Hammer-on Recall Pull-off RecallSpectral Flux 96.2% 99.6% 100% 97.9% 88.0%Weighted Phase Divergence 95.8% 98.9% 100% 97.4% 87.6%Amplitude 92.4% 99.6% 100% 92.3% 75.2%Delta Amplitude 91.8% 99.6% 100% 91.9% 74.4%
Table 1: Results of the onset detection with four different techniques
method is fairly robust, but has the downsides of being prone tonoise (accidents in the signal) and non-operational with fast play-ing (the 100ms window is too large, and smaller windows produceless reliable results).
A reliable detection of right hand attacks opens the door forleft hand attack analysis. Once the attack is detected as not beinga right hand attack, any derivation in pitch is interpreted as a lefthand articulation. It is then necessary to distinguish between theleft hand techniques: hammer-on, pull-off, slide and bend.
5. LEFT-HAND ARTICULATIONS
Once the distinction between right-hand and left-hand attack isperformed, it is possible to categorize the left-hand articulationsby looking into the pitch profile of the note. The left hand workson the string tension and fretting, thus affecting the pitch. Ourmethod of left-hand playing technique detection operates by mea-suring the pitch derivation in time.
Hammer-on (ascending legato) is characterized by an abruptchange in pitch, as well as its counterpart, the pull-off (descendinglegato). The bend shows a slower derivation in pitch. The slide hasa pitch derivation similar to the hammer-on or pull-off, but with a"staircase" profile corresponding to the frets over which the slidingfinger passes.
As a first step, two parameters are investigated: the numberof half tones of the note transition, and the maximal relative pitchslope, defined as the maximal difference of pitch between two con-secutive frames spaced by 10ms divided by the initial pitch value(at the first note). Figure 3 shows how these two parameters aredisplayed for notes articulated with a hammer, a pulloff, a bend ora slide. It can be noted from this figure that the great majority ofbended notes are easily identified as they present a very low pitchslope. Secondly, it can be observed that for transitions with morethan one half tone, a perfect determination of slides versus ham-mers or pulloffs is achieved. As a consequence, the only remainingambiguity concerns the distinction of slides with hammers/pulloffsfor a transition of a half tone.
To address this latter issue, two parameters are extracted: theenergy ratio and the spectral center of gravity ratio. Both of themare computed on two 40ms-long frames: one ends at the transitionmiddle, while the other starts at that moment. The distribution ofthese two parameters is shown in Figures 4 and 5 for one half toneof transitions respectively for hammers vs slides, and pulloffs vsslides.
Based on the aforementioned approaches, a detection of left-hand articulated notes has been proposed simply by using a thresh-olding. The results of the ensuing classification are presented inTable 2. It can be noticed that all bend effetcs are correctly iden-tified. Slides are determined with an accuracy of 97.61%. Finally,hammers and pulloffs are detected in more than 93%. The mainsource of errors for these latter effetcs is the ambiguity with slidesof one half tone.
Figure 3: Distribution of the number of transition half tones withthe maximal relative slopes for notes with several effects of left-hand articulation: hammers, pulloffs, bends and slides.
Figure 4: Distribution of the energy ratio of one half-tone hammer-on and slide notes.
6. RIGHT-HAND ARTICULATIONS
In this section, two right-hand articulations are studied: palm mut-ing and harmonics notes.
6.1. Palm Muting
A palm muted note stifles the produced sound, which, as a conse-quence, lacks high frequencies. A frequential approach has thenbeen used to detect this type of articulations.
First, an audio waveform is transformed by using a DiscreteFourier Transform which is a decomposition of the energy of asignal along frequencies. Moreover, we know that human ear, forfrequencies lower than 1 kHz, hears tones with a linear scale in-stead of logarithmic scale for the frequencies higher that 1 kHz.Thus, we decide to use the Mel-frequency scale and separate the
44

QPSR of the numediart research program, Vol. 4, No. 3, September 2011
Figure 5: Distribution of the energy ratio of one half-tone pull-offand slide notes.
HHHHHHammer-on Pull-off Bend Slide
Hammer-on 93.27% 0.45% 0% 6.28%Pull-off 0% 93.69% 0% 6.31%Bend 0% 0% 100% 0%Slide 1.74% 0.43% 0.21% 97.61%
Table 2: Confusion matrix for detection of left-hand articulatednotes
frequency into 40 bands. It uses a linear scale below 1 kHz and alogarithmic one above 1 kHz. (Eq. 1). Figure 6 shows the Mel-spectra of a normal note and of a muted note. We calculated thearea under the curve as the difference is rather obvious betweenthe two types of notes.
mel(f) = 2595× log (1 +f
700) (1)
For each string a specific threshold has been set. Results arelisted in Tab. 3 and Tab. 4. Most of them are equal or above87.5%. However, we can observe a more difficult detection on thefirst string. It also appears that the bridge notes are closer to mutednotes than other notes.
Muted Detect Muted Detect Muted DetectString 1 String 2 String 3
Audio Files Threshold: 61 Threshold: 50 Threshold: 56Bridge 56% 0% 12.5%
Sound Hole 0% 0% 0%Neck 0% 0% 0%
Muted 75% 93.75% 100%
Table 3: Palm muting detection results (string 1 to 3)
6.2. Harmonics
The goal of this section is to distinguish when notes are played asharmonics. Two techniques are investigated for achieving this de-tection. One operates in the time domain, while the other focuseson the spectral domain. Both approaches only consider the note at-tack, which allows for a real-time detection of harmonic notes. It
0 5 10 15 20 25 30 35 400
10
20
30
40
50
60
70
80
90
100
Mel Band
Ma
gn
itu
de
Sound Hole Mel Spectrum
0 5 10 15 20 25 30 35 400
10
20
30
40
50
60
70
80
90
100
Mel Band
Ma
gn
itu
de
Muted Mel Spectrum
Figure 6: Comparisons between Mel spectra of a normal note anda muted note
has been attested that, after the attack, the differentiation betweenan harmonic and a normal note might become more difficult, es-pecially for the 7th and 12th fret. The two methods are explainedin the following.
• Time-domain approach: Figures 7 and 8 show the tem-poral shape of the waveform at the attack respectively foran harmonic and a normal note. From the attack waveform,two parameters are proposed: the attack duration is definedas the timespan during which the attack waveform remainspositive; the relative discontinuity during the attack is de-fined as Amin/Amax where these two latter amplitudesare as displayed in Figure 7.Figure 9 exhibits the distribution of these two parameters
45

QPSR of the numediart research program, Vol. 4, No. 3, September 2011
Muted Detect Muted Detect Muted DetectString 4 String 5 String 6
Audio Files Threshold: 65 Threshold: 83 Threshold: 67Bridge 12.5% 6.25% 0%
Sound Hole 0% 0% 0%Neck 0% 6.25% 12.5%
Muted 100% 87.5% 87.5%
Table 4: Palm muting detection results (string 4 to 6)
Figure 7: Attack during the production of an harmonic note. Theattack duration and the amplitude parameters for defining the rel-ative discontinuity are also indicated.
Figure 8: Attack during the production of a normal note.
for harmonic notes, as well as for normal notes played at thesoundhole, at the bridge, or at the fretboard. As expectedfrom the observation of Figures 7 and 8, an harmonic noteis generally characterized by a larger attack duration, and amore important relative discontinuity (in absolute value).
• Frequency-domain approach: Figures 10 and 11 showthe magnitude spectrum during the attack of respectivelyan harmonic and a normal note. A 40ms-long Hanning win-dow starting at the attack has been used. On these spectra, asingle parameter is extracted: the harmonic-to-subharmonicratio is defined as the difference in dB between the ampli-tude of the first harmonic (at F0) and the amplitude of thesubharmonic at 1.5 · F0.Figure 12 exhibits the distribution of the harmonic-to-subharmonicratio with the pitch value (F0) for harmonic notes, as wellas for normal notes played at the sound hole, at the bridge,
Figure 9: Distribution of the relative discontinuity during the at-tack for harmonics compared to normal notes (played at the soundhole, the bridge and the fretboard.
Figure 10: Magnitude spectrum during the attack of an harmonicnote.
Figure 11: Magnitude spectrum during the attack of a normal note.
or at the fret board. As expected from the observation ofFigures 10 and 11, an harmonic note is generally charac-terized, for a given pitch value, by a lower harmonic-to-subharmonic ratio.
Based on the two previous approaches, a detection of har-monic notes has been proposed simply by using a thresholding.The results of the ensuing classification are presented in Table
46

QPSR of the numediart research program, Vol. 4, No. 3, September 2011
Figure 12: Distribution of the pitch value and the harmonic-to-subharmonic ratio for harmonics and normal notes played at thesound hole, at the bridge and at the fret board.
5. It can be noticed that all harmonic notes are correctly identi-fied, while for normal notes, the best results are achieved for notesplayed on the fretboard (with only 0.52% of misclassification) andthe worst ones are obtained for notes played at the bridge (with abit less of 95% of correct detection).
Harmonic detection Normal detectionHarmonic 100% 0%Fretboard 0.52% 99.48%Soundhole 2.78% 97.22%
Bridge 5.38% 94.62%
Table 5: Confusion matrix for detection of harmonics.
7. PLUCKING POINT
The plucking point is a continuous parameter unlike most of thearticulations we focused on. Its value can change during play-ing while the detection of a hammer-on, e.g, is a triggering value.However, it can as well be used to trigger elements when the stringis plucked in pre-defined regions all along the strings.
7.1. State of the art
Two different approaches are present in the literature to asses thequestion of estimating the plucking point position. These two ap-proaches are based on two main physical facts that happen when astring is plucked:
• The spectrum lacks harmonics that have a node at the pluck-ing point
• Two impulses / waves run through the string in oppositedirections
The first physical fact has been used in [26] to approximatethe parameters of a comb filter delay as the power spectrum ofthe signal is similar to such shape. The calculation of the log-autocorrelation is used as a first step approximation. An iterativeprocess in the weighted least-square estimation is then needed torefine the plucking point position. It has to be noticed here that amicrophone has been placed in front of the soundhole of the guitarto record this database.
The second physical fact has been used in [9]. Here, as op-posed to the previous method, an under-saddle pickup has beenused. In this method, the minimum lag of the autocorrelation ofthe signal right after the attack is used to calculate the pluckingposition. A time-domain approach has also been used in the Axonsoftware, where the user can defined three zones going from thebridge to the beginning of the fretboard.
7.2. Algorithm
The time difference between the opposite generated impulses has aconsequence in the very few ms after the attack. Figure 13 showstypical waveforms (one for each position: bridge, normal, fret-board) of a one and a half period window starting at the attack.Depending on where the string has been plucked, the position ofthe minimum of the window appears closer to the attack as thestring is plucked further from the bridge.
Our algorithm is based on the detection of the minimum of thewindow and on the calculation of the distance between the periodand the minimum position. The process of the algorithm is goingthrough the following steps:
• Pitch detection and calculation of the period
• Attack detection
• Window of 1,5 period from the attack
• Minimum detection in the window
• Distance between minimum and period
• Normalization regarding to the pitch so that the distance isindependent of the fretted note
7.3. Evaluation
The algorithm has been tested on all the samples of both databases(finger picking and plectrum). Figure 14 shows the results of theestimation of the plucking point on the plectrum database. Thedisplayed distance is a normalized distance, 0 corresponding tothe bridge itself, 0.5 to half of the string length (the twelfth fret).It has to be mentioned here, that results from the finger pickingdatabase are nearly in the same order with a bit more overlap be-tween regions.
d < 0.1 0.1 < d < 0.233 d > 0.233Bridge 98% 2% 0%
Soundhole 4% 96% 0%Fretboard 0% 2% 98%
Table 6: Results of plucking point zones detection. d represents thevalue of the calculated distance.
Table 6 shows the results of zones detection when fixing a dou-ble threshold : one at 0.1 and the other at 0.233. The clear distinc-tion seen on figure 14 between the fretboard area (d>0.233) and thetwo others is confirmed by the percentage as none of the bridge orsoundhole audio samples has a distance superior to 0.233. How-ever, 2% of the fretboard files are not well categorized.
The discrimination between the bridge and the soundhole ar-eas is good even if figure 14 wasn’t that clear about it.
Some of the errors may come from the hand of the guitaristnot staying precisely at the same position during the recording asno marked positions were used for this experiment.
47

QPSR of the numediart research program, Vol. 4, No. 3, September 2011
Figure 13: One and a half period window from the attack for threedifferent pluck positions : bridge (approx. 2cm), soundhole (ap-prox. 10cm), fretboard (approx. 23cm)
8. SPECTRAL MODELING SYNTHESIS
Another part of the research to build the detection algorithms fo-cused on the Spectral Modeling Synthesis (SMS) method. Thismethod models sounds by their time-varying spectral characteris-tics. Our approach is based on the original method [20], but alsoon the recent improvements towards real-time implementation inPure Data with an on-the-fly analysis [6].
8.1. Method
Spectrum modeling can be used to extract parameters out of realsounds. The Sinusoids (or Deterministic) Plus Noise (or Stochas-tic) model allows more useful parameters than a simple short-timeFourier analysis. In addition to offering an easy way to modify ac-tual sounds [21, 6], this model is meaningful: sinusoidal, or deter-ministic, component normally corresponds to the main modes ofvibration of the system, whereas residual component correspondsto the energy produced by the excitation mechanism which is nottransformed by the system into stationary vibrations. In the caseof plucked strings, the stable sinusoids are the result of the mainmodes of vibration of the strings, whereas the noise is generatedby the plucking gesture on the string, but also by other non-linearbehavior of the finger-string resonator system. We thus assumethat playing mode characteristics emerge in the stochastic part of
Figure 14: Histograms of the distance calculation with the plec-trum database - Estimation of the plucking point for the three posi-tions: bridge (approx. 2cm), soundhole (approx. 10cm), fretboard(approx. 23cm) - Red circles represent the detected minimum andblue circles place the period.
the sound.The analysis starts with the extraction of the prominent peaks
from a spectrum frame [20]. This is performed through a peakcontinuation algorithm that detects the magnitude, frequency andphase of the partials present in the original sound. This resultsin the deterministic component of the considered sound signal. Apitch detection step can improve the analysis by using the funda-mental frequency information in the peak continuation algorithmand in choosing the size of the analysis window (pitch-synchronousanalysis). The stochastic component of the current frame is cal-culated by subtracting from the original waveform in the time do-main the deterministic signal obtained with additive synthesis. Thestochastic part is then obtained by performing a spectral fitting ofthe residual signal.
In our approach, we focus on the stochastic part of the signalsince we assume it holds the main characteristics of the playingmodes. We thus synthesize the stochastic part generating a noisesignal with the time-varying spectral shape obtained in the anal-ysis. This signal will be further studied to extract prominent fea-tures. The pre-analysis with SMS is also a way to consider theplaying modes independently of the played note since the deter-ministic component has been removed.
8.2. Results
We perform the SMS analysis using the libsms [6] on the recordeddatabase. Except for the harmonic mode, all the recordings con-sist of one note plucked and the second note played in the specificplaying technique. Parameters for analysis are the ones used for
48

QPSR of the numediart research program, Vol. 4, No. 3, September 2011
Figure 15: Example of bend playing mode: string 3, fret 6; origi-nal signal (top), stochastic part of the signal extracted with a SMSanalysis
the example of acoustic guitar chord, proposed by libsms. It treatsthe guitar chord as an inharmonic signal and suggests to track 200partials with a very short minimum track length. The lowest fre-quency tracked is set to 85 Hertz and a hamming window is chosento allow for sub-band frequencies.
To verify our hypothesis that the stochastic part of the recordedsignal comprises the main characteristics of the playing techniques,we focused on the bend samples. This playing technique has ratherno excitation mechanism. Our assumption is verified in the Fig-ure 15: the only amplitude detected in the residual signal corre-sponds to the plucked note in the beginning of the recording.
For all extracted stochastic signals, unexpected amplitudes ariseat the end of the signals. This must be due to the abrupt end of therecordings and to the fact that the SMS analysis considers it aspart of the noisy component. We do no take it into account in theobservation.
If we observe the stochastic signals extracted from the pulloff(Figure 16), the slide (Figure 17) and the hammer-on (Figure 18)playing modes , we can notice that the shape of the signals differsaccording to the playing mode: the pulloff and the hammer-onplaying modes show a clear impulse in the signal, which is not thecase for the slide playing mode. The hammer-on playing modedemonstrates smaller amplitude values on average, which must bedue to the fact that the main part of the recording signal has beenconsidered as sinusoidal component. This is rather consistent sincea hammer excitation should give a richer spectrum, thus a largerdeterministic amount of signal.
We perform statistics (standard deviation, kurtosis and skew-ness) directly on the stochastic signals for the four playing modes.
Figure 16: Two examples of pulloff playing mode: stochastic partof the signal extracted with a SMS analysis
We use SVM for classification of playing modes’ pairs (see Ta-ble 7). The average rate for all the classification is 88.33% ofgood results.
8.3. Conclusion and Discussion
The achieved results show interesting trends. However, the av-erage success rate is not strong enough to be considered as sig-nificant for playing techniques classification. Even though, weare convinced that extracting the stochastic signal is a promisingmethod. More work is needed to ensure the results.
First, it has to be noticed that some difficulties may arise dueto differences in amplitude among recordings. Indeed, strongerthe excitation mode is, richer the spectrum may appear, which maygive different results among recordings of a playing mode and con-sequently, different outputs for stochastic signal extraction. Thus,a more homogeneous sound database may improve the results.
As noticed by Serra [20], separation between deterministicand stochastic components of a sound is often not obvious. Thedeterministic part is assumed to be restricted to sums of quasi-sinusoidal components where each sinusoid models a narrowbandcomponent of the original sound and is described by an amplitudeand a frequency function. On the other hand, the stochastic part isgenerally described as filtered white noise, thus it hardly preserveseither the instantaneous phase or the exact magnitude details ofindividual FFT frames. In particular, the model is not adequatewhen sounds include noisy partials. Moreover, transients, suchas onsets, evolve too fast to be precisely represented by the sinu-soidal part, even if their phase values are not stochastic. Eakin etal. [6] recommend further methods in this case [27, 7]. Even if the
49

QPSR of the numediart research program, Vol. 4, No. 3, September 2011
Figure 17: Two examples of slide playing mode: stochastic part ofthe signal extracted with a SMS analysis
SMS method is flexible enough to give the user some controls [6],these parameters are difficult to apply in a real-time process. Inour case, more work has to be done to evaluate specific parametersfor strings sounds.
9. SOFTWARE IMPLEMENTATION
In order to demonstrate some possible uses of the data acquired viaour ”guitar as controller” analysis algorithms, we implemented aseries of data-to-sound applications in Max/MSP. The idea wasto allow for a sensitive and intuitive control of audio effects bythe guitar player, directly via the intonations of the playing itself.We were looking for a system offering a more sensitive control ofguitar effects than the traditional pedal-type controllers, where theplayer would feel more ”in contact” with the audio processing viathe minute hand/finger movements of the various techniques.
The articulation-to-sound mappings were the following:
• Mute -> octaver (-1 octave): a detected "muted" note setsan Octaver effect on, producing an electric bass-type sound.The player can switch from "normal" sound to a "bass"sound by simply applying palm muting on the strings.
• Bend -> wah wah filter Q: the bend gesture is used to con-trol a wah-wah filter’s frequency, creating a wailing effecton the bent notes. This effect is very sensual and "bluesy",as the expressiveness of the bent notes is accentuated by thefilter sweep.
• Harmonics -> reverse delay: once a harmonic note is de-tected, a reverse delay is applied on the signal, creating a"space" effect on the tone.
Figure 18: Two examples of hammer-on playing mode: stochasticpart of the signal extracted with a SMS analysis
• Hammer-on & pull-off -> cross synthesis with a percus-sive sound: the percussive gestures of the hammer-on andpull-off techniques are made audible by merging the origi-nal guitar sound with a pre-recorded percussive sound, e.g.a bass clarinet "slap" effect. The resulting hybrid tone em-phasizes the percussive quality of the notes, creating a newgesture-sound articulation on the guitar.
• Plucking point -> granular synthesis: the attack positionon the string is mapped into a granular synthesizer . Whilethe "normal" (i.e. soundhole) attack produces no granulareffect, the more the attack approaches the bridge, the morehigh-frequency "grains" (+1 and +2 octaves) are mixed intothe sound output. In a similar manner, the attacks on thefingerboard zone produce a sound output mixed with low-frequency (-1 or octaves) grains.
These mappings constitute the first effort of real-time imple-mentation and musical use of our work on guitar articulations de-tection. The results are encouraging, producing a real feeling ofgestural control of the sound processing: the guitarist feels thathis/her gestures are closely connected to the produced sound.
However, the real-time implementation highlights numerousproblems inherent to the connection of a live musical instrumentplaying to a computational feature analysis system. The mainchallenge is the constant variation in the way the articulations areplayed in a real musical setting. The samples recorded into ourdatabase constitute "laboratory" examples of guitar articulationswhereas the live rendition of the same techniques may give rise toquite different data sets. Guitar playing in a "real" musical con-text is a extensively complex environment and it is very difficult to
50

QPSR of the numediart research program, Vol. 4, No. 3, September 2011
HHHHHBEND HAMMER PULLOFF SLIDE
BEND 100% 100% 100%HAMMER 100% 70% 85%PULLOFF 100% 70% 75%
SLIDE 100% 85% 75%
Table 7: Percent of good results for playing modes classificationusing SVM on stochastic signal statistics (standard deviation, kur-tosis and skewness) applied on stochastic signals. We used a train-ing group of 48 recordings, 12 by playing modes and a test groupof 20 recordings, 5 by playing modes.
model and articulate with automated feature extraction.
10. HARDWARE
This stage of the project intends to research and test candidatetechnologies able to provide features on power processing and sig-nal conversion inside the guitar. The hardware requirements are:
• to be installable on a guitar (low power, small, stand-alone),• to be stand-alone solution able to perform the features pro-
cessing (no PC dependences),• to provide high quality hexaphonic to digital conversion,• to supply a standard data output (e.g, USB),• to offer easy integration of drivers for general sound pro-
cessing software.
The distinct elements of the proposed hardware architectureare shown on figure 19. It is based on a field-programmable gatearray (FPGA) component combining three general functions: con-trol of digital sound conversion, the extraction of the playing tech-nics and exporting the features data over the USB driver. Themain advantage of FPGA over a microprocessor is its native par-allel processing capacity. Processing time constrains are found ontwo functions in particular: digital audio conversion and featuresprocessing. They both require parallel processing in order to over-come performance restrictions. The different parts of the systemare listed below:
• Digital Audio Conversion: the hexaphonic pickupused in the guitar yields six independent analog audio sig-nals, one per string. The conversion of analog signals todigital is performed by four WM8782 Wolfson 1 high per-formance stereo audio ADCs: SNR 100dB, up to 192khzper channel, up to 24bits of resolution, DC off-set low-passdigital filter, etc. Despite good ADC technical character-istics, the challenge is to drive the eight ADCs at the sametime in order to reach high quality of audio conversion. Par-allel control is thus required. The choice of FPGA solutionallows simultaneous execution of control and communica-tion of each ADC chip in order to achieve the max compo-nents’ throughput. The ADCs can be seen in the figure 20.
• FPGA: the prototype used a DE0-Nano development boardfrom Terasic2 featuring an Altera3 Cyclone IV FPGA de-vice, up to 22,320 Logical Elements, SDRAM and EEP-ROM memory on board, two external GPIO headers (40
1http://www.wolfsonmicro.com2http://www.terasic.com3http://www.altera.com
Figure 20: Electronic parts of developed prototype: ADCs, FPGAand USB driver.
digital I/O), board programming by USB mini-AB port.The component has enough processing power to supportall processing required for this project. The two controlblocks (ADCs and USB) were built and the system is readyto receive the feature processing algorithms when they areimplemented. The FPGA component and board are shownin figure 20.Concerning the FPGA programming, some issues shouldbe underlined. First of all, FPGAs have a particular pro-gramming mode which is completely distinct of computersystems. Many FPGA tools and solutions have been pro-posed and launched in the market in order to make it com-parable to ordinary programming style. Some of them areusing SIMULINK-Matworks4 DSP programming environ-ment as visual interface to program FPGAs with DSP func-tions, such as: DSPbuilder from Altera and SystemGen-erator from Xilinxs5. The idea is to extend the use of awell known DSP programming environment with purposeto program the FPGAs with the same style of function-blocks used on SIMULINK. The DSPbuilder was chosento be experimented in this project, whose part of the ”pro-gram” developed to control ADC and USB blocks are seenin figure 21.DSPbuilder has a function-blocks library compliant to SI-MULINK model. In this way, these blocks can be simu-lated and after synthesized to the FPGA. However, DSP-
4http://www.mathworks.nl/products/simulink/index.html
5http://www.xilinxs.com
51

QPSR of the numediart research program, Vol. 4, No. 3, September 2011
Figure 19: Proposed hardware architecture: summary of functional blocks.
Figure 21: Control ADC and USB blocks developed in DSPbuildersystem.
builder library doesn’t have an equivalent for all SIMU-LINK block-sets and, further, its function-blocks containextra constraints not found in the SIMULINK blocks. Con-sequently, a developer must learn how to use the SIMU-LINK-like programming even if he knows SIMULINK verywell. Because of that, the time used in learning the toolhas exceeded a lot the initial expectation, preventing fromputting efforts on extraction features functions running onthe FPGA.Despite of learning time, it can also incorporate many ben-efits such as shorter development time, a proven increase incode efficiency, floating-point development with the fused-datapath tool flow, floating-point vector processing to sup-port linear algebra operations, reduced development andverification efforts with DSP Builder Advanced Blockset,floating-point and fixed-point library functions, etc.
• USB driver: data communication between electronicdevices using USB is widely adopted in information tech-nology industry since twenty years. This spread technol-ogy can be incorporated in systems by USB driver mod-ules, which are engaged on performing all USB protocollayers. The interface of hardware-to-USBdriverChip is im-plemented by simple serial data communication. And theinterface USBdriverChip-to-PC can be developed using aserial port emulator (called VPN virtual COMM port) or
calls of communication functions from inside the program-ming codes (called D2XX direct driver). This last one wasused in our development as it is faster than VPN mode:12Mbaud/sec on VPN versus 480Mbits/s on D2XX mode.Also, it can quickly be integrated on OSC and / or MIDIfunctions for sound applications codes. The FT232H mod-ule from FTDI6 was exploited in this project as shown inthe figure 20.
11. CONCLUSION
The guitar as controller Numediart project focused on features ex-traction from a hexaphonic guitar signal, in order to detect andrecognize all the playing techniques commonly used on this instru-ment. The methodology was built on the consecutive discretisationof 1) attacks / note onsets, 2) left-hand and right-hand articula-tions, 3) articulation types: "normal", mute, bend, slide, hammer-on, pull-off, harmonic, palm muting and plucking point.
A set of custom detection algorithms was developed off-linein Matlab and real-time in Max/MSP, showing a general detectionsuccess rate of approx. 90%. for all the techniques. These resultsgive a proof of concept for a general guitar playing techniques de-tection software. However, the project’s framework did not allowfor the compilation of all the algorithms into one single software,because of power processing issues. In order to propose a func-tional playing techniques detector, numerous challenges must stillbe faced.
Regarding the hardware part, the conceived architecture canbe used with an ordinary PC or a small embedded platform run-ning a DSP application. The last option would allow a stand-alonesystem be integrated to the guitar. We have experimented Super-Collider7 sound processing software running on Linux into a Gum-stix8 board. It has proved to be a quality and reliable solution forembedded sound application. Both approaches must be exploredin future development in order to have a true effective application.
The transfer of non-real-time Matlab algorithms into real-timeapplication (e.g. Max/MSP or FPGA implementation) is not yetcomplete. Moreover, one must proceed towards more comprehen-sive tests on the algorithms on other types of guitars, as well asother players. Live guitar playing is a complex object for signalanalysis, and a prolongated effort of system testing and "tuning" isnecessary in order to provide a robust software or hardware imple-mentation.
6http://Ltd.www.ftdi.com7http://supercollider.sourceforge.net8http://www.gumstix.com
52

QPSR of the numediart research program, Vol. 4, No. 3, September 2011
12. ACKNOWLEDGMENTS
numediart is a long-term research program centered on DigitalMedia Arts, funded by Région Wallonne, Belgium (grant N◦716631).
13. REFERENCES
13.1. Scientific references
[1] Juan Pablo Bello et al. “A Tutorial on Onset Detection inMusic Signals”. In: IEEE Transactions on Speech and Au-dio Processing, 16 (5) (2005). P.: 42.
[2] Paul M. Brossier. “Automatic Annotation of Musical Audiofor Interactive Applications”. PhD thesis. Centre for DigitalMusic Queen Mary, University of London, 2006. P.: 42.
[3] Gavin Carfoot. “Acoustic, Electric and Virtual Noise: TheCultural Identity of the Guitar”. In: Leonardo Music Jour-nal 16 (2006). Pp. 35–39. P.: 41.
[4] Nick Collins. “A Comparison of Sound Onset Detection Al-gorithms with Emphasis on Psychoacoustically MotivatedDetection Functions”. In: 118th Audio Engineering SocietyConvention. Barcelona 2005. P.: 42.
[5] Simon Dixon. “Onset Detection Revisited”. In: 9th Int.Conference on Digital Audio Effects (DAFx-06). Montreal,Canada 2006. P.: 42.
[6] R. T. Eakin and Xavier Serra. “SMSPD, LIBSMS and aReal-Time SMS Instruments”. In: International Conferenceon Digital Audio Effects. Cosmo, Italy 2009. Pp.: 48–50.
[7] Kelly Fitz, Lippold Haken, and Paul Chirstensen. “Tran-sient Preservation under Transformation in an AdditiveSound Model”. In: Proceedings of the International Com-puter Music Conference. Berlin 2000. P.: 49.
[9] Vesa Välimäki Henri Pettinen. “A time-domain approach toestimating the plucking point of guitar tones obtained withan under-saddle pickup”. In: Applied Acoustics. Vol. 65. 12.2004. Pp. 1207–1220. P.: 47.
[10] Alexandre Lacoste and Douglas Eck. “A SupervisedClassification Algorithm for Note Onset Detection”. In:EURASIP Journal on Advances in Signal Processing 2007(2007). P.: 43.
[12] P. Masri. “Computer Modeling of Sound for Transforma-tion and Synthesis of Musical Signal”. PhD thesis. Univ. ofBristol, 1996. P.: 42.
[13] “Methodology and Tools for the Evaluation of AutomaticOnset Detection Algorithms in Music”. In: Int. Symp. onMusic Information Retrieval. Beijing, China 2004. P.: 43.
[16] Eduardo Reck Miranda and Marcelo Wanderley. “New dig-ital musical instruments: control and interaction beyondthe keyboard”. In: Computer music and digital audio se-ries. Ed. by Wisconsin A-R Editions Middleton. Vol. 21.2006. URL: http://eleceng.ucd.ie/~pogrady/papers/OGRADY_RICKARD_ISSC09.pdf. P.: 41.
[17] Music Information Retrieval Evaluation eX-change (MIREX). URL: http : / / www . music -ir.org/mirex/wiki/2011:Main_Page. P.: 42.
[18] Jonathan Carey Norton. “Motion capture to build a founda-tion for a computer-controlled instrument by study of clas-sical guitar performance”. PhD thesis. CCRMA, Dept. ofMusic, Stanford University, 2008. P.: 41.
[20] X. Serra. “A System for Sound Analysis-Transformation-Synthesis based on a Deterministic plus Stochastic Decom-position”. PhD thesis. CCRMA, Dept. of Music, StanfordUniversity, 1989. Pp.: 48, 49.
[21] X. Serra. “Musical Sound Modeling with Sinusoids plusNoise”. In: Musical Signal Processing. Ed. by Roads et al.Swets & Zeitlinger, 1997. Pp. 91–122. ISBN: 90 265 14824. P.: 48.
[22] Dan Stowell and Mark Plumbley. “Adaptive Whitening forImproved Real-Time Audio Onset Detection”. In: 2007. P.:42.
[23] Koen Tanghe et al. “Collecting Ground Truth Annotationsfor Drum Detection in Polyphonic Music”. In: 6th Inter-national Conference on Music Information Retrieval. 2005.P.: 43.
[25] “Three Dimensions of Pitched Instrument Onset Detec-tion”. In: IEEE Transactions on Audio, Speech and Lan-guage Processing 18 (6) (2010). Pp.: 42, 43.
[26] Caroline Traube and Philippe Depalle. “Extraction of theexcitation point location on a string using weighted least-square estimation of comb filter delay”. In: Proceedingsof the Conference on Digital Audio Effects (DAFx). 2003.URL: http://www.elec.qmul.ac.uk/dafx03/proceedings/pdfs/dafx54.pdf. P.: 47.
[27] Tony S. Verma and Teresa H. Y. Meng. “Extending SpectralModeling Synthesis with Transient Modeling Synthesis”.In: Comput. Music J. 24 (2 2000). Pp. 47–59. ISSN: 0148-9267. DOI: 10.1162/014892600559317. P.: 49.
[28] Yu Shiu Wan-Chi Lee and C.-C. Jay Kuo. “Musical OnsetDetection with Joint Phase and Energy Features”. In: IEEEInternational Conference on Multimedia and Expo. Beijing,China 2007. P.: 42.
[29] Wenwu Wang et al. “Note Onset Detection via Nonnega-tive Factorization of Magnitude Spectrum”. In: EURASIPJournal on Advances in Signal Processing 2008 (2008). P.:42.
13.2. Artistic references
[8] Godin. Godin Multiacs. 2000. URL: http://www.godinguitars.com/godinacsp.htm. P.: 41.
[11] Queen Mary University of London. Sonic Visualizer. URL:http://www.sonicvisualiser.org/. P.: 41.
[14] Keith Mc Millen. StringPort. URL: http://www.keithmcmillen.com. P.: 41.
[15] Mir Toolbox. URL: https://www.jyu.fi/hum/laitokset / musiikki / en / research / coe /materials/mirtoolbox. P.: 41.
[19] Roland. Roland VG-99 pitch to midi converter. 2000.URL: http://www.rolandus.com/products/productdetails.php?ProductId=849. P.: 41.
53
QPSR of the numediart research program, Vol. 4, No. 3, September 2011
[24] Axon Technology. Axon AX 50 USB pitch to midi converter.2000. URL: http://www.axon-technologies.net/. P.: 41.
13.3. Software and technologies
[1] Juan Pablo Bello et al. “A Tutorial on Onset Detection inMusic Signals”. In: IEEE Transactions on Speech and Au-dio Processing, 16 (5) (2005). P.: 42.
[2] Paul M. Brossier. “Automatic Annotation of Musical Audiofor Interactive Applications”. PhD thesis. Centre for DigitalMusic Queen Mary, University of London, 2006. P.: 42.
[3] Gavin Carfoot. “Acoustic, Electric and Virtual Noise: TheCultural Identity of the Guitar”. In: Leonardo Music Jour-nal 16 (2006). Pp. 35–39. P.: 41.
[4] Nick Collins. “A Comparison of Sound Onset Detection Al-gorithms with Emphasis on Psychoacoustically MotivatedDetection Functions”. In: 118th Audio Engineering SocietyConvention. Barcelona 2005. P.: 42.
[5] Simon Dixon. “Onset Detection Revisited”. In: 9th Int.Conference on Digital Audio Effects (DAFx-06). Montreal,Canada 2006. P.: 42.
[6] R. T. Eakin and Xavier Serra. “SMSPD, LIBSMS and aReal-Time SMS Instruments”. In: International Conferenceon Digital Audio Effects. Cosmo, Italy 2009. Pp.: 48–50.
[7] Kelly Fitz, Lippold Haken, and Paul Chirstensen. “Tran-sient Preservation under Transformation in an AdditiveSound Model”. In: Proceedings of the International Com-puter Music Conference. Berlin 2000. P.: 49.
[8] Godin. Godin Multiacs. 2000. URL: http://www.godinguitars.com/godinacsp.htm. P.: 41.
[9] Vesa Välimäki Henri Pettinen. “A time-domain approach toestimating the plucking point of guitar tones obtained withan under-saddle pickup”. In: Applied Acoustics. Vol. 65. 12.2004. Pp. 1207–1220. P.: 47.
[10] Alexandre Lacoste and Douglas Eck. “A SupervisedClassification Algorithm for Note Onset Detection”. In:EURASIP Journal on Advances in Signal Processing 2007(2007). P.: 43.
[11] Queen Mary University of London. Sonic Visualizer. URL:http://www.sonicvisualiser.org/. P.: 41.
[12] P. Masri. “Computer Modeling of Sound for Transforma-tion and Synthesis of Musical Signal”. PhD thesis. Univ. ofBristol, 1996. P.: 42.
[13] “Methodology and Tools for the Evaluation of AutomaticOnset Detection Algorithms in Music”. In: Int. Symp. onMusic Information Retrieval. Beijing, China 2004. P.: 43.
[14] Keith Mc Millen. StringPort. URL: http://www.keithmcmillen.com. P.: 41.
[15] Mir Toolbox. URL: https://www.jyu.fi/hum/laitokset / musiikki / en / research / coe /materials/mirtoolbox. P.: 41.
[16] Eduardo Reck Miranda and Marcelo Wanderley. “New dig-ital musical instruments: control and interaction beyondthe keyboard”. In: Computer music and digital audio se-ries. Ed. by Wisconsin A-R Editions Middleton. Vol. 21.2006. URL: http://eleceng.ucd.ie/~pogrady/papers/OGRADY_RICKARD_ISSC09.pdf. P.: 41.
[17] Music Information Retrieval Evaluation eX-change (MIREX). URL: http : / / www . music -ir.org/mirex/wiki/2011:Main_Page. P.: 42.
[18] Jonathan Carey Norton. “Motion capture to build a founda-tion for a computer-controlled instrument by study of clas-sical guitar performance”. PhD thesis. CCRMA, Dept. ofMusic, Stanford University, 2008. P.: 41.
[19] Roland. Roland VG-99 pitch to midi converter. 2000.URL: http://www.rolandus.com/products/productdetails.php?ProductId=849. P.: 41.
[20] X. Serra. “A System for Sound Analysis-Transformation-Synthesis based on a Deterministic plus Stochastic Decom-position”. PhD thesis. CCRMA, Dept. of Music, StanfordUniversity, 1989. Pp.: 48, 49.
[21] X. Serra. “Musical Sound Modeling with Sinusoids plusNoise”. In: Musical Signal Processing. Ed. by Roads et al.Swets & Zeitlinger, 1997. Pp. 91–122. ISBN: 90 265 14824. P.: 48.
[22] Dan Stowell and Mark Plumbley. “Adaptive Whitening forImproved Real-Time Audio Onset Detection”. In: 2007. P.:42.
[23] Koen Tanghe et al. “Collecting Ground Truth Annotationsfor Drum Detection in Polyphonic Music”. In: 6th Inter-national Conference on Music Information Retrieval. 2005.P.: 43.
[24] Axon Technology. Axon AX 50 USB pitch to midi converter.2000. URL: http://www.axon-technologies.net/. P.: 41.
[25] “Three Dimensions of Pitched Instrument Onset Detec-tion”. In: IEEE Transactions on Audio, Speech and Lan-guage Processing 18 (6) (2010). Pp.: 42, 43.
[26] Caroline Traube and Philippe Depalle. “Extraction of theexcitation point location on a string using weighted least-square estimation of comb filter delay”. In: Proceedingsof the Conference on Digital Audio Effects (DAFx). 2003.URL: http://www.elec.qmul.ac.uk/dafx03/proceedings/pdfs/dafx54.pdf. P.: 47.
[27] Tony S. Verma and Teresa H. Y. Meng. “Extending SpectralModeling Synthesis with Transient Modeling Synthesis”.In: Comput. Music J. 24 (2 2000). Pp. 47–59. ISSN: 0148-9267. DOI: 10.1162/014892600559317. P.: 49.
[28] Yu Shiu Wan-Chi Lee and C.-C. Jay Kuo. “Musical OnsetDetection with Joint Phase and Energy Features”. In: IEEEInternational Conference on Multimedia and Expo. Beijing,China 2007. P.: 42.
[29] Wenwu Wang et al. “Note Onset Detection via Nonnega-tive Factorization of Magnitude Spectrum”. In: EURASIPJournal on Advances in Signal Processing 2008 (2008). P.:42.
54
QPSR of the numediart research program, Vol. 4, No. 3, September 2011
RT-MEDIACYCLE : TOWARDS A REAL-TIME USE OF MEDIACYCLE INPERFORMANCES AND VIDEO INSTALLATIONS
Xavier Siebert 1, Stéphane Dupont 2, Christian Frisson 2, Bernard Delcourt 3
1 Laboratoire de Mathématique et Recherche Opérationnelle (MathRo), Université de Mons (UMONS), Belgique2 Laboratoire de Théorie des Circuits et Traitement du Signal (TCTS), Université de Mons (UMONS), Belgique
3 Video artist, Brussels, Belgique.
1. ABSTRACT
This project aims at developing tools to extend the use of theMediaCycle software to live performances and installations. Inparticular, this requires real-time recording and analysis of me-dia streams (e.g., video and audio). These tools are developed aspatches for the Puredata (Pd) software [10] which is widelyused by the artistic community. This project is a collaborationwith the Belgian video artist Bernard Delcourt [2] who will in-corporate MediaCycle in his interactive video installations andperformances in Spring 2012.
2. INTRODUCTION
The MediaCycle software [13] has been developed at numediartto classify multimedia databases (sounds, images, videos, texts,. . . ) based on the similarity among the content of these media.Artistic applications to which this software has contributed (e.g.,Bud Blumenthal’s DANCERS!1, Thomas Israel’s Méta-Crâne, . . . )implied up to now an analysis of pre-recorded media.
The goal of this project is therefore to develop software toolsto display and organize media recorded on-the-fly. To this end, wehave developed a set of tools written in Puredata (Pd) [10] andintented for the artistic community, to accomplish the followingtasks:
• record sounds and videos
• segment videos
• manage a playlist of videos to be displayed
• handle a multi-screen projection system, with options toshow and manipulate (mix, fade, loop, . . . ) videos
• communicate by OSC between MediaCycle and the Pdpatches
These tools will be described in the following section.
3. Pd PATCHES
3.1. Audio and Video Recordings
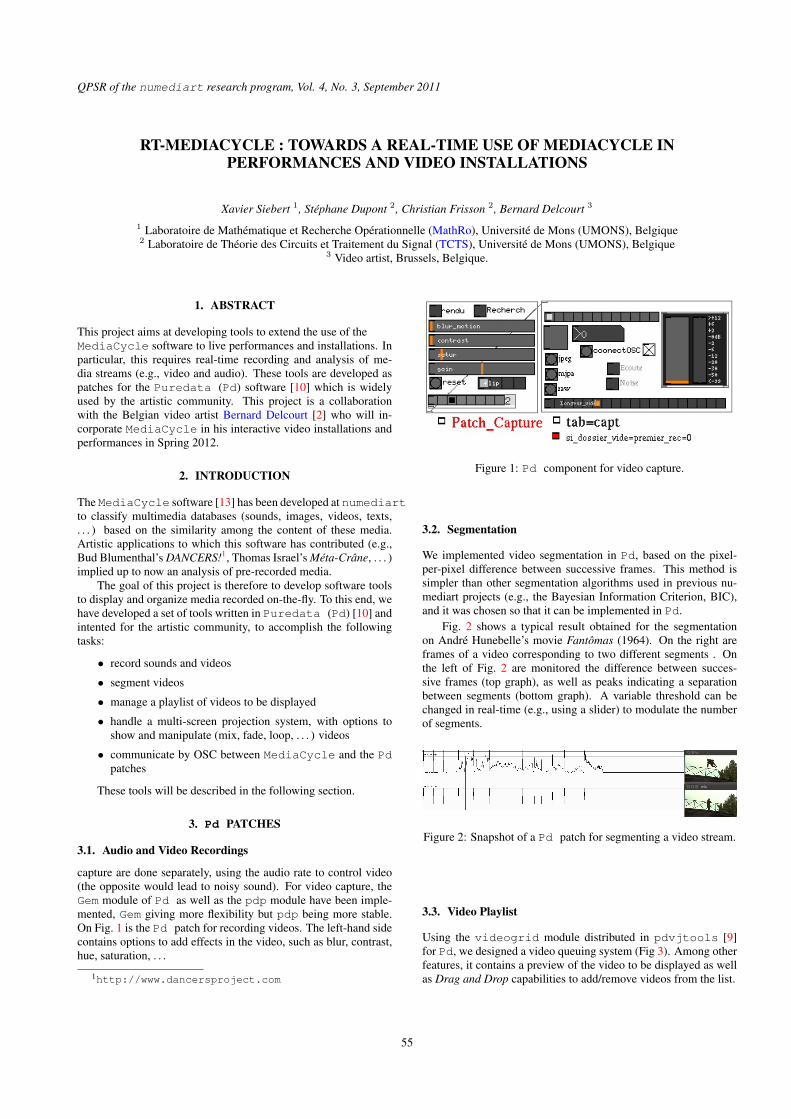
capture are done separately, using the audio rate to control video(the opposite would lead to noisy sound). For video capture, theGem module of Pd as well as the pdp module have been imple-mented, Gem giving more flexibility but pdp being more stable.On Fig. 1 is the Pd patch for recording videos. The left-hand sidecontains options to add effects in the video, such as blur, contrast,hue, saturation, . . .
1http://www.dancersproject.com
Figure 1: Pd component for video capture.
3.2. Segmentation
We implemented video segmentation in Pd, based on the pixel-per-pixel difference between successive frames. This method issimpler than other segmentation algorithms used in previous nu-mediart projects (e.g., the Bayesian Information Criterion, BIC),and it was chosen so that it can be implemented in Pd.
Fig. 2 shows a typical result obtained for the segmentationon André Hunebelle’s movie Fantômas (1964). On the right areframes of a video corresponding to two different segments . Onthe left of Fig. 2 are monitored the difference between succes-sive frames (top graph), as well as peaks indicating a separationbetween segments (bottom graph). A variable threshold can bechanged in real-time (e.g., using a slider) to modulate the numberof segments.
Figure 2: Snapshot of a Pd patch for segmenting a video stream.
3.3. Video Playlist
Using the videogrid module distributed in pdvjtools [9]for Pd, we designed a video queuing system (Fig 3). Among otherfeatures, it contains a preview of the video to be displayed as wellas Drag and Drop capabilities to add/remove videos from the list.
55

QPSR of the numediart research program, Vol. 4, No. 3, September 2011
Figure 3: Pd patch for video playlist.
3.4. Multi-screen projection system
In the context of artistic performances/installation, it is often in-teresting to display selected videos on different screens. Thereforewe also developed a patch for multi-screen projection. It has beenused for the moment with 2 or 3 screens at a time (see Fig. 4),but can also be used for more screens, depending on the availablemachine resources.
Figure 4: Pd patch for projection on three screens. The threevideos to be projected on the screens are in the top, while the li-brary is in the bottom. Also visible on the right is a preview of thenext video to be added in the playlist.
3.5. OSC Communication
We updated our implementation of the remote control of Media-Cycle through the OSC communication protocol (summarised inTable. 1), following up the partial coverage started in 2010 [3]. Itallows the communication with the core engine of MediaCyclethrough any graphical interface or external controllers.
This OSC namespace is likely to be again further more ex-tended in future numediart projects.
4. OVERVIEW OF THE COMPLETE SYSTEM
Figure 5 represents a schematic of the Pd patches that have beendeveloped, and their interaction with MediaCycle, while Figure6 shows the current system as it would be used in a performance.
OSC tag Dir. Type Range Comment
move/xy in float [0, size] move camera to x . . .in float [0, size] . . . and y
hover/xy in float [0, size] hover on x . . .in float [0, size] . . . y
zoom in float > 0 zoom view by factorrotate in float [0, 360] rotate view by factor
recenter in - - reset viewforward in - - enter in cluster
back in - - exit clustermediaID out int [0, n-1] Id of the current media
getknn in int [0, n-1] ask k nearest neighborsout int[k] [0, n-1] return k neighbor id’s
getkffin int [0, n-1] first k . . .in int [0, nfeat] . . . for a given feature
out int[k] [0, n-1] return k id’s askedfeature/i in int - toggle feature i on/off
add/s in string - add media fileremove/i in int [0, n-1] remove media from id
Table 1: OSC namespace of the MediaCycle browser, with thedirection (in: parameter, out: return value), the type and range ofthe transmitted variables. The double horizontal line separates theprevious implementations (top) from the recent (bottom).
5. PERSPECTIVES
For the moment the video streaming is managed by the Pd patches.The video stream is then segmented in Pd (either manually, or bya separate segmentation patch described in section 3.2) and sent toMediaCycle, to be incorporated in its database. Alternatively,streaming could be fully incorporated in MediaCycle, for ex-ample using GStreamer [4] which could also synchronize au-dio and video. For the moment the only media type that can bestreamed within MediaCycle is video, using the OpenCV_2.3library. Other streaming technologies could also be incorporated[1].
5.1. Discovering GStreamer throughout installing scenic forteleperformances
In the framework of Transat/Contamines, the collaborative researchprogram in digital art led by Transcultures (Mons) [14] and LaSociété des Arts Technologiques (SAT) (Montreal) [5], numedi-art hosted its first teleperformance on Saturday Dec 3rd, 2011.Two Belgian artists (Valérie Cordy and Laurence Moletta) and twoCanadian artists (Alexandre Quessy and Michal Seta) performeda joint transatlantic “digital soup”. numediart provided its tech-nological know-how for running scenic [6], a telepresence soft-ware developed by SAT. Two video streams and two stereo audiostreams were sent from each side of the ocean. For that purposewe set up 2 macbook pro laptops with Ubuntu 10.04 (the currentproduction distribution for scenic). This teleperformance openedthe doors for further international real-time collaboration on digitalart.
The major advantage of scenic is to provide an user-friendlywrapper over gstreamer tuned for teleperformances, usable fromthe command-line with its milhouse engine or using the scenicGUI. Gstreamer allows to process audio and video streams throughpipelines, processing file and streams seamlessly and similarly.
56

QPSR of the numediart research program, Vol. 4, No. 3, September 2011
Figure 5: Organisation of the various components of the tool.
Figure 6: Snapshot of most components used together: videocapture, playlist and projection (all three in Pd) interacting withMediaCycle.
Pipelines can be run using various language wrappers or from aterminal launcher, for example, to visualize the default webcam(source) on a default window (sink) on OSX:
gst-launch qtkitvideosrc ! colospace ! ximagesink
Various plugins are available for GStreamer, including OpenCVbindings. Among other applications based on GStreamer, the clos-est to MediaCycle is Mirage [11, 12], a plugin for automatic playlistgeneration based on music information retrieval for the music col-lection manager Banshee.
GStreamer is quite a promising candidate for handling streamsin MediaCycle, but still suffers from lack of OSX testing and doc-umentation (our main OS for development), the simplest "hello-world" pipeline described above required thorough manual tweak-ing for installing GStreamer libraries using MacPorts. Moreover,integrating GStreamer into MediaCycle would require a major re-work of the architecture, not only converting feature extractionplugins as GStreamer plugins, but basing the whole processingpipeline on GStreamer. Complementarily, the PdGst GStreamer li-brary for PureData [15] might allow to reuse rapidly these GStrea-mer-based MediaCycle feature extraction plugins into PureData.
5.2. Easing the installation of MediaCycle by setting up an on-line repository with pre-compiled dependencies for Ubuntu
Bernard Delcourt opted for the most recent Long Term Serviceversion of Ubuntu that was released in April 2010, a safe choicefor stability. Since some major dependencies of MediaCycle (Ar-madillo, FFmpeg, OpenCV, OpenSceneGraph) are still not up-to-date for that Ubuntu release, we opened a numediart Launch-Pad team [7] and a first numediart-deps Personal PackageArchive (PPA) repository [8] so as to package more recent versionsof these dependencies notably for Ubuntu 10.04 (and upwards), tomake proper MediaCycle packages depending on these dependen-cies, and to allow seamless installation of the whole. It now justrequires adding the repository to the software management sys-tem (through Synaptic for instance, installation details on [8]) anddouble-clicking on MediaCycle packages (that are not yet avail-able on our Launchpad repository since the MediaCycle license isnot curently opensource).
6. ACKNOWLEDGMENTS
numediart is a long-term research program centered on DigitalMedia Arts, funded by Région Wallonne, Belgium (grant N◦716631).
We would like to thank Michal Seta for our fruitful discussionswhile fine-tuning the installation of scenic at the numediart lab.
7. REFERENCES
7.1. Scientific references
[1] David Austerberry. The technology of video and audiostreaming. Focal Press, 2005. ISBN: 0-240-80580-1. P.: 56.
[3] Christian Frisson et al. “DeviceCycle: rapid and reusableprototyping of gestural interfaces, applied to audio brows-ing by similarity”. In: Proceedings of the New Interfaces forMusical Expression++ (NIME++). 2010. P.: 56.
[12] Dominik Schnitzer. “Mirage: High-Performance MusicSimilarity Computation and Automatic Playlist Genera-tion”. MA thesis. Vienna University of Technology, 2007.URL: http://hop.at/mirage/. P.: 57.
[13] Xavier Siebert et al. “MediaCycle: Browsing and Perform-ing with Sound and Image libraries”. In: QPSR of the nu-mediart research program. Ed. by Thierry Dutoit. Vol. 2. 1.numediart Research Program on Digital Art Technologies.2009. Pp. 19–22. URL: http://www.numediart.org/docs/numediart_2009_s05_p3_report.pdf. P.: 55.
[15] IOhannes m zmölnig. “PdGst - GStreamer bindings for Pd”.In: The International Convention for Puredata (PdCon09).2009. URL: http://umlaeute.mur.at/Members/zmoelnig/projects/pdgst. P.: 57.
7.2. Artistic references
[2] Bernard Delcourt. URL: http : / / vimeo . com /user2315349. P.: 55.
[5] La Société des Arts Technologiques (SAT). URL: http://www.sat.qc.ca. P.: 56.
[14] Transcultures. URL: http://www.transcultures.be. P.: 56.
57

QPSR of the numediart research program, Vol. 4, No. 3, September 2011
7.3. Software and technologies
[4] “GStreamer: opensource multimedia framework”. URL:http://gstreamer.freedesktop.org/. P.: 56.
[6] La Société des Arts Technologiques (SAT). “scenic: atelepresence application for live performances and instal-lations”. source code on https://github.com/sat-metalab/scenic. 2011. URL: http://code.sat.qc.ca/trac/scenic/. P.: 56.
[7] numediart. “Launchpad Team for creating, manipulatingand packaging various kinds of software throughout nume-diart projects”. Personal Package Archive (ppa) repositoriesfor Ubuntu. 2011. URL: https://launchpad.net/~numediart. P.: 57.
[8] numediart. “numediart-deps: Useful dependencies for nu-mediart projects”. Personal Package Archive (ppa) repos-itory for Ubuntu. 2011. URL: https://launchpad.net/~numediart/+archive/deps. P.: 57.
[9] “pdvjtools”. URL: http://artefacte.org/pd/. P.:55.
[10] “PureData”. URL: http://www.puredata.info. P.:55.
[11] Dominik Schnitzer. “Mirage: An Automatic Playlist Gener-ation Extension for Banshee”. 2009. URL: http://hop.at/mirage/. P.: 57.
58

QPSR of the numediart research program, Vol. 4, No. 3, September 2011
MAGE / PHTS IN COLLABORATIVE VOCAL PUPPETRY (COVOP) - MULTI-USERPERFORMATIVE HMM-BASED VOICE SYNTHESIS ON DISTRIBUTED PLATFORMS
Maria Astrinaki 1, Onur Babacan1, Nicolas d’Alessandro 2, Thierry Dutoit 1, Sidney Fels2
1 Laboratoire de Théorie des Circuits et Traitement du Signal (TCTS), Université de Mons (UMONS), Belgique2 Media and Graphics Interdisciplinary Centre (MAGIC), University of British Columbia (UBC), Canada
ABSTRACT
Speech production is a complex phenomenon with many pa-rameters. It is very difficult for one performer to control all aspectsof a synthesizer that models this phenomenon. We designed anddeveloped a distributed, multi-user system to tackle this difficulty,where users control different aspects of the synthesizer simulta-neously and interactively; treating the complex production pro-cess as a social game. HMM-based synthesizers provide flexibilityat a high level of naturalness, thus we chose HTS as our synthe-sizer. However, HTS needs severe architectural modifications to beused reactively, and a major achievement of this work was creatingMAGE/pHTS, a library for performative HMM-based speech andsinging synthesis. The resulting system provides interactive con-trols for phonetic content and context, as well as prosody using thepreviously existing HandSketch controller.
KEYWORDS
MAGE, pHTS, HTS, HMM, speech synthesis, statistical paramet-ric speech synthesis, singing synthesis, real-time, performative,streaming
1. INTRODUCTION
One of the most expressive and ubiquitous instruments of the hu-man body is voice production, and people have always been fasci-nated for artificial speech and singing production. The vocal be-havior and interaction though, is a very complex mechanism thatneeds computational power for its simulation. Nowadays, with therecent emerging technologies in sensors and computational abil-ities, we have a broad and complete framework to achieve high-quality, expressive and ubiquitous speech and singing synthesis,with interactive manipulation possibilities, allowing us to see andmodel voice production as a gestural phenomenon.
1.1. Motivation
The goal of this project is to develop the social aspects of voiceproduction from a different perspective. Developing a new inter-active voice synthesizer and a social experience platform, in or-der to allow a group of users / performers to manipulate variousaspects of performative voice synthesis, distributed on their owndevice (computer or mobile). Implementing a new framework forperformative voice synthesis, i.e. a real-time synthesis systemswhere voice is directly produced by gestural control, with no morereference to textual input. Here we address both phonetical andprosodical issues, with prototyping a first application in speechand singing synthesis. Our aim here is to define a design space forHMM-based voice synthesis as a framework for multi-user partic-ipation distributed on different platforms. Indeed we know that
the simultaneous management of all the parameters required forspeech production is overwhelming for a single user, even in thecase of an “expert” performer. Consequently, in this project, wewant to explore the idea of collaborative vocal puppetry and seehow vocal intelligibility, naturalness and even identity can be ad-dressed as a social game, involving the participation of multipleusers on their own device.
1.2. Background
The collaborative vocal puppetry system (CoVoP 1.0) is composedof three main components: an interactive voice synthesis engine, adistributed social experience platform and various kinds of human-computer interaction models distributed on various kinds of de-vices (computers, cellphones and tablets).
The first and main aspect of this research is to develop a newsynthesis engine. In this project, based on the recently imple-mented system pHTS [4], we developed a library for performativeHMM-based speech and singing synthesis, called MAGE / pHTS.The architecture of MAGE / pHTS will be given in details in thefollowing section.
One other significant aspect of the CoVoP project is the dis-tribution of various parts of the synthesis process on several het-erogenous devices. More than defining a convenient modulariza-tion of the synthesis engine, we need to architecture a distributedpeer-to-peer service over the network. Each introduced device; alaptop with sensors, a cellphone or a tablet; will require for someresources (a part of the voice synthesis process) and display an ap-propriate control space to the user. As a result this platform con-siders the voice synthesis process as a collection of interconnectedresources to be handled by the cloud of devices, with priority anddispatching strategies, as shown in Figure 1. The devices them-selves bring information to the whole network, such as screen size,CPU capacity, sound properties or embedded sensors. The wholeprocess of connecting and participating to the collaborative experi-ence has to handle these compatibility issues and particularize theexperience for each performer.
iPhone
network enabled sensor
laptop
laptop
tablet
conn
ectio
n &
disp
atch
ing
prox
y connection & dispatching proxysynthesis
component
synthesis component synthesis
component
iPad
Figure 1: Block diagram of the targeted CoVoP system
59

QPSR of the numediart research program, Vol. 4, No. 3, September 2011
We already have investigated several human-computer interac-tion models for controlling various aspects of voice synthesis. Forexample the “fan” mapping of the HandSketch [3]. In this work,HandSketch is remapped with several one-handed or two-handedtouchless mappings for parameters such as pitch, volume, speedand vocal tract length. However, the introduction of multitouchand portable devices is new in the project, resulting in prototypingnew HCI models.
The software implementation of this system is achieved withopenFrameworks [8]. The openFrameworks project aims at pro-viding an open-source creative environment for aggregating vari-ous software components, initially for computer graphics (OpenGL,image management, Quicktme, etc). One significant advantage ofopenFrameworks is to be cross-platform (Mac, Linux, Windows,iOS). Moreover the open and free add-on format attracted a lot ofthird party developers to wrap a large amount of new functions :OpenCV [7], XML, Open Sound Control [6], network protocols,etc. We take advantage of these existing modules for building ourreal-case prototype.
2. COVOP
For the implementation of the CoVoP 1.0 system, we conductedresearch in three main modules, which were combined at the endof the project:
• developing a new interactive voice synthesizer,
• mapping Handsketch as a prosodic controller,
• developing a module for reactive contextual control
2.1. Interactive Voice Synthesizer
The most essential part of this project, is the creation of an inter-active voice synthesizer, that will enable contextual and prosodicuser control. Based on pHTS, we conducted architectural modi-fications that transformed this static streaming approach to a re-active framework for HMM-based speech and singing synthesis,called MAGE/pHTS. In this design, MAGE is the engine indepen-dent and thread safe layer of pHTS, enabling us to handle asyn-chronous user input to the system in order to have direct on the flycontrol.
2.1.1. Architecture of pHTS
Coarticulation is known to have forward and backward effects (thelatter being the most challenging for the delay issue), in speechand singing synthesis systems. This implies that a given phonemecannot be produced correctly if some future information is notknown. As a matter of fact, the original HTS [12] system syn-thesizes speech on the basis of complete sentences. Thus, in theoffline architecture of HTS, all the contextual information fromthe full input is used. In other words, the intrinsic delay of thisarchitecture if considered in a real-time perspective is one full sen-tence, even if the actual computational time needed for the targetedspeech synthesis is less.
In direct contrast to the original offline HTS approach and to-wards to the targeted real-time performative system, we achievedan intermediate step. The streaming version of HTS, pHTS, workson a phoneme-by-phoneme basis, i.e. it produces the samples fora given phoneme each time a new phoneme is sent to it as input.What is more, its delay, i.e. the number of future phonetic labelsrequired for synthesizing the current phoneme, can be constrained.
More specifically, we use an already trained HTS system, inwhich we change the way the HMM, that models the sentence,is constructed from the phonemes. Consequently the way the se-quences of spectrum and excitation parameters are generated. Herewe have to clarify, that we still use pre-computed context-dependentphonetic labels that contain all the contextual information of a fulltext sentence, but all this information is not directly used for thefeature synthesis step. Instead, for each given label, a sentenceHMM is constructed, and for this single label the sequence ofspectrum and excitation parameters are generated. The speechwaveform synthesized from these parameters contains the syn-thetic speech that corresponds only to the given input phoneticlabel. In this way, the pHTS parameter generation is achievedby computing many locally-optimal paths for the decision tree,which, when combined make a sub-optimal total path, rather thancomputing one total optimal path for the whole text input sentence.In the current implementation, even though the complete sentencecontext information is available, the system only has access to in-formation corresponding to a single label at each iteration.
2.1.2. Architecture of MAGE / pHTS
pHTS as a milestone led to the design of MAGE, which encap-sulates pHTS in a framework for reactive HHM-based speech andsinging synthesis. The architecture of MAGE/pHTS is based onthe usage of four basic, different threads. The first and main threadis the so called MAGE thread, and runs all the synthesis part, com-municates with the other three threads in order to receive the usercontrol and adjusts the synthesis of the targeted output accordinglyto the user input. The second thread is the label thread that is re-sponsible for the correct communication between the user’s con-text control and the MAGE thread, controlling how labels are han-dled, processed and stored. Then we have the modification thread,that is used to manipulate the prosody provided by the model. Itallows the user to override, scale or shift the pitch, the speed / dura-tion, the volume and the vocal tract length that are produced by themodel on the fly. Finally there is the audio thread that carries theload of exchanging the speech samples created from the MAGEthread to the system call for audio samples. In other words, allthree control threads; label, modification and audio thread; arein direct communication with the main synthesis thread. In Fig-ure 2 we illustrate a diagram of the threaded architecture of theMAGE/pHTS.
For the implementation of the label thread and of the au-dio thread we needed to use lock-free, cache-efficient shared ringbuffers [11], that provide fast data accesses among threads run-ning in multi-threaded systems. In this case, the two ring-buffersallow us to synchronize the asynchronous input of the user and thesynchronous demand for data from the synthesis thread, MAGEthread.
At this point, we achieved in the MAGE/pHTS framework tohave a reactive voice synthesizer where the user can control theprosody of pre-defined context. The user can on the fly scale, shiftor override the pitch and duration trajectories produced from themodel itself, allowing a variety in prosodic control. Concurrently,it is possible to control the speed of synthesis, the volume of theoutputted samples, as well as the vocal tract length parameter usedat synthesis.
60

QPSR of the numediart research program, Vol. 4, No. 3, September 2011
Label Input
Thread
Audio Requesting
Thread
Label ringbuffer
Reactive Modification
Thread
Prosody Model
Statistical Model
Audio ringbuffer
MAGEParse Label
Update PDFs
Update Filter
Update Audio
pHTS
Figure 2: Threaded architecture of MAGE / pHTS
2.2. Prosodic Controller
The next step in this project is to implement an interface for this re-active voice synthesizer. MAGE/pHTS, which currently allows onthe fly user prosody control, was integrated in an openFrameworksapplication. In this application we also integrated OSC messages,so that our reactive synthesizer will interact with its external envi-ronment. These messages contain prosodic information passed onthe fly from the user from an external controller.
Here, as a controller we decided to use Handsketch, that al-lows gestural control interpretation. Handsketch was mapped asdemonstrated in Figure 3. On the “fan” diagram we have controlthrough the angle and the radius over the pitch trajectory producedby the model and over the speed of the samples synthesis. Thepen, through pressure controls the volume, through button “one”controls if the pitch trajectory will be shifted or overridden andthrough tilt and button “two” controls the vocal tract length pa-rameter.
Figure 3: Mapping of pitch, speed, volume and vocal tract lengthon Handsketch as prosodic controller of MAGE / pHTS
Handsketch is connected to a laptop and via a Max/MSP patch[2] sends OSC messages to the MAGE/pHTS openFrameworksapplication. These messages contain the control information forpitch, speed, volume and vocal tract length, mapped as shown inFigure 3, are sent to the openFrameworks application that runsMAGE/pHTS, using the four threads as described above. Whenreceived, these messages are parsed and accordingly to the usercontrol, the targeted speech samples are synthesized.
The full architecture of this prototype, using Handsketch asa prosody controller in the MAGE/pHTS framework for reactiveHMM-based speech and singing synthesis, integrated as an open-Frameworks application is demonstrated in Figure 4.
Wacom driver
Polar mapping
OSC sender
OSC listener
Prosody mapping
Label ringbuffer
Prosody Model
Audio ringbuffer
Parse Label
Update PDFs
Update Filter
Update Audio
Audio callbackM
ax M
SP :
Han
dSke
tch
OSC
par
sing
Audio
MAGE
pHTS engine
oF : MA
GE
Figure 4: Architecture of the application that combines Hands-ketch as prosodic controller with MAGE / pHTS in reactive HMM-based speech and singing synthesis
2.3. Reactive Contextual Control
CoVoP 1.0 is a performative system, and by its definition it needsnot only prosody user control, but also contextual user control. Theproblem occurring here, is that the contextual information used inMAGE/pHTS, inherited from the original HTS system, is basedon pre-computed phonetic labels. These phonetic labels containall the possible linguistic information from the targeted sentence.
2.3.1. Minimizing linguistic information
As mentioned, currently our system uses linguistic information ex-tracted from the full textual input. In other words, even if our sys-tem runs as a reactive application, the data needed as contextualinput are strongly dependent on future information that we do nothave access to. This means that still the contextual input of our sys-tem introduces delay of one full text sentence, something againstthe performative definition. For the production of the phoneticlabels the contextual factors taken into account are phonemes, syl-lables, words, phrases and the whole utterance, as listed below.
• phoneme
– {preceding, current, succeeding} phonemes 1
– position of current phoneme in current syllable
• syllable
– number of phonemes at {preceding, current, succeed-ing} syllable
– accent of {preceding, current, succeeding} syllable
1The two preceding and the two succeeding phonemes of thecurrent phoneme are taken into account
61

QPSR of the numediart research program, Vol. 4, No. 3, September 2011
– stress of {preceding, current, succeeding} syllable
– position of current syllable in current word
– number of {preceding, succeeding} stressed syllablesin current phrase
– number of {preceding, succeeding} accented sylla-bles in current phrase
– number of syllables {from previous, to next} stressedsyllable
– number of syllables {from previous, to next} accentedsyllable
– vowel within current syllable
• word
– guess at part of speech of {preceding, current, suc-ceeding} word
– number of syllables in {preceding, current, succeed-ing} word
– position of current word in current phrase
– number of {preceding, succeeding} content words incurrent phrase
– number of words {from previous, to next} contentword
• phrase
– number of syllables in preceding, current, succeedingphrase
– position in major phrase
– ToBI2 endtone of current phrase
• utterance
– number of syllables in current utterance
To solve this problem in the MAGE/pHTS approach we de-cided to train our system with “as little linguistic information aspossible”. Then creating on the fly phonetic labels, that correspondto user phonetic input, by building a reactive natural language pro-cessor (RNLP). Based on the default architectural delay of our sys-tem we attempt to define what “as little linguistic information aspossible” is. As a matter of fact, we know, that MAGE/pHTS isa reactive system with at least one phoneme delay. This meansthat we can have access to at least one future phoneme, before itssynthesis. The default label look-ahead buffer with one phoneticallows us to have access to two preceding, the current and one suc-ceeding phoneme, plus past syllables. Taking that into account, weuse the contextual factors listed below to re-train our model, so tobe used at run time.
• phoneme
– {two preceding, current, one succeeding} phonemes
– position of current phoneme in current syllable
• syllable
– number of phonemes at {two preceding, current, onesucceeding} syllable
– accent of {two preceding, current, one succeeding}syllable
2Tones and Break Indices
– number of syllables {from previous, to current} ac-cented syllable
– number of syllables to {next} accented syllables
– vowel within current syllable
• word - phrase - utterance
– No information
As expected, there is quality degradation in the final output,compared to MAGE/pHTS using all the available contextual in-formation, and of course compared to the original HTS system.Various samples of these approaches, can be found in [1]. We haveto note here, that we have not assessed any objective or subjec-tive measurements yet. However, currently this is the best possibleapproach that will enable reactive contextual user input and at thesame time give very natural and intelligible output.
2.3.2. RNLP
Once the model was re-trained using the minimum linguistic in-formation, it was time to implement the reactive natural processormodule (RNLP). This RNLP module takes as input small chunksof phonemes passed from the user. These chunks are then parsedinto alphanumeric phonetic labels, that contain only the linguisticfactors mentioned above. All the factors needed for the phoneticlabel creation are correctly computed based on the parsing of thephonetic chunk input. Only the “number of syllables to the nextaccented syllable” factor cannot be estimated, and for that reason itis set to a random value between 1 and 5. Finally, these phonetic la-bels composed on the fly are then passed as input to MAGE/pHTSin order to produce the targeted speech samples.
As a matter of fact, RNLP is a first module that proves that itis possible to some extend to have reactive context control, thatpreserves the intelligibility and naturalness of the targeted out-put. Combining now MAGE/pHTS, Handsketch and RNLP, wehave a first basic prototype, that enables full reactive control ofcontext and prosody at the same time in the HMM-based speechand singing synthesis framework. Consequently, the prototype ofMAGE/pHTS combined with Handsketch as a prosodic controller,described in 2.2, is now augmented so that it includes also theRNLP module.
2.3.3. RNLP & MAGE / pHTS & Handsketch
In order to use the RNLP module in our current system, first, it hasto be integrated into MAGE/pHTS, and then to be combined witha context control interface. Initially, we integrated the RNLP mod-ule into MAGE/pHTS as a separate thread that controls the pars-ing of the incoming phonemes. This thread communicates directlywith the label thread of MAGE/pHTS providing the phonetic labelinput to be modeled and synthesized.
Since RNLP was successfully integrated, we continued withthe interface that controls the phonetic input. In order to controlthe phonetic content reactively, we developed a phonetic contentsequencer. Using the paradigm of musical sequencers, our systemhas one, looping channel, with user-controlled duration, and whosecontent is not sound, but groups of phonemes. The software runson an iPad and was written using openFrameworks.
We named these groups of phonemes "chunks", and they areloosely defined as units consisting of a few phonemes. Our aimin using chunks as the building block was to better facilitate userinteraction. Single phonemes are hard for the user to handle in a
62
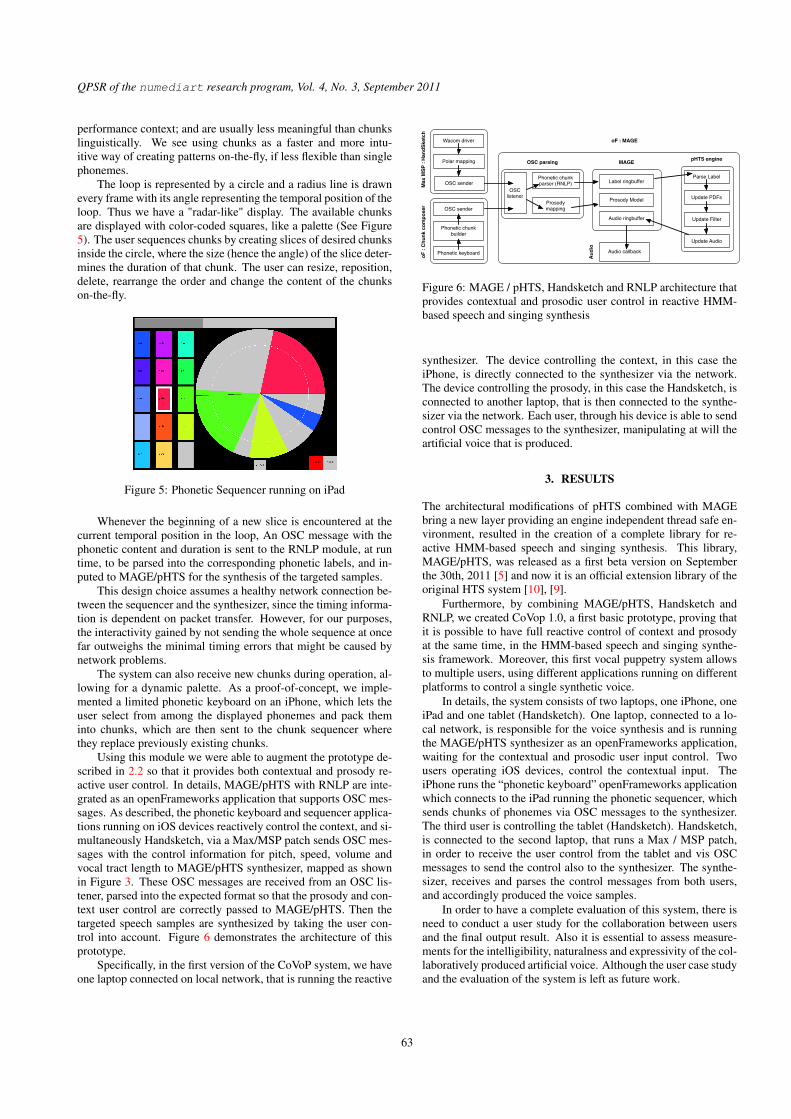
QPSR of the numediart research program, Vol. 4, No. 3, September 2011
performance context; and are usually less meaningful than chunkslinguistically. We see using chunks as a faster and more intu-itive way of creating patterns on-the-fly, if less flexible than singlephonemes.
The loop is represented by a circle and a radius line is drawnevery frame with its angle representing the temporal position of theloop. Thus we have a "radar-like" display. The available chunksare displayed with color-coded squares, like a palette (See Figure5). The user sequences chunks by creating slices of desired chunksinside the circle, where the size (hence the angle) of the slice deter-mines the duration of that chunk. The user can resize, reposition,delete, rearrange the order and change the content of the chunkson-the-fly.
Figure 5: Phonetic Sequencer running on iPad
Whenever the beginning of a new slice is encountered at thecurrent temporal position in the loop, An OSC message with thephonetic content and duration is sent to the RNLP module, at runtime, to be parsed into the corresponding phonetic labels, and in-puted to MAGE/pHTS for the synthesis of the targeted samples.
This design choice assumes a healthy network connection be-tween the sequencer and the synthesizer, since the timing informa-tion is dependent on packet transfer. However, for our purposes,the interactivity gained by not sending the whole sequence at oncefar outweighs the minimal timing errors that might be caused bynetwork problems.
The system can also receive new chunks during operation, al-lowing for a dynamic palette. As a proof-of-concept, we imple-mented a limited phonetic keyboard on an iPhone, which lets theuser select from among the displayed phonemes and pack theminto chunks, which are then sent to the chunk sequencer wherethey replace previously existing chunks.
Using this module we were able to augment the prototype de-scribed in 2.2 so that it provides both contextual and prosody re-active user control. In details, MAGE/pHTS with RNLP are inte-grated as an openFrameworks application that supports OSC mes-sages. As described, the phonetic keyboard and sequencer applica-tions running on iOS devices reactively control the context, and si-multaneously Handsketch, via a Max/MSP patch sends OSC mes-sages with the control information for pitch, speed, volume andvocal tract length to MAGE/pHTS synthesizer, mapped as shownin Figure 3. These OSC messages are received from an OSC lis-tener, parsed into the expected format so that the prosody and con-text user control are correctly passed to MAGE/pHTS. Then thetargeted speech samples are synthesized by taking the user con-trol into account. Figure 6 demonstrates the architecture of thisprototype.
Specifically, in the first version of the CoVoP system, we haveone laptop connected on local network, that is running the reactive
Wacom driver
Polar mapping
OSC sender
Phonetic keyboard
Phonetic chunk builder
OSC sender
OSC listener
Prosody mapping
Phonetic chunk parser (RNLP) Label ringbuffer
Prosody Model
Audio ringbuffer
Parse Label
Update PDFs
Update Filter
Update Audio
Audio callback
Max
MSP
: H
andS
ketc
hoF
: C
hunk
com
pose
r
Aud
io
MAGE pHTS engineOSC parsing
oF : MAGE
Figure 6: MAGE / pHTS, Handsketch and RNLP architecture thatprovides contextual and prosodic user control in reactive HMM-based speech and singing synthesis
synthesizer. The device controlling the context, in this case theiPhone, is directly connected to the synthesizer via the network.The device controlling the prosody, in this case the Handsketch, isconnected to another laptop, that is then connected to the synthe-sizer via the network. Each user, through his device is able to sendcontrol OSC messages to the synthesizer, manipulating at will theartificial voice that is produced.
3. RESULTS
The architectural modifications of pHTS combined with MAGEbring a new layer providing an engine independent thread safe en-vironment, resulted in the creation of a complete library for re-active HMM-based speech and singing synthesis. This library,MAGE/pHTS, was released as a first beta version on Septemberthe 30th, 2011 [5] and now it is an official extension library of theoriginal HTS system [10], [9].
Furthermore, by combining MAGE/pHTS, Handsketch andRNLP, we created CoVop 1.0, a first basic prototype, proving thatit is possible to have full reactive control of context and prosodyat the same time, in the HMM-based speech and singing synthe-sis framework. Moreover, this first vocal puppetry system allowsto multiple users, using different applications running on differentplatforms to control a single synthetic voice.
In details, the system consists of two laptops, one iPhone, oneiPad and one tablet (Handsketch). One laptop, connected to a lo-cal network, is responsible for the voice synthesis and is runningthe MAGE/pHTS synthesizer as an openFrameworks application,waiting for the contextual and prosodic user input control. Twousers operating iOS devices, control the contextual input. TheiPhone runs the “phonetic keyboard” openFrameworks applicationwhich connects to the iPad running the phonetic sequencer, whichsends chunks of phonemes via OSC messages to the synthesizer.The third user is controlling the tablet (Handsketch). Handsketch,is connected to the second laptop, that runs a Max / MSP patch,in order to receive the user control from the tablet and vis OSCmessages to send the control also to the synthesizer. The synthe-sizer, receives and parses the control messages from both users,and accordingly produced the voice samples.
In order to have a complete evaluation of this system, there isneed to conduct a user study for the collaboration between usersand the final output result. Also it is essential to assess measure-ments for the intelligibility, naturalness and expressivity of the col-laboratively produced artificial voice. Although the user case studyand the evaluation of the system is left as future work.
63

QPSR of the numediart research program, Vol. 4, No. 3, September 2011
4. CONCLUSIONS
We know, that managing all the parameters needed for syntheticspeech production is overwhelming for one single performer. Ittakes an “expert” user and a lot of training in order to obtain somegood results. Here we augmented MAGE / pHTS and developeda framework for multi-user participation for performative voicesynthesis and extended its context in collaborative vocal puppetry.Each user has only one control over the synthesized voice, con-text or prosody. Consequently, with this prototype it is possibleto explore this idea and see how vocal intelligibility, naturalnessand even identity can be addressed as a social game, involving theparticipation of multiple users on their own device. As follows wewant to conduct user studies and perceptive tests in order to eval-uate the impact of such a collaborative and performative approachof voice synthesis on this prototype. Additionally to the systemevaluation, we should also investigate the time scale issue. Whatis the optimal timescale to manipulate, in order to have a real-timesystem and at the same time providing flexible mapping and mean-ingful control to the user? As a matter of fact, currently our systemis based on phonemes, but phonemes are long enough so that theprosodic control is not accurate enough, and short enough so thatis too complicated for the user to obtain meaningful and naturalcontext control. Moreover, the phoneme-based architecture intro-duces the problem of the constant vowel production. Sustainedvowel, used especially in singing synthesis, can be synthesized inthe current framework, but they sound very unnatural. Possiblesolutions to this problem is further architectural, modifications, ei-ther on the training level, or on the label input level, or even at thesynthesis level.
Although, we believe that the development of a design spacefor performative speech and singing synthesis is possible in theHMM-based speech synthesis framework. In this work we provethat it is feasible to overcome the restrain of working at the sen-tence level, brought from the original system and transform HTSinto a reactive system that provides on the fly, multi-user, multi-platform phonetic and prosodic control, enabling us to move to-wards a real-time system by proposing an appropriate time scalethat respects the causality of interaction. MAGE / pHTS bringsa very advanced and flexible voice synthesizer with built-in inter-active properties, for both phonetic and prosodic control. It canbring also tools necessary for analyzing various situations involv-ing voice production models, mapping strategies for interactionprototypes and integrations in heterogenous devices. Addition-ally it could validate implementations of the first social experiencemodel around voice synthesis. In all cases though, quality evalua-tion measurements have to be conducted, before exploring all thepossible fields of application of such a system.
5. ACKNOWLEDGMENTS
M. Astrinaki and O. Babacan’s work is supported by a PhD grantfunded by UMONS and ACAPELA-GROUP SA.
numediart is a long-term research program centered on Dig-ital Media Arts, funded by Région Wallonne, Belgium (grant N◦716631).
6. REFERENCES
6.1. Scientific references
[3] N. d’Alessandro and T. Dutoit. “HandSketch Bi-ManualController: Investigation on Expressive Control Issues of
an Augmented Tablet”. In: Proceedings of NIME. 2007.Pp. 78–81. P.: 60.
[4] T. Dutoit et al. pHTS for Max/MSP: A Streaming Architec-ture for Statistical Parametric Speech Synthesis. Tech. rep.volume 4, no. 1, pp. 7-11. QPSR of the Numediart researchprogram, March 2011. P.: 59.
[11] S. W. Smith. The Scientist and Engineer’s Guide to DigitalSignal Processing. California Technical Publishing, 1997.Chap. Digital Signal Processors, pp. 503 –534. P.: 60.
[12] T. Yoshimura et al. “Simultaneous modeling of spectrum,pitch and duration in HMM-based speech synthesis”. In:Proceedings of Eurospeech. 1999. Pp. 2347–2350. P.: 60.
6.2. Software and technologies
[1] M. Astrinaki. Performative HMM-based Speech Synthe-sis. 2011. URL: http://tcts.fpms.ac.be/~astrinaki/HTS_Results/details.html. P.:62.
[2] Cycling74. 2011. URL: http://cycling74.com. P.:61.
[5] MAGE / pHTS. 2011. URL: http : / / www .numediart.org/demos/mage_phts/. P.: 63.
[6] Open Sound Control. 2011. URL:opensoundcontrol.org/. P.: 60.
[7] OpenCV. 2010. URL: http : / / opencv .willowgarage.com/wiki/. P.: 60.
[8] openFrameworks. 2010. URL: http : / / www .openframeworks.cc/. P.: 60.
[9] K. Oura. HMM-based Speech Synthesis System (HTS) - Ex-tensions. 2011. URL: http://hts.sp.nitech.ac.jp/?Extensions. P.: 63.
[10] K. Oura. HMM-based Speech Synthesis System (HTS).2010. URL: http://hts.sp.nitech.ac.jp/. P.:63.
64

QPSR of the numediart research program, Vol. 4, No. 3, September 2011
KINACT: A SALIENCY-BASED SOCIAL GAME
Matei Mancas 1, Radhwan Ben Madhkour 1, Dominique De Beul 1,Julien Leroy 1, Nicolas Riche 1, Yves P. Rybarczyk 2, François Zajéga 1
1 Laboratoire de Théorie des Circuits et Traitement du Signal (TCTS), Université de Mons (UMONS), Belgique2 Departamento de Engenharia Electrotécnica, Faculdade de Ciências e Tecnologia, Universidade Nova de Lisboa, Portugal
ABSTRACT
In this paper we discuss the design of an intelligent game systemcapable of selecting the players who exhibits the most outstand-ing behavior from groups of people playing on a network. Playerscan be all in the same place (maximum 3) or in several locations ifconnected to the web. In that way, the total amount of players canbe very large. Tests were made with 3 players in a single locationand with 2 different locations of 2 players each. The system usesboth static and dynamic features extracted from the upper part ofthe players’ bodies such as symmetry, contraction index, motionindex or height. Those features are extracted using the RGB-DKinect sensor and their relative contrast and time evolution enablean adaptive selection of the most salient or different behavior with-out any complex rules. First users’ feedback and eye tracking testsare shown and applications to social interactions are presented.
KEYWORDS
saliency, computational attention, game, kinect, bottom-up, top-down, behavioral features, eye tracking, social interaction
1. INTRODUCTION
Efficient and low-cost devices as the Kinect sensor opened newhighways in gaming community. People detection and skeletonextraction in real life light conditions becomes a reality and moreand more complex interactions are possible. Despite those newpossibilities, still the interactions are achieved with pre-learnt andpre-programmed gestures. This means that if game scenarios aredifferent from what is expected, the system cannot cope with thenovelty.
An impressive human ability is to be able to attend interestingevents or interesting behavior even if the situation is completelynovel. In this paper, we implement and demonstrate a game whichis able to select the active player in an attentive way. The systemonly uses players’ behavior during their observation and a shortmemory of what they previously did to select in any situation theactive player. The game is a network implementation using resultsfrom [9].
Beyond the ability to choose the active user, the system willbe used to study the social organization of the player team, the in-fluence of the players’ localization which can be different betweenpeople playing together or through the network [13].
The characteristics we use are mainly related to 3D motionbut also social/emotional features as those developed by Camurriet al. [3]. Two of the four features used namely the motion index(also called quantity of motion) and the contraction index comefrom those developments. The four features used here describewell the kind of gestures that humans would naturally perform ina game/social context like shaking hands, move, sit down...
This paper is organized as follows: section 2 globally dis-cusses the game idea and its play modes. Section 3 details the fea-tures extraction while section 4 presents both bottom-up and top-down mechanisms. Section 5 deals with the implementation of ourgame and especially the network issues. Section 6 provides someresults to tests which intend to capture players’ interest for thisconcept and the accuracy of the attention system. Section 7 pro-vides a conclusion and further developments of this game whichintends to be a platform towards social behavior analysis.
2. GAME DESCRIPTION
2.1. Idea and Interface Implementation
We based our game on “World of Goo” [2], a puzzle game devel-oped by 2D Boy [1]. The purpose proposed to players in Worldof Goo is to build a structure made out of balls interconnected bysemi-rigid wires. This structure is used to touch a goal locatedsomewhere in the scene.
We implemented a similar game by using the physical interac-tion Box2D library [4] and QT [10]. Figure 1 shows a screenshotof the game where two players almost touched the goal which ishere a top-screen yellow ball.
Figure 1: Two players made a structure of white balls linked byelastic black wires and the purpose is to touch the top yellow ball.
The difficulty of the proposed game comes from the team man-agement. Each player can add a ball to the structure each 13 sec-onds. In the meanwhile, the structure evolves. Poor choices madepreviously destabilize it and can make it collapse. At the gamestart-up 50 balls are available and the players have to reach thegoal with this amount of balls.
Different strategies are possible and each player has to choosebetween to make the structure higher to approach faster the goal orto consolidate it by adding balls at its basis to avoid the collapse of
65

QPSR of the numediart research program, Vol. 4, No. 3, September 2011
the structure. The game finishes when there are no more balls leftor when the goal is reached.
2.2. Use Players’ Body as a Controler
Two games modes were implemented. The first one is a simplesequential mode where each player has 10 seconds to put his ownball, and then the next one becomes active and so on. This is aclassical implementation which uses no intelligence in selectingthe active user.
The second game mode uses automatic saliency based on play-ers’ behavior to attend to a particular player and make him active.There are two distinct steps in each game turn. First, during 5 sec-onds, the players have to differentiate themselves from the othersby adopting unfamiliar or strange poses (to attract the attention ofthe system). In a second step, as for the sequential mode, the activeplayer has 10 seconds to place his ball on the structure.
While in the first mode at least two players are needed, in thesecond one at least 3 are needed to be able to find the player whois different from at least two others. Each player is representedgraphically as a dashed circle. He controls the position of the cur-sor by moving in front of the Kinect sensor: the X and Z coordi-nates of the skeleton’s barycenter of each player is mapped on theX and Y position of the cursor. In the second mode, behavioralfeatures are extracted from the upper part of the skeleton of eachplayer.
3. FEATURES EXTRACTION
The first step for an interactive machine is to extract features fromthe observed people. For that purpose, we use the Kinect sensor forits ability to extract smooth depth maps in complex illuminationconditions. Libraries as OpenNI [8] are available to detect humansilhouettes and extract anatomical features from skeletons tracking(Figure 2).
Figure 2: Real-time skeleton extraction from players using OpenNIlibrary.
Four features are extracted from the upper body part only asthe legs are much less stable in our implementation.
One of the four features is dynamic, namely the motion index.It is computed as the mean variation of the same skeleton pointsbetween two frames in 3D (on X, Y and Z). The barycenter pointvariation is extracted from the others (Equation 1) in order to keeponly the body relative motion which will describe an excitement
Figure 3: (X, Y, Z) axes and skeleton extraction. Only the points ofthe upper body are taken into account.
degree or movement transition of the body without any assumptionon the whole body speed.
Dmk = (∑
sk |kb − ksk|)t − (∑
sk |kb − ksk|)t−1
where k = x, y, z ; sk = skeletonpointsand b = Barycenter
MI =√Dmx2 +Dmy2 +Dmz2
(1)
A second feature extracted from the upper body part is a staticfeature, namely the asymmetry index. This feature is only com-puted on the X axis by differencing the distances between thebarycenter point and the right shoulder, elbow and hand pointswith the left ones (Equation 2). This index provides informationabout the symmetry of the upper body.
AI =
∑sk |Xb−Xskright
|−∑sk |Xb−kskleft
|nsk
where nsk = number of skeleton points(2)
The third extracted feature is the contraction index. This in-dex is the ratio between the maximal distance between skeletonpoints on X axis and the maximal distance on the Y axis (Equation3). This index tells us if the person is more or less contracted.
CI =|max(X)−min(X)||max(Y )−min(Y )| (3)
The fourth and final feature is the player height. That oneis simply computed by measuring the player barycenter Y coordi-nate.
After normalization, those four features provide a quite com-plete description about the level of excitement, and the upper bodyconfiguration of each player.
4. COMPUTATIONAL ATTENTION: WHO ISDIFFERENT?
The aim of computational attention is to provide algorithms to au-tomatically predict human attention. The term of attention refersto the whole attentional process that allows one to focus on somestimuli at the expense of others. Human attention is mainly di-vided into two main influences: a bottom-up and a top-down one.Bottom-up attention uses signal characteristics to find the mostsalient or outstanding objects. Top-down attention uses a priori
66

QPSR of the numediart research program, Vol. 4, No. 3, September 2011
knowledge about the scene or task-oriented knowledge in order tomodify (inhibit or enhance) the bottom-up saliency. The relation-ship and the relative importance between bottom-up and top-downattention is complex and it can vary depending on the situation [8].
Much research has already addressed the computational visualattention, but these works were devoted almost exclusively to 2Dimage analysis. Up to now little has been done on 3D data [11].The arrival on the market of low cost 3D cameras opens up newprospects for developing algorithms for visual attention, whichshould make the move towards more realistic ambient intelligencesystems.
4.1. Bottom-up Approach
As stated in [7] a feature does not attract attention by itself: brightand dark, locally contrasted areas or not, red or blue can equallyattract human attention depending on their context. In the sameway, motion can be as interesting as the lack of motion dependingon the context. The main cue, which involves bottom-up attention,is the contrast and rarity of a feature in a given context.
The approach here follows the one in [9] but it has an op-timal implementation in C++ instead of several pieces of block-processing software and it is also adapted to games and a networkuse. In our case, as the group of players can be small, the raritycomputation is not relevant; therefore we only use the global con-trast. Thus, the first step in this section is to calculate for the ith
feature (fi,k) a contrast between the different users k.
Ci,k =
N∑
j=1
|fi,k − fi,j |N − 1
(4)
where N is the number of users. Once all the contrasts fora given feature Ci,k between each user and the others have beencomputed, they are ordered in ascending order Ci,k,o with o = [1: N] from the maximum (o = 1) to the minimum (o = N). The dif-ference between the two highest values is compared to a thresholdT which decides if the contrast is large enough to be taken intoaccount as in Equation 5.
{α = 0 if |Ci,k,1 − Ci,k,2| < Tα > 0 if |Ci,k,1 − Ci,k,2| ≥ T (5)
Only the features being the largest and passing this thresholdT are merged with different weights (Equation 6).
Ck =
H∑
i=1
|Ci,k ∗Wi ∗ αH
(6)
Where H is the number of features and α is given in Equation 5.The way the values of the weights Wi is set is described in thenext section. This contrast Ck represents the bottom-up saliencyfor each user k. Saliency will be higher for the people exhibit-ing the most contrasted features within a given frame. The pro-cess of bottom-up attention is summarized on Figure 4 on a three-player scenario example. Each of the three players has its fourfeatures computed (in red for the asymmetry index, yellow for thecontraction index, violet for the motion index and green for theheight). The contrast computation and thresholded (Equations 4and 5) is displayed in the second column. Finally the contrastedfeatures combination (Equation 6) is explained in the third andfourth columns.
Figure 4: Example of bottom-up saliency computation for 3 play-ers. For each of the four behavioral features, a contrast is com-puted between the players. A threshold will eliminate featureswhich are not contrasted enough between players (here the forthfeature in green is eliminated). The player having more contrastedfeatures with higher weights will be selected as the most salient(here the third player)
4.2. Top-down Influence
The weights from Equation 6 can be adapted via the top-downcomponent of attention. Those weights are initially set to be thesame for all the 4 features which are used here. Then, the numberof times a feature is contrasted enough for a given user (α > 0), acounter is increased. The feature weight will be inversely propor-tional to its counter: if a feature i is often contrasted, its weightwill be lower and lower, while a feature which is rarely contrastedenough will see its weight increased. This mechanism ensures ahigher weight to novel behavior while too repetitive behavior willbe penalized.
As an example, someone who will sit down for the first time(different height feature compared to the others), the height willhave the maximum weight. If this person thinks that a differentheight is enough to attract the system attention, he will try again,but the more he tries again, the more the height feature weightwill decrease as this behavior is no longer surprising. This top-down approach allows the system to learn how much a feature isnovel and provides higher weights to the most novel ones. Whilethe bottom-up approach will analyze in each frame which personbehaves in a different way compared to the others, the top-downapproach will also look for people who behave in a novel (or lessrepetitive) way from the beginning of the observation by takinginto account a time memory.
5. IMPLEMENTATION: A DELOCALIZED GAME
While network implementations of games are interesting per se,in the case of an attentive system, the interest is even higher asthe more people are involved, the more the attentive selection ap-proach is relevant. We thus implemented our game in a networkframework by using a client/server architecture.
67

QPSR of the numediart research program, Vol. 4, No. 3, September 2011
5.1. A Client/Server Architecture
The range of each Kinect is quite narrow. After 4.5 meters, thedepth map is less consistent and the skeleton extraction out of thisdepth map becomes very unstable. At 4.5 meters from the Kinect,the filed cover by the camera is about 6 meters large. The numberof people who can be involved in a game using only one Kinectis restricted to 3 or 4 maximum. Due to the attention system, theplayers have to move a lot and perform gestures to gain the focus.This is an additional restriction on the number of users to ensurea good comfort during the game. If players are too close theymight hit themselves and the skeleton tracking, in case of peopletouching their neighbors are much less reliable. That is why wetested a maximum of 3 players per Kinect in this game configura-tion, which is also the minimum number of users required by anattentional system.
Therefore, we prepared a software architecture that allows theusage of several Kinect cameras concurrently to cover a largerspace [9]. But this technique is more complex to set up and needsseveral sensors, a calibration process and specific software. Thatis why, another solution was adopted here: the game was preparedto be able to be used in the same time in different locations overthe Internet. In this way, the minimum number of 3 players has tobe reached in the whole game which means that in one location,there might be only two players and in a second location just oneplayer is enough. We made tests with a configuration of two dif-ferent locations and 2 players per location. This set up is shownin Figure 5. The two locations are here two different rooms in thesame building, but the data passes through Internet and not on thelocal network. Preliminary tests were also made between the uni-versities of the city of Mons in Belgium and the city of Pilsen inCzech Republic distant about 800 kilometers.
Figure 5: Test with 4 players in two different locations (left andright image). While the visual feedback is visible for the first loca-tion in the left image, the middle image shows the visual feedbackfrom the second location. Both structures are exactly the same.
In order to implement this network approach, we had to choosebetween a peer-to-peer and a centralized architecture. The client-server architecture has been chosen for two main reasons.
The first one is because the game elements are managed by aphysical engine: Box2D. Running this library on each client al-ways led to inconsistencies. The longer applications were runningthe more difference appeared in connected clients because even avery small asynchrony leads to differences in the physical engine.In this case, placing the calculation of the graphical elements ona central server and broadcasting the elements to render to eachclient was the most effective solution.
The second reason is that each element involved in the gamehas a unique identifier. The management of these identifiers is bet-ter achieved by an entity controlling all the connected applications.
In the final version of the game (Figure 6), each client pre-processes the information. The retrieval of the skeletons of theplayers via OpenNI and the extraction of the behavioral featuresare executed on each client. The information is then packed in a
message and sent to the server.The server collects these messages and computes the final at-
tention by comparing the behaviors from the different clients. Af-ter skeleton extraction on the client-side, each player has a localidentifier. To clearly identify each player system-wide, the serverdistributes global unique identifier to each player. Each client man-ages the mapping between local and global ID’s. In the same time,the server processes a new state of the physical world and managesthe unique IDs of the players from all the clients. Eventually, itprepares messages containing the graphical elements and the usersto draw on the screen customized for each client and send themback to the clients.
When clients receive the “frame” message, they control thatthe frame is newer then the one previously received and adapts thegraphical display with it.
Figure 6: The client-server architecture of the game. The clientsmake the signal acquisition and compute the behavioral featuresof each player. They send the players’ IDs, position and featuresto the server. The server computes the attention and send backthe active user and the changes into the display computed by thephysical engine. Finally, the clients display the updated visualfeedback.
5.2. Mixed TCP/UDP Communication
Gaming over the Internet implies fast data transmission betweenall the components of the application. We wanted to guarantee30 frames per seconds on the client-side so we had to prepare anoptimized data transfer using the right protocol, TCP or UDP.
After testing both separately, we built a system using both forwhat they are good for. A TCP connection is used to start theclient-server communication. No data is sent through this connec-tion. It is used only to ensure the presence of both parties. If theconnection breaks, the UDP connection will stop instantaneously.
A UDP connection is started directly after the validation of theTCP one. Its speed ensures a good frame rate and responsiveness.This solution is very effective and robust. Not sending any datatrough TCP reduces to minimum potential loss of packages [12].
5.3. Players Behavior
The use of this network architecture has a lot of advantages by in-creasing the number of players without decreasing the game com-fort. Nevertheless, as the attention algorithms is based on having a
68

QPSR of the numediart research program, Vol. 4, No. 3, September 2011
different behavior compared to the other players, any player shouldbe aware about the others. This is obvious when playing in thesame location, but much less when the game is delocalized. Thenetwork architecture allowed us to send in real-time feature pack-ets, but sending videos is much more complex and this was not inour focus. Therefore we decided to use icons to show the featurewhich is the most representative of each player. Figure 7 showsthe icons which are displayed for each user depending on his max-imum feature. Those icons are explicit enough to be immediatelyunderstood by the players. If no feature is above a threshold, thegray static icon is displayed.
Figure 7: Icons representing the dominant feature of the players. Ifthere is no specific feature above a threshold, the static gray iconis displayed. Then, the feature which has the maximum intensityfor each user is displayed.
6. FIRST ANALYSIS
After the first tests, some analyses were carried out in the game. Ina first step we asked the players to fill a questionnaire and we alsoused data which was available as output of the game. In a secondstep we used eye tracking to validate the attentive player selectionsystem.
6.1. Users’ Feedback and Behavior Analysis
In order to have a first idea about the players’ feelings we set up aquestionnaire asking them to score their game experience in termsof 1/Enjoyment, 2/ Isolation compared to the others, 3/ Comfort,4/ Cooperation, 5/Leadership, 6/ Communication for both versionsof the game: the classical sequential one, and the attentive one.
The level of comfort was higher in the sequential mode andthe enjoyment comparable (probably also due to the fact that thegame was more stable in the sequential mode than the attentiveone during those tests). All the other factors were higher for theattentive approach. The players felt the attentive scheme as leadingto much higher cooperation, leadership, communication and lessisolation which is due to the fact that to attract the attention of themachine, the player has to take care not only about himself but alsoabout the others.
Moreover, after the game is finished, it is possible to save ina XML file data about the features used, the number of balls, thejoints between balls, the number of broken joints, the time neededto finish the game. This data showed that there is a faster progres-sion in the learning of the game in the sequential mode than theattentive one which needs more time to be understood and evenmore to find efficient tactics. Indeed, this mode needs to build asocial structure in the team with a leader and specialized players,while the sequential mode needs no specific involvement as all theplayers have the same role and the only solution to play is to waityour turn. In the sequential mode, people learn the game very fastand in only 3 trials, a team of 3 people went from 460 seconds and39 balls needed to finish the game to 250 seconds and 23 balls. Forthe attentive mode, people went from 627 seconds and 36 balls to501 seconds and 31 balls after a dozen of trials.
6.2. Attention Selection: Eye-tracking Study
To validate our attention-based selection system, we can test whatwould draw the attention of a human put in the same conditionsas the proposed game system. For this purpose, we simulated atypical three-player scenario located in the same place. The RGBstream as viewed by the system was recorded and displayed on ascreen where eye tracking [6] was performed using a commercialFaceLab 5 system. The 10 users who took part to the test were peo-ple from 25 to 35 years old, 3 females and 7 males. They were notaware about the game principle and they were just asked to watchin a natural way a video where 3 players were already segmented(black background to avoid stimuli coming from the background).No particular task was given to the users, thus their attention wasmainly driven by bottom-up features even if top-down influencewas also present as one of the three players in the video gazing toanother player which also push the eye-tracked users to look in thesame direction.
Within the bottom-up features, the static ones like color wereused only at the very beginning of the observation, so during mostof the video observation, users used bottom-up motion and posi-tion features. The results of this test (Figure 8) is surprisingly wellcorrelated to contrasted people behavior, which is also the mecha-nism used by the proposed system. Of course this test setup usesone contrasted feature at each time and one of the three players isclearly contrasted, while in reality when people play, who is themost contrasted is sometimes not obvious even for humans.
The inter-personal distance is a very interesting feature whichhas clearly an effect on human attention (Figure 9) that we tookinto account in [9] but within the game with no network the featurewas not easy to apply. The three players do not have enough lateralspace to really change the inter-personal distances.
7. DISCUSSION AND CONCLUSION
In this paper we presented an original way of selecting an activeuser in a network game. Visual attention is implemented into thesystem which becomes able to choose the active player not by us-ing pre-programmed paradigms but by adaptively finding the mostoutstanding player in any situation.
This work shows an important improvement potential. Thefirst task will be to make more tests on user perception on the newgame which is much more stable and simpler to understand thanfor the initial tests with the players’ questionnaire. A better imple-mentation and deeper analysis of the data saved into the XML fileconcerning the ball structure construction is also needed. From
69

QPSR of the numediart research program, Vol. 4, No. 3, September 2011
Figure 8: The 10 user eye gaze (yellow points) overlaying on threedifferent frames of the video. For each case the player achieving adifferent bahvior is gazed by the majority of the 10 users.
the XML file it is for example possible to extract the character-istics of the ball structure shape (Figure 10). A very large basisand a displacement of the balls during its construction may signifythat the structure collapsed during the game, so the constructionwas not very efficient. Colors can be assigned to each user to seechat tactics were used to get information about the tactics used forexample.
Within the new network development, it would be interestingto integrate the inter-personal distance feature in the virtual spaceof the game and monitor people positioning when they are locatedin the same place or in different locations. Surprising people po-sitioning (one user far from the group for example) can be veryattracting from a saliency point of view.
On the game level, we are planning to integrate a team versusteam mode. At the application start-up, the players will have toselect the number of teams and the type of playground. Two typesof playgrounds will be proposed: “shared” or “boxed”.
The type “shared” proposes only one playground and one goal.The gravity will not be linear but radial. The balls will fall towardsthe borders of the widow and reach the goal which will be locatedin the playground center. The players will be able to interact with
Figure 9: The inter-personal distance seems also to be taken intoaccount during the eye-tracking tests.
Figure 10: Ball structure properties extraction (area, height/widthratio, density, . . . ). Colors correspond to players who dropped theballs.
other teams. The type “boxed” proposes a playground by team.No interaction with other teams will be possible. An example canbe seen in Figure 11 with four teams.
The current version of the game focuses on players’ interac-tions. All the players having a common goal, we can track thereaction of each player against the team. In the next versions theconcurrence aspect induced by the existence of several teams withdifferent or the same goal will be interesting to analyze.
By making people play we can test in fact the social interac-tions between them in several contexts: in the same team with acommon goal, in several teams under concurrence. The interest-ing aspect is that, through a game, it would be possible to observethe social evolution within a team, the emergence of a leader, theemergence of specialized players, the efficiency evolution of theteam if several leaders are placed into the same team.
Finally another interesting topic is in the study of the socialinteractions between players who are co-located or located in dif-ferent places. The first tests seem indeed to show that even if thereis a common goal and the players were told to play together, peoplewho are not located in the same place tend to act like concurrentteams and to see which location participated the most into the finalstructure. This is an interesting social behavior emergence whichwas not planned at the beginning.
70