Quarterly newsletter for verification engineers Issue 2 ... · Quarterly newsletter for...
16
Issue 2 | 2013 Quarterly newsletter for verification engineers Advanced Verification Bulletin Speeding Up Our High-Performance SoC Verification About This Issue Welcome to the Advanced Verification Bulletin! With every leap in design complexity, verification grows in importance. Consequently, the role of the verification engineer becomes more visible and grows more difficult. Greater access to the newest trends and thoughts in advanced verification can play a major part in aiding the verification community In order, then, to help you grow as a verification professional, we are pleased to present this edition of the Advanced Verification Bulletin (AVB). The goal of the AVB is to provide valuable practice, tool, and trend insights to you, the verification professional, so that you will gain a greater understanding of best practices and upcoming trends in Synopsys Verification. Inside this issue, you’ll find: ` A guest article from Sadahiro Kimura of Ricoh, who shares his thoughts upon recent successes in verification… ` An ‘Inside Synopsys’ view of emerging trends in debug, emulation, functional verification, mixed signal verification and VIP … ` An update on upcoming events of interest to the verification community We hope that you will find this issue AVB useful and timely! Regards, The Advanced Verification Bulletin Team We welcome your comments, suggestions, and topic ideas, so feel free to send us your feedback at [email protected]. In This Issue Using VCS Save/Restore to Boost Simulation Productivity ..........................4 Boosting Verification Performance with Transaction-Based Verification using Emulation .....................................6 Using Functional Qualification to Ensure Quality of Your Verification Environment ...........................................8 Achieving Performance Verification of ARM-Processor-based SoCs .......... 10 Verdi 3 -Enabled Gate-Level Debug on Multi-Hundred-Million Gate Designs ...12 Multi-Threading and Discovery-AMS: Boosting Mixed-Signal Verification Performance ........................................ 14 Upcoming Events................................. 16 Resources ............................................ 16 For our business, the most demanding verification issue that we face today is verifying our software, such as device drivers, alongside the SoC hardware. The increase in SoC design size and complexity, along with escalating software content, is a critical issue. For a 20- nm gate imaging device it will take our verification team a couple of weeks to complete a single simulation of the whole device. If we wait until we have final RTL before we start to verify the software, there is a high risk that we won’t be able to keep to the project development schedule. There’s no question that it’s difficult to verify the system running software code—it’s a very big issue. Improving our verification performance isn’t a matter of improving a single tool. It is a platform- based issue. To enable early software-hardware verification, we have had to re-think our approach to developing SoCs, and carefully consider our project schedules. We needed new ways to verify software drivers along with the hardware design and operating system working together. Ricoh’s Sadahiro Kimura explains how taking a platform-based approach to SoC verification has helped his team achieve a faster turnaround time for software and firmware development.
Transcript of Quarterly newsletter for verification engineers Issue 2 ... · Quarterly newsletter for...

Issue 2 | 2013Quarterly newsletter for verification engineers
Advanced Verification
Bulletin
Speeding Up Our High-Performance SoC Verification
About This Issue
Welcome to the Advanced Verification
Bulletin!
With every leap in design complexity,
verification grows in importance.
Consequently, the role of the verification
engineer becomes more visible and grows
more difficult. Greater access to the
newest trends and thoughts in advanced
verification can play a major part in aiding
the verification community
In order, then, to help you grow as a
verification professional, we are pleased
to present this edition of the Advanced
Verification Bulletin (AVB). The goal of the
AVB is to provide valuable practice, tool,
and trend insights to you, the verification
professional, so that you will gain a greater
understanding of best practices and
upcoming trends in Synopsys Verification.
Inside this issue, you’ll find:
`` A guest article from Sadahiro Kimura of
Ricoh, who shares his thoughts upon
recent successes in verification…
`` An ‘Inside Synopsys’ view of emerging
trends in debug, emulation, functional
verification, mixed signal verification
and VIP …
`` An update on upcoming events of
interest to the verification community
We hope that you will find this issue AVB
useful and timely!
Regards,
The Advanced Verification Bulletin Team
We welcome your comments, suggestions,
and topic ideas, so feel free to send us your
feedback at [email protected].
In This Issue
Using VCS Save/Restore to Boost Simulation Productivity ..........................4
Boosting Verification Performance with Transaction-Based Verification using Emulation .....................................6
Using Functional Qualification to Ensure Quality of Your Verification Environment ...........................................8
Achieving Performance Verification of ARM-Processor-based SoCs ..........10
Verdi3-Enabled Gate-Level Debug on Multi-Hundred-Million Gate Designs ...12
Multi-Threading and Discovery-AMS: Boosting Mixed-Signal Verification Performance ........................................14
Upcoming Events .................................16
Resources ............................................16
For our business, the most demanding
verification issue that we face today is
verifying our software, such as device
drivers, alongside the SoC hardware.
The increase in SoC design size and
complexity, along with escalating software
content, is a critical issue. For a 20-
nm gate imaging device it will take our
verification team a couple of weeks to
complete a single simulation of the whole
device. If we wait until we have final RTL
before we start to verify the software,
there is a high risk that we won’t be able to
keep to the project development schedule.
There’s no question that it’s difficult
to verify the system running software
code—it’s a very big issue. Improving our
verification performance isn’t a matter of
improving a single tool. It is a platform-
based issue.
To enable early software-hardware
verification, we have had to re-think
our approach to developing SoCs, and
carefully consider our project schedules.
We needed new ways to verify software
drivers along with the hardware design and
operating system working together.
Ricoh’s Sadahiro Kimura explains how taking a platform-based approach to SoC verification has helped his team achieve a faster turnaround time for software and firmware development.

Advanced Verification Bulletin Issue 2 | 20132
Verification StrategyWe have looked at mixed verification
solutions, and we have been early adopters
of HW/SW bring up verification, including
emulation technology.
As a result of our platform-based
approach, we not only improved our
overall verification performance, but we
have achieved some early successes with
system-level verification. For example,
we have created our own environment
comprised of VCS® working in concert with
ZeBu-server emulation and Virtualizer™
virtual prototyping. These tools form the
basis of our co-emulation methodology,
enabling us to combine existing register
transfer level (RTL) blocks with virtual
models of the design. Most recently, we
have been able to compile the RTL for a
graphics processor unit into our emulator
and then link it to a virtual prototype
containing system-level models of the CPU
cores, buses and other logic.
This approach saved us time and effort in
verification compared to the conventional
approach of developing models of pre-
existing design blocks. This improvement in
verification performance enabled us to start
our software development several months
earlier than is possible with a traditional
methodology. We have since enjoyed similar
successes with OS boot development, and
writing application software.
These accomplishments have helped us to
refine and evolve our verification strategy,
which is to integrate both HW-based
and RTL verification in order to improve
the quality of our software development
process and reduce turnaround time.
As a result of our early adoption of this
methodology, we have developed a great
deal of system-level verification know-how
within Ricoh.
Cost DriversFive years ago SoCs were not mainstream
designs—the processor was a separate
chip from an ASIC. The rise of SoC
design has led design teams to integrate
complex hardware subsystems including
DSPs, multiple processors and memories
onto a single chip. Designers link
these subsystems using bus-based
architectures, which adds complexity to
the process of analyzing and confirming
the performance of the complete SoC. In
addition to the added hardware complexity
compared with ASIC design, we now have
embedded software to contend with, as
well as the issue of designing and verifying
bus-based architectures. The result of all
of this increased complexity is that around
60% of our chip development costs are
going to hardware and embedded software
verification.
Using SoCs requires that we use a
processor model, which ultimately
drives our need for faster simulation
performance. We don’t use an RTL model
of the processor as we don’t really require
detailed timing information, but we must
have the best verification performance
possible.
The Need for SpeedOne of our current challenges is to further
speed up simulations, which is a key
business driver. Our designs are large and
complex, and we have to simulate the CPU
along with the device drivers before we
have the rest of the design ready. Using
virtualized models enables us to create
a flexible development environment and
accomplish our need to start verifying
the processor and drivers in advance of
completing the hardware.
Depending on the needs of the project, the
benefit of achieving higher-performance
simulation enables the verification team
to choose between accelerating the
schedule and performing more exhaustive
simulation. Faster simulation also gives us
more time to evaluate the performance of
the architectures.
Collaboration
Platform-basedVerification
Improved ScheduleFlexibility
Increased VerificationPerformance
Reduced HW/SWDevelopment Time
Cohesive HW/SW Team
Shared Best Practices
“Not myjob”
Ricoh Verification Success Keys
Advanced Verification Bulletin Issue 2 | 2013 3
Towards an Integrated Flow…Another challenge we have faced
in pursuing our high-performance
verification strategy is to integrate the
point tools that make up our flow. In fact,
integration is probably the most important
and most difficult part of assembling our
verification flow. Connecting our current
set of primary verification tools to achieve
the level of integration and productivity
our design teams required to accomplish
their tasks took us around six months.
Since Synopsys has now acquired
Springsoft and EVE, we are anticipating
a much tighter integration between
these tools and a more complete SoC
verification flow that works “right out
of the box”. A common user interface
would make the environment easier to
use and more productive for our end
users, while closer integration will reduce
the engineering effort we have to make
in order to produce a flow that meets
our needs. We hope that this strategic
move by Synopsys will help to reduce
our project schedules and improve our
verification productivity and quality.
And an Integrated Team…From an organizational perspective, the
most important aspect is that we are
able to bring together hardware and
software engineers in a single, cohesive
team. We want our software engineers
to have insight and understanding of
the hardware, and vice versa. Our aim
is to eliminate the attitude that it’s “not
my job”. We believe that this more
collaborative approach, along with
sharing best practices and developing
skills across the team, are major
contributors to our recent success.
A more recent milestone—achieved
as a result of combining hardware and
software development tools and teams—
was the design of a device driver to
work with a processor (CPU) for use in a
multifunction printer controller, which we
produced to work with a range of printer
models. By using the Synopsys emulation
environment, we were able to simulate
the CPU performance without having the
physical hardware. And, as a result, we
were able to develop the device driver in
about a month, which was a record time
for Ricoh.
Looking to the FutureLooking forward, we believe that the
verification platform methodology is
here to stay. We will continue to develop
platform-based design environments in
an effort to tackle rising chip complexity,
get the most performance out of our
verification approach, and to enable
efficient and productive hardware-
software design and verification. It
makes good engineering sense, as our
early successes confirm, and we think it
will ultimately pay dividends in making
our SoC verification flow efficient and
powerful for years to come.
About the Author Sadahiro Kimura joined Ricoh after
graduating from the Nara Institute of
Science and Technology. At Ricoh
he has been involved in a number of
activities including semiconductor
process technology, DSP firmware
and developing LSI devices for
wireless communication.
He currently manages a design team
that develops core technology for
new business. The team is focused
on electronic system level design and
multicore technology.
Sadahiro Kimura Section Manager

Advanced Verification Bulletin Issue 2 | 20134
In SoC verification we must model and
validate not only block-level functionality,
but also system-level interactions. The
massive expansion in the number of
scenarios that need to be validated during
SoC testing is leading to exponential
growth in the number of regression tests
that a given verification team performs.
This dramatic increase in regression
time and difficulty analyzing the complex
regression has been killing project
schedules. It becomes difficult to do bug
tracking and close coverage goals. All of
this measurably affects time-to-market and
can make or break a product’s success.
In light of these new SoC requirements,
Synopsys has focused on many aspects
of performance improvement technologies
including enhancing the Save/Restore
feature in VCS® functional verification tools.
Save/Restore allows engineers to leverage
replication across tests in a regression—
focusing simulation cycles only on unique
test elements. Users can shortcut many
simulation cycles and dramatically reduce
time spent in regression testing.
Understanding Save/Restore In its simplest form, Save/ Restore
provides a mechanism for a verification
team to create a snapshot of a simulation
at a specific point in time (save) that can
be replayed for subsequent simulations
(restore). However, it has been enhanced
with the ability to have different seeds
for simulation before the save and after a
restore.
This means that a verification team can,
for example, run a reset sequence, save
that sequence, and then run an entire tree
of unique clock cycles off of that single
point, rather than including the entire reset
sequence in each further test sequence
simulation.
Using VCS Save/Restore to Boost Simulation Productivity
Figure 1: Testcase running as separate configurations
As companies consolidate on SoC-
based designs, verification challenges
are converging. When SoCs are being
verified, system-level interactions must
be modeled and validated. Verification
teams must, for example, test not
only the functionality of a graphics
core and communication peripherals
on their SoC, but they might also
need to validate the interaction of the
processors with those peripherals
and even whether the processor
core can respond quickly enough to
screen input. All of this is leading to
unique challenges around simulation
throughput, performance testing,
application-level modeling, debug,
and much more. In this piece we will
explore a unique method of leveraging
replication in test suites to reduce
simulation runtimes.
Functional Verification
Test1 reset
Test2 reset
Test3 reset
Test4 reset
Test5 reset
Test6 reset
Test7 reset
Test ‘n’ reset
Test1 payload (functionality)
Test2 payload (functionality)
Test3 payload (functionality)
Test4 payload (functionality)
Test5 payload (functionality)
Test6 payload (functionality)
Test7 payload (functionality)
Test ‘n’ payload (functionality)
Rebecca Lipon Product Marketing Manager for Functional Verification

Advanced Verification Bulletin Issue 2 | 2013 5
Figure 1 shows every simulation running
the same reset sequence followed by a
payload sequence. By using save/restore,
the reset sequence is only run one time
instead of “n” times—with “n” being the
number of total payload sequences.
Using save/restore, when the end of a
reset sequence of the common testcase
is detected by the testbench, the
testbench sends a save request to VCS
using a VCS system task and sets a flag
to indicate that a save was requested.
VCS then services this save request at
the end of the current event time and
checks the save request flag in the next
cycle. If it was raised, VCS issues a
$finish call to terminate the test one cycle
after reset has completed. This ensures
that the save has time to execute and
complete before the simulation exits.
To start a set of tests from the saved
image, a user adds a flag to the usual
test execution environment that shows
that a saved image with the requested
simulation model is available. The VCS
simulation engine registers a restore
callback. When the simulation executes,
it will first load the restore image, which
brings the simulation to the point where
the common testcase left off. Immediately
after this state is restored, VCS executes
the previously registered callback to
handle changes specific to each testcase.
The callback parses the new command
line, processes any new options,
randomizes changes, and loads the
new testcase image into the simulation
memory model.
The creation of the common saved
image is handled as an additional post-
build task. The simulation infrastructure
requires a new switch to provide the
location of the saved image, but the
simulation command line can otherwise
remain intact.
This allows users not only to save time by
reducing the number of simulation cycles,
but also simplifies the debug process.
Figure 2: Testcase running as a single configuration
SummaryThe enhanced VCS Save/Restore
function is fairly easy to execute, requires
minimal engineering change, and works
within an existing environment. It has
already improved verification productivity
for many SoC verification teams, reducing
their simulation time between 10 and 40
percent.
Reset sequence image
Test1 payload (functionality)
Test2 payload (functionality)
Test3 payload (functionality)
Test4 payload (functionality)
Test5 payload (functionality)
Test6 payload (functionality)
Test7 payload (functionality)
Test ‘n’ payload (functionality)
Fun
ction
al Verificatio
n

Advanced Verification Bulletin Issue 2 | 20136
Boosting Verification Performance with Transaction-Based Verification using Emulation
By combining the Synopsys ZeBu
Server family of emulation systems
with a transaction-based verification
(TBV) methodology, design teams can
now achieve orders of magnitude faster
verification of complex, multi-core SoC’s.
In this article, we will introduce some
of the different use modes available in
today’s emulation systems and show why
TBV is becoming the preferred emulation
verification methodology.
In-Circuit Emulation (ICE)With in-circuit emulation (ICE), the
design under test (DUT) is modeled in an
emulation system while the testbench is
comprised of a set of physical interfaces
to real devices and target systems
that directly drive the design. The key
benefits of ICE are performance and
accuracy. The emulator delivers many
orders of magnitude faster verification
performance, while using live data to drive
the design, and can closely approximate
a ”real world” environment. The most
significant disadvantage is that each
physical interface requires a rate adapter
to link live data running at full speed with
the emulation system running at lower
speeds. These rate adapters are becoming
increasingly more difficult to build and
maintain as real-world clock rates continue
to increase and emulation speeds remain
in the single-digit MHz range.
Co-simulation with Emulation SystemsCo-simulation, also referred to as
simulation acceleration, is an early
emulation methodology intended to
combine the speed of ICE with the
flexibility of simulation. Conceptually,
this verification approach is very
straightforward as it merely moves the
DUT from a host PC to a high-performance
emulator, while the testbench consists of
an existing simulation testbench on a host
PC. The two are connected by a PLI wire-
level interface; the simulation environment
then drives the DUT using the testbench.
Unfortunately, co-simulation does not
generally provide significant performance
improvements over simulation. The wire-
level interface can be overwhelmed by
signal transitions. In a typical verification
environment, there are thousands of
signals at the interface with many signals
changing multiple times within each clock
period. Each of these changes must be
transferred between the testbench and
DUT on every occurrence.
Additionally, the testbench itself will limit
performance. If the testbench is 25% of the
PC compute load and the DUT 75%, for
example, then moving the entire DUT to the
emulation system will yield acceleration—
but never more than 4x of simulation.
TBV with EmulationWith TBV, like co-simulation, the DUT is
modeled in the emulation system while
the testbench resides on a host PC. But
instead of a wire-level interface, TBV
uses a high-performance interface using
transaction-level communication between
the testbench and the emulation system.
This transaction-level interface dramatically
reduces the strain on the testbench-DUT
communication channel, so it supports
very fast data transfers and allows the
testbench to be tightly or loosely coupled
to the DUT.
The key benefit of TBV is that it delivers
orders of magnitude higher verification
performance relative to co-simulation—
similar to in-circuit emulation. Unlike ICE,
however, TBV does not require physical
rate adapters, which as noted earlier,
are increasingly difficult to provide. With
High-performance emulation is becoming
a critical part of the SoC verification
process. Increases in the number of
external interfaces, chip complexity,
associated software, and sheer gate
count are driving design teams to higher-
performance verification methodologies.
In-circuit emulation (ICE) was the
prevalent use mode for emulation in
its early years, and while ICE is still
in use today, newer emulation use
modes have come into the picture.
The combination of a large number of
industry-standard protocols and the
complexity of configuring an ICE-based
verification environment has driven
many SoC design teams toward a newer
emulation methodology—Transaction-
based Verification (TBV). The Synopsys
ZeBu Server family of emulation systems
supports this methodology, while
delivering the highest emulation speed in
the industry.
Emulation
Larry Vivolo Product Marketing Director for Emulation

Advanced Verification Bulletin Issue 2 | 2013 7
TBV, the communication between the
testbench and the DUT is accomplished
through a high performance “transactor”.
The transactor converts high-level
commands from the testbench into
wire-level, protocol-specific sequences
required by the DUT, and vice-versa.
Transactors are architected to keep all
wire-level communications within the
emulation system itself, where they
execute orders of magnitude faster
than on the PC. Since transactors are
software based, they are far easier to
create and maintain vs. physical rate
adapters. Synopsys, for example, offers
a vast library of off-the-shelf transactors
for the latest versions of standard bus
and peripheral interface protocols.
Additionally, Synopsys offers the
ZEMI-3 Compiler to enable the speedy
development of custom, proprietary
transactors.
For further performance improvements,
transactors are also architected to enable
the testbench to stream data to the DUT,
which is buffered automatically. Multiple
transactions can be active in parallel to
deliver maximum performance as this
enables the emulation system to process
data continuously.
ConclusionTBV with ZeBu emulation systems offer
design teams a unique opportunity to
accelerate SoC verification. By raising the
level of abstraction of their verification
environment, teams can achieve multiple
orders of magnitude improvement on
SoC
PC
Displaywindow
Displaywindow
Image
NIC card
Image
SWCODEC
Emulator
RTB DUT
Software-basedvirtual test
environment
RTB
SynthesizableDDR2 memory
ARM11core
DSPcore
Logic
Memory
DDR2 memoryinterface
Flash memoryinterface
NT3C TVinterface
LCD displayinterface
Terminalinterface
Digital still camerainterface
Keypadinterface
USB 2.0host controller
Ethernet 10/100interface
I2S audiointerface
JTAGinterface
Synthesizableflash memory
C interface HW interfaceNTSCtransactor
C interface HW interfaceLCDtransactor
C interface HW interfaceUARTtransactor
C interface HW interfaceMIPI CSItransactor
C interface HW interfaceKeypadtransactor
C interface HW interfaceUSB devicetransactor
C interface HW interfaceEthernettransactor
C interface HW interfaceI2Stransactor
C interface HW interfaceJTAGtransactor
Imagefiles
NIC d
USBC model
Ethernet
Transactors
Figure 1: Transactors enable high-level communication between the testbench and emulation system
Em
ulatio
n
their verification performance. With TBV,
designers have access to a platform that
delivers MHz performance for block- and
system-level verification, as well as early
HW/SW bring-up. Because the entire
environment is software configurable, it
is very easy to quickly download designs
for different SoCs and their transaction-
based test environments, providing
flexibility and high utilization rates for the
emulation system.

Advanced Verification Bulletin Issue 2 | 20138
Using Functional Qualification to Ensure Quality of Your Verification Environment
In recent years, verification complexity has
skyrocketed. With today’s dynamic SoCs,
testbench code can dwarf the size of the
RTL code it is verifying. With this level of
complexity, bugs in testbench code can be
as dangerous as bugs in RTL code.
Enter Functional Qualification with
Synopsys Certitude. Using Certitude
functional qualification tools, a verification
team can get an accurate assessment of
their testbench’s ability to find design-
critical bugs, and save themselves
millions of dollars from missed bugs, or
unnecessary simulations.
Introduction to Functional QualificationFunctional qualification tools systematically
introduce “faults”—or changes in design
functionality that would impact chip
functionality—into the design code, and
then run the verification test suite to see if
the faults are detected by the testbench. A
team can use this information to improve
the checkers in the testbench and enhance
coverage.
Obviously, it would be impossible to identify
every single fault that could possibly be
in a testbench, or every coding error a
testbench creator could make. Instead,
Certitude focuses on the most critical
faults that might come into a design,
including: connectivity faults, reset faults,
synchronous-control faults, and logic faults.
Performing Functional QualificationFunctional qualification consists of three
distinct phases.
1. The model phase: users configure
the RTL files that will be targeted for
qualification as well as the types of
faults that are allowed to be inserted.
Certitude then parses the files to
determine all of the possible locations
that faults could be inserted and
creates instrumented versions of the
code for use in the next two phases.
2. The activate phase: the user first
configures all the tests to be used
in the qualification and which seeds
(if necessary) should be used for
the test. The software will then run
Many testbenches contain legacy
code that might not fit a current
protocol. USB3, for example, has
data throughput that may exceed
400MB/sec whereas USB 2.0 typically
only supports up to 35-40MB/
sec. Not only is the throughput 10x
greater, the complexity (dual-simplex
simultaneous bi-directional data
flow for SuperSpeed vs. half-duplex
unidirectional data flow, among other
things) requires 10x the number of
scenarios be validated. If you haven’t
updated your testbench to reflect that
protocol change and the additional
scenario coverage, there is a high
probability that your testbench is
missing key functionality. But then
again, maybe it’s not. It can be very
hard to determine the true quality of a
testbench using traditional methods.
Functional qualification, however, can
help you assess the true quality of
your testbench, and ensure that you’re
not missing design-critical errors.
Advanced Verification
Rebecca Lipon Product Marketing Manager for Functional Verification
Injects bugs (faults)into RTL
Bugsdetected
Verificationenvironment “good”
Errors inverificationenvironment
No bugsdetected
DesignRun
VerificationEnvironment
=
=
Figure 1: Certitude Functional Qualification Process

Advanced Verification Bulletin Issue 2 | 2013 9
each test one time to determine
the runtime and which faults are
‘activated’ by each test. A fault is
considered ‘activated’ by a test if
the line of design code containing
the fault was executed at least once
during the test. It is considered ‘not
activated’ if no test in the entire test
suite executes the lines containing
the fault.
3. The detect phase: in this final phase
each fault is considered in isolation
by inserting the fault and running the
tests that activate the fault serially,
from shortest to longest, to determine
if any test detects the fault. A fault is
considered “detected” by a test if the
test fails when the fault is inserted
and passes when it is not present.
Table 1: Fault Classification
Ad
vanced
Verificatio
n
Category Description
Non-Activated No test capable of activating the fault
Non-Propagated Fault Activated, but not propagated to a checker
Non-Detected Fault propagated to a checker, but no fail reported
Detected At least one test reported a failure
If no test that activated a fault fails when
the fault is inserted, then either the fault is:
1) ‘on-propagated’, which means there
was no difference observed at the
output of the design when compared
to the same test with no fault inserted;
or 2) ‘Non-detected’, which means that
there was a difference in the output of the
design compared to the no fault test, but
the test checkers did not report a failure.
In the former case, there is a propagation
issue from the DUT into the testbench
which can be isolated and fixed. In the
later case, obviously essential checkers
are missing within the testbench and
the verification team now knows where
they need to target additional verification
effort.
Report
Report
Report
RFault Model Analysis
RFault Activation Analysis
RFault Detection Analysis
Static analysis of design
Analysis of the verificationenvironment behavior
Measure the ability of theverification environmentto detect mutations
Figure 2: Functional Qualification Phases
Using this process, it is possible to
identify design-critical errors in the
testbench environment such as: missing
checkers on DUT outputs, missing reset
tests and checks, logic that is activated
but poorly propagated, missing negative
checks, or incorrect checkers.
SummaryGiven the complexity and size of modern
verification environments, it is critical to
do some kind of functional analysis of
the testbench itself. Certitude can give
verification engineers the confidence to
know that their testbench is covering their
design-critical faults.

Advanced Verification Bulletin Issue 2 | 201310
Achieving Performance Verification of ARM-Processor-based SoCs
OverviewTraditionally, meeting performance goals
has been the purview of the system
architect and RTL design engineer while
the RTL verification engineer has been
focused on verifying functionality.
Now, using Discovery Verification IP,
system architects and RTL verification
teams working on ARM-Processor-based
SoCs can verify performance while
doing functional verification, thereby
uncovering hidden performance issues.
This functionality allows teams to avoid
delays from late architectural changes
or, worse, compromises on system-level
performance.
Case StudyIn this case, we are going to do
performance verification for a multicore
AMBA-based server SoC. In addition
to multiple ARM-based processors,
it contains a hardware-based cache-
coherent interconnect, more than 12 IP
blocks, a graphics processor, and all
related interconnect. Any performance
verification flow must link the system
specification process with the verification
process. We do this using Synopsys
Platform Architect™, Discovery Verification
IP (VIP), Discovery Protocol Analyzer™ and
VCS™.
The system architect uses Platform
Architect to run different configurations
of the SoC for an optimized system
configuration. Working from C-level
models, and focusing on the most critical
application use cases, Platform Architect
offers complete behavioral analysis of chip
performance. Using it, the team can make
intelligent tradeoffs between cache, line-
width, number of sets, and interconnect
parameters in order to achieve optimal
system performance.
Once these parameters are set, the SoC
moves to RTL implementation. Verification
engineers primarily focus on ensuring that
everything is obeying the specification
and maintaining cache coherency: first
with the interconnect RTL, and then as
the IP blocks are inserted in the design.
By using Discovery Verification IP (VIP)
Sequencecollections
Configurationcreator
Customization
RVP environment for ACE protocol
Sequences Systemchecks
Systemconfiguration
Systemsequencesgenerator
Systemmonitor
ACEmaster[0]
Interconnect environment/group
ACEmaster[1]
ACE-Litemaster[2]
ACE-Liteslave[0]
Coverage
Debug
Userverification plan
Protocoltest plan
Protocolanalyzer
DVE
Coveragedatabase
VIP
sourcevisib
ility
Native UVM/VMM/OVM
Figure 1: Discovery VIP Reference Design Platform
Traditionally, meeting performance
goals has been the purview of the
system architect and RTL design
engineer while the RTL verification
engineer has been focused on
verifying functionality.
Now, using Discovery Verification IP,
system architects and RTL verification
teams working on ARM-Processor-
based SoCs can verify performance
while doing functional verification,
thereby uncovering hidden
performance issues and avoiding
delays from late system architecture
changes or, worse, compromises on
performance.
Neill Mullinger Product Marketing Manager for Verification IP
Verification IP

Advanced Verification Bulletin Issue 2 | 2013 11
it is easy for the verification team to
check performance constraints during
this process—with virtually no additional
effort.
Discovery VIP offers a reference
verification platform (RVP) (see figure 2)
that includes: a pre-built ACE topology
with all the masters and slaves pre-
configured; stimulus, checking and
coverage using the built-in sequences;
checks that run at the ports and across
the system; and built-in coverage
in conjunction with the appropriate
verification plans. It also includes a
coverage closure workflow exercise that
takes a user through all of the steps of
configuring, compiling, running, viewing
results, and debug using the VIP, Protocol
Analyzer, VCS and either DVE (VCS
debug environment) or Verdi. It is written
purely in SystemVerilog and is fully
customizable for different designs.
All if this makes it easy and fast to build
a functional and performance-friendly,
verification environment.
Now that we have our environment set
up, we run the simulation with VIP running
in VCS. Monitors are connected at each
interconnect port to look for correct
cache-coherency during simulation.
The constraint definitions—including
performance—are configured into the
monitors. So, performance constraints can
be flagged along with functional issues.
VIP traffic will typically be a wider range
than the traffic used by the system
architects. The system architects are
focused on performance and focus on
running the traffic they have identified
as most likely to have the greatest
impact on performance and throughput.
Now we want to verify that the system
is performing to the specification so
verification engineers will try to stress
the system to make sure it follows the full
breadth of the protocol. Sometimes this
will find performance issues that were not
anticipated by the system architects and
they may re-run the scenarios in Platform
Architect to see if they require some
reconfiguration. Other times it may just
be a type of traffic that, while breaking
the performance constraints, is extremely
unlikely to happen in the real world and
so doesn’t justify re-designing the system
configuration.
Finally, our user can use Discovery
Protocol Analyzer™ for protocol-aware
debug so a user can quickly find the root-
cause of warnings and errors. It offers a
view of individual transactions, but can
drop into a pin-based or waveform view
as needed using Verdi or DVE.
In SummaryVerification IP is a critical component of
any SoC functional verification strategy.
However, now, instead of just giving
you exceptional functional coverage,
Synopsys Discovery VIP can also give
exceptional coverage for performance
verification.
Figure 2: SystemVerilog Verification IP in SystemC testbench
Verificatio
n IP
SystemVerilogUVM VIP
SystemCcycle accurate TLM
SystemCfast timed TLM
ACE cache coherent interconnect (DUT)
ACE VIPtraffic and
cache
VIP monitor
VIP driver
ACE VIPtraffic and
cache
VIP monitor
VIP driver
ACE VIPtraffic and
cache
VIP monitor
VIP monitor
VIP monitor
VIP driver
SystemCinitiator
SystemCinitiator
TLMmemory
Constraintdefinitions
TLMmemory
transactor
transactor
Cycle accurate AXI4 bus
Cycle accurate AXI4 bus
VCS
Figure 3: Protocol Analyzer at work
Concurrenttransactions
Time
Transcript of messages, errors,warnings at time of transaction
Bus activitySelectedREADUNIQUE

Advanced Verification Bulletin Issue 2 | 201312
Verdi3-Enabled Gate-Level Debug on Multi-Hundred-Million Gate Designs
It is difficult to debug a design with
hundreds of millions of gates. No one
wants to wait half an hour to load a
design and then another half hour to
bring up a schematic view. However, in
most cases, when a user is debugging a
gate-level design, the user will start from a
problematic instance or signal. As a result,
basic debugging capabilities like searching
instance ports and tracing fan-in/fan-out
can be sufficient for gate-level debugging.
Therefore, tool performance is often more
important for a design engineer than
advanced debug capabilities.
The Verdi3 platform provides a new
“Gate-Level Debug Mode” that offers a
better approach for debugging gate-level
designs. Available in the Verdi3_2013.04
release, the “Gate-Level Debug Mode”
gives users faster design compiles
and import time by skipping complex
RTL syntax checking. The reason is
that a gate-level design netlist is very
straightforward; the netlist description
is simply connections of the instances.
With each new process generation,
design scale increases dramatically.
Today’s complex SoCs often contain
hundreds of millions of gates. When a
design moves from RTL to a flattened
gate-level netlist, the resulting file
database expands exponentially.
As a result, when debugging these
large, gate-level designs, it is often
very time-consuming just to import a
design into EDA tools and open the
huge schematic, let alone to actually do
debugging work.
In this article, I’ll describe how Verdi3
“Gate-Level Debug Mode” offers a
superior approach for debugging these
increasingly large gate-level designs.
Debug
Figure 1: Gate-Level Debug Window
Rich Chang Product Marketing Manager, Debug
When debugging at the gate-level, it’s
also meaningless to browse the netlist
source code; it doesn’t make much sense
to open a full hierarchy of schematics.
All these actions will slow down tool
performance without dramatically helping
a user’s debugging. Verdi3 now provides
a fast search mechanism for problematic
instances and ports; a user can see the
partial schematic and waveforms from
the found instance ports quickly and start
debugging from there.
How Does This Work?To use the Gate-Level Debug Mode, the
command line option –fastGate is added
when invoking the Verdi3 platform. Verdi3
under this mode will have a different
window layout customized for gate-level
debug.
Once the design is loaded into Verdi, a user
can start searching for the instance s/he
needs to debug. Simply type the instance
you want to debug. Verdi will list the
instance from which to debug.
Advanced Verification Bulletin Issue 2 | 2013 13
Deb
ug
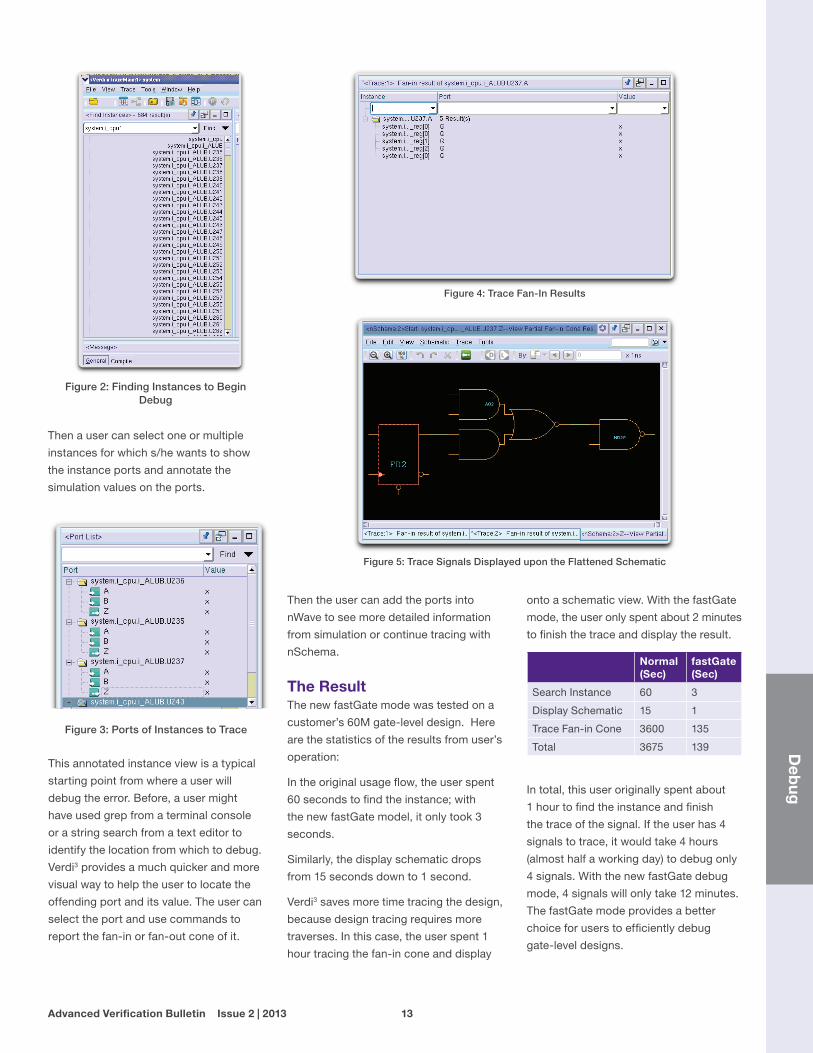
Figure 2: Finding Instances to Begin Debug
Figure 4: Trace Fan-In Results
Figure 3: Ports of Instances to Trace
Then a user can select one or multiple
instances for which s/he wants to show
the instance ports and annotate the
simulation values on the ports.
Then the user can add the ports into
nWave to see more detailed information
from simulation or continue tracing with
nSchema.
The ResultThe new fastGate mode was tested on a
customer’s 60M gate-level design. Here
are the statistics of the results from user’s
operation:
In the original usage flow, the user spent
60 seconds to find the instance; with
the new fastGate model, it only took 3
seconds.
Similarly, the display schematic drops
from 15 seconds down to 1 second.
Verdi3 saves more time tracing the design,
because design tracing requires more
traverses. In this case, the user spent 1
hour tracing the fan-in cone and display
onto a schematic view. With the fastGate
mode, the user only spent about 2 minutes
to finish the trace and display the result.
Normal(Sec)
fastGate (Sec)
Search Instance 60 3
Display Schematic 15 1
Trace Fan-in Cone 3600 135
Total 3675 139
In total, this user originally spent about
1 hour to find the instance and finish
the trace of the signal. If the user has 4
signals to trace, it would take 4 hours
(almost half a working day) to debug only
4 signals. With the new fastGate debug
mode, 4 signals will only take 12 minutes.
The fastGate mode provides a better
choice for users to efficiently debug
gate-level designs.
This annotated instance view is a typical
starting point from where a user will
debug the error. Before, a user might
have used grep from a terminal console
or a string search from a text editor to
identify the location from which to debug.
Verdi3 provides a much quicker and more
visual way to help the user to locate the
offending port and its value. The user can
select the port and use commands to
report the fan-in or fan-out cone of it.
Figure 5: Trace Signals Displayed upon the Flattened Schematic

Advanced Verification Bulletin Issue 2 | 201314
Multi-Threading and Discovery-AMS: Boosting Mixed-Signal Verification Performance
Discovery-AMS, by taking advantage
of the direct kernel integration of
CustomSim™ and VCS®, has established
itself as the fastest mixed-signal solution
available. The most recent release
of a powerful new multi-threading
capability in CustomSim-XA 2013.3 has
enabled even further improvement in
mixed-signal simulation performance for
Discovery-AMS.
Promising Results on Big Analog CircuitsThis feature, first introduced in our
CustomSim-XA product, uses a
revolutionary technique based upon the
well- known Newton-Raphson algorithm,
By combining the efficiency of a Fast-Spice
solver with multithreading, we were able
to boost performance up to 10X and
significantly speed up large partitions on
multiple CPUs without loss in accuracy.
This boost makes it particularly useful for
analog circuits with large partitions and
synchronous groups.
System-on-chip (SoC) devices, that
in the past contained mostly digital
circuitry, now contain significant analog
and mixed-signal content. Synopsys’
Discovery AMS Solution addresses the
increasing need for AMS verification.
This article showcases Discovery-AMS
performance by presenting its latest
multi-core simulation technology that
can accelerate simulation performance
by up to 10X. We will show you how
Discovery-AMS multi-core technology
has helped a large communications
systems design customer improve their
overall verification flow.
For more insight into this and other
topics in AMS verification, I invite you to
visit my analog themed blog at http://
blogs.synopsys.com/analoginsights
Analog Mixed-Signal
Helene Thibieroz Sr. Product Marketing Manager for Analog Mixed Signal Simulation
During our beta testing, CustomSim-XA
multi-core technology showed its value in
demanding real-world simulation situations
such as IR/EM, high-accuracy full-chip
simulation and final full-chip verification.
Single core simulations in these cases
can typically take 2 or 3 days to complete;
with multi-core technology many of our
customers completed these simulations
in less than 24 hours. Further examination
showed that for many transient analyses,
the performance scaled linearly with the
number of cores.
Extending Multi-threading to Mixed Signal VerificationWhen extended to the full Discovery-AMS
simulation capability, the new multi-
threading feature yielded similar
performance improvements in practical
application. Examples of this boost were
seen by a mixed-signal design team at a
major customer, who measured a significant
jump in the verification performance of two
complex real world designs.
Digital/analogPWL
Functionalsequence
Spies/assertions
Analog IPsspice
Application componentsspice
Analog IPsVHDL-RN
Digital coreVHDL/Verilog
Spice on top
SimulusVHDL-RN
Figure 1: PMU configuration: SPICE-on-Top
Advanced Verification Bulletin Issue 2 | 2013 15
An
alog
Mixed
-Sig
nal
For these designs, the landscape was
comprised of analog transistors (in
both SPICE and VHDL-RN) and both
Verilog and VHDL-based RTL blocks in a
“Spice on Top” configuration, driven by
VHDL-RN stimuli.
Initially, a power management unit (PMU)
was chosen as a suitably challenging
design. The chip was simulated using
Discovery-AMS on 12 cores using two
separate compositions of analog vs.
digital blocks. Since it was assumed that
a larger transistor-level presence in the
DUT would slow simulation performance,
the first test was to simulate using a
minimum block of analog as transistors.
The gain in performance vs. a single core
was approximately 3.5x.
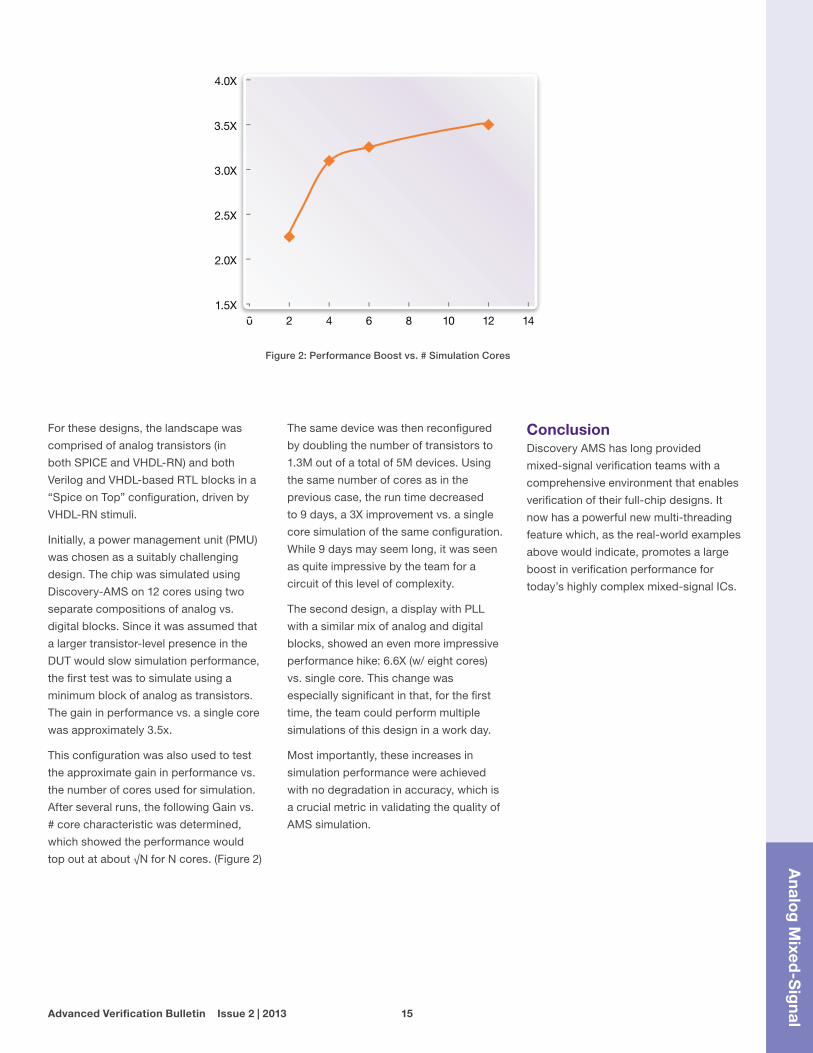
This configuration was also used to test
the approximate gain in performance vs.
the number of cores used for simulation.
After several runs, the following Gain vs.
# core characteristic was determined,
which showed the performance would
top out at about √N for N cores. (Figure 2)
4.0X
3.5X
3.0X
2.5X
2.0X
1.5X0
X
X
X
X
X
X0 2 4 6 8 10 12 14
The same device was then reconfigured
by doubling the number of transistors to
1.3M out of a total of 5M devices. Using
the same number of cores as in the
previous case, the run time decreased
to 9 days, a 3X improvement vs. a single
core simulation of the same configuration.
While 9 days may seem long, it was seen
as quite impressive by the team for a
circuit of this level of complexity.
The second design, a display with PLL
with a similar mix of analog and digital
blocks, showed an even more impressive
performance hike: 6.6X (w/ eight cores)
vs. single core. This change was
especially significant in that, for the first
time, the team could perform multiple
simulations of this design in a work day.
Most importantly, these increases in
simulation performance were achieved
with no degradation in accuracy, which is
a crucial metric in validating the quality of
AMS simulation.
Figure 2: Performance Boost vs. # Simulation Cores
ConclusionDiscovery AMS has long provided
mixed-signal verification teams with a
comprehensive environment that enables
verification of their full-chip designs. It
now has a powerful new multi-threading
feature which, as the real-world examples
above would indicate, promotes a large
boost in verification performance for
today’s highly complex mixed-signal ICs.

©2013 Synopsys, Inc. All rights reserved. Synopsys is a trademark of Synopsys, Inc. in the United States and other countries. A list of Synopsys trademarks is available at http://www.synopsys.com/copyright.html. All other names mentioned herein are trademarks or registered trademarks of their respective owners.
Synopsys, Inc. 700 East Middlefield Road Mountain View, CA 94043 www.synopsys.com
05/13.TT.CS3026/CPR/500.
Resources
Functional Verification www.synopsys.com/Tools/Verification/
FunctionalVerification
Debugwww.synopsys.com/Tools/Verification/
Debug
Verification IPwww.synopsys.com/Tools/Verification/
FunctionalVerification/VerificationIP
Hardware-Based Verificationwww.synopsys.com/Tools/Verification/
Hardware-verification
Synopsys SolvNetsolvnet.synopsys.com
Analog Mixed Signal Verification www.synopsys.com/Tools/Verification/
AMSVerification
Feedback and SubmissionsWe welcome your comments and
suggestions. Also, tell us if you are
interested in contributing to a future
article. Please send your email to
Upcoming Events 2013
Verification Seminar SeriesVarious locations WW
February-December
(Check with your local representative)
HW/SW Verification SymposiaVarious locations WW
March–August
(Check with your local representative)
Design Automation ConferenceAustin, TX
June 2-6
PCI-SIG Developers ConferenceSanta Clara, CA
June 25-26
Intel Developers ForumSan Francisco, CA
September 10
SNUG BostonBoston, MA
September 12
SNUG AustinAustin, TX
September 18
ARM TechConSanta Clara, CA
October 29-31