![Accounts & Inventory ERP System[ ver: 1.0.102] Coding Profile Pre Shipment Purchase Sales Sampling Inventory Expiry Pharma Accounts Marketing Utilities Server Distributors Current](https://static.fdocuments.net/doc/165x107/5f25f3176f58614e1128b6ac/accounts-inventory-erp-system-ver-10102-coding-profile-pre-shipment.jpg)
Quarterly National Accounts Inventory based on ESA 2010 ...
48
Quarterly National Accounts Inventory based on ESA 2010 methodology Bosnia and Herzegovina IPA 2015 Multi-beneficiary Statistical Cooperation Programme Service Contract No. 14463.2015.002-2016.602 Contact persons: Vanja Erak ( [email protected]) - GDP by Production and Income Approach Edina Kozić ( [email protected] –GDP by Production and Income Approach Aida Mehić ( [email protected] ) - GDP by Expenditure Approach Sarajevo, June 2019
Transcript of Quarterly National Accounts Inventory based on ESA 2010 ...

Quarterly National Accounts
Inventory based on ESA 2010 methodology
Bosnia and Herzegovina
IPA 2015 Multi-beneficiary Statistical Cooperation Programme
Service Contract No. 14463.2015.002-2016.602
Contact persons:
Vanja Erak ([email protected]) - GDP by Production and Income Approach
Edina Kozić ([email protected] –GDP by Production and Income Approach
Aida Mehić ([email protected]) - GDP by Expenditure Approach
Sarajevo,
June 2019

IPA 2015 Multi‐beneficiary Programme on Statistics
2
CONTENTS
Contents 2
0. Introduction 4
1. Overview of the system of quarterly national accounts 4
1.1. Organisation and institutional arrangements 4
1.2. Publication timetable, revisions policy and dissemination of QNA 4
1.3. QNA compilation approach 5
1.4. Balancing, benchmarking and other reconciliation procedures 6
1.5. Volume estimates 6
1.6. Seasonal adjustment and working day correction 7
1.7. Additional information 7
2. Publication timetable, revisions policy and dissemination of QNA 9
2.1. Release policy 9
2.2. Contents published 9
2.3. Special transmissions 9
2.4. Policy for metadata 10
3. Overall QNA compilation approach 11
3.1. Overall compilation approach 11
3.2. Balancing, benchmarking and other reconciliation procedures 12
3.3. Volume estimates 13
3.4. Seasonal adjustment and working day correction 14
4. GDP components: the production approach 16
4.1. Gross value added 16
4.2. FISIM 21

IPA 2015 Multi‐beneficiary Programme on Statistics
3
4.3. Taxes less subsidies on products 21
5. GDP components: the expenditure approach 23
5.1. Household final consumption 23
5.2. Government final consumption 24
5.3. NPISH final consumption 24
5.4. Gross capital formation 25
5.5. Exports and imports 25
6. GDP components: the income approach 29
6.1. Compensation of employees 30
6.2. Taxes less subsidies on production 30
6.3. Gross operating surplus & mixed income 31
7. Population and employment 32
7.1. Population 32
7.2. Employment: persons 32
7.3. Employment: total hours worked 32
8. Flash estimates 33
8.1. Flash GDP estimate 33
8.2. Flash employment estimate 33
8.3. Other existing flash estimate, if any 33
9. Main data sources used 34

IPA 2015 Multi‐beneficiary Programme on Statistics
4
0. INTRODUCTION
This document is produced within the framework of IPA 2015 Multi-beneficiary Statistical
Cooperation Programme Service Contract No. 14463.2015.002 -2016.602
The aim of this document is to provide a description of data sources and compilation methods,
which are used for quarterly national accounts (QNA) in Bosnia and Herzegovina based on ESA
2010 metodology.
1. OVERVIEW OF THE SYSTEM OF QUARTERLY NATIONAL ACCOUNTS
The Agency for Statistics of Bosnia and Herzegovina (BHAS) has been compiling quarterly GDP
since 2013. In the compilation of the quarterly GDP, two methods are used: direct methods
(administrative data sources and surveys) and indirect methods (indicators).
1.1. ORGANISATION AND INSTITUTIONAL ARRANGEMENTS
Quarterly and annual national accounts are compiled by the Agency for Statistics of Bosnia and
Herzegovina – Sector of Economic Statistics. The Economic Statistics Directorate calculates the
GDP figures in accordance with the UN System of National Accounts (SNA 2008) and the
European System of National Accounts (ESA 2010) manuals.
GDP is calculated according to three approaches: production, expenditure and income
approach. The production approach is a leading one because of more reliable d ata sources.
There is no separate organisational unit for quarterly national accounts. In total, 6 persons are
included in the quarterly GDP calculation, 3 from the production and income side and 3 from
the expenditure side. They are responsible for annual as well as quarterly GDP calculations.
1.2. PUBLICATION TIMETABLE, REVISIONS POLICY AND DISSEMINATION OF QNA
The Agency for Statistics for Bosnia and Herzegovina (BHAS) presented for the first time
quarterly gross domestic product (GDP) estimates by production approach for Bosnia and
Herzegovina on June 2013. Estimates are available for the period 2006 - 2012 with a breakdown
by economic activity at the section level of the Statistical Classification of Economic Activities
in the European Community (NACE Rev 1.1). In the early 2014 BHAS has started publishing dat a
by new classification (NACE Rev. 2). Time series by new classification are available since 2008Q1.
The estimate is publishing 90 days after the end of reference period.
GDP estimates by expenditure approach was presented for the first time on May 2015. Data
by major categories of expenditure at current prices, previous year prices, prices of the

IPA 2015 Multi‐beneficiary Programme on Statistics
5
reference year (2010 = 100) and real growth rates were presented. Time series by expenditure
approach are available since 2008Q1.
1.3. QNA COMPILATION APPROACH
Agency for Statistics of Bosnia and Herzegovina compiles national accounts, including QNA,
according to the concepts, definitions, classification and accounting rules of European system
of account (ESA 2010). Quarterly GDP is compiled by production, income and expenditure
approaches. Unlike the annual accounts for which direct measures of the variables are
available, limited direct information is available on a quarterly basis and the estimates are
primarily based on indicators. Indicators at detailed level of economic activities (2 digits of the
NACE Rev 1.1 and NACE Rev. 2) have been used to quarterly allocate the annual estimates for
years for which the corresponding annual estimates are available and to produce estimates for
the most recent year for which no annual data are available.
From the technical point of view, all the tables have been prepared on Microsoft Excel. For
carrying out seasonal adjustment JDemetra+ has been used.
In general: there are two main approaches for compiling QNA estimates:
• Direct approach and
• Indirect approach
The direct approach means that the quarterly values of the required variables are obtained
directly from the source data (for example: output of a given activity provided by a
representative quarterly establishment survey or household consumption on a spec ific item
obtained directly from a household income and expenditure survey, the value of output,
intermediate consumption and value added of utility companies from their quarterly financial
statements, possibly government quarterly accounts, etc.).
The indirect approach is in fact more widely used, as there will be usually a lack of sufficient
direct observation available on a quarterly basis. The indirect method means that an indicator
related to the target variable is chosen to reflect its quarterly mov ement. The indicator can be
an index, number or a value. Examples of indicators are the monthly industrial production
indices, revenue from sales, output of a subset of the universe of enterprises, etc. One of the
main features required for an indicator is that its annual growth will be highly correlated with
the annual growth of the target variable.
GDP by expenditure approach in current prices is primarily based on direct data sources such
as: quarterly estimates by commodity flow methods. These estimates are based on detailed
data on Imports and Exports at 8-digit level of foreign trade statistics nomenclature and the
PRODCOM survey, regularly published monthly by Agency for Statistics of Bosnia and
.

IPA 2015 Multi‐beneficiary Programme on Statistics
6
Herzegovina, quarterly Balance of Payment data (Central Bank of Bosnia and Herzegovina) and
other administrative data sources.
1.4. BALANCING, BENCHMARKING AND OTHER RECONCILIATION PROCEDURES
An important property of the quarterly national accounts is their consistency with the annual
accounts, that is, the sum of the four quarters for any given year should be equal to the
corresponding annual estimate. This identity is obtained by means of a statistical procedure
called „benchmarking”. The Proportional Denton benchmarking method has been used in the
compilation of the quarterly GDP of the Bosnia and Herzegovina, thus preserving as much as
possible the intra-annual movement of the indicators but subject to the restriction that the sum
of the resulting quarterly estimates should be identical to the annual data (the benchmark).
The Denton method that has been used is an Excel function for benchmarking quarterly series
to annual series, which was developed by the IMF’s Statistics Department with the objective to
help compilers of quarterly national accounts (QNA) in benchmarking annual national accounts
(ANA) series with related quarterly indicator series. The benchmarking problem arises when
time series data for the same target variable are measured at different frequencies with
different level of accuracy and there is the need to remove discrepancies between annual
benchmarks and corresponding sums of the sub-annual values. The optimal combination of
annual levels and quarterly movements requires an adjustment, which preserves as much as
possible the short-term movements in the preliminary infra-annual sources subject to the
restrictions provided by the annual constraints.
The IMF manual on QNA recommends using the Denton’s proportional first differences (PFD)
benchmarking method with enhancements for extrapolation. This method is optimal because it
preserves as much as possible the short-term movements in the quarterly source data under
the restrictions provided by the annual data and, at the same time ensures for the extrapolated
quarters that the final estimate of the year is as close as possible to the unknown annual data.
1.5. VOLUME ESTIMATES
Quarterly GDP data focus on short-term movements of the economy, while the main purpose
of the quarterly GDP estimate is the calculation of the volume changes. The purpose of t he
valuation in volume terms is to assess the dynamics of economic development irrespective of
price fluctuations.
Quarterly GDP data series are presented at current prices , at prices of the previous year and
chain-linked values with a fixed reference period. As requested by EU regulations and also being
the most common practice among countries, quarterly volume measures of GDP, like in the
annual accounts, are estimated at prices of the previous year, that is, the prices used for the

IPA 2015 Multi‐beneficiary Programme on Statistics
7
derivation of the volume measures change every year to better reflect the most current
structure of price relatives.
The calculation of GDP at previous year prices means that the previous year is taken as base
year. In this way, the structural changes in relative prices that occurred between two
consecutive years in an economy are taken into account. The measurement of the real GDP
movement in year t relative to year t‐1 requires that GDP in both years is valued at the same
prices. This means that GDP in year t at constant prices, i.e. previous year prices is compared
with GDP of year t‐1 at current prices. Time series calculated at previous year prices could not
be used for real growth rate calculations since data are not comparable (each year is valued at
previous year’s prices).
To obtain comparable series, the method of chain‐linking is applied, where indicators in the
form of indices referenced to the previous year are chain‐linked to a single reference year.
The choice of the reference year does not affect the growth rate changes, as they always
remain the same. Currently, the year 2010 is used as the reference year. For the purpose of
quarterly chain‐linking the recommended annual overlap method is applied. This technique
is used for calculating quarter‐on‐quarter growth rates, which are considered the most
important figures for business cycle analysis.
Chain linking of quarterly data is technically more complicated than that of annual data. EU
Member States and a vast majority of other countries have decided to use for the chain-
linking of quarterly estimations, the average prices of the previous year (annual overlap
technique), rather than the prices of the previous quarter.
1.6. SEASONAL ADJUSTMENT AND WORKING DAY CORRECTION
Seasonal adjustment is a process of time series decomposition, which removes seasonal effects
on time series behavior. The seasonally adjusted series remove from the original data the
quarterly seasonal fluctuations and the calendar effects. The series have been seasonally
adjusted by means of the JDemetra+ software using the TRAMO-SEATS method. The direct
method was used (each series was seasonally adjusted, directly). Sum of quarterly seasonally
adjusted data in a year is not equal to the sum of non-seasonally adjusted data. There are no
working day corrections.
In Bosnia and Herzegovina seasonally adjusted series of quarterly GDP and its components are
available for two methods of calculation: production and expenditure (Table 0101 and 0102).
1.7. ADDITIONAL INFORMATION
The main page related to quarterly GDP in the Bosnia and Herzegovina can be found at:
http://bhas.gov.ba/Home/

IPA 2015 Multi‐beneficiary Programme on Statistics
8
Complete time series of quarterly GDP can be downloaded from:
http://bhas.gov.ba/Calendar/Category/12?lang=bs

IPA 2015 Multi‐beneficiary Programme on Statistics
9
2. PUBLICATION TIMETABLE, REVISIONS POLICY AND DISSEMINATION OF QNA
2.1. RELEASE POLICY
The publication timetable has not been implemented yet.
2.2. CONTENTS PUBLISHED
The following quarterly tables of the ESA 2010 Transmission Programme are published
nationally at T+90 days after the end of the reference quarter:
Table 0101: Gross value added at basic prices and gross domestic product at market prices (gross
value added is published in A10 breakdown). All time series are available from the 1st quarter
2008.
Table 0102: Gross domestic product at market prices by the expenditure approach. All time
series are available from the 1st quarter 2008.
External users can obtain quarterly GDP data on the official website i n the form of First release.
The following data are published and can be downloaded in PDF form:
GDP by production approach-table 0101:
Table 1 GDP by production approach at current prices
Table.2 GDP by production approach at previous year prices
Table 3 GDP by production approach, chain linked at prices 2010
Table.3.1 GDP by production approach, chain linked at prices 2010 (real growth rates),
comparison with corresponding quarter of previous year (Q/Q-4)
Table.3.2 GDP by production approach, seasonally adjusted data, chain linked at prices 2010
(real growth rates), comparison with the previous quarter (Q/Q -1)
GDP by expenditure approach-table 0102:
Table 1 GDP by expenditure approach at current prices
Table.2 GDP by expenditure approach at previous year prices
Table 3 GDP by expenditure approach, chain linked at prices 2010
Table.3.1 GDP by expenditure approach, chain linked at prices 2010 (real growth rates),
comparison with corresponding quarter of previous year (Q/Q-4)
IPA 2015 Multi‐beneficiary Programme on Statistics
10
Table.3.2 GDP by expenditure approach, seasonally adjusted data, chain linked at prices 2010
(real growth rates), comparison with the previous quarter (Q/Q -1)
Transmition tables 0103 was send to Eurostat, starting with the Q42018, but not published in
the Bosnia and Hercegovina at the moment.
2.3. SPECIAL TRANSMISSIONS
Quarterly GDP of the Bosnia and Herzegovina subscribes to the General Data Dissemination e-
GDDS - The Enhanced General Data Dissemination System established by the International
Monetary Fund (IMF).
2.4. POLICY FOR METADATA
Metadata related to national accounts can be found at:
http://bhas.gov.ba/data/Publikacije/ESMS/NAC_00_Q_LOC.pdf

IPA 2015 Multi‐beneficiary Programme on Statistics
11
3. OVERALL QNA COMPILATION APPROACH
3.1. OVERALL COMPILATION APPROACH
GDP calculation by production approach is performed in two stages: calculations at current
prices and previous year prices, and chain-linking results with prices of the fixed reference
period.
In the first stage calculations are carried out at current prices and at prices of previous year.
Estimation procedures use the Denton method for benchmarking the quarterly estimates of
output and intermediate consumption to the annual benchmarks. Since benchmarking requires
data on a series format, the volume indicators and benchmark estimates are rebased to the
reference year (selected by convenience, first it was 2005 and now it is 2010). The benchmarked
estimates at prices of the reference period are then rebased to prices of previous year by up -
scaling the data using the chain-linked annual implicit deflators. Value added at prices of
previous year is obtained as the difference between output and intermediate consumption,
both at prices of previous year.
In the second stage, chain-linked volume measures are calculated: series of chain-linked indices
are independently calculated for sections, FISIM, taxes on products and imports, subsidies on
products, net taxes, GVA of all activities, GVA and GDP.
The GDP at market prices is derived from GVA at basic prices by adding taxes less subsidies on
products.
GDP by expenditure approach in current prices is primarily based on direct data sources such
as: quarterly estimates based on commodity flow methods. These estimates are based on
detailed data on Imports and Exports at 8-digit level of foreign trade statistics nomenclature
and the PRODCOM survey published monthly by Agency for Statistics of Bosnia and
Herzegovina, quarterly Balance of Payment data (Central Bank of Bosnia and Herzegovina) and
other administrative data sources.
Final consumption expenditure of households is compiling on the very similar way as in the
annual estimates. Commodity flow methods are used for the quarterly estimates of
consumption of manufactured products These estimates are based on detailed data on imports
and exports at the 8-digit level of the foreign trade statistics nomenclature, the monthly
PRODCOM survey, industrial production and producer price indices at the 4 -digit level of the
industrial classification.
Consumption of services is based mostly on indicators such as real income, population,
employment, and components of the consumer price index (CPI) corresponding to the type of
service. Quarterly estimates of output (derived within the framework of quarterly GDP by
IPA 2015 Multi‐beneficiary Programme on Statistics
12
production) of a given service is used as indicator if they are relevant for household’s
consumption. Direct data on consumption are available for utilities on a quarterly basis.
Quarterly estimates of collective and individual general government consumption exp enditures
are consistent with the respective estimates of output within the framework of quarterly GDP
estimates by production.
There are no quarterly indicators for the estimates of NPISHs. The respective benchmarked
quarterly estimates are obtained by using HFCE estimates as indicator.
Quarterly estimates of gross fixed capital formation in construction assets are obtained by
benchmarking the quarterly indicator of output of the construction activity derived from
quarterly GDP by production to the annual estimates of capital formation in construction
assets. Commodity flow methods are used for the quarterly estimates of capital formation on
machinery and equipment. This estimate is based on detailed data on foreign trade, the
monthly PRODCOM survey, and the industrial production index.
Imports and exports of goods and services are based on the quarterly Balance of payments data
of the Central Bank of Bosnia and Herzegovina.
3.2. BALANCING, BENCHMARKING AND OTHER RECONCILIATION PROCEDURES
GDP is calculated on the basis of three approaches: the production approach, the expenditure
approach and the income approach. A description of each approach is provided in the following
paragraphs. GDP at market prices is the final result of the production activity of resident
producer units. It can be defined in three ways:
On the basis of the production side, GDP can be measured as:
(B.1g) gross value added (at basic prices)
+ (D.21) Taxes on products
- (D.31) Subsidies on products
= (B.1*g) Gross Domestic Product at market prices
From the expenditure side, GDP can be measured as :
(P.3) + final consumption expenditure of households
+ final consumption expenditure of NPISH
+ final consumption expenditure of General Government
= total final consumption expenditure

IPA 2015 Multi‐beneficiary Programme on Statistics
13
(P.51) + gross fixed capital formation (P.52) + changes in inventories
(P.6) + exports of goods and services (P.7)- imports of goods and services
(B.1*g) = Gross Domestic Product at market prices
From the income side, GDP can be measured as:
(D.1) Compensation of employees
+ (B.2g/B.3g) Gross operating surplus / Mixed income
+ (D.2) Taxes on production and imports
- (D.3) Subsidies on production
= (B.1*g) Gross Domestic Product at market prices
While in theory each method should, conceptually, produce the same estimate of GDP, if the
three measures of GDP are compiled independently using different data sources, then different
estimates of GDP result.
In Bosnia and Herzegovina there are nationally published annual GDP by production, income
and annual GDP by expenditure approach at current, previous year prices and chain -linked
volumes.
GDP by production approach and GDP by income approach are the same in current prices, on
the annual as well as on the quarterly level. Annual GDP by production approach and annual
GDP by expenditure approach are not harmonising at current, previous year prices and chain -
linked values.
There are also nationally published two quarterly GDP data by production and expenditure
approach at current, previous year prices and chain-linked volumes. Quarterly GDP data by
production approach are harmonising with annual GDP data by production approach, and
quarterly GDP data by expenditure approach are harmonise with annual GDP data by
expenditure approach at current, previous year prices and chain -linked volumes.
3.3. VOLUME ESTIMATES
Quarterly GDP data series are presented at current prices and as volume measures at prices of
the previous year and as chain-linked values with a fixed reference period. As requested by EU
regulations and also being the most common practice among countries, quarterly volume
measures of GDP, like in the annual accounts, are estimated at prices of the previous year, that
is, the prices used for the derivation of the volume measures change every year to better reflect
the most current structure of price relatives.
IPA 2015 Multi‐beneficiary Programme on Statistics
14
However, volume values at prices of a previous year allow for the comparison of the data only
between 2 successive years (data at previous year prices for any given year with the annual
current price data of the previous year). In order to obtain long -term series, estimates of
volume measures at prices of previous year are chain-linked (annual overlap) to produce series
at a fixed reference period, thus allowing the comparison between any chosen different
periods. The selected fixed reference period in Bosnia and Herzegovina was 2005 and now it is
2010.
Individual components of the GDP by expenditure categories at constant prices are calculated
by deflating each component with corresponding CPI. Estimates at previous year prices are
calculated at the detailed levels (at the 4 digit or 5-digit level of the COICOP classification) of
the estimates using matching categories of the CPI. Estimates of HFCE at one -digit level of
COICOP are calculated as 2010 chain-linked volume measures using the annual overlap method.
Guvernment final consumption expenditure at prices of previous year is obtained by deflating
the current price estimates with the implicit deflator of output corresponding NACE in the
quarterly production approach. The annual overlap method is used to estimate chain-linked
volume measures at 2010 prices.
For Gross fixed capital formation at prices of previous year are obtained by deflating the current
price estimates with the producer price index for machinery and equipment in the EU.
Exports and Imports of goods are deflated by detail UVI indices. Exports of services are deflated
by corresponding domestic CPI, while the imports of services are delated by the CPI of main
partner contries.
Starting with Q1 2017 exports of goods are deflated by industrial producer price indices on non-
domestic market and imports of goods by weighted indices taking into account foreign
countries producer price indices on non-domestic market, exchange rates and structure of
Bosnia and Hercegovina imports by geografical breakdown.
3.4. SEASONAL ADJUSTMENT AND WORKING DAY CORRECTION
Seasonal adjustment and working-days correction
In Bosnia and Herzegovina seasonally adjusted series of quarterly GDP and its components are
available for two methods of calculation: production and expenditure.
There are no working day corrections.
IPA 2015 Multi‐beneficiary Programme on Statistics
15
Coverage of adjusted and published figures
Breakdown and level of detail is in accordance with the ESA 2010 Transmission Programme. The
following tables of ESA 2010 Transmission Programme are currently adjusted and sent to
Eurostat:
Table 0101 – Gross value added at basic prices and gross domestic product at market
prices; at current, previous years’ prices and chain link values
Table 0102 – GDP identity from the expenditure side at current, previous years’
prices and chain link values
Table 0103 – GDP identity from the income side only at current prices
o As results of this project
Method of adjustment
The TRAMO-SEATS method is used as implemented in JDemetra+ version 2.2.0 for all series in
QNA. The choice between additive and multiplicative models is performed by using built -in test
in TRAMO-SEATS.
Time consistency
At present, seasonally adjusted quarterly data are not consistent with the annual non -adjusted
data.
Accounting consistency
At the Agency for Statistics of Bosnia and Herzegovina, GDP is seasonally adjusted by the direct
method. The calculation of quarterly GDP by the production approach is considered to be more
reliable due to the existence of exhaustive data sources and a very detailed level of calculation.
Revision policy
Currently at the Agency for Statistics of Bosnia and Herzegovina there is no official revision
policy for seasonally adjusted data.
Policy for working-days correction
Currently at the Agency for Statistics of Bosnia and Herzegovina there are no working day
corrections.
IPA 2015 Multi‐beneficiary Programme on Statistics
16
4. GDP COMPONENTS: THE PRODUCTION APPROACH
In this chapter the main focus is on the sources and methods for estimation of gross value added
for both current prices and volume terms (chapter 4.1).
The method for estimation of FISIM is explained in chapter 4.2 as well as calculation of taxes
and subsidies on products at basic prices (chapter 4.3). These variables correspond to table
NAMAIN_T0101 of the ESA2010 transmission programme.
Value added at basic prices equals output at basic prices, reduced by intermediate consumption
at purchaser`s prices. The quarterly estimates of taxes and subsidies on products are added to
the estimation of QGVA in order to obtain QGDP at market prices.
The classification of business entities by activities is in line with the KD Bosnia and Herzegovina
2010, which is directly comparable to the NACE Rev. 2 classification.
The calculation is done at the 2 digit KD Bosnia and Herzegovina 2010 levels.
4.1. GROSS VALUE ADDED
Gross value added is calculated as a difference between output and intermediate consumption.
4.1.1. AGRICULTURE, FORESTRY AND FISHING (A)
Calculations of value added for the agriculture, forestry and fishing acti vities (KD A) are done
separately for agriculture (KD 01), for forestry (KD 02) and for fishing (KD 03).
Division 01: Crop and animal production, hunting and related service activities
Fixed quantity allocation of production by all individual products in the year 2005 was used for
all years in the series. The weighted average prices of 2005 and 2010 were used to calculate
output by product for the quarterly series. From these estimates at 2005 and later 2010 prices,
a volume Laspeyres index was derived and used as the volume indicator of output. Processed
agriculture products were excluded as they should be in manufacturing. Annual data on
production are available 3 months after the end of the year.
An implicit Paasche type deflator was calculated based on a sample covering most of agriculture
production. The deflator is obtained by dividing the estimates at current prices by the estimate
at prices of previous year over the sample of products for which both quantities and prices are
available on a quarterly basis. Since specific farm prices of agriculture products are available
only from the first quarter of 2009, backward estimates of prices were based on corresponding
changes in the CPI.

IPA 2015 Multi‐beneficiary Programme on Statistics
17
For extrapolation and preliminary estimates there are quarterly data on sales (quantities and
values) by enterprises and by individual producers (namely, direct sales from enterprises and
purchases from individuals). Data are based on a survey designed for the collection of prices.
The details by product are satisfactory but the size of the sample may not be representative of
the total population. Nevertheless, thare is no other source of high frequency data. Annual
production forecasts, which are lacking at present, would allow applying the same procedure as
in the historical series.
For preliminary estimates (forecasts), estimates at constant prices are prepared for the quarters
of 2012 by multipliying the quantities sold by the average sale price. The preliminary QNA
estimates (forecasts) for the first quarter are compiled at 2005 prices by extrapolation of the
estimate at 2005 of the first quarter of previous year using the over the year growth rate of the
estimates at constant prices.
This procedure implies that the quarterly constant prices estimates provide and annual forecast
which will change each time a new quarter is available. It is adopted because we want the annual
allocation for the new year to be consistent with the quarterly allocation in the historical serie
(linking on the fourth quarter of previous year may change this allocation if the quarterly
distribution of the indicator-the quarterly estimates at constant prices based on sales - differes
from the fixed factors used in the historical series). Adopting this procedure means that
estimates for previous quarters will be revised with the estimates of each additional quarter.
For prelimary estimates, the price indicator derived from the same quarterly survey on sales by
dividing the current values by the corresponding values at constant prices. These implicit
deflators will be chain-linked with the implicit deflators in the QNA estimates of previous year.
An alternative procedure is using and annual forecast of agriculture growth rate, used for
extrapolation of quarterly estimates of previous year (the same gr owth rate over the same
quarter of previous year for each of the four quarters).
Division 02: Forestry and logging
Although quarterly quantity production is available by type of tree for all years, there are no
prices available. The sum of all quantities was used as a volume indicator. The PPI for activity
16 (Manufacture of wood and of products of wood and cork, except furniture; manufacture of
articles of straw and plaiting materials) was used as price indicator. The same indicator is
available for preliminary estimates.
Division 03: Fishing and aquaculture
For historical series we used quarterisation of annual estimate at current and at constant prices.
4.1.2. MANUFACTURING, MINING, QUARRYING AND OTHER INDUSTRIES (B, C, D, E)

IPA 2015 Multi‐beneficiary Programme on Statistics
18
The estimation of gross value added for the activities manufacturing, mining, quarrying and
other industries (KD B, C, D and E) is cared out at 2-digit KD levels.
For the manufacturing industries (KD B, C and D) the quarterly allocation of output in the
historical series and for extrapolation is based on the Industrial Production Volume indices (IPI)
for each 2-digit activity. The same indicator is used for intermediate consumption, thus
assuming the movement of inputs to be proportional to the movements of outputs and allowing
the benchmarking procedure to correct in the QNA for the annual changes in the I/O ratios.
Similarly, as prices for intermediate consumption are lacking, the same PPI for the ac tivity is
used as price indicator for intermediate consumption.
Benchmarking of output at current prices is being applied by using as indicator a preliminary
value of output obtained as the product of the benchmarked values at constant prices and the
PPI for each 2-digit activity. The same procedure is applied to intermediate consumption.
The volume indicator for both output and intermediate consumption is the number of
employees for the activity Water supply, sewerage, waste management and remediation
activities (KD E). The price indicator for output and intermediate consumption is the CPI for
housing, water, electricity, gas and other fuels.
4.1.3. CONSTRUCTION (F)
The volume indicator for both output and intermediate consumption are the indices of
production in construction in Bosnia and Herzegovina. It is based on the number of hours
worked on sites and values of construction works.
The price indicator for output and intermediate consumption is PPI for the activity 23 (as
indicator of prices of raw materials).
4.1.4. WHOLESALE AND RETAIL TRADE, TRANSPORTATION AND STORAGE, ACCOMMODATION
AND FOOD SERVICE ACTIVITIES (G, H, I)
Despite the fact that value added for KD G, H and I are usually shown at aggregated level,
calculations are carried out separately for each of those activities at detailed levels.
Turnover deflated by general CPI was used as volume indicator. General CPI was used as price
indicator. Estimations are carried out separately for each activity: for KD 45 - Wholesale and
retail trade and repair of motor vehicles and motorcycles, for KD 46 - Wholesale trade, except
of motor vehicles and motorcycles and for KD 47 - Retail trade, except of motor vehicles and
motorcycles.
Compilation of value added for Transportation and storage (KD H) is carried out at 2-digit KD
level.
IPA 2015 Multi‐beneficiary Programme on Statistics
19
For KD 49 – Land transport and transport via pipelines and KD 50 - Water transport: A composite
volume index was compiled based on the structure of output updated each year, which provided
output separately for road transport of goods, road transport of passengers, and railway
transport of goods (about 80% of railway revenue). The relative shar es in output of these
categories were used to calculate an average weighted quarterly index composed by km -
passengers by road, ton-km of goods by road, and ton-km goods by railway. The resulting index
was used as indicator of both output and intermediate consumption. Price indicator is CPI for
transport.
Data of number of passengers was used as volume indicator of output and intermediate
consumption for the KD 51 – Air transport. CPI for air tickets was used as price indicator.
Turnover indices of transportation and storage activities were used as volume indicator of
output and intermediate consumption for KD 52 - Warehousing and support activities for
transportation. General CPI was used as price indicator.
For the KD 53 - Postal and courier activities number of letter was used as volume indicator. The
CPI for postal service was used as price indicator.
Accommodation and food service activities (KD I) consists of accommodation activities (KD 55)
and food and beverage service activities (KD 56). The volume indicator was derived from data
on turnover of hotels (for accommodation) and data on turnover of restaurants (for food and
beverage service activities) obtained from the monthly survey conducted by the entities and
Brcko district deflated by the matching category in the CPI. Turnover was used a s the nominal
indicator.
4.1.5. INFORMATIONA AND COMMUNICATION (J)
The calculations of value added for KD J – Information and communication are carried out at 2-
digit KD level. Employment was used as volume indicator for output and intermediate
consumption. CPI for specific activity was used as price indicator.
4.1.6. FINANCIAL AND INSURANCE ACTIVITIES (K)
Financial and insurance activities (KD K) consist of financial services (KD 64), Insurance,
reinsurance and pension funding (KD 65) and activities auxiliary to financial services and
insurance activities (KD 66).
For activity KD 64 - Financial service activities, except insurance and pension funding separate
estimates are made for FISIM and other services of banks. Quarterly output of FISIM at current
prices is obtained from the consolidated report of the banking services as the difference
between interest received and interest paid by banks (Ir -Ip). Estimates of FISIM at prices of 2005
IPA 2015 Multi‐beneficiary Programme on Statistics
20
(later 2010) were obtained as the difference between estima tes of interest received and paid
at prices of 2005 (later 2010). These estimates were respectively obtained by extrapolation of
interest received by a calculated volume index of banks’ assets and extrapolation of interest
paid by a volume index of banks’ liabilities. Quarterly current and constant prices of FISIM were
both benchmarked using the Denton method.
Explicit charges (fees): a nominal index of output is derived from actual quarterly data. A volume
indicator was derived by deflating the quarterly fees by the general CPI. This indicator was used
for obtaining the benchmarked quarterly estimates and for extrapolation of output and
intermediate consumption.
The nominal indicator for output of explicit services is quarterly actual revenue data.
Benchmarked volume estimates of intermediate consumption are multiplied by the general CPI
to produce a nominal indicator of intermediate consumption for benchmarking.
The quarterly estimate of total output for the activity at current prices is the sum of the
benchmarked values of FISIM and explicit services: Total output activity 65 = FISIM plus Fees
For the KD 65 - Insurance, reinsurance and pension funding, except compulsory social the
nominal value as difference between premiums and claims has been used as ind icator for output
and intermediate consumption at current prices. Volume indicator was derived by deflating
quarterly premiums by general CPI.
For KD 66 – Activities auxiliary to financial services and insurance activities the volume indicator
of output and intermediate consumption is based on the sum of output of activities 64 and 65.
The price indicator is CPI.
4.1.7. REAL ESTATE ACTIVITIES (L)
For the imputation of owner occupied dwellings has been used volume indicator based on the
quarterization of the annual volume measures. For intermediate consumption the benchmarked
estimates of output were used as indicator. As price indicator the CPI for rentals was used.
For Real estate activities, except the imputation for owner -occupied dwellings the volume
indicator is based on the number of employees. The benchmark is the total output of activity
less the imputed rent. CPI for actual rentals was used as price indicator. The same indicators
are used for intermediate consumption.
4.1.8. PROFESSIONAL, SCIENTIFIC, TECHNICAL, ADMINISTRATIVE AND SUPPORT SERVICE
ACTIVITIES (M, N)
The calculations for KD M – Professional, scientific and technical activities and KD N -
Administrative and support service activities are carried out at 2 -digit KD level. Employment
IPA 2015 Multi‐beneficiary Programme on Statistics
21
was used as volume indicator for output and intermediate consumption. CPI for specific activity
was used as price indicator.
4.1.9. PUBLIC ADMINISTRATION AND DEFENCE, EDUCATION, HUMAN HEALTH AND SOCIAL
WORK ACTIVITIES (O, P, Q)
Number of employees was used as volume indicator. For current price, for output, composite
price index made of total CPI and index of wages and salaries is used. For intermediate
consumption, general CPI was used as price indicator.
CPIQ1 * IC (%) + wages Q1(index) * VA (%)
4.1.10. OTHER SERVICE ACTIVITIES (R, S, T, U)
Employment was used as volume indicator for output and intermediate consumption. CPI for
specific activity was used as price indicator.
4.2. FISIM
Financial intermediation services indirectly measured (FISIM) are calculated at total economy
level. Quarterly output of FISIM at current prices is obtained from the consolidated report of
the banking services as the difference between interest received and interest paid by banks (Ir -
Ip). Estimates of FISIM at prices of 2005 (later 2010) were obtained as the difference between
estimates of interest received and paid at prices of 2005 (later 2010). These estimates were
respectively obtained by extrapolation of interest received by a calculated volume index of
banks’ assets and extrapolation of interest paid by a volume index of banks’ liabilities. Quarterly
current and constant prices of FISIM were both benchmarked using the Denton method.
4.3. TAXES LESS SUBSIDIES ON PRODUCTS
The main quarterly indicator used in the process of estimation of quarterly net taxes on products
is quarterly gross value added. The calculation carried out by applying nominal indices of
quarterly gross valued added (Q/Q-4). When annual data become available, the quarterly
estimates are reconciled ones.
Taxes on products
For the purpose of national accounts, BHAS takes the data on taxes from Indirect tax authority
(ITA). Data that are indirect taxes, besides VAT, are taxes on imports and import duties, excise
and all other taxes calculated on goods and services, also including sales taxes and railroad
taxes. All taxes on the mentioned grounds, as well as VAT, are paid into the Single account of
IPA 2015 Multi‐beneficiary Programme on Statistics
22
Indirect Taxation Authority of Bosnia and Herzegovina and allocated to the entities and the
Brcko District according to the agreed ratios of distribution.
Data are not classified by types of taxes and used in the total amount for GDP calculation.
Subsidies on products
Subsidies on products and services are non-returnable payments of government institutions to
market producers, provided for the production process of enterprises or for the sale or import
of products.
The main data source for subsidies on products is budgetary statistics.
IPA 2015 Multi‐beneficiary Programme on Statistics
23
5. GDP COMPONENTS: THE EXPENDITURE APPROACH
Apart from the production approach, the expenditure approach of the GDP compilation is the
second most important approach in Bosnia and Herzegovina. The expenditure approach
measures the sum of final uses of goods and services of resident institutional units decreased
by the value of import of goods and services. With the expenditure approach GDP is measured
as the sum of expenditures on goods and services for final consumption and gross capital
formation by units of the national economy plus exports less imports of goods and services.
Final consumption is the sum of expenditures on goods and services by households, NPISH and
general government. Gross capital formation is measured as the sum of expenditure on gross
fixed capital formation and changes in inventories. The GDP (E) is estimated separately, in
detailed structure. Finally, all these seven final uses for goods and services entering the
economy are summed up.
In this chapter the main focus is on the sources and methods for estimation of QGDP by
expenditure approach at current and constant prices in detail by components: household’s final
consumption expenditure (chapter 5.1), Goverment final consumption expenditure (chapter
5.2), NPISH final consumption expenditure (chapter 5.3), Gross capital fomation including Gross
fixed capital formation and Changes in inventories (chapter 5.4) and Exports and Imports of
goods end services (chapter 5.5).
These variables correspond to table NAMAIN_T0102 of the ESA2010 transmission programme.
5.1. HOUSEHOLD FINAL CONSUMPTION
Household final consumption expenditure is the largest component of the GDP by the
expenditure approach.
The Household Final Consumption Expenditure (HFCE) is shown according to the national
concept which is equal to the HFCE by the domestic concept less direct purchase of non -resident
households on domestic territory plus direct purchases of resident households abroad.
Household expenditure for final consumption represents the value of goods and ser vices that
are purchased by resident households during a calendar year, regardless of whether they are
spent in that year. The value of total spending on final consumption of households includes the
consumption of resident households on both the domestic market and abroad.
As in the annual estimates commodity flow methods are used for the quarterly estimates of
consumption of manufactured products. These estimates are based on detailed data on imports
and exports at the 8-digit level of the foreign trade statistics nomenclature, the monthly
PRODCOM survey, and industrial production and producer price indices at the 4 -digit level of
the industrial classification.

IPA 2015 Multi‐beneficiary Programme on Statistics
24
The domestically produced component of manufactured goods in HFCE is obtained at the 4 or
5-digit level of the COICOP classification by benchmarking the indicator to the corresponding
annual estimates, where the indicators are nominal indices of production. The latter are
obtained by multiplying the IPI by the corresponding PPI at the 4 -digit level of the industrial
classification. After the deduction of exports, and adding taxes and trade, margins the data are
benchmarked to respective annual estimates using the Denton method. The sum of imported
and domestically produced estimates of consumption of manufactured goods is finally aligned
to the annual estimate to remove any remaining difference.
Estimates of household consumption of agriculture products are based on detailed data by
Household budget survey. Consumption of fresh meat by product is based on data on slaughter.
Consumption of services is based mostly on indicators such as real income, population,
employment, and components of the consumer price index (CPI) corresponding to the type of
service. When relevant, quarterly estimates of output (derived within the framework of
quarterly GDP by production) of a given service is used as indicator of consumption. Direct data
on consumption are available for utilities on a quarterly basis.
Estimates at previous year prices are calculated at the detailed levels (at the 4 digit or 5-digit
level of the COICOP classification) by a deflation method using matching categories of the CPI.
Household final consumption expenditure according to the national concept is obtained by
adding the expenditures of resident households abroad and by subtracking expenditures of non
– resident households in the domestic territory from household final consumption expenditure
according to the domestic concept.
The consumption of residents abroad and consumption of non – residents in the Bosnia and
Herzegovina is based on data from the Balance of Payements, which has been regulary compiled
and published by the Central Bank of Bosnia and Herzegovina. The resident consumption abroad
is deflated by partner country(Croatia) general CPI. The non – resident consumption in the
Bosnia and Herzegovina is deflated by domestic general CPI.
5.2. GOVERNMENT FINAL CONSUMPTION
Government final consumption expenditure represents current expenditures by general
government units on services to the community. These services are provided free of charge or
at charges which cover only small proportion of costs, therefore the government is considered
to be consumer of its own output, which has no directly observable market value. General
government final consumption expenditure is further divided into expenditures for collective
services and expenditures for individual services, according to the activity of general
government units. Individual services are health, recreation, culture and religion, educa tion and
social protection. All other activities are considered to be collective services.

IPA 2015 Multi‐beneficiary Programme on Statistics
25
Separate estimates for collective services and individual services at current prices are based on
the corresponding estimates of output in GDP by production approach, which are used as
indicator in the Denton benchmarking process to the respective annual estimates. The implicit
deflator of output in the quarterly production accounts is used as price indicator for obtaining
the estimates at prices of previous year. The annual overlap method is used to estimate chain-
linked volume measures at 2010 prices.
For Individual government consumption as indicator have been used sum of Output of P
(Education) and output of Q (Health) in current prices. For the previous year prices for deflation
imlicit deflator of P+Q has been used. For Collective government consump tion as indicator has
been use output in current prices of O (Public administration). For the previous year prices for
deflation implicit deflator of O has been used.
5.3. NPISH FINAL CONSUMPTION
Quarterly estimates of NPISHs are obtained by using the quarterly estimates of HFCE as indicator
in the Denton benchmarking process.
5.4. GROSS CAPITAL FORMATION
Data sources for quarterly estimates for machinery and equipment are the same as for annual
estimates respectively: quarterly data on imports, exports and domestic production on product
level. The imported component is based on the detailed analysis and selection of capital goods
at the 8-digit level of imports of goods. Annual date for taxes, percentage of annual trade
margins and installation costs are added to the c.i.f. data. The resulting estimate is
benchmarked to the respective annual estimate using Denton. Estimates of the domestically
produced capital goods are based on nominal indicators of production at the 4 -digit level of the
industrial classification. After deducting exports, annual data for taxes, percentage of annual
trade margins and installation costs are added. The results are benchmarked to the annual
estimates using Denton. Estimates at prices of previous year are obtained by deflating the
current price estimates with the producer price index for machinery and equipment in the EU.
Quarterly estimates of capital formation - construction are obtained using quarterly total output
of the construction activity, both at current prices and at prices of previous year as indicator
and the Denton benchmarking procedure.
No specific quarterly indicator is available for other investments. It is assumed that this
component of capital formation has a similar movement as capital formation on machinery and
equipment. In other words, the estimates of machinery and equipment serve as indicator in the
benchmarking process of other investment.
Changes in inventories
IPA 2015 Multi‐beneficiary Programme on Statistics
26
In the absence of direct data, changes in inventories are estimated in an indirect way, by
resorting to the commodity flow method (CFM). Changes in inventories are then compiled as
the difference between total supply (output and imports) and total use (intermediate
consumption, final consumption expenditure, gross fixed capital formation and exports).
A methodology based on commodity flows was developed during the IPA2014. Structural
coefficients are based on the Supply Use Table (SUT). Since the experimental SUT that was used
is still unbalanced (with large discrepancies in some product groups) results are bound to be
not very good.
The methodology for the calculation of changes in inventories were to large extend reviewed
during the IPA 2015 project. BHAS has made new calculation of agriculture output by quarters
Q12008-4Q2018 and recalculate quarterly data on changes of inventories using existing
commodity flow method (CFM). The seasonally pattern were to same extend quarterly better
distributed than in the previous calculation.
Quarterly data on changes in inventories are very limited not only in Bosnia and Herzegovina
but also in lot of countries, quarterly changes in inventories plus acquisitions less disposals of
valuables could be analytically treated comparing estimation of total GDP by the production
approach and the sum of other components of GDP by the expenditure approach (household
final consumption expenditure, NPISH final consumption expenditure, government final
consumption expenditure, gross fixed capital formation and net export). Consequently, this
residual may contain a statistical discrepancy. The magnitude of the resulting estimate is
considered as an implicit measure of the quality of the other estimated components.
In this stage of development when Agency for Statistics of Bosnia and Herzegovina still do not
published nationally one annual GDP by production and annual GDP by expenditure approach
at current, previous year prices and chain-linked volumes, calculation changes in inventories by
commodity flow method (CFM), taking into accounts structural coefficients based on the Supply
Use Table (SUT) is accepted approach.
5.5. EXPORTS AND IMPORTS
The Balance of Payments of the Bosnia and Herzegovina is regularly compiled and published by
the Bosna and Hercegovina National Bank. It is the main source of data for the calculation of
exports and imports in the compilation of gross domestic product according to the expenditure
approach at current prices.
The balance of payments of the Bosnia and Herzegovina represents a systematic overview of
the value of economic transactions performed by the Bosnian residents with foreign countries

IPA 2015 Multi‐beneficiary Programme on Statistics
27
within a particular period. Starting from 2012, the balance of payments is compiled according
to the sixth edition of that manual (BPM6). With the beginning of the implementation of BPM6,
the Central Bank of Bosnia and Herzegovina was the first that has been implemented new
methodology. Countries in EU implemented new methodology 2014 .
Appliance of Balance of Payment Manual (BPM6) have caused following changes in the balance
of payments current account:
Data on exports and imports include only goods for which there are a change of ownership
between residents and non-residents. In other words, goods which are exported or imported
for finishing, working or processing are no longer part of international trade in the balance of
payments. Manufacturing services on physical inputs owned by others (finishing, working or
processing) are included in the services account in BPM6 manual. The Balance of payments
includes only net value of services which implies processing fee and not the value of
remanufactured goods.
In BPM6 manual merchanting of goods is shown on gross principle on the Current account item
Goods as a separate item. It includes the value of goods under merchanting, goods that change
ownership, but are never physically present in the compiling economy. So, buying of goods is
shown as imports, and selling of goods is shown as exports. Goods under merchanting are shown
by transaction costs, and not by FOB values, this implies only for the country where the
merchant is a resident.
Repairs of goods are no longer part of exports and imports of goods, but they are part of services
In financial services, new thing introduced by BPM6 manual is including indirectly measured
fees for financial intermediary services (Financial intermediary services indirectly measured -
FISIM), that means that one part of income from investment is reclassified from the Current
account item primary income to the Current account item services.
Data on exports and import of goods are taken from the Balance of payment statistics, compiled
by the CBBH. Quarterly data are benchmarked to the annual estimates to remove small
differences. The UVI for exports and UVI for imports had been used for deflation of goods till
Q4 2016.
In order to deflate exports and imports of goods, the detailed division of total exports and
imports in accordance with the Standard International Trade Classifications (SITC) was used. The
value in current prices by certain items was deflated by Fisher’s unit value indices .
Calculation of exports and imports of goods have been significantly improved since Q1 2017.
The improvements achieved are briefly described below.

IPA 2015 Multi‐beneficiary Programme on Statistics
28
Exports of goods are deflated by the corresponding producer price indices on non -domestic
market by NACE started from the first quarter of 2017.
Agency for Statistics of Bosnia and Herzegovina started to produce industrial producer price
indices on non-domestic market on monthly bases and published results recently. Starting with
the first quarter of 2017 exports of goods is deflated by the corresponding industrial producer
price indices on non-domestic market by NACE.
Imports of goods are deflated by the foreign countries industrial producer price indices on non-
domestic market started from the first quarter of 2017.
For the calculation of weighted indices foreign countries industrial producer price indices on
non-domestic market by NACE are used, as well as exchange rates and the structure of BHAS
imports by NACE. Starting with the first quarter of 2017 imports of goods is deflated by the
corresponding industrial producer price indices on non-domestic market by NACE.
Imports of goods by geographical breakdown-constant prices
Weighted indices are used as deflators for calculation of import of goods in constant prices.
Geographical breakdown has been done according to BHAS data on structure of import by
country of destination/origin, starting with IQ2017.
Weighted indices have been calculated using foreign countries' quarterly industrial producer
price indices on non-domestic market and total, exchange rates and structure of import by
country of destination/origin.
Date base includes: BHAS data base on foreign trade in goods, Eurostat, OECD price statistics
data base; SORS (Statistical Office of the Republic of Serbia) data bases; CNB (Croatia National
Bank), CBBH (Central Bank of BiH) and National bank of Serbia data bases.
Exports and imports of services
Data on exports and imports of services are taken from the Balance of payment statistics,
compiled by the CBBH. Quarterly data are benchmarked to the annual estimates to remove small
differences. The General CPI of Bosnia and Herzegovina for exports is use d for deflation of
services while for imports of services the CPI of main partner countries is used.

IPA 2015 Multi‐beneficiary Programme on Statistics
29
6. GDP COMPONENTS: THE INCOME APPROACH
The income approach to the GDP calculation is shown in th is chapter.
GDP by income approach consists of the primary income categories that resident production
units and individuals receive in the process of production of goods and services. The income
approach is built up from components of compensations of employees, including components
wages and salaries and employers' social contributions (ch.6.1), other taxes less subsidies on
production (ch.6.2), gross operating surplus and mixed income (ch.6.3).
In National accounts of Bosnia and Herzegovina the income approach of GDP is not calculated
independently. Compensation of employees, other taxes on production, other subsidies on
production is calculated based on the same data sources as for production approach. Gross
operating surplus or mixed income is calculated as balancing items. Data are compiled at the
sections level of KD Bosnia and Herzegovina 2010 which is in line with the European
classification NACE Rev 2. The income approach provides estimates of the GDP and its income
components at current prices.
All these data are used to prepare quarterly table NAMAIN_T0103 of the ESA 2010 transmission
programme.
The main categories of income GDP are: compensation of employees, other taxes on production,
other subsidies on production, gross mixed income and gross operating surplus.
The data sources for the calculation of income categories are the same as for GDP by production
approach. Main data sources for legal entities are annual financial statements. This data source
excludes only the households sector (entrepreneurs), for which there is still no legal framewo rk
for obligatory submission of annual financial statements. Data for unincorporated enterprises
(entrepreneurs who perform their own activities) are collected from statistical surveys.
Agency for intermediation, informatics, and finances – APIF, is in charge of collection of Annual
financial statements. Financial statements contain elements of revenues and expenditure, i.e.
necessary elements for the calculation of output and intermediation consumption by data
sources.
Sources of data for taxes on production are Ministries of Finance. The main data source for
other subsidies on production is budgetary statistics.
IPA 2015 Multi‐beneficiary Programme on Statistics
30
6.1. COMPENSATION OF EMPLOYEES
Compensation of employees includes all remuneration to employees, both in cash or in kind,
that the employees receive in return for their work done, as well as all payments to the
compulsory social security schemes of employees.
Compensation of employees includes two components:
Wages and salaries paid in cash or in kind,
Social contribution of employers
Basis for the calculation of quarterly data are the annual value of the compensation of
employees of the previous year at the sections level of NACE Rev.2. When annually data from
national accounts are available allocation by quarters is done using coefficient quarterly gross
wages and salaries.
The main quarterly indicator used in the process of estimation of compensation of employees
is the average monthly gross earnings. This indicator is considered to be suitable for estimation
which is carried out by applying nominal indices of average monthly gross earnings to the values
of compensation of employees for the same quarter of the previous year. This indicator is
applied at section level NACE Rev2. When annual data become available, the quarterly estimates
are reconciled ones.
6.2. TAXES LESS SUBSIDIES ON PRODUCTION
Other taxes on production are categories of GVA and consist of all payments by production units
to general government institutions for the engagement in the production process independent
of the quantity or value of the goods and services produced or sold. They may be payable on
land, fixed assets or labour employed in the production process or on certain activities or
transaction.
Other subsidies on production are current unrequited payments by general government to
resident market producers. The main data source for other subsidies on production is budgetary
statistics.
The main quarterly indicator used in the process of estimatio n of quarterly net taxes on
production is quarterly gross value added. The calculation carried out by applying nominal
indices of quarterly gross valued added (Q/Q-4). When annual data become available, the
quarterly estimates are reconciled ones.

IPA 2015 Multi‐beneficiary Programme on Statistics
31
6.3. GROSS OPERATING SURPLUS & MIXED INCOME
Gross operating surplus and mixed income are calculated for the generation of income account
as a residual item (by deducting compensation of employees, net taxes on production from gross
value added calculated from the production side).

IPA 2015 Multi‐beneficiary Programme on Statistics
32
7. POPULATION AND EMPLOYMENT
In this moment, there is no any data for population and employment.
7.1. POPULATION
In this moment, there is no any data for population.
7.2. EMPLOYMENT: PERSONS
In this moment, there is no any data for employment.
7.3. EMPLOYMENT: TOTAL HOURS WORKED
In this moment, there is no any data for employment.

IPA 2015 Multi‐beneficiary Programme on Statistics
33
8. FLASH ESTIMATES
In this moment, there is no current plan for real flash estimate.
8.1. FLASH GDP ESTIMATE
In this moment, there is no current plan for real flash estimate.
8.2. FLASH EMPLOYMENT ESTIMATE
In this moment, there is no current plan for real flash estimate.
8.3. OTHER EXISTING FLASH ESTIMATE, IF ANY
In this moment, there is no current plan for real flash estimate.
IPA 2015 Multi‐beneficiary Programme on Statistics
34
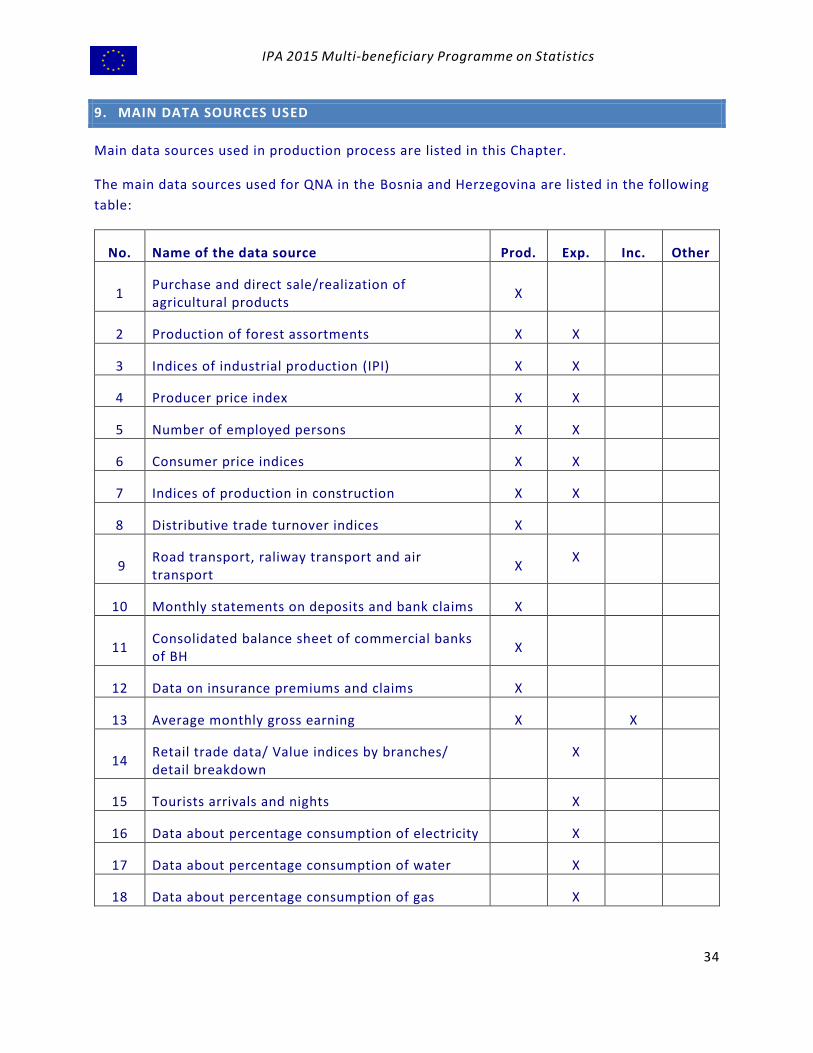
9. MAIN DATA SOURCES USED
Main data sources used in production process are listed in this Chapter.
The main data sources used for QNA in the Bosnia and Herzegovina are listed in the following
table:
No. Name of the data source Prod. Exp. Inc. Other
1 Purchase and direct sale/realization of agricultural products
X
2 Production of forest assortments X X
3 Indices of industrial production (IPI) X X
4 Producer price index X X
5 Number of employed persons X X
6 Consumer price indices X X
7 Indices of production in construction X X
8 Distributive trade turnover indices X
9 Road transport, raliway transport and air transport
X X
10 Monthly statements on deposits and bank claims X
11 Consolidated balance sheet of commercial banks of BH
X
12 Data on insurance premiums and claims X
13 Average monthly gross earning X X
14 Retail trade data/ Value indices by branches/ detail breakdown
X
15 Tourists arrivals and nights X
16 Data about percentage consumption of electricity X
17 Data about percentage consumption of water X
18 Data about percentage consumption of gas X
IPA 2015 Multi‐beneficiary Programme on Statistics
35
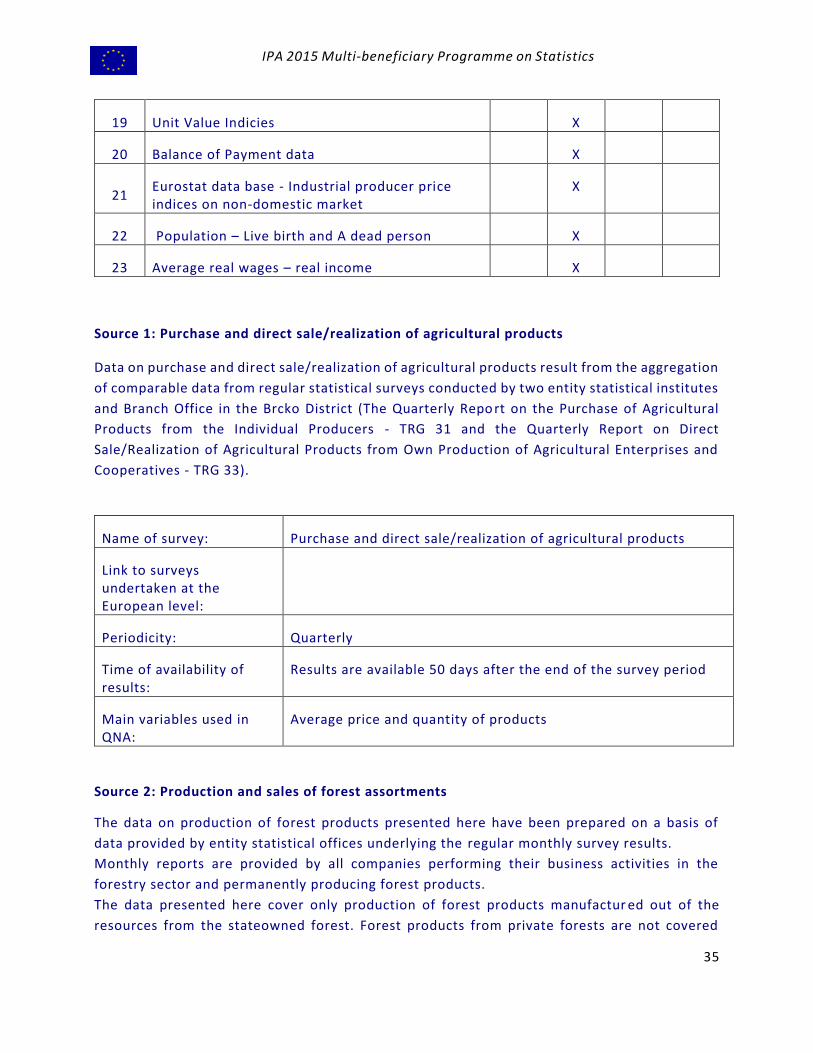
19 Unit Value Indicies X
20 Balance of Payment data X
21 Eurostat data base - Industrial producer price indices on non-domestic market
X
22 Population – Live birth and A dead person X
23 Average real wages – real income X
Source 1: Purchase and direct sale/realization of agricultural products
Data on purchase and direct sale/realization of agricultural products result from the aggregation
of comparable data from regular statistical surveys conducted by two entity statistical institutes
and Branch Office in the Brcko District (The Quarterly Repo rt on the Purchase of Agricultural
Products from the Individual Producers - TRG 31 and the Quarterly Report on Direct
Sale/Realization of Agricultural Products from Own Production of Agricultural Enterprises and
Cooperatives - TRG 33).
Name of survey: Purchase and direct sale/realization of agricultural products
Link to surveys undertaken at the European level:
Periodicity: Quarterly
Time of availability of results:
Results are available 50 days after the end of the survey period
Main variables used in QNA:
Average price and quantity of products
Source 2: Production and sales of forest assortments
The data on production of forest products presented here have been prepared on a basis of
data provided by entity statistical offices underlying the regular monthly survey results.
Monthly reports are provided by all companies performing their business activities in the
forestry sector and permanently producing forest products.
The data presented here cover only production of forest products manufactur ed out of the
resources from the stateowned forest. Forest products from private forests are not covered
IPA 2015 Multi‐beneficiary Programme on Statistics
36
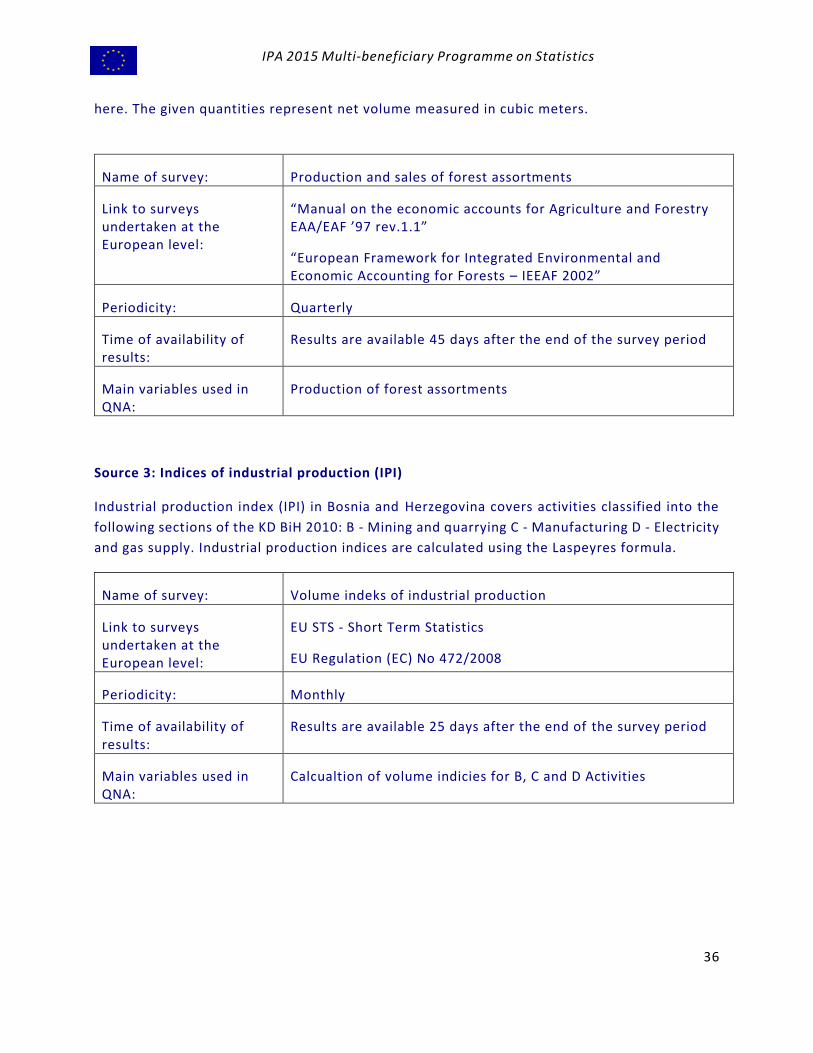
here. The given quantities represent net volume measured in cubic meters.
Name of survey: Production and sales of forest assortments
Link to surveys undertaken at the European level:
“Manual on the economic accounts for Agriculture and Forestry EAA/EAF ’97 rev.1.1”
“European Framework for Integrated Environmental and Economic Accounting for Forests – IEEAF 2002”
Periodicity: Quarterly
Time of availability of results:
Results are available 45 days after the end of the survey period
Main variables used in QNA:
Production of forest assortments
Source 3: Indices of industrial production (IPI)
Industrial production index (IPI) in Bosnia and Herzegovina covers activities classified into the
following sections of the KD BiH 2010: B - Mining and quarrying C - Manufacturing D - Electricity
and gas supply. Industrial production indices are calculated using the Laspeyres formula.
Name of survey: Volume indeks of industrial production
Link to surveys undertaken at the European level:
EU STS - Short Term Statistics
EU Regulation (EC) No 472/2008
Periodicity: Monthly
Time of availability of results:
Results are available 25 days after the end of the survey period
Main variables used in QNA:
Calcualtion of volume indicies for B, C and D Activities

IPA 2015 Multi‐beneficiary Programme on Statistics
37
Source 4: Producer price indices
PPI in Bosnia and Herzegovina is calculated based on the representative list of products and it´s
producers making a sample of cca.570 producers. Each month 4 255 prices are collected directly
from producers’ throug the unique questionnary created in cooperation with Italian experts.
The main criterion for selecting the sample of enterprises products and services that are
surveyed was the volume of production and selling on the domestic market got from the Annual
survey on Industrial production (IND-21). Classification of industrial products is based on the
Nomenclature of Industrial Products in B&H 2010 based on the PRODCOM List 2010.
Name of survey: Producer price indices
Link to surveys undertaken at the European level:
Classification of industrial products is based on the Nomenclature of Industrial Products - PRODCOM List 2010
Eurostat Handbook on industrial producer price indices (PPI)
Periodicity: Monthly
Time of availability of results:
Results are available 25 days after the end of the survey period
Main variables used in QNA:
Producer price indicies
Source 5: Number of employed persons
Data on the number of employed persons in business entities in BiH are obtained through
statistical research and from administrative sources. The total number of employed persons in
BiH is the data aggregated on the basis of collected and processed data fr om the Federation of
BiH, Republika Srpska and Branch Office of Agency for Statistics of Bosnia and Herzegovina in
the Brčko district BiH. The survey includes legal entities of all types of ownership, government
bodies, institutions and other organizations that operate on the territory of BiH. Persons in paid
employment are all persons who have signed a work contract with the employer for a fixed or
unspecified period of time, irrespective of type of ownership and of whether they work full time
or less than full time.
Name of survey: Persons in paid employement by activity
Link to surveys undertaken at the European level:

IPA 2015 Multi‐beneficiary Programme on Statistics
38
Periodicity: Monthly
Time of availability of results:
Results are available 50 days after the end of the survey period
Main variables used in QNA:
Calculation of volume indicies for services, for both approaches (production and expenditure)
Source 6: Consumer price indices
The CPI in the Bosnia and Herzegovina is calculated on the basis of a representative basket
consisting of about 616 different items. About 21 000 prices are collected each month in a fixed
panel of outlets in twelve geographical locations. The classification of products used in the CPI
is based on the Classification of Individual Consumption by Purpose (COIC OP). The COICOP
breaks consumer expenditure into 12 different divisions of consumer goods and services.
Name of survey: Consumer price indices
Link to surveys undertaken at the European level:
Classification of Individual Consumption According to Purpose – COICOP
Eurostat Recommendations on Harmonized Indices on Consumers Prices
Periodicity: Monthly
Time of availability of results:
Results are available 25 days after the end of the survey period
Main variables used in QNA:
Consumer price indices on a very detail level of COICOP
Source 7: Indices of production in construction
The index or production in construction is one of theprincipal short -term business indicators.
It approximates the evolution of the volume of production in construction within the
construction sector, broken down into building construction and civil engineering works. The
breakdown on the building construction and civil engineering works are based on the
Classification of types of construction.

IPA 2015 Multi‐beneficiary Programme on Statistics
39
Name of survey: The Quarterly Report on construction (K KPS GRAĐ-21)
Link to surveys undertaken at the European level:
EU Methodology of Short-Term Business Statistics (Theme 4, ISSN 1725- 0099; European Communities, 2006)
Commission Regulation (EC) No 1503/2006 on definitions of variables, list of variables and frequency of data compilation
Periodicity: Quarterly
Time of availability of results:
Results are available 50 days after the end of the survey period
Main variables used in QNA:
Indices of production in construction
Source 8: Distributive trade turnover indices
Primary goal of distributive trade statistics is to provide timely information on change of level
of realized turnover and other relevant indicators. Distributive trade turnover index is one of
the key indicators of economic activity in the country which helps government bodies and
private sector enterprises in the decisionmaking process. It is also applied for the estimation of
trade sector output, household consumption, as well as in the calculation of national accounts .
Name of survey: K KPS TRG 02
Link to surveys undertaken at the European level:
Survey methodology is completely harmonized with the one prescribed by Council Regulation (EC) No.1165/98 concerning short-term statistics from the 1998 (Annex D) and its amendments (hereinafter EU STS regulation) and with Eurostat recommendations for this statistical area.
Periodicity: Quarterly
Time of availability of results:
Results are available 55 days after the end of the survey period
Main variables used in QNA:
Distributive trade turnover indices
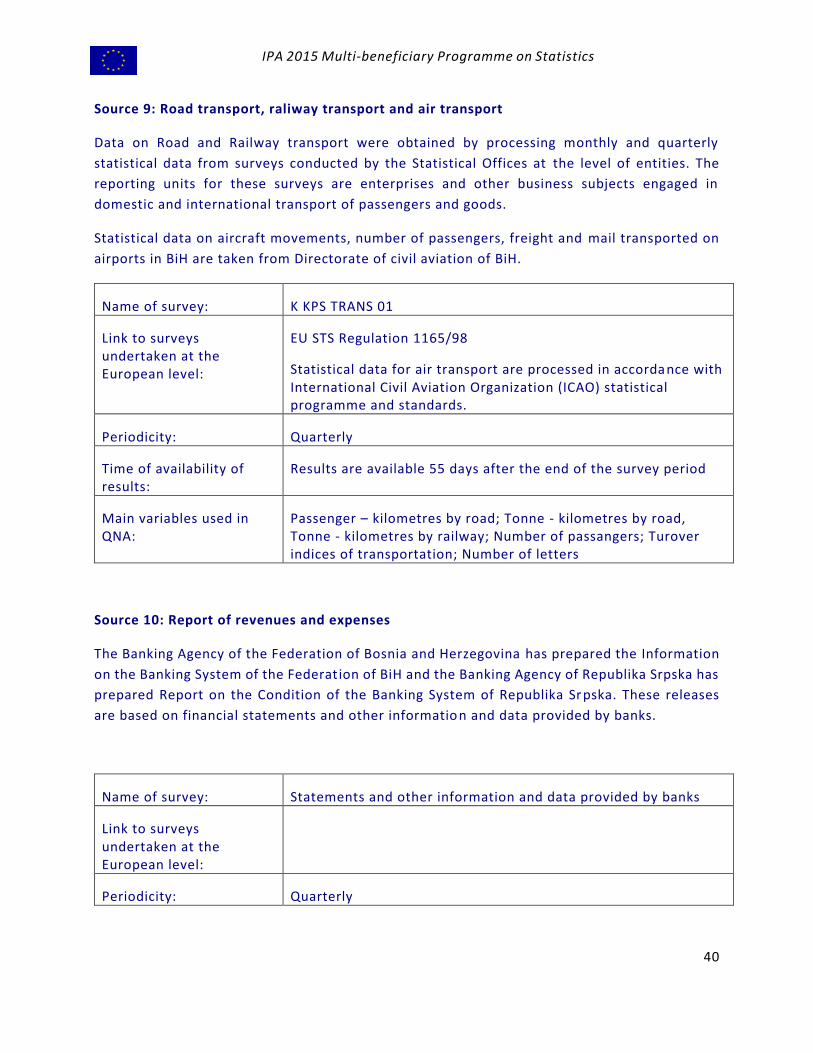
IPA 2015 Multi‐beneficiary Programme on Statistics
40
Source 9: Road transport, raliway transport and air transport
Data on Road and Railway transport were obtained by processing monthly and quarterly
statistical data from surveys conducted by the Statistical Offices at the level of entities. The
reporting units for these surveys are enterprises and other business subjects engaged in
domestic and international transport of passengers and goods.
Statistical data on aircraft movements, number of passengers, freight and mail transported on
airports in BiH are taken from Directorate of civil aviation of BiH.
Name of survey: K KPS TRANS 01
Link to surveys undertaken at the European level:
EU STS Regulation 1165/98
Statistical data for air transport are processed in accordance with International Civil Aviation Organization (ICAO) statistical programme and standards.
Periodicity: Quarterly
Time of availability of results:
Results are available 55 days after the end of the survey period
Main variables used in QNA:
Passenger – kilometres by road; Tonne - kilometres by road, Tonne - kilometres by railway; Number of passangers; Turover indices of transportation; Number of letters
Source 10: Report of revenues and expenses
The Banking Agency of the Federation of Bosnia and Herzegovina has prepared the Information
on the Banking System of the Federation of BiH and the Banking Agency of Republika Srpska has
prepared Report on the Condition of the Banking System of Republika Srpska. These releases
are based on financial statements and other information and data provided by banks.
Name of survey: Statements and other information and data provided by banks
Link to surveys undertaken at the European level:
Periodicity: Quarterly

IPA 2015 Multi‐beneficiary Programme on Statistics
41
Time of availability of results:
90 days after the end of the referent period
Main variables used in QNA:
Interest recived by banks, Interest paid by banks and Explicit charges
Source 11: Consolidated balance sheet of commercial banks of BH
The monetary statistics compiled and published by the Central Bank of Bosnia and Herzegovina
produces harmonized data on the stock of financial and non-financial assets and liabilities of
the financial sector of Bosnia and Herzegovina, with the tendency to expand the future coverage
to the flows, depending on available resources.
Name of survey: Consolidated Survey on commercial banks in Bosnia and Herzegovina
Link to surveys undertaken at the European level:
IMF Monetary and Financial Statistics Manual (MFSM 2000)
The Guide for Compilation of Monetary and Financial Statistics (2007)
Periodicity: Monthly
Time of availability of results:
Results are available 4 of 5 weeks after the end of the reporting month
Main variables used in QNA:
Assets and Liabilities
Source 12: Data on insurance premiums and claims
Insurance Agency of Bosnia and Herzegovina provides and maintains all relevant data about the
overall insurance market in Bosnia and Herzegovina. In acco rdance to the constitutional
organization of Bosnia and Herzegovina there are two institutions that exercise the supervision
and regulation of the BiH insurance market and its participants on entity level - the Insurance
Supervisory Agency of Federation of Bosnia and Herzegovina and the Insurance Agency of
Republic of Srpska.
Name of survey:

IPA 2015 Multi‐beneficiary Programme on Statistics
42
Link to surveys undertaken at the European level:
Periodicity: Monthly
Time of availability of results:
Results are available 4 of 5 weeks after the end of the reporting month
Main variables used in QNA:
Premiums and claims paid
Source 13: Average monthly gross earning
Data on average monthly gross earnings are based on regular monthly survey on employment
and wages (RAD -1). The survey comprises persons in employment in legal entities of all types
of ownership, government bodies, institutions and other organizations. Average monthly gross
earnings comprise net income of a person in employment plus contributions from gross earnings
and advance income tax as prescribed by law.
Name of survey: Average monthly gross earnings of persons in employment
Link to surveys undertaken at the European level:
Periodicity: Quarterly
Time of availability of results:
Results are available 45 days after the end of the survey period
Main variables used in QNA:
Calculation of composite index for O, P and Q Activities
Source 14: Retail trade data/ Value indices by branches/ detail breakdown
The Retail trade data survey comprises business entities /legal units which are, by the main
activity, registered within retail trade, except retail trade of motor vehicles and motorcycles
(division 47 - KD BiH 2010), and businesses which are, according to their main activity, classified
in other activities, but also performing retail trade. For the purpose of the survey, Classification
of Activities in Bosnia and Herzegovina - KD BiH 2010 was used, and it is fully compliant with
the European Classification of Economic Activities - NACE Rev. 2. Survey covers the entire
IPA 2015 Multi‐beneficiary Programme on Statistics
43
territory of Bosnia and Herzegovina. Entrepreneurs are not included. In conducting the survey,
the three statistical institutions in BiH participate. The main observation variable is monthly
turnover of business entity, excluding VAT, which is in accordance with EU -STS regulation
separately stated.
Name of survey: Retail trade turnover indicies
Link to surveys undertaken at the European level:
Classification of Activities in Bosnia and Herzegovina - KD BiH 2010
Methodology for this survey is based on the Council Regulations No 1165/98 (Annex C), 1158/05, 1503/06 and 1893/06 Concerning Short-Term Business Statistics
Periodicity: Monthly
Time of availability of results:
Results are available 28 days after the end of the survey period
Main variables used in QNA:
Turnover of retail trade data
Source 15: Tourists arrivals and nights
Data on turnover of tourists (number of tourist arrivals and tourist nights) are collected from a
regular monthly report (TU-11 form). Reports are usually made on the basis of reception records
in guest books, entities and their parts engaged in organising and arranging of tourists.
Observation units are all business entities /legal units which are, by the main activity, registered
in accommodation activity (division 55 - KD BiH 2010), persons as well as households that rent
accommodation establishments to tourists. For the purpose of the survey, Classification of
Activities in Bosnia and Herzegovina - KD BiH 2010 was used, and it is fully compliant with the
European Classification of Economic Activities - NACE Rev. 2. Reporting units are all business
entities (enterprises, entrepreneurs, institutions, associations etc.) and parts thereof engaged
in providing accommodation servi in tourism registered according to the CA BiH 2010 under
section : 55.1 (hotels and similar accommodation), 55.2 (holiday and other short - stay
accommodation), 55.3 (camps and camping grounds), 55.9 (other accommodation), health
institutions for their facilities in which persons stay for medical rehabilitation (costs are on
persons themselves), business entities and parts thereof engaged in tourist stay in rural
households, houses, camps, apartments and rooms directly rented by private
persons/households. Survey covers the entire territory of Bosnia and Herzegovina.

IPA 2015 Multi‐beneficiary Programme on Statistics
44
Name of survey: Tourists arrivals and nights
Link to surveys undertaken at the European level:
Classification of Activities in Bosnia and Herzegovina - KD BiH 2010 was used, and it is fully compliant with the European Classification of Economic Activities - NACE Rev. 2.
Periodicity: monthly
Time of availability of results:
Results are available 33 days after the end of the survey period
Main variables used in QNA:
Number of nights of foreign tourists
Source 16: Data about percentage consumption of electricity
Data are taken from Bosnia and Herzegovina Electricity and show percentage consumption of
electricity.
Name of data source : Bosnia and Herzegovina Electricity (EPBiH)
Link to surveys undertaken at the European level:
Periodicity: Quarterly
Time of availability of results:
Results are available for previous year
Main variables used in QNA:
Consumption of electricity by households
Source 17: Data about percentage consumption of water
Data are taken from KJKP VIK and show percentage consumption of water.
Name of data source : Water supply and sanitation – KJKP VIK
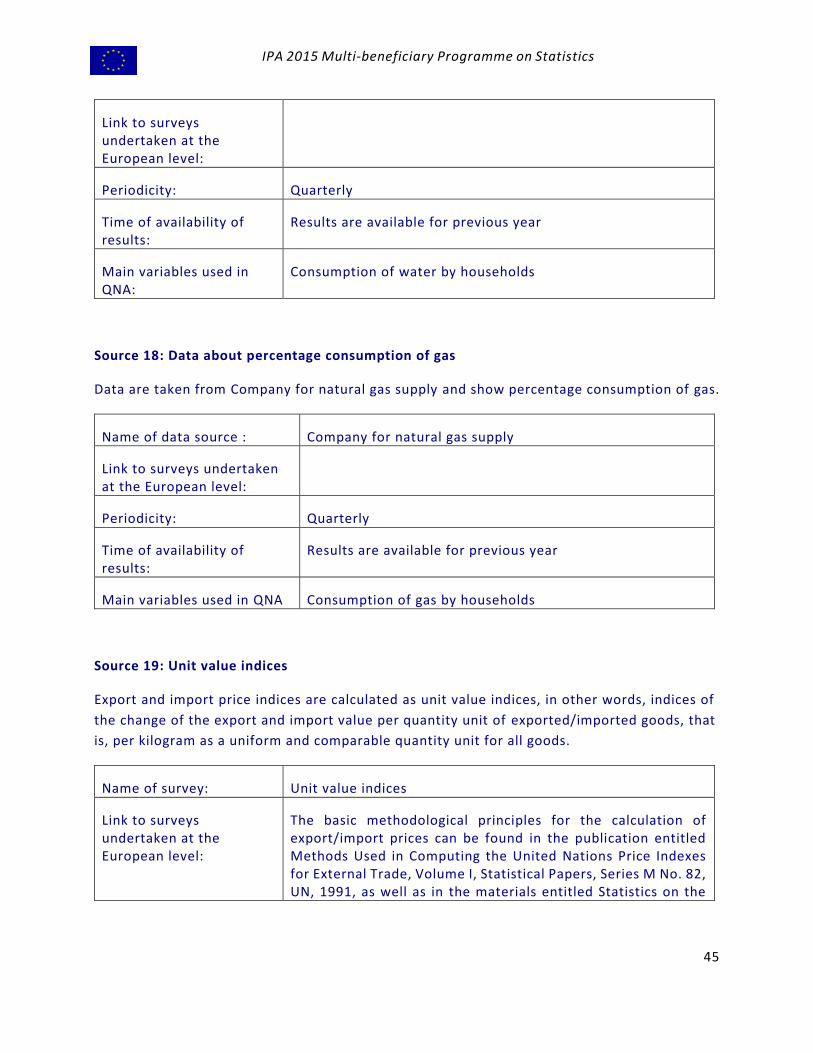
IPA 2015 Multi‐beneficiary Programme on Statistics
45
Link to surveys undertaken at the European level:
Periodicity: Quarterly
Time of availability of results:
Results are available for previous year
Main variables used in QNA:
Consumption of water by households
Source 18: Data about percentage consumption of gas
Data are taken from Company for natural gas supply and show percentage consumption of gas.
Name of data source : Company for natural gas supply
Link to surveys undertaken at the European level:
Periodicity: Quarterly
Time of availability of results:
Results are available for previous year
Main variables used in QNA Consumption of gas by households
Source 19: Unit value indices
Export and import price indices are calculated as unit value indices, in other words, indices of
the change of the export and import value per quantity unit of exported/imported goods, that
is, per kilogram as a uniform and comparable quantity unit for all goods.
Name of survey: Unit value indices
Link to surveys undertaken at the European level:
The basic methodological principles for the calculation of export/import prices can be found in the publication entitled Methods Used in Computing the United Nations Price Indexes for External Trade, Volume I, Statistical Papers, Series M No. 82, UN, 1991, as well as in the materials entitled Statistics on the
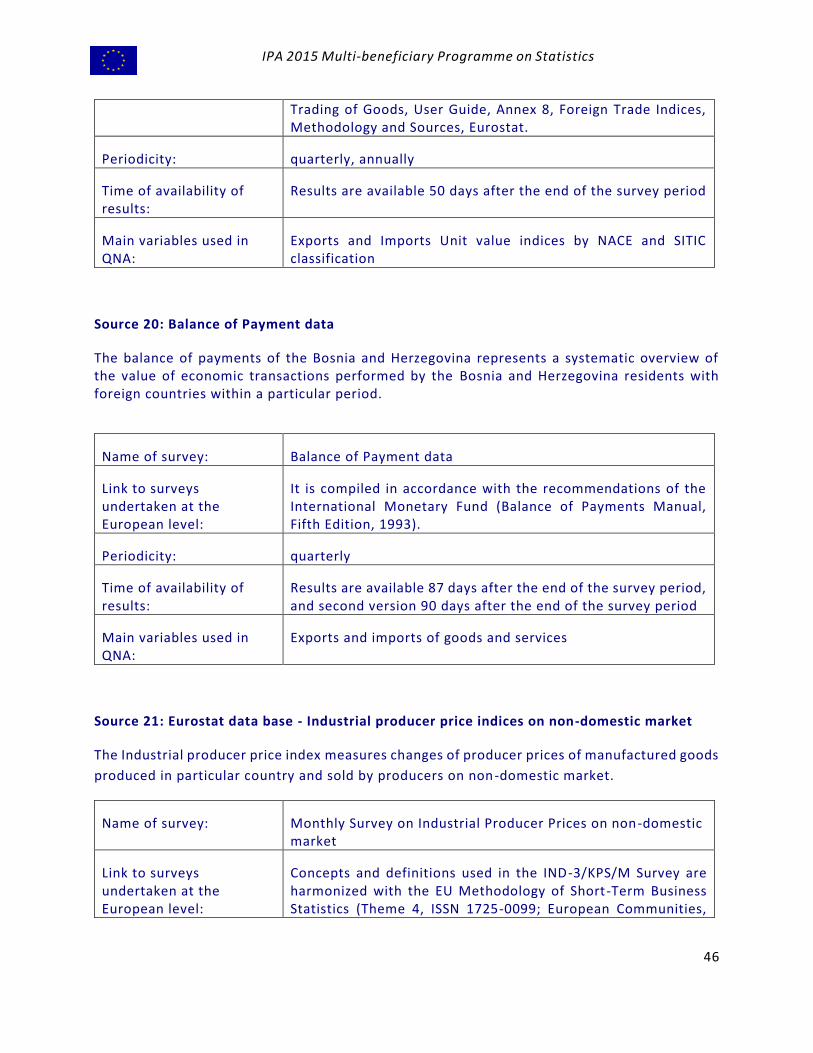
IPA 2015 Multi‐beneficiary Programme on Statistics
46
Trading of Goods, User Guide, Annex 8, Foreign Trade Indices, Methodology and Sources, Eurostat.
Periodicity: quarterly, annually
Time of availability of results:
Results are available 50 days after the end of the survey period
Main variables used in QNA:
Exports and Imports Unit value indices by NACE and SITIC classification
Source 20: Balance of Payment data
The balance of payments of the Bosnia and Herzegovina represents a systematic overview of the value of economic transactions performed by the Bosnia and Herzegovina residents with foreign countries within a particular period.
Name of survey: Balance of Payment data
Link to surveys undertaken at the European level:
It is compiled in accordance with the recommendations of the International Monetary Fund (Balance of Payments Manual, Fifth Edition, 1993).
Periodicity: quarterly
Time of availability of results:
Results are available 87 days after the end of the survey period, and second version 90 days after the end of the survey period
Main variables used in QNA:
Exports and imports of goods and services
Source 21: Eurostat data base - Industrial producer price indices on non-domestic market
The Industrial producer price index measures changes of producer prices of manufactured goods
produced in particular country and sold by producers on non-domestic market.
Name of survey: Monthly Survey on Industrial Producer Prices on non-domestic market
Link to surveys undertaken at the European level:
Concepts and definitions used in the IND-3/KPS/M Survey are harmonized with the EU Methodology of Short-Term Business Statistics (Theme 4, ISSN 1725-0099; European Communities,

IPA 2015 Multi‐beneficiary Programme on Statistics
47
2006) as well as with the Commission Regulation (EC) No. 1503/2006 on definitions of variables, list of variables and frequency of data compilation .
Periodicity: Monthly
Time of availability of results:
Results are available 10 days after the end of the survey period
Main variables used in QNA:
Industrial producer price indices according to NACE 2007 sections and divisions
Further adjustments made to the survey data:
Indices are calculated compared to the average of the previous year
Source 22: Population – Live birth and d dead persons
The quarterly population in the Bosnia and Herzegovina is calculated on the basis of a live birth,
a dead person on quarterly level and natural increase on year level.
Name of survey: Demography
Link to surveys undertaken at the European level:
The recommendations of the World Health Assembly
Periodicity: Quarterly
Time of availability of results:
Results are available 25 days after the end of the survey period
Main variables used in QNA:
Population
Source 23: Average real wages – real income
The quarterly real income in the Bosnia and Herzegovina is calculated on the basis of an average
real wages and General CPI. An average wages are calculated of neto wages and general CPI.
Data on average monthly gross earnings are based on regular monthly survey on employment
and wages (RAD -1). The survey comprises persons in employment in legal entities of all types
of ownership, government bodies, institutions and other organizations. Average monthly gross
earnings comprise net income of a person in employment plus contributions fro m gross earnings
and advance income tax as prescribed by law.
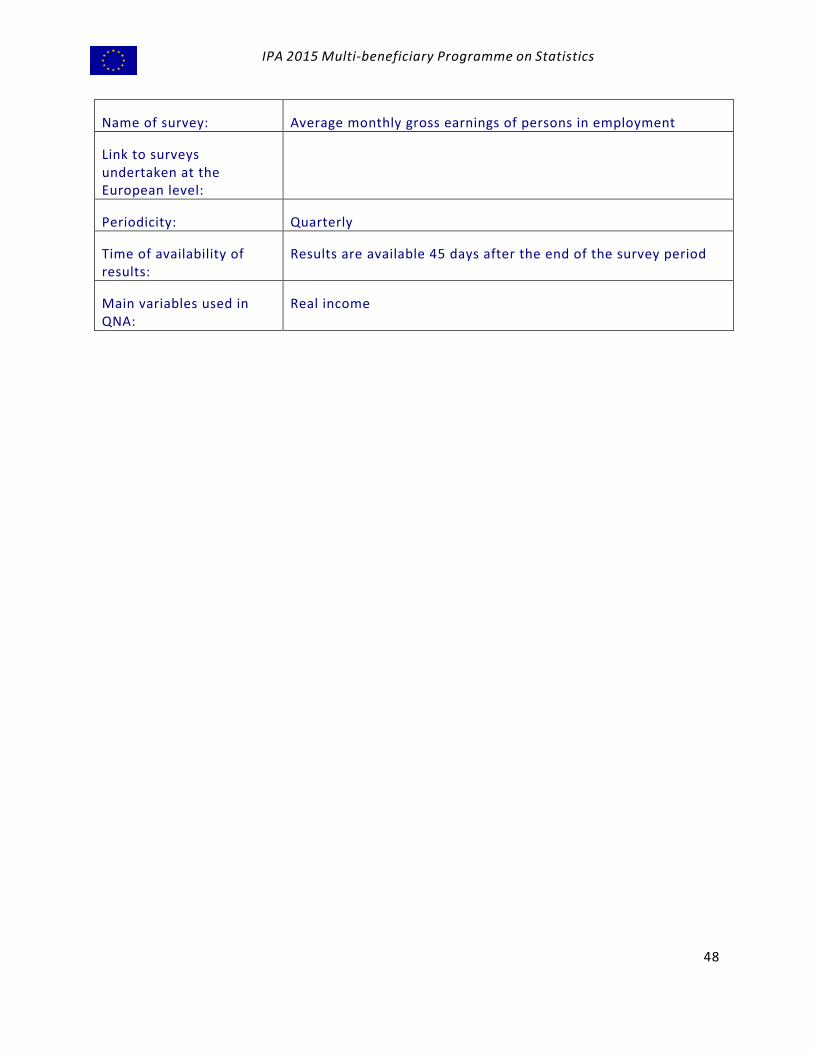
IPA 2015 Multi‐beneficiary Programme on Statistics
48
Name of survey: Average monthly gross earnings of persons in employment
Link to surveys undertaken at the European level:
Periodicity: Quarterly
Time of availability of results:
Results are available 45 days after the end of the survey period
Main variables used in QNA:
Real income