
Quarterly Market Outlook & Strategy · this is a humdinger of a stock market bubble! We see a more...
14
Quarterly Market Outlook & Strategy Value Investing: Dead or Dormant? Fourth Quarter of 2019 Jeffrey Egizi January 2020
Transcript of Quarterly Market Outlook & Strategy · this is a humdinger of a stock market bubble! We see a more...
Quarterly Market Outlook & Strategy
Value Investing: Dead or Dormant?
Fourth Quarter of 2019
Jeffrey Egizi
January 2020
Page | 1
Executive Summary
• During the current bull market, the performance of time-honored investment strategies –
namely, tilting portfolios towards value, small cap, and high profitability stocks – has
fallen flat, especially in the United States. In the US market, these style premiums have
shrunk relative to historical averages, while returns to the value factor have been
especially poor.
• It is, perhaps, obvious that for these premiums to “work,” small and/or inexpensive stocks
need an opportunity to migrate out of their respective market categories; i.e., for those
firms to experience improvements in their business prospects that justify increases in
valuation. Eventually, successful value stocks become growth stocks, and successful
small cap stocks become large cap stocks.
• Unfortunately, there’s been a loss of market dynamism to afford such opportunities.
Value stocks are languishing, and small firms aren’t going public. Meanwhile, a handful
of large cap growth stocks enjoy a significant and persistent performance advantage.
• Some of this can be attributed to classic market momentum and froth. Make no mistake,
this is a humdinger of a stock market bubble! We see a more fundamental problem in
the trend toward industry concentration and the corresponding reduction in antitrust
enforcement, which has reduced competition and favored monopoly power. 75% of US
industries have become more concentrated over the past 20 years, with the largest
incumbents enjoying the highest profits, stock market returns, and valuations.
• We now see deep competitive ”moats” around large businesses, especially in the tech
sector. As investors seek to get a piece of the action, growth stocks have been driven to
their most expensive levels (in absolute terms and vis-à-vis value stocks) since the peak
of the Dotcom Bubble. All the while, there’s been a dramatic shrinkage in the public
markets, as potential rivals are absorbed by large competitors, and small companies are
nurtured by venture capital and private equity firms.
• The persistence of these trends has seemed inexorable and interminable. As value
investors, we’ve felt our fair share of the pain. That said, we see no value in fighting the
last war. Corporate earnings are stagnating because workers’ (and hence consumers’)
real incomes have been curtailed by monopolistic business practices. There’s a limit to
how high stocks can rise without validation from earnings. Also, the political winds are
shifting with respect to antitrust regulation. We believe that we’re approaching a turning
point in terms of the concentration of corporate power, and the valuations of stocks that
have benefitted most from the status quo.

Page | 2
Introduction
Buy low, sell high is a time-honored maxim for aspiring value investors. To see why, consider the
basic economics of stock ownership: in exchange for their investment, shareholders expect an
eventual return of the issuing company’s earnings in the form of dividends. If the market value
of the company (i.e., the price paid for the stock) is greater than the sum of future distributions to
shareholders, that’s a losing proposition. Value investors, trained by the legendary Benjamin
Graham, pursue stocks whose market value is below what they expect to receive in future
payments.
Another investing basic rests on the fact that growth is usually faster off of a low base. Or, in
economic parlance, that there are diminishing marginal returns to size. Consider the
impossibility of a quick doubling in WalMart’s revenues, as contrasted with the company’s
growth in its early days. Historically, large firms had to run fast just to stay in the same place,
while smaller companies offered the potential for higher rates of product adoption, earnings
growth, and stock appreciation – if they executed successfully.
These foundational concepts have, historically, been manifested in relative share prices. Stocks
with low valuations and small market capitalizations have outperformed the broader market
over the long term. The rationale for these style premiums has evolved over time, from purely
empirical to economically grounded. Lately, it’s become apparent that their existence is
dependent on market dynamism, which allows firms to move within and between investment
categories. Unfortunately, in recent years incumbents have enjoyed increased market
dominance, to the detriment of competitors whose transformation delivered the value and size
premiums.
In this paper, we’ll further describe the history of these style premiums, the conditions that led
to their emergence, and the recent factors that have contributed to their decline. It is only in
cultivating a deep understanding of these things that we can answer the question: Is there value
in value investing, or is it a trap?
What are the Value and Size Premiums?
Research shows that the share prices of companies with low valuations (e.g., low price-to-
earnings, price-to-book, or price-to-revenue ratios) and small firm size (e.g., low market
capitalization) have historically outperformed the market averages. These observations were
widely publicized by professors Eugene Fama and Kenneth French in a 1992 paper setting out a
three-factor model for describing individual stock returns. This research helped to establish
these value and size premiums as core determinants of individual stock performance and
considerations in equity portfolio construction.

Page | 3
The work of Fama and French provided the academic underpinnings for the investment
approach of Dimensional Fund Advisors (DFA). DFA’s mutual fund strategies are designed to tilt
diversified equity portfolios towards small- and low-priced stocks to produce superior returns.
The following charts from DFA illustrate the excess returns generated by these style premiums,
over long horizons, and across regions:
Source: DFA
The notion of excess returns to value should sound familiar to Paladin clients, and rests on the
assumption that future returns are, over the long run, inversely related to purchase price. That’s
been true not only at the security level, but also at the asset class level, and is a foundational
principle of Paladin’s investment approach. The size premium can be similarly conceived at the
macro level, as nascent sectors, strategies and countries offer higher return potential. This is
reflected in Paladin’s historical tilt toward emerging markets and our search for non-traditional
investments such as our low-volatility income equity and covered call strategies.
Why are there Value and Size Premiums?
Fama and French may have harbored economic intuitions about why the size and value
premiums exist, but never ventured a guess in their research. These were empirically-observed
and consistent drivers of stock performance, which was enough for them.
In addition to the three-factor model, Eugene Fama authored the efficient market hypothesis
(EMH), which states that market prices reflect all available information. This belief limits the
scope for exploitable market anomalies, and sits somewhat awkwardly alongside Fama’s
observation that inexpensive and small-cap stocks generally outperform the market. The
inconsistency was initially reconciled by the assumption that these premiums represent
compensation for investors’ bearing additional risk—which seemed reasonable enough, since
value and small cap stocks tend to be more volatile than growth and large cap stocks (perhaps
due to increased business risk). At least, this is how DFA explained these style premiums to
prospective investors.
Company Size
Relative performance of
small cap stocks vs.
large cap stocks (%)
Relative Price
Relative performance of
value stocks vs.
growth stocks (%)
11.869.71
2.16
Small Large
1928–2018
Annualized Returns
Small
minus Large
12.419.113.30
Value Growth
1928–2018
Annualized Returns
Value
minus Grow th
13.93
9.084.85
Small Large
1970–2018
Annualized Returns
Small
minus Large
13.23
8.225.01
Value Growth
1975–2018
Annualized Returns
Value
minus Grow th
11.419.54
1.87
Small Large
1989–2018
Annualized Returns
Small
minus Large
12.779.113.66
Value Growth
1989–2018
Annualized Returns
Value
minus Grow th
US Stocks Developed Markets Emerging Markets

Page | 4
That was, until a 2015 elaboration of the original Fama/French research determined there are in
fact five factors that describe stock performance: the overall market (beta), value, size,
profitability, and investment. These profitability and investment factors imply that firms that
generate more cash, and return more of that cash to shareholders, (rather than reinvesting in
the business) tend to deliver higher market returns. The notion of “higher compensation for
greater risk” no longer holds up, since firms with a surfeit of cash tend to be less risky, not more.
DFA quietly turned to an alternative explanation (the discounted cash flow model) as justification
for these newly-identified premiums. Now, inexpensive stocks that also deliver relatively high
cash flows should outperform over time. This statement is virtually indistinguishable from the
active manager’s quest to find companies that trade at a discount to intrinsic value based on
their assessment of future earnings potential. DFA still honors EMH given Director Eugene
Fama’s pioneering work…but mostly in the breach. Actions speak louder than words.
The size premium is a trickier case; there is no clear financial or economic rationale for the
empirical observation of small cap’s historical outperformance. That said, it stands to reason
that smaller companies, early in their life cycles, offer the greatest potential for business
expansion (and prospective returns). Buying Apple as a small company was far more profitable
than holding it as a large cap stock. The trick, of course, is to identify future “Apples” when
they’re young businesses—or to be sufficiently diversified as to ensure that one’s portfolio
captures these rare opportunities.
In his 2018 paper Do Stocks Outperform Treasury Bills?, Hendrik Bessembinder showed that
among all US stocks since 1926, the best-performing 4% of listed companies explains the entire
excess return over Treasury bills. Yes, you read that right. Moreover, an equal-weighted blend
of all US stocks outperformed a market-weighted portfolio over the same period, indicating
relatively high returns from smaller companies.
Though Bessembinder never drew this conclusion explicitly, his research suggests that the value
and small cap premiums reflect the benefits of owning those eventual, rare winners early in their
life cycles. This speaks to the importance of diversification or—far more challenging—
outstanding stock selection to harvest these extraordinary investment opportunities. DFA’s
strategies embody precisely these goals – broad diversification, a value orientation, and a tilt
towards smaller companies. That’s why we invest our clients’ money with them.
Unfortunately, during the current bull market, the performance of these style premiums has
fallen flat across regions, and especially within the United States; the returns to the value factor
have been especially poor. In other words, stocks with low valuations have significantly
underperformed those with high prices, while small-cap and high-profitability stocks have failed
to differentiate themselves from others in the market.

Page | 5
Source: DFA
The underperformance of the value factor has garnered the most attention although, in our
view, value and profitability are two sides of the same value investing coin. Low valuations are
not attractive if they aren’t anchored by solid fundamentals (i.e., profits). It's important to note
that DFA’s profitability factor uses current earnings as a proxy for future profitability. This
approach does not (nor does it claim to) predict future cash flows with great accuracy – no
method does. Intrinsic value is inherently uncertain, as is the practice of distinguishing value
stocks (the low-priced good ones) from value traps (the low-priced, but soon-to-be-obsolete
ones). The factor approach simply argues that stocks that trade at low valuations vis-à-vis
current cash flow metrics will outperform on average over time.
DFA has some useful context for investors in this regard. Over the past 10 years (through June
2019), value stocks have actually performed on par with their historic average. The shortfall in
the value premium (which measures the performance of value relative to growth) has resulted
from the extraordinary performance of growth (i.e., high-priced) stocks.
These firms may be high-priced for any number of reasons: rapid revenue growth, perceived
earnings stability in recessionary environments, brand/market share dominance, or some
combination thereof. Growth and value are not static labels – companies can cross these
categories as their business outlooks and valuations (price/earnings, price/book, or
price/revenue ratios) evolve over time.
10-year annualized premiums (2009–2018): US, Developed ex US, and Emerging Markets
US Stocks
Developed ex US Markets Stocks Emerging Markets Stocks
Profitability
Relative performance of
high profitability stocks vs.
low profitability stocks (%)
Company Size
Relative performance of
small cap stocks vs.
large cap stocks (%)
Relative Price
Relative performance of
value stocks vs.
growth stocks (%)
-0.56
High Prof. minus Low Prof.
0.50
Small minus Large
2.24
High Prof. minus Low Prof.
1.23
Value minus Growth
3.18
Small minus Large
-4.03
Value minus Growth
3.64
Small minus Large
-0.73
Value minus Growth
1.56
High Prof. minus Low Prof.

Page | 6
Source: DFA
In keeping with its label, the classic growth stock experiences rapid gains in revenue or earnings.
Enticed by the attractive prospects of such businesses, investors pay up for these stocks, leading
to higher valuations. These firms typically offer exciting (“disruptive” is the term of our era) new
products or business models that are broadly adopted – Facebook, Amazon, Netflix, Microsoft,
Apple, and Google are the iconic examples. This group of stocks has delivered a 10-year average
return of 720%, while the broader market rose 246%.1 The advance of high-priced stocks has
grown even more disproportionate in recent years. The following chart buckets the 2-year
returns of S&P 500 constituents according to price/revenue decile. The upshot is that the most
expensive segments of the market have accounted for all of the S&P 500’s recent gains.
Source: Hussman Strategic Advisors, One Tier and Rubble Down Below, January 2020.
1 Arnott, Rob; Ko, Amie; Treussard, Jonathan (2019). Standing Alone Against the Crowd. Research Affiliates.

Page | 7
Growth and momentum investing, while not synonymous, are cousins. Momentum strategies
presume that fundamentals are persistent (or at least uncertain), and that investors exhibit
herding behavior driven by past performance: they buy what’s going up and sell what’s going
down. Benjamin Graham acknowledged that while markets are weighing machines in the long
run (i.e., driven by fundamentals) they are voting machines in the short run (driven by sentiment).
Momentum stocks can earn outsized returns when market trends are strong and persistent, but
are prone to periods of instability when there’s a change in fundamentals, which (eventually)
exert a gravitational pull on share prices.
While momentum investing ignores valuation as a signal, growth investing takes it with a large
grain of salt. Who cares about a high price-earnings ratio when a company is increasing
revenue by 30%? These stocks are expected to grow into their high valuations over time, a
thesis that rests heavily on assumptions about future market conditions. Growth stocks are
vulnerable to changes in sentiment, the business cycle, government policy, and/or shifting
competitive dynamics that call into question the rosy assumptions that buttress high stock
prices. When the growth and momentum categories overlap substantially (when stocks with
positive momentum are disproportionately represented by growth companies) the divergences
between prices and fundamentals become particularly pronounced—increasing the vulnerability
of the whole market.
For value investors, the challenge is not knowing when (or whether) such shifts might occur. In a
recent paper, Grantham, Mayo and Van Otterloo (GMO) attributed the recent underperformance
of the value premium to a lack of migration between the value and growth categories for US-
listed stocks:
Value stocks typically benefit when companies with clouds hanging over them improve operations
or experience a cyclical recovery, strengthen their fundamentals, and see their multiples expand.
As valuations rise, some value stocks graduate from the value to the growth universe. Value
investors benefit by selling the more expensive stocks as they leave the group while simultaneously
picking up the growth companies that have recently disappointed and thus trade at cheaper levels.
That turnover, or rebalancing effect, has been a big plus for value over the years, contributing 2.2%
of value’s return premium. Over the past decade, this rate of shift has slowed to 1.3%. This
reduction in the dynamism of these groups has been particularly striking within the expensive half
of the market, which is a good proxy for growth companies, since investors tend to pay higher
multiples for faster growth. Of late, expensive stocks have remained expensive for longer than
usual. Typically, high growth companies are unable to sustain excessive growth rates for long
periods. In the last decade, however, the growth universe has been more retentive than in the past.
A handful of companies, including Facebook, Alphabet, and Amazon, have managed to grow at
high rates for long periods.2
2 Friedman, Rick (2019). Value Investing – Bruised by 1000 Cuts. Grantham, Mayo, & Van Otterloo.
Page | 8
To recap: stocks with low valuations, small market capitalizations, and/or high cash flows have
historically outperformed their industry and sector counterparts. The rationale for the existence
of these return premiums evolved slowly over time, from purely empirical to economically-
grounded, and aligns with Paladin’s long-held value investing philosophy. Lately, it’s become
apparent that the existence of these premiums depends on market dynamism that allows for
healthy competition, the emergence of potential rivals, and the eventual realignment of prices
and fundamentals. Instead, the recent market environment has been characterized by an
unusually large and persistent advantage for a concentrated set of large-capitalization stocks, to
the detriment of smaller and less-expensive companies. Momentum investing is certainly
contributing to this state of affairs, but it isn’t the whole story.
Easy Money Meets Unchecked Monopoly
Monopolies defeat competition and reduce industry dynamism by pricing other firms out of
business and/or absorbing new technologies through buyouts. Incumbents use their
advantages of scale, technology, and/or cheap funding to discourage the entry and survival of
rivals, giving them control over the prices paid for inputs and/or those charged to consumers.
As investors recognized these advantages, the share prices of monopolists were driven higher to
reflect the potential for persistently outsized profits.
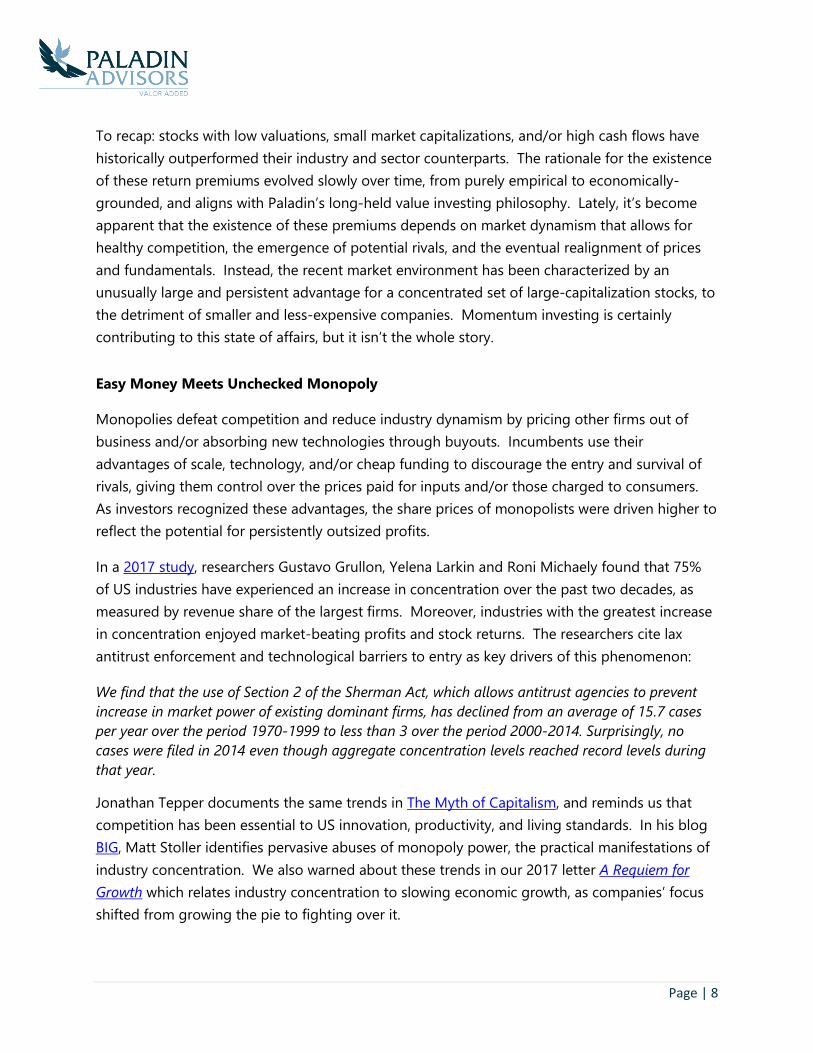
In a 2017 study, researchers Gustavo Grullon, Yelena Larkin and Roni Michaely found that 75%
of US industries have experienced an increase in concentration over the past two decades, as
measured by revenue share of the largest firms. Moreover, industries with the greatest increase
in concentration enjoyed market-beating profits and stock returns. The researchers cite lax
antitrust enforcement and technological barriers to entry as key drivers of this phenomenon:
We find that the use of Section 2 of the Sherman Act, which allows antitrust agencies to prevent
increase in market power of existing dominant firms, has declined from an average of 15.7 cases
per year over the period 1970-1999 to less than 3 over the period 2000-2014. Surprisingly, no
cases were filed in 2014 even though aggregate concentration levels reached record levels during
that year.
Jonathan Tepper documents the same trends in The Myth of Capitalism, and reminds us that
competition has been essential to US innovation, productivity, and living standards. In his blog
BIG, Matt Stoller identifies pervasive abuses of monopoly power, the practical manifestations of
industry concentration. We also warned about these trends in our 2017 letter A Requiem for
Growth which relates industry concentration to slowing economic growth, as companies’ focus
shifted from growing the pie to fighting over it.

Page | 9
The consequences for wage earners and public market investors ring true today:
The trend toward concentration has important implications for investors as well as citizens. Recent
research has shown that larger corporations pay a smaller share of their profits to their employees,
and also devote less to capital investment than do small firms—which will limit productivity gains
and future wage growth. Although good for investors in the short run, it’s a terrible long-term
strategy, as highlighted by BlackRock’s Larry Fink. At the same time, more workers are employed
by large corporations than ever before. To an increasing degree, large corporations act as
monopolists in product markets, and monopsonists in labor markets, putting workers and
households at a double disadvantage. Finally, increasing concentration of wealth threatens the
public capital markets, since companies need no longer turn to individuals in order to raise money.
So much for the triumph of the small investor.
Lax regulatory enforcement implies greater opportunity for M&A, which feeds the trend of
industry consolidation. The following chart illustrates the spike in M&A since the 1990s, which
corresponded with a virtual disappearance of antitrust filings.3 One consequence is that
businesses old and new are being snapped up by incumbents. Another is that the public stock
market is shrinking, as new players are absorbed by established firms and businesses that are
unable to compete are forced to shutter.
Source: Taylor Mann of Pine Capital
Variant Perception details a range of US industries that are either effective monopolies or
duopolies, including cable/high speed internet, computer operating systems, social networks,
online search, payment systems, waste management, beer, airplane manufacturers, online
advertising, soft drinks, and ratings agencies. The full industry list is longer, and longer still
when you include oligopolies—markets dominated by 3-5 players.
3 This series uses a different, broader measure of antitrust filings than the study cited above.
Page | 10
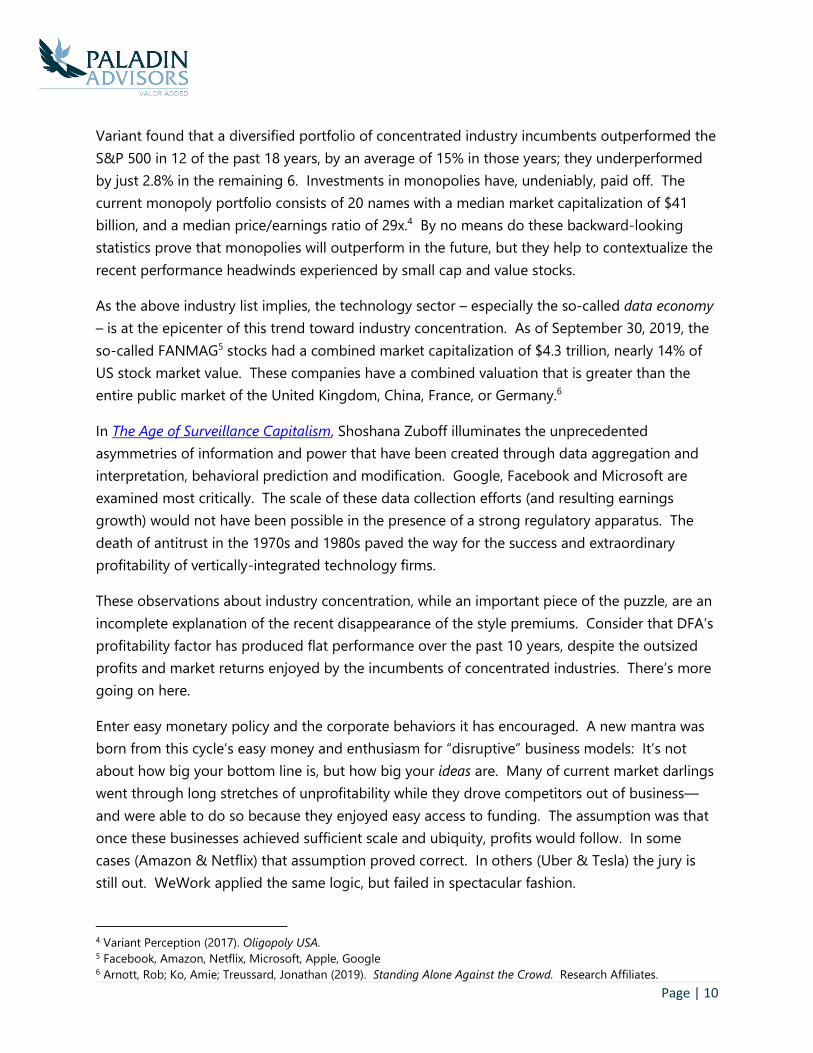
Variant found that a diversified portfolio of concentrated industry incumbents outperformed the
S&P 500 in 12 of the past 18 years, by an average of 15% in those years; they underperformed
by just 2.8% in the remaining 6. Investments in monopolies have, undeniably, paid off. The
current monopoly portfolio consists of 20 names with a median market capitalization of $41
billion, and a median price/earnings ratio of 29x.4 By no means do these backward-looking
statistics prove that monopolies will outperform in the future, but they help to contextualize the
recent performance headwinds experienced by small cap and value stocks.
As the above industry list implies, the technology sector – especially the so-called data economy
– is at the epicenter of this trend toward industry concentration. As of September 30, 2019, the
so-called FANMAG5 stocks had a combined market capitalization of $4.3 trillion, nearly 14% of
US stock market value. These companies have a combined valuation that is greater than the
entire public market of the United Kingdom, China, France, or Germany.6
In The Age of Surveillance Capitalism, Shoshana Zuboff illuminates the unprecedented
asymmetries of information and power that have been created through data aggregation and
interpretation, behavioral prediction and modification. Google, Facebook and Microsoft are
examined most critically. The scale of these data collection efforts (and resulting earnings
growth) would not have been possible in the presence of a strong regulatory apparatus. The
death of antitrust in the 1970s and 1980s paved the way for the success and extraordinary
profitability of vertically-integrated technology firms.
These observations about industry concentration, while an important piece of the puzzle, are an
incomplete explanation of the recent disappearance of the style premiums. Consider that DFA’s
profitability factor has produced flat performance over the past 10 years, despite the outsized
profits and market returns enjoyed by the incumbents of concentrated industries. There’s more
going on here.
Enter easy monetary policy and the corporate behaviors it has encouraged. A new mantra was
born from this cycle’s easy money and enthusiasm for “disruptive” business models: It’s not
about how big your bottom line is, but how big your ideas are. Many of current market darlings
went through long stretches of unprofitability while they drove competitors out of business—
and were able to do so because they enjoyed easy access to funding. The assumption was that
once these businesses achieved sufficient scale and ubiquity, profits would follow. In some
cases (Amazon & Netflix) that assumption proved correct. In others (Uber & Tesla) the jury is
still out. WeWork applied the same logic, but failed in spectacular fashion.
4 Variant Perception (2017). Oligopoly USA. 5 Facebook, Amazon, Netflix, Microsoft, Apple, Google 6 Arnott, Rob; Ko, Amie; Treussard, Jonathan (2019). Standing Alone Against the Crowd. Research Affiliates.

Page | 11
Technology-driven network effects and long runways for entrepreneurs with big ideas are two
sides of the same coin. In a world of easy money and a hands-off approach to corporate power,
investors want the industry leaders—or those with a primrose path to disrupt incumbents and
seize that power for themselves.
Meanwhile, the proliferation of unicorns means that startups are pushing the upper end of the
small-cap threshold by the time they come to market, keeping the best opportunities away from
ordinary investors. That’s if they come to market at all, given the record levels of private equity
and M&A activity. Large companies and/or private investors are extracting the bulk of the value
from these startups, posing an existential threat to the small-cap segment of the public markets.
In sum, large-cap growth companies enjoy extraordinary business advantages in the current
environment. Regulation of monopoly power is minimal, allowing for unchecked expansion,
acquisition, and preservation of market share. Most monopolies are high-priced “growth”
stocks, since investors lavish anticompetitive behavior with high valuations.
The emergence of the information economy is leading to an extraordinary concentration of
information and power for businesses that successfully harvest and interpret that data. Easy
access to cheap funding (the Fed strikes again!) and enthusiasm for entrepreneurial boldness
has created long runways for aspiring tech-opolists, even when profitability is a distant hope.
These facts underscore the reduction in market dynamism that is limiting competition and
preventing the normalization of share prices toward long-term fundamentals. If such dynamism
is a precondition for the success of small cap and value investing, where does that leave us?
Paladin Strategy
The last decade has been among the most challenging periods for the performance of these
style premiums, value in particular. But is now the time to give up? As the graphic below shows,
growth stocks are as expensive vis-à-vis value as they were in 2000—the height of the DotCom
bubble. Warren Buffet advised fear when other investors are greedy, and greed when others are
fearful. To say that greed has swamped fear in current markets is a gross understatement –
measures of sentiment and momentum are also on par with the 2000 mania, as Lance Roberts
points out in a recent market report, This is Nuts – Part Deux. Both valuations and technical
indicators suggest we are in the midst of one of the most irrationally exuberant periods in stock
market history. In the words of John Hussman, subsequent generations will look back on this
moment, shake their heads, and say, “This is where they completely lost their minds.”

Page | 12
Source: Star Capital
The rubber band is stretched politically as well, as extremes in corporate power and resulting
income inequality have made their way into popular discourse. Concerns over data privacy and
personal autonomy may soon result in firmer regulation of tech monopolies, which have thus far
skirted reform. Inadequate antitrust regulations (which have focused primarily on pricing
abuses) are being reconsidered. A potential catalyst for the resurgence in value could be a
legislative response to corporate overreach.
That said, a political backlash isn’t a necessary trigger for a major market event against a
backdrop like this. In his 1954 postmortem on the Great Crash of 1929, John Kenneth Galbraith
noted that the popular reaction against the extreme concentration of wealth and power in the
Gilded Era didn’t emerge until after the collapse. He attributed the Great Crash and ensuing
Depression to an economy that was “fundamentally unsound” noting the effects of:
1) “The bad distribution of income” in which the 5 percent of the population with the
highest incomes received approximately a third of all income, such that “the economy
was dependent on a high level of investment or a high level of luxury spending or both.”
2) “The bad corporate structure [in which] American enterprise had opened its hospitable
arms to an exceptional number of promoters, grifters, swindlers, impostors, and frauds…a
flood tide of corporate larceny. The most important corporate weakness was inherent in
the vast new structure of holding companies and investment trusts.”
3) “The poor state of economic intelligence...the economists and those who offered
economic counsel in the late twenties and early thirties were almost uniquely perverse.”
Citing the income tax reductions announced by President Hoover, Galbraith notes “these
were negligible except in the higher income brackets; businessmen who promised to

Page | 13
maintain investment and wages, in accordance with a well-understood convention,
considered the promise binding only for the period in which it was not financially
disadvantageous to do so.”7
A key difference between then and now is our extraordinarily (and pre-emptively)
accommodative monetary and fiscal policy, which has been sustaining growth—albeit at a low
level, and through a rapid expansion of debt—while fostering asset bubbles and inequality. Our
policymakers are now planning more ambitious set of inflationary interventions in order to
diminish the real cost of debt service while sustaining asset prices—an inherent contradiction.
We have chosen to abuse the US dollar’s privileged status as the world’s reserve currency and
risk stagflation in an attempt to print our way out of a liquidity trap of our own creation.
Over the next few years, we expect slow economic growth and an increasingly frustrated voter
base to produce a further escalation of the deficit spending; it’s practically a foreordained
conclusion, given the impact of Boomer retirements on entitlements. The Fed will accommodate
higher deficits with additional liquidity (monetization) in an effort to limit pressure on interest
rates. The result is likely to be rising inflation and a weaker US dollar. Waning foreign demand
for US assets will make it harder for the Fed to anchor long-term bond yields and credit spreads,
with negative repercussions for stock markets. In other words, the scenario could look very
much like what we saw as the 1960s gave way to the 1970s.
This scenario, if it develops, will play out over a multi-year horizon, with the likelihood of a
recessionary episode in the interim. Therefore, we are not making wholesale changes in our
portfolio strategy, but are alert to potential changes in the economic and market paradigm. We
remain underweight US growth stocks, which offer exceptionally poor risk/reward. Our clients’
portfolios are instead tilted toward value, equity income, and defensive sectors. We have
growing conviction that foreign assets are poised for a period of relative outperformance,
thanks to a plateauing dollar and corresponding slowdown in foreign investment in the US.
Therefore, we are adding to foreign currency exposure in client portfolios – first by increasing
our position in the euro, and then by raising our foreign equity targets. We retain an overweight
position in short- to intermediate duration bonds, with a focus on higher-quality segments.
7 Kenneth, John G. The Great Crash 1929. Boston, Houghton Mifflin Company, 1954