Quarterly Market Insights 2021: First Quarter
10
Quarterly Market Insights 2021: First Quarter
Transcript of Quarterly Market Insights 2021: First Quarter

Quarterly Market Insights
2021: First Quarter
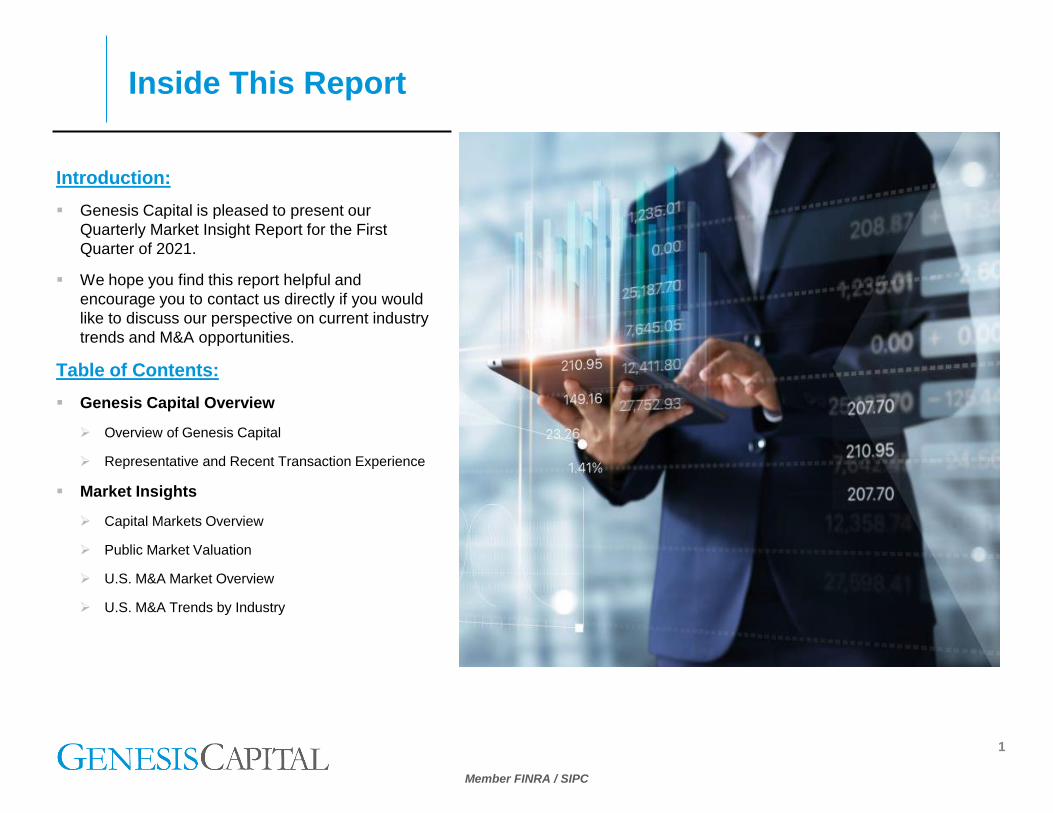
Introduction:
▪ Genesis Capital is pleased to present our
Quarterly Market Insight Report for the First
Quarter of 2021.
▪ We hope you find this report helpful and
encourage you to contact us directly if you would
like to discuss our perspective on current industry
trends and M&A opportunities.
Table of Contents:
▪ Genesis Capital Overview
➢ Overview of Genesis Capital
➢ Representative and Recent Transaction Experience
▪ Market Insights
➢ Capital Markets Overview
➢ Public Market Valuation
➢ U.S. M&A Market Overview
➢ U.S. M&A Trends by Industry
Inside This Report
Member FINRA / SIPC
1

Member FINRA / SIPC
Overview of Genesis CapitalIndependent Investment and Merchant Bank
2
▪ Focused on “Need” not Size
▪ Expertise with Public Corporations
▪ Deep Experience with Family Businesses
▪ Solution Focused vs Product Oriented
▪ Extensive Sell-Side and Buy-Side M&A Experience
▪ National Client Base
▪ Active Cross Border Practice with International Operations
and Buyers
▪ Proven Track Record and Strong References
An Independent Firm Focused On Families & Companies in Growth Sectors of the Economy
Providing a Full Suite of Investment Banking Services Mergers, Acquisitions & Sales
➢ Sell-Side
➢ Buy-Side Acquisition Programs
➢ Management Buyouts
➢ Restructurings
➢ Corporate Divestitures
Financial Advisory Services
➢ Strategic Alternatives Review
➢ Capital and Strategic Planning
➢ Strategic Investments & Joint Ventures
➢ Fairness and Valuation Opinions
➢ Committee Representation
Capitalizations
➢ Recapitalizations
➢ Private Placements
➢ Private Investment in Public Equity (PIPE)
➢ Employee Stock Ownership Plans (ESOP)

Member FINRA / SIPC
Genesis Capital Track RecordDeep Expertise Across Several Industries
3
and the waste services
division of
(NYSE:WRK)
has acquired
Technology,
Media, Telecom
has been acquired by
a subsidiary of
has been acquired by
a portfolio company of
has received a majority
investment from
Consumer
has entered into an
agreement to acquire
(NYSE: SPB)
has been acquired by
(Nasdaq: PLKI)
(NYSE/TSX: QSR)
has acquired
and
has acquired
Industrial
has been acquired by
(NYSE:KOP)
has formed a partnership
with and received a majority
investment from
has entered into a long term
agreement with
(NYSE: LYV)
to operate
Leisure &
Entertainment
has acquired
(NASDAQ: SSB)
has been acquired by
Business
Services
has been acquired by
(NYSE:TBI)
has been acquired by
(NYSE: TBI)
a wholly-owned
subsidiary ofand
have been restructured and
rebranded as
Healthcare
has partnered with
a portfolio company of
has been acquired by

Member FINRA / SIPC
0.0%
1.0%
2.0%
3.0%
4.0%
5.0%
May-16 May-17 May-18 May-19 May-20 May-21
Fed Funds Target Rate LIBOR (3 Month) 10 Year Treasury Note
(20.0%)
0.0%
20.0%
40.0%
60.0%
80.0%
100.0%
120.0%
140.0%
160.0%
180.0%
200.0%
220.0%
May-16 May-17 May-18 May-19 May-20 May-21
Dow Jones Industrial Average (^DJI) S&P 500 (^SPX) NASDAQ (^COMP)
$10,839
$18,783
$21,679
$35,079
$50,718
$22,002
93
106
126
114
153
64
0
45
90
135
180
225
270
$0
$12,000
$24,000
$36,000
$48,000
$60,000
2016 2017 2018 2019 2020 YTD Q1 2021
Gross IPO Proceeds IPO Count (#)
Capital Markets Overview
4
Source: S&P Capital IQ, Mergermarket, Preqin, Pitchbook.
Public Equity Market Indices (1)
Perc
en
tag
e C
ha
ng
e
Interest Rates (1)
Perc
en
tag
e
Notes:
1. Indexed relative to May 13, 2016.
2. YTD Q1 as of March 31, 2021.
IPO ActivitySPAC Activity
Gro
ss P
roceed
s($
in
Mil
lio
ns
)
SP
AC
IPO
Vo
lum
e (#
in A
ctu
als
)
(2)
Gro
ss P
roceed
s($
in
Mil
lio
ns
)
IPO
Vo
lum
e (#
in A
ctu
als
)
Commentary
(2)
▪ On May 10, 2021, the S&P 500
Index closed at 4,188.43, 11.5%
higher than the beginning of the
year, and 30.2% higher than its
average closing price throughout
2020.
▪ The 10-year Treasury Note yield
was 1.63% on May 10, 2021, 70
basis points higher than its yield
of 0.93% at the beginning of the
year, and 74 basis points above
its average closing yield of 0.89%
in 2020.
▪ The value of special purpose
acquisition company (SPAC)
gross proceeds in the year to
date (YTD) period ended in Q1
2021 was $87.7 billion. Gross
SPAC proceeds totaled $75.8
billion in full year 2020.
▪ The value of initial public
offerings (IPO) gross proceeds in
YTD period ended in Q1 2021
was $22.0 billion, across 64
offerings.
$1,549 $5,792
$9,111 $12,042
$75,793
$87,713
8
24
43
59
249
300
0
40
80
120
160
200
240
280
320
$0
$20,000
$40,000
$60,000
$80,000
$100,000
2016 2017 2018 2019 2020 YTD Q1 2021
Gross SPAC Proceeds SPAC IPO Count (#)

Member FINRA / SIPC
▪ Since Q3 2011, EBITDA
multiples have trended upwards,
experiencing record highs
through the end of 2017 and into
2018, 2019, 2020 and 2021.
Public Market Valuation
5
Public Trading EBITDA Multiples by Select Sector
▪ Top sectors by valuation:
➢ Technology / Media /
Telecom: 18.8x
➢ Leisure & Entertainment: 17.9x
➢ Healthcare: 15.9x
➢ Consumer: 12.4x
➢ Industrial / Manufacturing: 12.1x
➢ Business Services: 10.6x
EV
/ E
BIT
DA
Mid-Quarter Public Trading EBITDA Multiples (S&P 500)
Low: 7.5x
Q3 2011
EV
/ E
BIT
DA
Commentary
Commentary
10-Yr. Avg. Multiple: 11.1x Current: 17.2x
Source: S&P Capital IQ.Note: Current as of May 10, 2021.
Member FINRA / SIPC
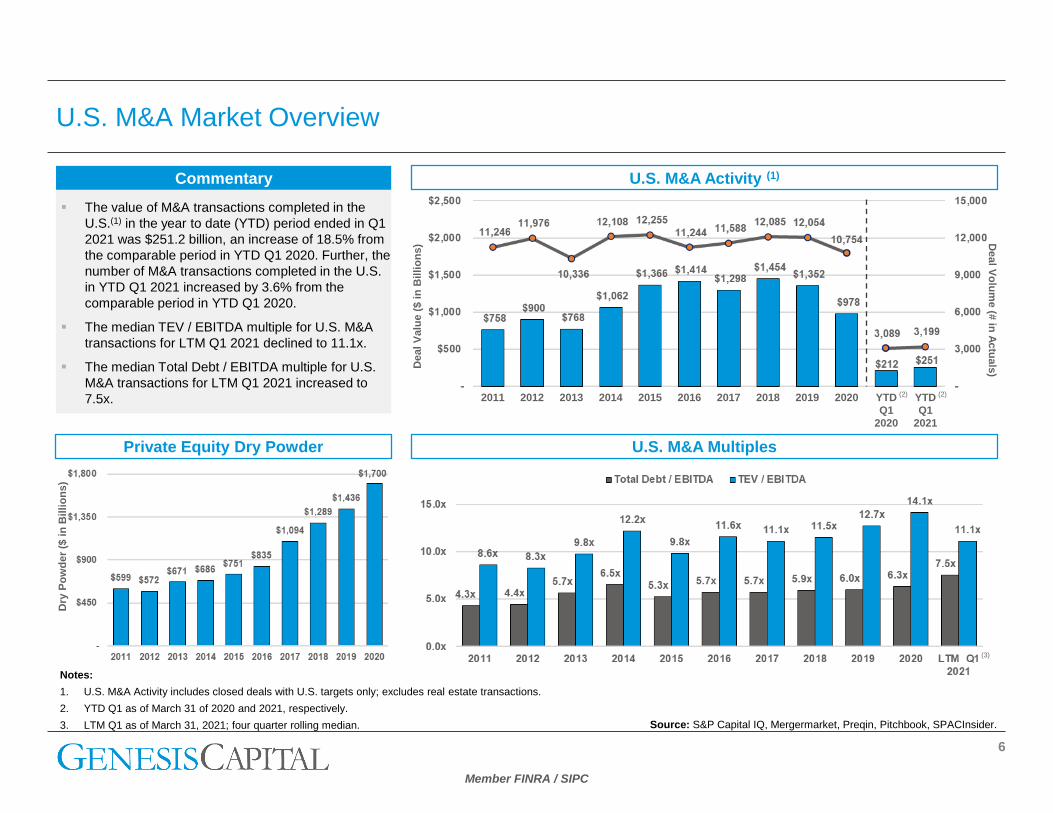
Private Equity Dry Powder
U.S. M&A Market Overview
6
Source: S&P Capital IQ, Mergermarket, Preqin, Pitchbook, SPACInsider.
Notes:
1. U.S. M&A Activity includes closed deals with U.S. targets only; excludes real estate transactions.
2. YTD Q1 as of March 31 of 2020 and 2021, respectively.
3. LTM Q1 as of March 31, 2021; four quarter rolling median.
Deal
Valu
e (
$ i
n B
illi
on
s) D
eal V
olu
me (#
in A
ctu
als
)
Commentary
▪ The value of M&A transactions completed in the
U.S.(1) in the year to date (YTD) period ended in Q1
2021 was $251.2 billion, an increase of 18.5% from
the comparable period in YTD Q1 2020. Further, the
number of M&A transactions completed in the U.S.
in YTD Q1 2021 increased by 3.6% from the
comparable period in YTD Q1 2020.
▪ The median TEV / EBITDA multiple for U.S. M&A
transactions for LTM Q1 2021 declined to 11.1x.
▪ The median Total Debt / EBITDA multiple for U.S.
M&A transactions for LTM Q1 2021 increased to
7.5x.
U.S. M&A Activity (1)
U.S. M&A Multiples
2011 201920182017201620152013 20142012 2020 YTD
Q1
2020
YTD
Q1
2021
Dry
Po
wd
er
($ i
n B
illi
on
s)
(3)
(2)(2)

Member FINRA / SIPC
U.S. M&A Trends by Industry
7
Healthcare Industrial / Manufacturing
Business Services Consumer
TE
V /
EB
ITD
A
Deal V
olu
me (#
in A
ctu
als
)
Deal V
olu
me (#
in A
ctu
als
)
TE
V /
EB
ITD
A
TE
V /
EB
ITD
A
Deal V
olu
me (#
in A
ctu
als
)
Deal V
olu
me (#
in A
ctu
als
)
TE
V /
EB
ITD
A
Source: S&P Capital IQ.Note: YTD Q1 as of March 31 of 2020 & 2021, respectively.

Member FINRA / SIPC
U.S. M&A Trends by Industry (Continued)
8
Leisure & Entertainment Technology / Media / Telecom
TE
V /
EB
ITD
A
Deal V
olu
me (#
in A
ctu
als
)
Deal V
olu
me (#
in A
ctu
als
)
TE
V /
EB
ITD
A
Source: S&P Capital IQ.Note: YTD Q1 as of March 31 of 2020 & 2021, respectively.

Member FINRA / SIPC
Definitions & Disclosure
9
Disclosure:The information contained in this report has been compiled from publicly available sources; it is not a research report and is provided for
informational purposes only. It is not to be construed as an offer to buy or sell or a solicitation of an offer to buy or sell any financial instruments
or to participate in any particular trading strategy. The information contained herein is believed by Genesis Capital to be reliable, but Genesis
Capital makes no representation as to the accuracy or completeness of such information. Genesis Capital may act as advisers to, have
positions in and effect transactions in securities of companies mentioned herein and also may provide, may have provided, or may seek to
provide services for those companies. In addition, Genesis Capital or their respective officers, directors and employees may hold positions in the
securities, options thereon or other related financial products of companies discussed herein. This is provided as informational only and is not a
solicitation for investment in any security whatsoever. Any investment by any investors must be made using their own investment decisions and
criteria using their own independent financial advisors. Also, past performance is not necessarily indicative of future results. No part of this
material may be copied or duplicated in any form or by any means, or redistributed, without Genesis Capital’s prior written consent. Sources of
information include but are not limited to, Mergermarket, Pitchbook, Preqin, and S&P Capital IQ.
▪ Last Twelve Months (LTM) — Timeframe of the immediately preceding 12 months.
▪ Year to Date (YTD) — Period of time beginning the first day of the current calendar year or fiscal year up to the current date.
▪ Total Enterprise Value (TEV) — Equity Value (fully-diluted shares outstanding x current market share price) + market value of debt +
minority interest - cash and equivalents.
➢ TEV may include payments to seller(s) in cash or stock, the present value of notes or similar instruments, net long-term debt assumed
by a buyer, and appropriate adjustments for other assets retained by a seller or liabilities assumed by a buyer.
▪ Total Debt — Short-Term Debt (interest-bearing liabilities due in 12 months or less, including, but not limited to, short-term bank loans and
lease payments) + Long-Term Debt (interest-bearing liabilities with a maturity date longer than 12 months, including, but not limited to,
bonds, lease payments, term loans, revolving lines of credit, and notes payable).
▪ EBITDA — Earnings Before Interest, Taxes, Depreciation, and Amortization. It is calculated as: Net Income + Interest + Taxes +
Depreciation + Amortization.
▪ Special Purpose Acquisition Company (SPAC) — It is formed strictly to raise capital through an initial public offering for the purpose of
acquiring an existing company.
▪ Dry Powder — Capital/funds raised by private equity firms that are available to be invested.
▪ Middle Market — Companies having Total Enterprise Values between $10 and $250 million.
▪ Middle Market Financial Sponsor — A Private Equity firm which invests in companies with Total Enterprise Values between $10 and $250
million.
Definitions: