Quarterly Investment Perspective - Bessemer Trust · 2018-09-13 · warning of an economic meltdown...
16
In this issue: 8 The Investment Roundtable: Controlling Volatility A Letter From Marc D. Stern, Chief Investment Officer Dear Client, The global economy moved toward a broad slowdown in the third quarter. Of course, for many families it feels like the 2008-2009 recession never ended. In the 27 months since economists officially declared it over, an average of only 4.3% of Americans responding to Conference Board surveys have described jobs as “plentiful.” But there have been some notable bright spots during this period. Led by the manufacturing sector, U.S. exports rose 37%, corporate profits surged 53%, and private-sector payrolls added more than 1 million jobs. Now, though, readings from many leading indicators are consistent with the onset of recession. Inventory levels are rising faster than new orders, corporate sentiment is worsening, and consumer sentiment remains mired at very low levels. Notably, too, the yield investors demand to purchase corporate debt is sharply higher. None of this means global growth will disappear. In fact, worldwide GDP still appears on track to increase by more than 3% this year and next, giving well-positioned companies ample room to sustain strong profits. Accordingly, our investment approach takes into account both the current difficult macroeconomic environment and the wide-ranging investment opportunities we see emerging. A Different Downturn If a recession is indeed developing, it is doing so in an unusual way. Normally, economic downturns follow a well-worn path: a period of good growth leads to excess — too much hiring, too many new homes, too much optimism; then, tighter policies choke off burgeoning inflation, ushering in a healthy cleansing that helps the economy prepare for its next advance. This time, though, a different dynamic is at work. Despite accommodative policies and abundant liquidity, October 2011 Quarterly Investment Perspective Weighing Risks Visit us on the web at www.bessemer.com.
Transcript of Quarterly Investment Perspective - Bessemer Trust · 2018-09-13 · warning of an economic meltdown...

In this issue:
8 The Investment Roundtable:Controlling Volatility
A Letter From Marc D. Stern, Chief Investment Officer
Dear Client,
The global economy moved toward a broad slowdown in the thirdquarter.
Of course, for many families it feels like the 2008-2009 recessionnever ended. In the 27 months since economists officially declared itover, an average of only 4.3% of Americans responding to ConferenceBoard surveys have described jobs as “plentiful.” But there have beensome notable bright spots during this period. Led by the manufacturingsector, U.S. exports rose 37%, corporate profits surged 53%, and private-sector payrolls added more than 1 million jobs.
Now, though, readings from many leading indicators are consistentwith the onset of recession. Inventory levels are rising faster than neworders, corporate sentiment is worsening, and consumer sentimentremains mired at very low levels. Notably, too, the yield investorsdemand to purchase corporate debt is sharply higher.
None of this means global growth will disappear. In fact, worldwideGDP still appears on track to increase by more than 3% this year and next, giving well-positioned companies ample room to sustainstrong profits. Accordingly, our investment approach takes intoaccount both the current difficult macroeconomic environment andthe wide-ranging investment opportunities we see emerging.
A Different Downturn If a recession is indeed developing, it is doing so in an unusual way.Normally, economic downturns follow a well-worn path: a period of good growth leads to excess — too much hiring, too many newhomes, too much optimism; then, tighter policies choke off burgeoninginflation, ushering in a healthy cleansing that helps the economy prepare for its next advance. This time, though, a different dynamic isat work. Despite accommodative policies and abundant liquidity,
October 2011
Quarterly Investment PerspectiveWeighing Risks
Visit us on the web at www.bessemer.com.

there appears to be a collective decision to wait:companies are waiting before they hire more peopleor build new plants; consumers are waiting beforethey buy a new home or car; and investors are waiting before they commit cash to buy stocks orcorporate bonds.
At the heart of this collective pause is a pronounceddeterioration of confidence, reflecting widespreadskepticism that leaders have the judgment and will to implement sound policies in Europe and theU.S. Events over the summer were particularly disconcerting, with European leaders failing to takedecisive action even as Greece’s debt crisis worsenedand U.S. leaders raising the debt ceiling only after anacrimonious debate featuring both sides publiclywarning of an economic meltdown if their policiesweren’t adopted.
Rising uncertainty has led investors to fear theworst, sparking sharp price adjustments. As shownin Exhibit 1, significant corrections have unfoldedin a wide range of equities and commodities aroundthe world.
Recent volatility has felt eerily reminiscent of theperiod leading up to the 2008 financial collapse,when similar declines were followed by even sharp-er losses. But even as we foresee some additionalpressure in the months ahead, we do not anticipatea repeat of the trauma of three years ago.
Indeed, we see many factors likely to help companiesand consumers withstand an economic downturn.Corporate profits have been strong, and companieshaven’t over-hired the last few years, so there is lessneed to cut back than in prior recessions. Most firmshave used robust cash flow to strengthen their balancesheets, and major banks in the U.S. have significant-ly reduced their leverage. Among consumers, a com-bination of higher savings, lower interest rates, andincreased foreclosures has pushed household debtobligations as a percent of income to their lowestlevels in a decade (Exhibit 2). By this time next year,debt service could drop to levels we last saw in theearly Eighties. Moreover, the outlook for con-sumers is brightened by meaningful drops in pricesfor many food and energy commodities. No wondermany major retailers have been reporting stable orslightly improved same-store sales, leading to fore-casts of a 2-3% rise in the upcoming holiday season.
A Letter From Marc D. Stern, Chief Investment Officer
2 Bessemer Trust Quarterly Investment Perspective
Exhibit 1: Sharp Price Adjustments Percent Change from 2011 PeakStock Indexes Financial Stocks Commodities
As of September 30, 2011.Source: Bloomberg, FactSet, Morgan Stanley Capital International, Standard & Poor’s
(16)%
U.S.
(20)%
Europe
(20)%
India
(22)%
Japan
(30)%
China
(46)%
GoldmanSachs
(49)%
BNPParibas
(52)%
BarclaysCapital
(56)%
MorganStanley
(60)%
Bank ofAmerica
(14)%
Gold
(25)%
Corn
(31)%
Oil
(32)%
Copper
(38)%
Silver
S

A Letter From Marc D. Stern, Chief Investment Officer
Exhibit 2: Reduced Consumer Debt ObligationsHousehold Debt Service
As of June 30, 2011.Household debt service ratio (DSR) is an estimate of the ratio of debtpayments to disposable personal income for U.S. consumers. Debt paymentsconsist of the estimated required payments on outstanding mortgage andconsumer debt.Source: Federal Reserve
What would happen to stock prices if a recessionwere to develop? Normally, recessions induce a 30%drop in corporate profits. If price-to-earnings ratioswere high during the good times, a combination offalling earnings and falling valuation multiples cancause stock prices to be cut in half — as seen in1973-1974, 2000-2002, and 2008-2009.
But if price-to-earnings multiples are already lowand companies are already lean (both of whichappear to us to be the case now), then the marketdamage can be contained. If a recession causedearnings to drop 20% and price-to-earnings multipleswere to settle at 12 to 13 times (a meaningful discount to the market’s historical norm of about15), we would expect the S&P 500 Index, whichstood at 1131 on September 30, to settle near 1050 — a much better outcome than the low of670 reached in 2009.
Government Debt Problems The outlook could be meaningfully better or worsedepending largely on the actions of policymakers inEurope and the U.S. It is impossible to know exactlyhow the issues can be resolved in a way to brighteninvestors’ moods. But we know that policymakers inboth geographies face mounting pressure for bolder
action to restore fiscal health. It is rapidly becomingriskier for politicians to do nothing than to addressproblems head-on.
The problems in Europe appear especially difficultto resolve because doing so requires agreementfrom many constituencies. Bureaucratic headwindswere especially apparent in July. An agreement toincrease funding for distressed governments withinthe euro zone initially led markets to rally, but optimism faded when it became clear that each ofthe 17 member countries would take their time toevaluate and vote on the proposals. Approvalrequires unanimous consent. It is an unusual systemthat gives Slovakia, with GDP representing about2% that of Germany and France, the ability to vetoa package favored by Chancellor Angela Merkeland President Nicolas Sarkozy. By quarter’s end,several euro zone countries still hadn’t approved thefunding initiative announced with fanfare in July.
But as frustrating as the process in Europe has beenfor investors over the last 18 months, we can’t losesight of the commitment that key European leadershave to preserving the euro. Taken alone, the largestcountry in Europe (Germany) is little more thanhalf the size of China or Japan and less than one-fourth the size of the U.S. But collectively, Europeis as big as all of Asia taken together or the U.S. A coordinated Europe is seen as destiny. AsChancellor Merkel said earlier this month on theefforts to keep the euro zone intact, “We are determined to do whatever is necessary.”
Ultimately, we foresee a three-step program fromEurope:• First, restructuring Greece’s debt and providingEuropean banks with additional capital. Resolvingthe Greek crisis will require applying “haircuts”to the value of its debt. Seeing this likelihood,investors have grown reluctant to provide theovernight funding needed by banks that own a lot of the distressed paper. To absorb these bondmarkdowns and regain market confidence,European financial institutions (especially in France
October 2011 3
13
15
14
16
17
18
1980 1083 86 89 92 95 04 0798 01
As
% o
f In
com
e
Higher Debt Payments
Lower Debt Payments
A

and Germany) will need a substantial infusion of equity — likely from a combination of publicand private sources.
• Second, implementation of what is known as theEuropean Stability Mechanism. This programwill provide substantial funding with broadpowers to “safeguard the stability of the euroarea.” Although it is scheduled to be launched in2013, we expect policymakers to begin calminginvestors with increased funding in coming months.
• Even as the first two actions could stem the crisis and move markets onto firmer ground, asustainable longer-term solution will likely requirea third step: a comprehensive plan to establish aEuropean Treasury with the power to collect taxrevenue and issue euro bonds. Giving up someautonomy will be a particularly painful move forindividual countries, so we expect this final stepto proceed more slowly over the next few years.
Of course, debt is also a concern in the U.S.Congress and the president have received twowakeup calls recently: first, the insightful reportissued last December by the deficit commissionheaded by Erskine Bowles and Alan Simpson, followed by Standard & Poor’s decision in Augustto downgrade long-term U.S. government debt.
The debt-ceiling legislation passed by Congress overthe summer created the Joint Select Committee onDeficit Reduction. The 12-member group, chairedby Democratic Senator Patty Murray and RepublicanCongressman Jeb Hensarling, is charged withidentifying $1.5 trillion in deficit cuts by November23. Frankly, it is difficult for us to see how this groupwill reach a consensus given the deep philosophicaldivide between members such as Democrat JohnKerry and Republican Pat Toomey. Moreover, fourof the committee’s members also served on theSimpson-Bowles commission last year — and allfour voted against the sensible plan that was putforth then. Perhaps, though, the repercussions ofinaction can compel a compromise. If the newcommittee can’t agree on a package of savings, or if
Congress doesn’t approve the committee’s packageby December 23, automatic across-the-board cutstotaling $1.2 trillion will be triggered. At somepoint, the U.S. will make needed changes to itsspending and its tax code. Whether this committeewill pursue this path seriously remains to be seen.
At this time of broad uncertainty, we find it particularly helpful to assess a range of possibleoutcomes. Exhibit 3 lays out four scenarios.Moving from right to left:
Lehman Brothers Part II. A disorderly default inGreece quickly spirals into a deep crisis in whichsome large banks become insolvent and global capital markets freeze up. Corporate earningsplunge, leading to a sharp drop in equity prices.
Deep Recession. Policymaker missteps — such asEuropean banks receiving too little capital, theEuropean Central Bank remaining overly focusedon fighting inflation, or Congress deferring neededfiscal changes — further erode corporate, consumer,and investor confidence. Paralysis sets in, causing a painful contraction of economic growth. Bothprofits and stock prices suffer, but do not collapse.
Shallow Recession. Governments take some action,but fail to diminish the broad uncertainty. Mostcorporations have the wherewithal to weather amild recession, so earnings fall modestly whileequity prices retreat somewhat from current levels.
Modest Growth. Emboldened policymakers act moredecisively and make visible progress on long-termsolutions. Confidence gradually returns, economicactivity slowly picks up, and profits rise. The positivedevelopments lift equity markets.
We don’t expect the most negative scenario todevelop because European leaders appear to understand the severity of complete collapse. AsPresident Sarkozy said earlier this month, “Thefailure of Greece would be the failure of all ofEurope. Remember in 2008, when the U.S. letLehman Brothers fail, the global financial system
A Letter From Marc D. Stern, Chief Investment Officer
4 Bessemer Trust Quarterly Investment Perspective

paid the price. For both economic reasons andmoral reasons, we can’t let Greece fail.”
Most recessions are mild, and we believe the factorsdiscussed earlier will prevent a deep contraction fromdeveloping. A shallow recession or modest growthis more likely — with the ultimate determinantbeing policy decisions.
Portfolio Positioning and Performance Our investment approach emphasizes balance, inthat we seek to participate meaningfully in risingmarkets while limiting losses in falling ones.
In today’s difficult environment, we have incorporatedsignificant defensive measures into our investmentstrategy. For some time, we have held elevatedcash levels, which we have raised further recentlyas economic risks have built. For example, as ofearly October, our two large cap portfolios are eachholding more than 45% cash, and approximately50% of the Real Return Fund is in defensive holdings.As shown in Exhibit 4, in our Balanced Growthmodel portfolio, cash, bonds, currencies, and creditinvestments stand at a higher-than-normal 50%.
At the same time, we retain exposure to growth-oriented assets. These include 38% of BalancedGrowth invested in equity and commodity markets,as well as 12% in hedge funds. These categorieswill likely benefit over time if worst-case economicscenarios miss the mark as we expect.
Exhibit 4: Balanced Growth Portfolio Weightings
Reflects Balanced Growth allocation as of September 30, 2011.
The sharp declines in market prices during thethird quarter led our Balanced Growth model portfolio to fall 8.7% for the nine-month period(Exhibit 5). Losses are never satisfying. Moreover,our performance did not live up to our historicalstandards. The following factors contributed toour results:
Detractors• Reducing the weighting of bonds and shorteningthe duration of our bond portfolios hurt our results.As we entered 2011, five-year Treasury bondsyielded a mere 2%, which we felt represented poorinvestment value. However, the flight to safety inthe third quarter pushed these yields implausiblylower to less than 1%.
A Letter From Marc D. Stern, Chief Investment Officer
October 2011 5
StrategicCurrency
5%
Credit10%
Small & MidCap Equities
15%
Large CapEquities
20%
Cash14%
Hedge Funds12%
Bonds21%
Commodities3%
Exhibit 3: Range of Outcomes
Modest Growth Shallow Recession Deep Recession Lehman Brothers Part IIImpact of Advances toward Progress comes too Missteps intensify Disorderly European Policy Actions solutions gradually late to avoid slow- lack of confidence defaults rattle
lift confidence down, but corporate financial systemstrengths persist
Corporate Profits $105 $85 $75 $55
Earnings Multiple 13x 12x 12x 12x
S&P 500 1350 1025 900 650
Estimated Probability 40% 45% 10% 5%As of September 30, 2011.

• Our philosophy of investing globally detractedfrom our returns in this nine-month period, asthe S&P 500 Index did meaningfully better thanmarkets elsewhere (falling about 8.8 percentagepoints less than developed non-U.S. markets and12.9 points less than emerging markets1).
• Our large cap equity portfolios were positionedfor continued recovery with exposure to industrials,materials, and energy stocks, which have under-performed as fears of an economic slowdownhave grown.
Positives• Favorable security selection in Global Small & MidCap, Real Return, and Global Opportunities posi-tioned these funds to outperform their benchmarks.
• Significant credit exposure provided some pro-tection from the downside of equities.
• Elevated cash levels throughout the third quarterhelped to offset some of the downturn.
In some ways, our strategies are not changing. Forexample, we are maintaining our bond positioningbecause we remain convinced that high-qualitybonds are richly priced, with limited return potentialand above-normal risks over the next few years. In addition, we remain committed to investingglobally — seeking to uncover the most compellinginvestment opportunities regardless of geography.Staying true to these views puts us in the best positionto meet clients’ long-term investment objectives.
In other ways, though, we stand ready to make significant changes. An example is our cash level,which is higher than normal due to unusual risksas policymakers seek to restore confidence andavoid recession. We are poised to deploy this capitalonce we see evidence of lasting progress in Europeand the U.S. Moreover, we believe the changes toour large cap portfolios slated for late Novemberwill improve the consistency of our performance(see next section).
Ultimately, we aim to have most of our portfoliosoutperform most of the time. Doing so has helpedus achieve a long-term track record of deliveringsuperior returns with controlled volatility.
Redefining Our Large Cap Portfolios Our commitment to excellence requires an openmind to change. Over the last several years, we haveenhanced our investment platform to increase itsglobal nature and flexibility to access a wide varietyof asset classes and investment strategies.
As we communicated to you in September, in our next stage of evolution we are refining our two large cap portfolios. We believe the changeswill maximize the consistent delivery of superiorinvestment performance.
A Letter From Marc D. Stern, Chief Investment Officer
6 Bessemer Trust Quarterly Investment Perspective
Exhibit 5: Performance Overview Annualized Returns
Ended Sept. 30, 2011 Volatility
Year-to-Date 2011 1 Year 3 Years 5 Years 3 Years 5 Years
Bessemer Balanced Growth Portfolio (8.7)% (2.1)% 2.9% 2.0% 13.0% 11.5%Global Balanced Growth Index (6.6) (1.0) 3.5 1.8 14.7 12.7
U.S. Stock/Bond Mix (70/30) (3.9) 2.6 3.8 1.4 15.1 13.0
S&P 500 Index (8.7) 1.1 1.2 (1.2) 21.3 18.3As of September 30, 2011. Past performance is no guarantee of future results.See page 7 for a complete description of Bessemer’s Balanced Growth portfolio and benchmarks.Volatility is measured by annualized standard deviation of monthly returns. This figure is most meaningful over multiyear periods.Source: Barclays Capital, Dow Jones, Federal Reserve, HedgeFund.net, Morgan Stanley Capital International, Standard & Poor’s, UBS
1Reflects local returns as of September 30, 2011.

Three key factors drive our thinking:• Globalization. Large firms like BMW, Chevron,General Electric, Michelin, and Samsung are best analyzed as global competitors rather thanby the address of their home office.
• Volatility. Market turmoil has intensified investors’focus on limiting portfolio volatility, and innovativeanalytics can enhance the consistency of returns.
• Resources. Experienced investment talent withinBessemer can be complemented by carefullyselected external managers. We have seen successin managing global portfolios in this way in GlobalSmall & Mid Cap and Global Opportunities.
Instead of being defined by geography (U.S. versusnon-U.S.), our two large cap equity portfolios willbe structured around distinct volatility objectivesbeginning in late November. Both of the new port-folios, Large Cap Core and Large Cap Strategies,will seek to deliver superior returns, but the Coreportfolio will also emphasize controlling volatilitywhile the Strategies portfolio will emphasize distinctcomplementary investment strategies.
Large Cap Core will be available in separately managed accounts and will be managed by aninternal team headed by me and two associate portfolio managers.
Large Cap Strategies will be available only as amutual fund and will be overseen by a Bessemerteam led by Portfolio Manager Lois Roman andtwo associate portfolio managers. Two external
managers will complement the Bessemer team’sapproach. Oldfield Partners is a deep value managerbased in London that emphasizes global equitiestrading at significantly discounted valuations.Sands Capital Management is an aggressive earn-ings growth manager based in Virginia thatemphasizes global companies with superiorprospects for rapid growth.
The two portfolios are paired within our overallapproach to large cap equities. Taken together, theobjectives will be strong absolute returns, outperfor-mance of the benchmark, and controlled volatility.
As we discuss in the Investment Roundtable on page8, limiting portfolio fluctuations is a key componentof investing irreplaceable capital. In difficult markets,we believe it is essential to stay true to our investmentdisciplines, including relying on independentresearch and objective judgment to build diversifiedportfolios. Throughout market history, turbulenttimes have set up opportunities for stronger long-termresults. We believe it will be the same this time. I look forward to updating you on our researchconclusions, investment strategies, and performanceresults in the quarters to come.
Sincerely,
Marc D. SternChief Investment Officer
A Letter From Marc D. Stern, Chief Investment Officer
October 2011 7
The Bessemer Balanced Growth Portfolio represents a model portfolio comprised of U.S. Large Cap, Non-U.S. Large Cap, Global Opportunities, Global Small& Mid Cap, Real Return, Fixed Income, Strategic Currency, and three Bessemer hedge funds of funds. Investments cannot be made directly in this modelportfolio. Relative weightings vary over time. Returns for Old Westbury Global Opportunities Fund, Old Westbury Global Small & Mid Cap Fund, Old WestburyReal Return Fund, and Bessemer hedge funds of funds are after all fees and expenses. All other returns reflect performance of Bessemer Common TrustFunds and are before fees and expenses. The results also include the reinvestment of all dividends and capital gains. Returns for hedge funds of funds arepreliminary and subject to change.
The Global Balanced Growth Index represents a mix of the Barclays Capital U.S. Government/Credit Index (25%), S&P 500 Index (15%), S&P Global Largeex-U.S. Index (10%), S&P Global Small & Mid Cap Index (14%), S&P Global Large & Mid Cap Index (14%), Real Assets (7% consisting of Dow Jones-UBS Commodity Index [5%] and Barclays Capital U.S. TIPS Index [2%]), Hedge Funds (10% consisting of S&P Global Broad Market Index (Hedged) [7%]and Barclays Capital U.S. Government Index [3%]), and 3-Month Treasury bills (5%) after 12/31/2010 and a mix of the S&P 500 Index (25%), S&P MidCap400 Index (10%), MSCI EAFE Index (14%), MSCI World Small Cap Index (5%), MSCI Emerging Markets Index (3%), HedgeFund.net Fund of FundsAggregate Index (10%), Dow Jones-UBS Commodity Index (2.5%), Barclays Capital U.S. Government/Credit Index (25%), Barclays Capital U.S. TIPSIndex (2.5%), and 3-Month Treasury bills (3%) before 1/1/2011.
The U.S. Stock/Bond Mix (70/30) is a composite of 70% S&P 500 Index and 30% Barclays Capital U.S. Government/Credit Index.
Index information is included herein to show the general trend in the securities markets during the periods indicated and is not intended to imply that anyreferenced portfolio is similar to the indices in either composition or volatility. Index returns are not an exact representation of any particular investment,as you cannot invest directly in an index.

Edward W. Aw, Head of Quantitative Strategies
Peter J. Langas, Director of Investment Strategies
Gregory M. Lester,Portfolio Manager, GlobalOpportunities Fund
Daphne L. Richards, Director of Hedge FundInvestments
Marc D. Stern,Chief Investment Officer and PortfolioManager, Large Cap Core
Markets have been moving up and down with greaterferocity. Five Bessemer investment professionals explainwhat higher volatility means for investors and howBessemer has positioned its portfolios to control thelevel of fluctuations that clients experience.
Q: Are big price swings actually happening more frequently — or does it just feel that way?
Langas: Yes, sharp changes in prices are more common than they used to be. Of the stock market’spast 1,000 months dating back to 1928, only sixwere more volatile than August. Stock prices rose or fell 2% or more in a single day 10 times inAugust and 8 times in September — compared tothe long-term average of 1.4 days per month.Intraday price swings have also become moreerratic. For instance, on October 4, the S&P 500fell 2.2% over the first five and a half hours of trading — only to surge more than 4% in the finalhour to finish up 2.3%. Wild market movementssuch as these have caused widespread anxiety andevoked memories of the gut-churning instabilityduring the financial crisis in 2008.
Q: What’s behind the volatility?
Stern: Fear of the unknown — particularly all thepolitical and economic uncertainty that we discussin our quarterly letter (see page 1) — is certainlycontributing to more skittishness among investors.Resolution of the issues will take time, suggestingvolatility is likely to remain high in the near future.
More broadly, though, markets today move fasterthan ever before because the global economy operatesat a swifter pace. Advances in technology allow usto communicate, access information, and trademore quickly and cheaply. In 1973-74, U.S. stocksfell 45% in 21 months and then took 64 months toregain the lost ground. The 2008 financial crisisushered in another 45% drop — this time in just 7months, and 22 months later we were back to pre-collapse levels. Same pattern, but three times faster.
Both the turbulence of 2008 and the last bout ofvolatility have reminded investors that unusuallylarge fluctuations in stock prices can and do happen.
Q: How much volatility is “normal”?
Langas: Since 1926, the S&P 500 Index has deliveredan average annual return of roughly 12% and had avolatility of 20%. Volatility is defined by standarddeviation, which indicates how far returns deviatefrom the average (Exhibit 6). The index’s 20%volatility figure means that you could expect theindex’s annual returns to fall somewhere between an8% loss and a 32% gain approximately two-thirdsof the time — or 20 percentage points higher orlower than the average.
Exhibit 6: Distribution of Annual S&P 500 ReturnsJanuary 1926-September 2011
As of September 30, 2011.Source: FactSet
8 Bessemer Trust Quarterly Investment Perspective
The Investment Roundtable: Controlling Volatility
0
5
15
10
20
25
<(36)% (36)-(24)% (24)-(12)% 0-12% 12-24% 24-36% 36-48% 48-60% >60%
Freq
uenc
y
One StandardDeviation: (8)%
One StandardDeviation: +32%
Average: 12%
However, this means that one-third of the time,returns will fall outside this range. Recent historyhas exposed the fact that a surprising number ofevents occur at both extremes. The so-called “fattails” on the curve — breathtaking price spikes ordevastating plunges — are not quite as uncommonas many investors had previously expected.
Q: Should investors be concerned about volatility?
Langas: Yes. Volatility matters because it can erodewealth over time.
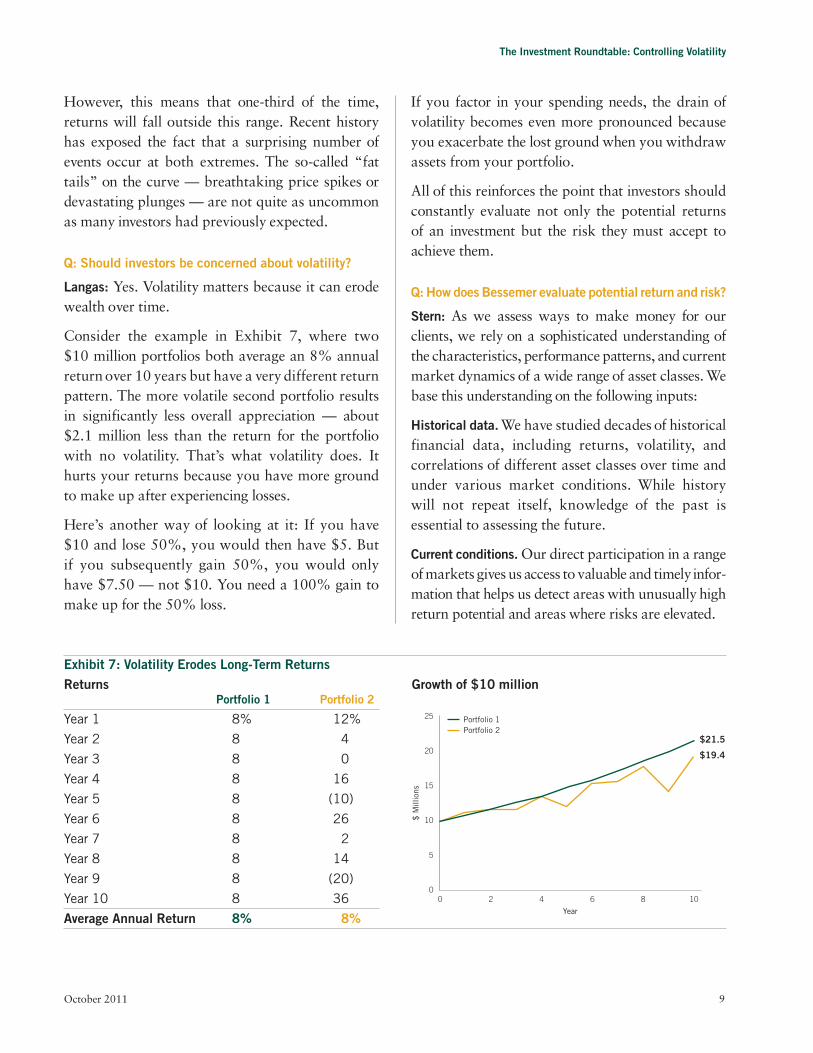
Consider the example in Exhibit 7, where two $10 million portfolios both average an 8% annualreturn over 10 years but have a very different returnpattern. The more volatile second portfolio resultsin significantly less overall appreciation — about$2.1 million less than the return for the portfoliowith no volatility. That’s what volatility does. Ithurts your returns because you have more groundto make up after experiencing losses.
Here’s another way of looking at it: If you have $10 and lose 50%, you would then have $5. But if you subsequently gain 50%, you would onlyhave $7.50 — not $10. You need a 100% gain tomake up for the 50% loss.
If you factor in your spending needs, the drain ofvolatility becomes even more pronounced becauseyou exacerbate the lost ground when you withdrawassets from your portfolio.
All of this reinforces the point that investors shouldconstantly evaluate not only the potential returns of an investment but the risk they must accept toachieve them.
Q: How does Bessemer evaluate potential return and risk?
Stern: As we assess ways to make money for ourclients, we rely on a sophisticated understanding ofthe characteristics, performance patterns, and currentmarket dynamics of a wide range of asset classes. Webase this understanding on the following inputs:
Historical data.We have studied decades of historicalfinancial data, including returns, volatility, andcorrelations of different asset classes over time andunder various market conditions. While historywill not repeat itself, knowledge of the past isessential to assessing the future.
Current conditions.Our direct participation in a rangeof markets gives us access to valuable and timely infor-mation that helps us detect areas with unusually highreturn potential and areas where risks are elevated.
The Investment Roundtable: Controlling Volatility
October 2011 9
Exhibit 7: Volatility Erodes Long-Term ReturnsReturns Growth of $10 million
Portfolio 1 Portfolio 2
Year 1 8% 12%
Year 2 8 4
Year 3 8 0
Year 4 8 16
Year 5 8 (10)
Year 6 8 26
Year 7 8 2
Year 8 8 14
Year 9 8 (20)
Year 10 8 36
Average Annual Return 8% 8%
0
5
15
10
20
25
0 102 4 6 8
$ M
illio
ns
Year
Portfolio 1Portfolio 2
$21.5
$19.4

Langas: Drawing on this knowledge, we look toachieve strong returns at a controlled level of risk intwo key ways:
Proactive asset allocation. We select asset classesthat complement each other in that they performdifferently under similar market conditions. That’swhy we combine stocks, which have high long-termreturn potential but can be very volatile, with bonds,which tend to do relatively well when equity marketsare doing poorly.
We diversify within asset classes, too. For example,our global mix of equities represents a range ofmarket capitalizations, because large, mid, andsmall cap stocks have shown different patterns ofperformance historically. For example, in 1998,large cap stocks outperformed small and mid capstocks by almost 30 percentage points. But fiveyears later, the roles reversed, with small and midcap stocks outpacing large cap 45% to 28%.
Commodities, which tend to do well during inflation-ary periods, provide additional diversification. So dohedge funds, which tend to deliver a performancepattern unlike those of stocks or bonds (althoughthey are not appropriate for all investors).
Based on our research, we have determined anappropriate range for how much to allocate to eachasset class, and we proactively shift actual weightingsbased on current market conditions. Moreover, wecan customize each client’s portfolio based on his orher return objective and risk tolerance.
Strategy shifts within portfolios. Active portfoliomanagement allows us to take action within indi-vidual portfolios to enhance return potential andprotect against losses. For example, our equitymanagers will tilt the portfolio holdings towarddefensive stocks — such as utility and consumerstaples companies — when the economic outlookdims. At times of extreme market stress, we mayalso decide to raise portfolio cash levels. Withinmulti-asset-class portfolios, such as GlobalOpportunities, the team can shift the allocation
toward more protective strategies. Once our researchsuggests the outlook has brightened, all of the teamscan reposition the portfolios more aggressively.
We firmly believe an actively managed and diversifiedportfolio is the best way to achieve superior long-termreturns at a controlled level of risk.
Q: But hasn’t diversification failed in the recent downturns?
Langas: It hasn’t lived up to many investors’ expec-tations, but diversification hasn’t failed.
In a crisis, fearful investors will flee all riskier asset classes. This was the case in the 2008 financialcrisis, which led to losses across portfolios and pronouncements that diversification was dead.
However, diversification did work for anyone whoowned U.S. Treasury bonds, which rose in valuewhile everything else fell. Diversification does notguarantee positive returns, but holding high-qualitybonds can buffer losses in a hostile equity marketenvironment.
With bonds as the core diversifier to stocks, wethen diversify among the “risk assets” — like owningnon-U.S. stocks or high-yield bonds. Over time, theseasset classes don’t tend to perform exactly the sameway, but that’s not to say they perform in oppositeways. Moreover, they may all go down in times ofpanic — but to different degrees. In 2008, everycountry took a hit, but Japan dropped 29% com-pared to a 72% plunge for Ireland. Stocks of utilityand consumer staples companies fell significantly lessthan stocks of materials and energy companies, whilehigh-yield bonds lost considerably less than stocks.
Owning a combination of various asset classes canprovide a more favorable risk/return relationshipthan any one asset class on its own. While the S&P500 Index fell 37% in 2008, the Global BalancedGrowth Index declined 26%.
Even though diversified investors may still sufferlosses, they tend to be in better shape once marketsrecover, having lost less during the fall.
The Investment Roundtable: Controlling Volatility
10 Bessemer Trust Quarterly Investment Perspective
Stern: In the more recent downturn, diversificationhasn’t provided as much protection as it had histor-ically because of indiscriminate selling across mostasset classes — a trend exacerbated by high-frequen-cy trading and highly leveraged ETFs. Nevertheless,our diversified portfolios fell less than the broadequity market in the third quarter, particularlybecause of our higher-than-usual allocations to defen-sive strategies, such as cash and credit investments.
Q: Why are credit investments considered defensive?
Lester: Because they typically offer investors moreprotection than stocks during downturns. Whilecredit investments like high-yield bonds and con-vertible bonds aren’t likely to outperform stockswhen equity markets are skyrocketing, they can offerattractive returns while limiting investors’ downside.However, not all credit investments are created equal;the likelihood of a company making all of its bondpayments ultimately depends on the firm’s underlyinghealth. That’s why researching a company’s balancesheet, cash flow, and management is so important.
One such example is GenCorp, a California-basedcompany that produces equipment for aerospacemanufacturers, which has generated strong free cashflow in the last 12 months and has low debt levelsrelative to cash. The company’s convertible bond — asecurity that pays a coupon while giving bondholdersthe option to convert the bond into the company’sstock — offers strong potential upside with somedownside protection. Based on the bond’s current
price of $85 and its 4% coupon, if GenCorp stockwere to rise 25% over the next year, the total returnon the bond would be approximately 16%. But ifthe stock were to fall 25% over the same period, thetotal loss would be only about 3%. This is becausethe bond has a special provision allowing the holderto sell it back to the company at par ($100) in 2014.
These types of credit investments are held in theGlobal Opportunities Fund, which is designed togenerate strong absolute returns and outperform aglobal equity benchmark with low relative volatility.
Q: Are there any other strategies in Global Opportunitiesthat can offer downside protection?
Lester: Yes. The Fund has invested in several equityand equity-related holdings that have compellingrisk/return profiles because of temporary marketaberrations or dislocations.
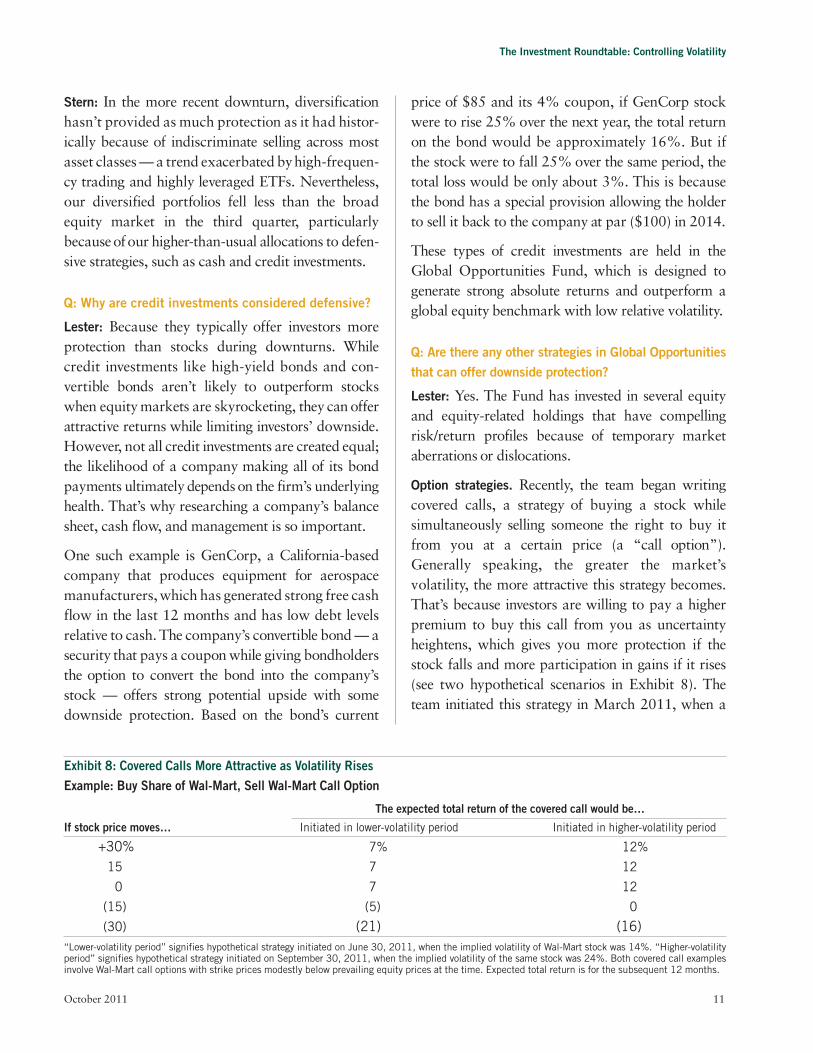
Option strategies. Recently, the team began writingcovered calls, a strategy of buying a stock whilesimultaneously selling someone the right to buy itfrom you at a certain price (a “call option”).Generally speaking, the greater the market’svolatility, the more attractive this strategy becomes.That’s because investors are willing to pay a higherpremium to buy this call from you as uncertaintyheightens, which gives you more protection if thestock falls and more participation in gains if it rises(see two hypothetical scenarios in Exhibit 8). Theteam initiated this strategy in March 2011, when a
The Investment Roundtable: Controlling Volatility
October 2011 11
Exhibit 8: Covered Calls More Attractive as Volatility RisesExample: Buy Share of Wal-Mart, Sell Wal-Mart Call Option
The expected total return of the covered call would be…
If stock price moves… Initiated in lower-volatility period Initiated in higher-volatility period
+30% 7% 12%
15 7 12
0 7 12
(15) (5) 0
(30) (21) (16)“Lower-volatility period” signifies hypothetical strategy initiated on June 30, 2011, when the implied volatility of Wal-Mart stock was 14%. “Higher-volatilityperiod” signifies hypothetical strategy initiated on September 30, 2011, when the implied volatility of the same stock was 24%. Both covered call examplesinvolve Wal-Mart call options with strike prices modestly below prevailing equity prices at the time. Expected total return is for the subsequent 12 months.

market downturn drove premiums to unusual highs.The Fund added to these positions significantly in thelate summer and early fall of 2011 when volatilityspiked further.
Another options strategy in Global Opportunities,called risk reversals, lets you participate fully in a stock’s gains while positioning you to break evenif the stock’s price declines to a certain point.Current pricing allows investors to assume lessdownside risk than normal — without foregoingpotential gains.
All-equity portfolio targeting low volatility. A smallportion of Global Opportunities has recently beeninvested in a proprietary equity portfolio that looksto achieve superior returns by limiting volatility.
Q: How can you limit the volatility of an all-equity portfolio without compromising returns?
Aw: Through sophisticated analytics and soundjudgment. Building on the diversification principleslaid out by Nobel Prize winner Harry Markowitzin his 1952 seminal article on portfolio theory,recent academic research has shown that investorscan actually enhance their returns in some cases by taking on less volatility. They can accomplish thisby either 1) creating a portfolio of low-risk securitiesor by 2) selecting a number of high-convictionsecurities (independent of their volatility) and thenreweighting them in such a way that it reducesvolatility. We favor the latter approach because ourresearch has shown that high-conviction securitieshave a much higher probability of outperformingthe market.
Q: How does reweighting the stocks lower the overallportfolio’s volatility?
Aw: The weights reflect an “optimal” combination.The risk drivers of the stocks offset each other, atleast partially.
Research suggests that certain stock characteristicshave historically given us a good indication of how
volatile their returns are likely to be. These includethe following:
Sector. Some sectors are more prone to volatility thanothers. Technology companies, for instance, typicallysee greater price fluctuations than utility companies.
Size. Larger companies often aren’t as susceptibleto erratic stock movements as smaller firms, for avariety of reasons: their businesses are generallymore diversified and well established, their reach is more global, they have greater access to capital,and their investor base is larger.
Exposure to global interest rates. The trajectory ofsome businesses is closely tied to movements inglobal interest rates. If you pair a company that hashigh sensitivity to rate changes with one that haslow sensitivity, that makes the overall portfolio lessexposed to these unpredictable movements.
Exposure to currency.Companies whose earnings arestrongly influenced by the performance of certaincurrencies are generally more volatile than firmsthat have hedged their exposure.
Exposure to oil prices. Because energy prices canoscillate very erratically, companies with businessesthat are sensitive to oil price changes tend to have amore volatile earnings pattern than firms with lesssensitivity.
Other stock characteristics we consider includeregion, whether it’s in a developed or emergingmarket, and if it’s a value or growth stock. Advancesin technology allow us to analyze a company’sexposure to all of these factors and consider thecorrelations between them. These steps shouldallow us to determine how to weight each of thestocks we wish to hold so as to minimize the overallrisk. In simple terms, it amounts to pairing a tech-nology company we like that has a high exposure tocurrency with a utility company we like with a lowexposure to currency. Weighting the two so that theirexposures to certain factors are offset can bring theportfolio’s volatility lower than it would be otherwise.
The Investment Roundtable: Controlling Volatility
12 Bessemer Trust Quarterly Investment Perspective

Q: Does actual real-life market performance bear this out?
Aw: Yes. In 2001, the makers of the 1,600-stockMSCI World Index launched an index that contained a subset of stocks from the main index,but reweighted them to minimize volatility. Fromits inception, the MSCI World Minimum VolatilityIndex has outperformed the MSCI World Index by 3.2 percentage points annually. At Bessemer, we back-tested this approach to see how it wouldhave performed with a portfolio of only high-conviction stocks (those based on our proprietarystock selection model) instead of all the stocks inthe MSCI Index. We found that this strategy wouldhave outperformed the MSCI World MinimumVolatility Index meaningfully.
Q: Do we use this approach elsewhere?
Stern: Yes, we will draw on this approach in thenew Large Cap Core portfolio. We will launch LargeCap Core in late November when we move awayfrom defining our large cap portfolios based ongeography (i.e., U.S. and non-U.S.). We havedesigned Large Cap Core with a specific objective inmind: The portfolio will seek to deliver superiorreturns over full market cycles with less volatilitythan the broad equity market.
The investment process will include both funda-mental research and quantitative analytics (Exhibit9). We have nearly 1,000 potential securities tochoose from, and we will identify those companiesdemonstrating a set of characteristics we believe aredesirable. For example, we want attractive valuationsin relation to earnings, dividends, and asset value.Not every dollar of earnings is the same, and wewant to emphasize companies with high-qualityreported earnings. Moreover, companies havemany ways to spend their money, and we favorthose with disciplined capital deployment strategies.Furthermore, we want to own companies whosebalance sheets support a sustainable enterprise. Andfinally, we believe there is information to be gleanedfrom recent stock price behavior, which can help us time our purchases and sales.
Having narrowed our focus, we will then utilize first-hand research to assess a company’s fundamentals,including its competitive position, managementcapabilities, and earnings power. The researchteam’s underlying focus will be on determiningwhat the consensus is missing about the companyand what catalysts exist to enable realization offundamental value over time.
The Investment Roundtable: Controlling Volatility
October 2011 13
Identify companies demonstrating desirable characteristics:• Attractive valuations• High earnings quality• Disciplined capital deployment• Low balance sheet risk• Positive technical indicators
Select stocks using firsthand research:• Evaluate competitive position, management capabilities, and earnings power
• Analyze factors driving potential mispricing
• Identify catalysts for realization offundamental value
Determine security weights:• Emphasize holdings with most attractive risk/return profile– 60 stocks– 0.75%-2.50% weights
• Sell positions if potential value isachieved, fundamentals deteriorate,or catalysts do not materialize
• Build portfolio designed to outperformover time with limited volatility indifficult market periods
Exhibit 9: Investment Process for Large Cap Core
Global Stock Screening Fundamental�Research Portfolio�Construction

Once we have selected about 60 stocks from aroundthe world, we will use our quantitative tools in conjunction with our best judgment to weight theholdings in a way designed to achieve lower volatilitythan the broader equity market, a helpful attributein weaker market periods.
Q: What can we expect for Large Cap Core returns?
Stern: Over time, we believe this approach can out-perform the S&P Global LargeCap Index — whileproviding additional protection in times like todaywhen volatility is so substantial.
To be sure, the portfolio will not outperform everymonth, every quarter, or even every year. In particular,Large Cap Core may lag in periods when equitymarkets are temporarily surging. However, by seek-ing to lose less during market downturns, we believeLarge Cap Core will be in a better position to outpacethe broader equity market over full market cycles.
We will pair Large Cap Core with Large CapStrategies.
Q: Will Large Cap Strategies also look to control volatility?
Stern: No, Strategies will not feature explicitvolatility controls. Therefore, it will not likely protectas much as Core on the downside, but it should morefully participate in up market periods. That’s whythese portfolios are coupled within Bessemer’s overallrecommended allocation to large cap equities.
Q: Will Large Cap Strategies be volatile, then?
Stern: Only as volatile as equities in general. Weexpect the fund’s volatility to be similar to that of the S&P Global LargeCap Index. One of theways the fund will look to enhance the consistencyof its returns is through the combination of threemanagers with starkly different investmentapproaches. The Bessemer team will focus on companies that are currently operating below their normalized earnings — taking into accountmultiyear operating cycles — but are improving.
Meanwhile, London-based Oldfield Partners will focus on companies selling at significantly discounted valuations, and Virginia-based SandsCapital Management will focus on companies with superior prospects for rapid growth.
All three have favorable long-term track records,and, even more importantly, they tend to outperformthe equity benchmark at different times. Considerthe performance of the two extremes, Oldfield and Sands. In each of the last 15 years, at least onefirm outperformed. Combining managers whoserelative returns differ substantially should delivermore consistent returns than those achieved by anyone manager alone.
Q: Hedge funds came up earlier — aren’t they known forgenerating either exceptionally good and bad returnsrather than consistent returns?
Langas:Yes, hedge funds tend to get a lot of attentionwhen some of them achieve outsized gains or losses.But in general, hedge fund returns have actuallybeen less volatile than those of the broader equitymarkets. In fact, we believe hedge funds can play arole in dampening overall portfolio volatility.
Richards: Hedge fund returns are usually lessvolatile than those of stocks or bonds, so theirbiggest advantage is that they offer diversification andvolatility-reducing benefits to a balanced portfolio.
However, in periods of severe market stress — asin 2008 and 2011 — hedge funds become morevolatile and more likely to move in the same directionas the broader markets. In the most recent quarter,we saw hedge funds fall about in line with the S&P500 Index, making it the fourth worst quarter forthe asset class in the last 15 years.
Langas: Investors who made the mistake of replacingtheir high-quality bond allocation with hedge fundslearned the hard way that the asset class behaves likeother riskier investments in hostile markets. In suchenvironments, bonds and cash are the only assetclasses likely to protect and possibly appreciate.
The Investment Roundtable: Controlling Volatility
14 Bessemer Trust Quarterly Investment Perspective

Richards: One of the advantages that hedge fundmanagers have is enormous flexibility. When marketsbecome erratic, they can quickly move into cash asa temporary safe harbor. Moreover, skilled managerswill look to use volatility to their advantage byinvesting in assets that become attractively pricedthanks to market pressure.
Q: Are some hedge fund strategies more volatile thanothers?
Richards: Yes. The following are some broad examples:
Relative value. This refers to funds whose strategiesare designed to produce returns independently of thebroader market, such as market neutral, convertiblearbitrage, and fixed income arbitrage. For instance,equity “market neutral” funds may buy one type ofsecurity (such as Wal-Mart stock) and short a simi-lar one (such as Target), believing that the marketwill reward the stock price of the stronger companyand depress the stock of the weaker company. Arelative value manager seeks to outperform fromboth its long and short positions, and the fullyhedged approach tends to generate a less volatilereturn stream than the broader markets.
Event-driven.Managers with these strategies positiontheir portfolios to benefit from significant corporateevents, such as hostile takeovers, mergers, andbankruptcies. Some seek to invest in distressedcompanies selling for far less than their intrinsicvalues. Event-driven strategies tend to have low to moderate exposure to the broader markets,positioning them toward the middle of the risk/return spectrum.
Opportunistic. These strategies often involve takingon greater exposure to the market, potentiallyleading to higher — but more volatile — returns.One example may be an emerging-market fund,whose approach to investing is more long-biasedbecause it faces greater difficulty in executing ashort strategy. Other examples include long/short
equity funds, short sellers, macro funds, and sector-specific funds.
Q: Within Bessemer’s hedge fund program, how do welook to control volatility?
Richards: We combine hedge fund managers withdiverse and complementary strategies. Exposure to arange of geographies and sectors gives us additionaldiversification benefits.
Moreover, we do not rely on leverage to drive portfolio returns; instead, we rely on manager skill. The heavy use of borrowed funds can magnifylosses when the market moves against a strategy.Bessemer’s funds of funds are not levered, and we maintain only modest exposure to leveragedstrategies within the overall portfolios.
We’re convinced that a well-diversified hedge fundprogram — one that emphasizes the selection ofskilled and reputable managers through extensiveresearch — can deliver solid risk-adjusted returnsover full market cycles and help to reduce thevolatility of an overall portfolio.
Q: So what’s the most important takeaway for investorswhen it comes to harnessing volatility?
Langas: The two best means for guarding againstvolatility are diversification and proactive investing.Constructing a portfolio of diverse asset classes —from bonds to stocks to commodities — allowsinvestors to generate more consistent returns. Bondsin particular offer significant ballast to a diversifiedportfolio when market stresses become extreme.But diversification alone isn’t enough; in changingmarkets, it’s important to have a proactive approachbecause it gives investors the flexibility to shift assetclass weightings and investment strategies as newdevelopments unfold.
Finding the proper balance between risk and returnultimately comes down to an investor’s individualobjectives and the amount of risk he or she is willing
The Investment Roundtable: Controlling Volatility
October 2011 15

Atlanta • Boston • Chicago • Dallas • Denver • Los Angeles • Miami • NaplesNew York • Palm Beach • San Francisco • Washington, D.C. • Wilmington • Woodbridge
Cayman Islands • New Zealand • United KingdomVisit us at www.bessemer.com.
Copyright © Bessemer Trust Company, N.A. All rights reserved.
Past performance is no guarantee of future results. This material is provided for your general information. It does not take into account the particularinvestment objectives, financial situation, or needs of individual clients. This material has been prepared based on information that Bessemer Trust believesto be reliable, but Bessemer makes no representation or warranty with respect to the accuracy or completeness of such information. This presentation doesnot include a complete description of any fund or portfolio mentioned herein. Investors should consider the investment objectives, risks, charges, andexpenses of each fund or portfolio before investing. Views expressed herein are current only as of the date indicated, and are subject to change withoutnotice. Forecasts may not be realized due to a variety of factors, including changes in economic growth, corporate profitability, geopolitical conditions, andinflation. The mention of a particular security is not intended to represent a stock-specific or other investment recommendation, and our view of theseholdings may change at any time based on stock price movements, new research conclusions, or changes in risk preference. Index information is includedherein to show the general trend in the securities markets during the periods indicated and is not intended to imply that any referenced portfolio is similarto the indices in either composition or volatility.
to take to achieve them. Periods of heightenedvolatility can be unsettling, but it is important notto let emotions overtake the decision-makingprocess. Sticking to a thoughtful long-term planand disciplined investment approach is essential.
Though disruptive in the short term, volatility can be good for long-term investors. By reflectingfluctuations between investor greed and fear,volatility can open up substantial investmentopportunities — such as owning attractive assets at discounted prices — that wouldn’t be availableotherwise.
So our goal is to harness volatility by limiting thedownside clients experience and taking advantageof the opportunities created in turbulent times.
The Investment Roundtable: Controlling Volatility