Quarterly financial statistics (QFS) - Statistics South … South Africa P0044 Quarterly financial...
40
Statistical release P0044 Quarterly financial statistics (QFS) December 2015 Embargoed until: 31 March 2016 08:00 Enquiries: Forthcoming issue: Expected release date Krisseelan Govinden March 2016 June 2016 Tel: +27(12) 310 4651
Transcript of Quarterly financial statistics (QFS) - Statistics South … South Africa P0044 Quarterly financial...
Statistical release P0044
Quarterly financial statistics (QFS)
December 2015
Embargoed until:31 March 2016
08:00 Enquiries: Forthcoming issue: Expected release date
Krisseelan Govinden March 2016 June 2016 Tel: +27(12) 310 4651
Statistics South Africa P0044
Quarterly financial statistics, December 2015
1
Contents
Key findings for the quarter ended December 2015 ..................................................................................................... 2
Figure 1 – Percentage contribution to total turnover by industry in the quarters ended September 2015 and
December 2015 ................................................................................................................................................ 3
Figure 2 – Comparison of turnover by industry in the quarters ended September 2015 and December 2015 ................. 4
Figure 3 – Comparison of turnover by industry in the quarters ended December 2014 and December 2015 .................. 5
Figure 4 – Quarterly turnover of all industries covered by the quarterly financial statistics (QFS) survey
from March 2007 to December 2015 ............................................................................................................... 6
Table 1 – Selected income and expenditure items: All industries covered by the quarterly financial statistics (QFS)
survey ................................................................................................................................................................ 7
Table 2 – Selected income and expenditure items: Mining and quarrying industry ......................................................... 9
Table 3 – Selected income and expenditure items: Manufacturing industry .................................................................. 11
Table 4 – Selected income and expenditure items: Electricity, gas and water supply industry ..................................... 13
Table 5 – Selected income and expenditure items: Construction industry ...................................................................... 15
Table 6 – Selected income and expenditure items: Trade industry ................................................................................ 17
Table 7 – Selected income and expenditure items: Transport, storage and communication industry ........................... 19
Table 8 – Selected income and expenditure items: Real estate and other business services industry
(excluding financial intermediation and insurance) ......................................................................................... 21
Table 9 – Selected income and expenditure items: Community, social and personal services industry (excluding
government institutions) ................................................................................................................................... 23
Table 10 – Comparison of selected operating ratios between September 2015 and December 2015 ........................... 25
Technical notes .............................................................................................................................................................. 27
Table A – Estimates of turnover by industry within 95% confidence limits: September 2015 ......................................... 27
Table B – Estimates of turnover by industry within 95% confidence limits: December 2015 .......................................... 27
Table C – Turnover by industry and percentage change................................................................................................. 28
Table D – Turnover by industry and percentage contribution .......................................................................................... 28
Table E – Closing inventories by industry and percentage change ................................................................................. 29
Table F – Capital expenditure by industry and percentage change ................................................................................ 29
Table G – DTI cut-off points (adjusted by Statistics South Africa (Stats SA) for QFS) ................................................... 30
Explanatory notes .......................................................................................................................................................... 31
Glossary….. ……………… .............................................................................................................................................. 36
General information ....................................................................................................................................................... 39
Statistics South Africa P0044
Quarterly financial statistics, December 2015
2
Key findings for the quarter ended December 2015
The total turnover of quarterly financial statistics (QFS) industries1 in the fourth quarter of
2015 was estimated at R2 100 620 million (R2,10 trillion), an increase of 0,6% compared with
the third quarter of 2015 (R2 087 851 million or R2,09 trillion).
Between the third and fourth quarters of 2015 turnover increased in five of the eight industries
covered by the survey. The largest percentage increase in turnover was recorded for transport,
storage and communication (+3,0%), followed by mining and quarrying (+2,5%), real estate and
other business services (excluding financial intermediation and insurance) (+1,9%), trade (+1,3%)
and manufacturing (+0,7%). Decreases were recorded in electricity, gas and water supply (-18,8%),
community, social and personal services (excluding government institutions) (-2,9%) and
construction (-1,0%).
Total closing inventories at the end of the fourth quarter of 2015 were estimated at R780 009 million,
an increase of 0,7% compared with R774 785 million at the end of the third quarter of 2015.
Increases were recorded in transport, storage and communication (+10,0%), trade (+5,2%),
electricity, gas and water supply (+4,3%), construction (+2,9%), real estate and other business
services (excluding financial intermediation and insurance) (+2,8%), community, social and personal
services (excluding government institutions) (+2,2%) and mining and quarrying (+0,9%). A decrease
was recorded for manufacturing (-4,3%).
Total capital expenditure on property, plant and equipment was estimated at R96 800 million in the
fourth quarter of 2015, an increase of 6,7% compared with R90 725 million in the third quarter of
2015. The largest percentage increase was recorded for trade (+41,7%), followed by manufacturing
(+36,0%) and real estate and other business services (excluding financial intermediation and
insurance) (+29,1%). Decreases were recorded in electricity, gas and water supply (-16,2%),
community, social and personal services (excluding government institutions) (-12,8%), construction
(-11,9%), mining and quarrying (-2,8%) and transport, storage and communication (-2,3%).
Turnover was estimated at R2 100 620 million in the fourth quarter of 2015, an increase of 2,1%
compared with R2 057 217 million in the fourth quarter of 2014. The largest increase in turnover
was recorded for electricity, gas and water supply (+15,1%), followed by construction (+12,2%),
manufacturing (+5,1%), transport, storage and communication (+2,7%), real estate and other
business services (excluding financial intermediation and insurance) (+2,6%) and mining and
quarrying (+2,1%). Decreases were recorded for community, social and personal services
(excluding government institutions) (-16,8%) and trade (-1,3%).
1All industries in the South African economy, excluding agriculture, financial intermediation, insurance and government
institutions.
PJ Lehohla Statistician-General
Statistics South Africa 3 P0044
Quarterly financial statistics, December 2015
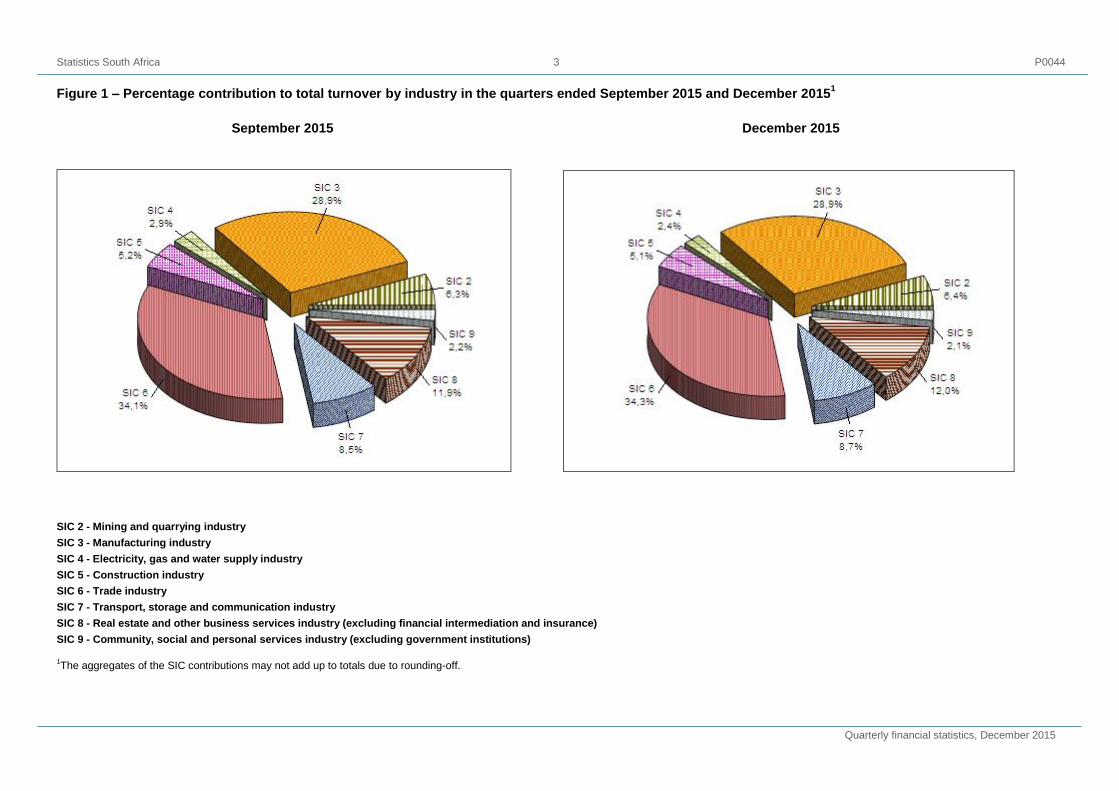
Figure 1 – Percentage contribution to total turnover by industry in the quarters ended September 2015 and December 20151
SIC 2 - Mining and quarrying industry
SIC 3 - Manufacturing industry
SIC 4 - Electricity, gas and water supply industry
SIC 5 - Construction industry
SIC 6 - Trade industry
SIC 7 - Transport, storage and communication industry
SIC 8 - Real estate and other business services industry (excluding financial intermediation and insurance)
SIC 9 - Community, social and personal services industry (excluding government institutions)
1The aggregates of the SIC contributions may not add up to totals due to rounding-off.
September 2015 December 2015
Statistics South Africa 4 P0044
Quarterly financial statistics, December 2015
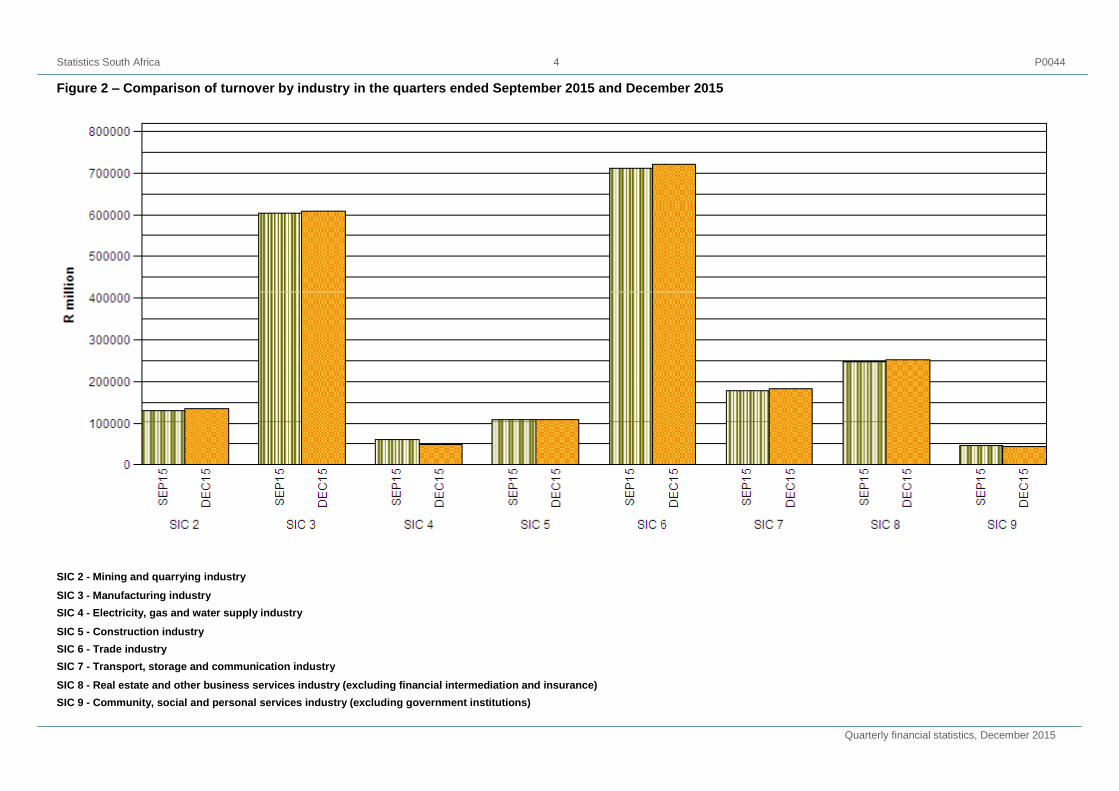
Figure 2 – Comparison of turnover by industry in the quarters ended September 2015 and December 2015
SIC 2 - Mining and quarrying industry
SIC 3 - Manufacturing industry
SIC 4 - Electricity, gas and water supply industry
SIC 5 - Construction industry
SIC 6 - Trade industry
SIC 7 - Transport, storage and communication industry
SIC 8 - Real estate and other business services industry (excluding financial intermediation and insurance)
SIC 9 - Community, social and personal services industry (excluding government institutions)
Statistics South Africa 5 P0044
Quarterly financial statistics, December 2015
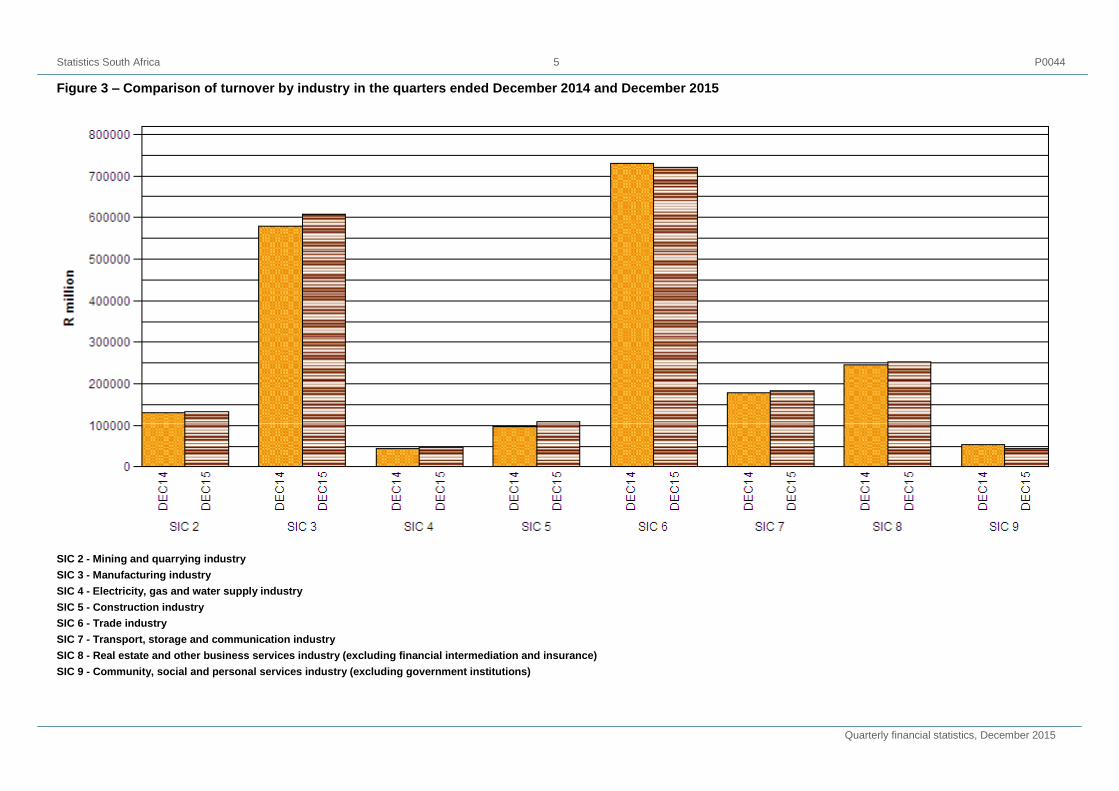
Figure 3 – Comparison of turnover by industry in the quarters ended December 2014 and December 2015
SIC 2 - Mining and quarrying industry
SIC 3 - Manufacturing industry
SIC 4 - Electricity, gas and water supply industry
SIC 5 - Construction industry
SIC 6 - Trade industry
SIC 7 - Transport, storage and communication industry
SIC 8 - Real estate and other business services industry (excluding financial intermediation and insurance)
SIC 9 - Community, social and personal services industry (excluding government institutions)
Statistics South Africa 6 P0044
Quarterly financial statistics, December 2015
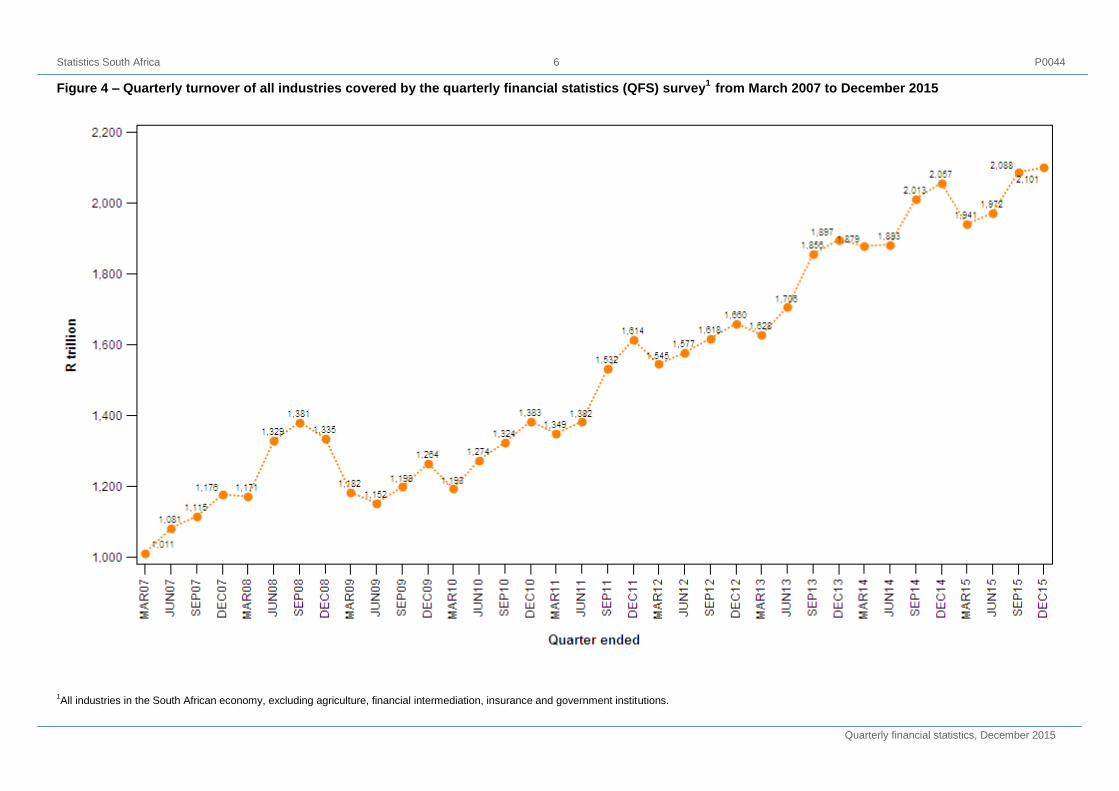
Figure 4 – Quarterly turnover of all industries covered by the quarterly financial statistics (QFS) survey1
from March 2007 to December 2015
1All industries in the South African economy, excluding agriculture, financial intermediation, insurance and government institutions.
Statistics South Africa 7 P0044
Quarterly financial statistics, December 2015
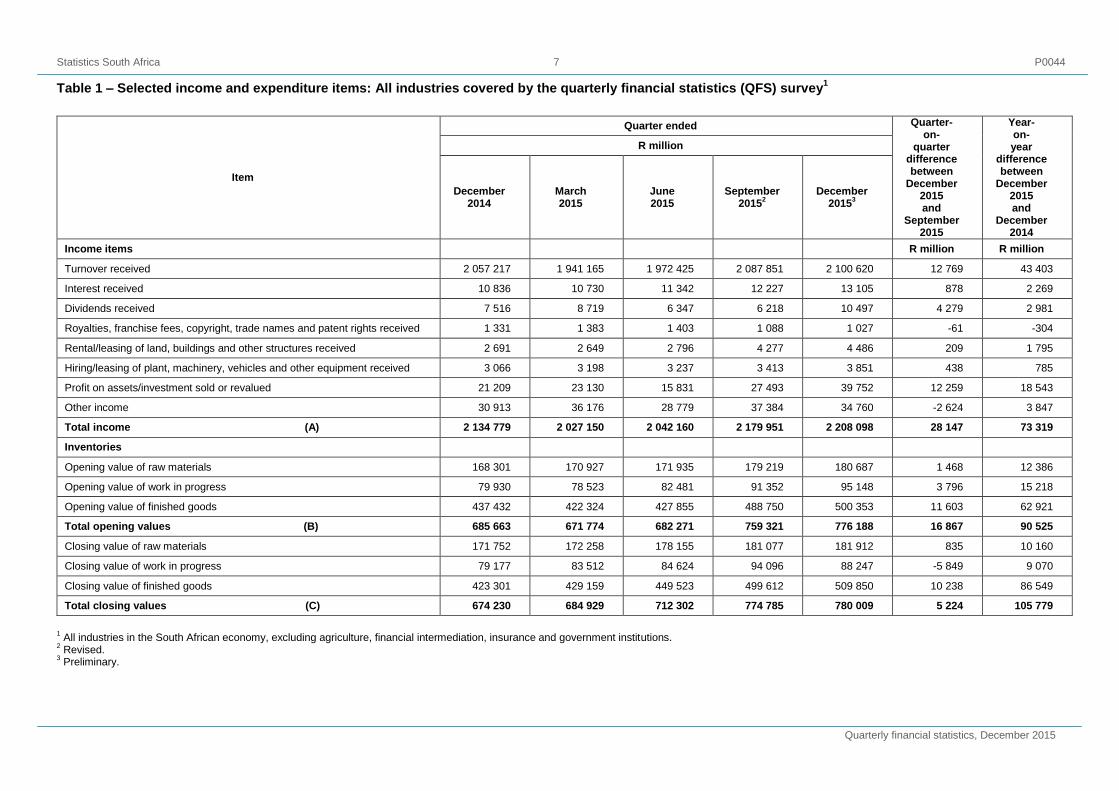
Table 1 – Selected income and expenditure items: All industries covered by the quarterly financial statistics (QFS) survey1
Item
Quarter ended Quarter- on-
quarter difference between
December 2015 and
September 2015
Year- on- year
difference between
December 2015 and
December 2014
R million
December 2014
March 2015
June 2015
September
20152
December 2015
3
Income items R million R million
Turnover received 2 057 217 1 941 165 1 972 425 2 087 851 2 100 620 12 769 43 403
Interest received 10 836 10 730 11 342 12 227 13 105 878 2 269
Dividends received 7 516 8 719 6 347 6 218 10 497 4 279 2 981
Royalties, franchise fees, copyright, trade names and patent rights received 1 331 1 383 1 403 1 088 1 027 -61 -304
Rental/leasing of land, buildings and other structures received 2 691 2 649 2 796 4 277 4 486 209 1 795
Hiring/leasing of plant, machinery, vehicles and other equipment received 3 066 3 198 3 237 3 413 3 851 438 785
Profit on assets/investment sold or revalued 21 209 23 130 15 831 27 493 39 752 12 259 18 543
Other income 30 913 36 176 28 779 37 384 34 760 -2 624 3 847
Total income (A) 2 134 779 2 027 150 2 042 160 2 179 951 2 208 098 28 147 73 319
Inventories
Opening value of raw materials 168 301 170 927 171 935 179 219 180 687 1 468 12 386
Opening value of work in progress 79 930 78 523 82 481 91 352 95 148 3 796 15 218
Opening value of finished goods 437 432 422 324 427 855 488 750 500 353 11 603 62 921
Total opening values (B) 685 663 671 774 682 271 759 321 776 188 16 867 90 525
Closing value of raw materials 171 752 172 258 178 155 181 077 181 912 835 10 160
Closing value of work in progress 79 177 83 512 84 624 94 096 88 247 -5 849 9 070
Closing value of finished goods 423 301 429 159 449 523 499 612 509 850 10 238 86 549
Total closing values (C) 674 230 684 929 712 302 774 785 780 009 5 224 105 779
1 All industries in the South African economy, excluding agriculture, financial intermediation, insurance and government institutions.
2 Revised.
3 Preliminary.
Statistics South Africa 8 P0044
Quarterly financial statistics, December 2015
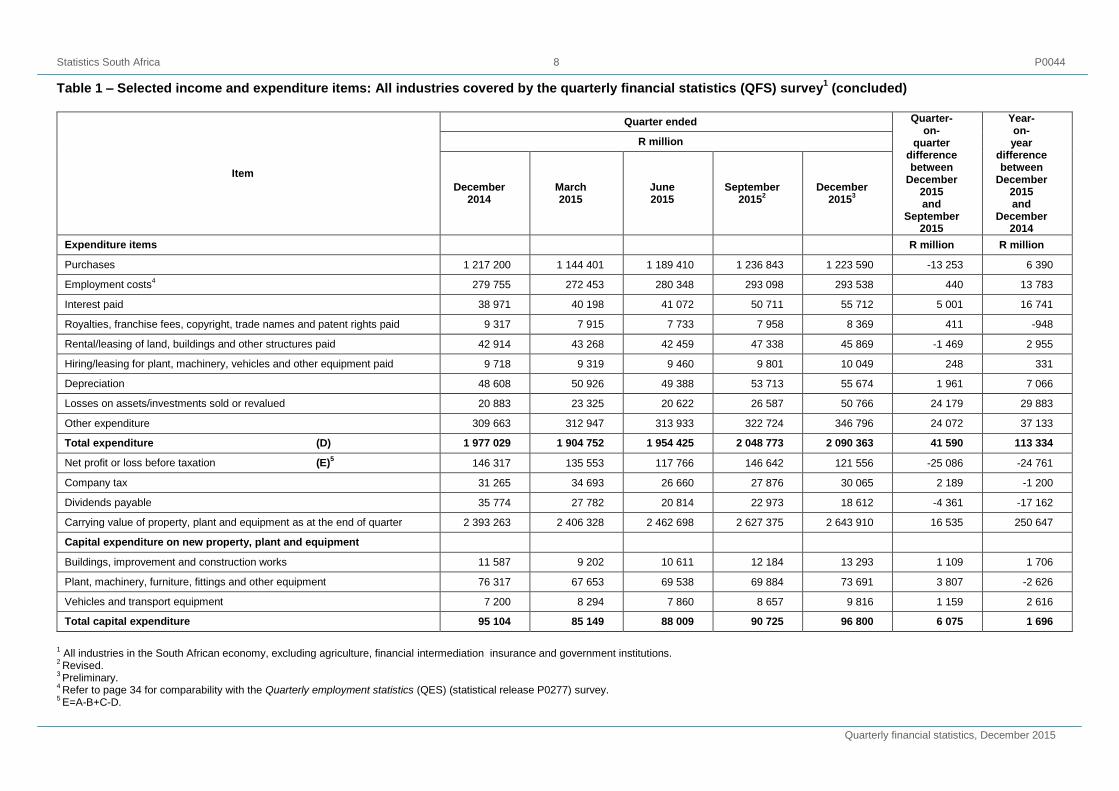
Table 1 – Selected income and expenditure items: All industries covered by the quarterly financial statistics (QFS) survey1 (concluded)
Item
Quarter ended Quarter- on-
quarter difference between
December 2015 and
September 2015
Year- on- year
difference between
December 2015 and
December 2014
R million
December 2014
March 2015
June 2015
September
20152
December 2015
3
Expenditure items R million R million
Purchases 1 217 200 1 144 401 1 189 410 1 236 843 1 223 590 -13 253 6 390
Employment costs4 279 755 272 453 280 348 293 098 293 538 440 13 783
Interest paid 38 971 40 198 41 072 50 711 55 712 5 001 16 741
Royalties, franchise fees, copyright, trade names and patent rights paid 9 317 7 915 7 733 7 958 8 369 411 -948
Rental/leasing of land, buildings and other structures paid 42 914 43 268 42 459 47 338 45 869 -1 469 2 955
Hiring/leasing for plant, machinery, vehicles and other equipment paid 9 718 9 319 9 460 9 801 10 049 248 331
Depreciation 48 608 50 926 49 388 53 713 55 674 1 961 7 066
Losses on assets/investments sold or revalued 20 883 23 325 20 622 26 587 50 766 24 179 29 883
Other expenditure 309 663 312 947 313 933 322 724 346 796 24 072 37 133
Total expenditure (D) 1 977 029 1 904 752 1 954 425 2 048 773 2 090 363 41 590 113 334
Net profit or loss before taxation (E)5 146 317 135 553 117 766 146 642 121 556 -25 086 -24 761
Company tax 31 265 34 693 26 660 27 876 30 065 2 189 -1 200
Dividends payable 35 774 27 782 20 814 22 973 18 612 -4 361 -17 162
Carrying value of property, plant and equipment as at the end of quarter 2 393 263 2 406 328 2 462 698 2 627 375 2 643 910 16 535 250 647
Capital expenditure on new property, plant and equipment
Buildings, improvement and construction works 11 587 9 202 10 611 12 184 13 293 1 109 1 706
Plant, machinery, furniture, fittings and other equipment 76 317 67 653 69 538 69 884 73 691 3 807 -2 626
Vehicles and transport equipment 7 200 8 294 7 860 8 657 9 816 1 159 2 616
Total capital expenditure 95 104 85 149 88 009 90 725 96 800 6 075 1 696
1 All industries in the South African economy, excluding agriculture, financial intermediation insurance and government institutions.
2 Revised.
3 Preliminary.
4 Refer to page 34 for comparability with the Quarterly employment statistics (QES) (statistical release P0277) survey.
5 E=A-B+C-D.
Statistics South Africa 9 P0044
Quarterly financial statistics, December 2015
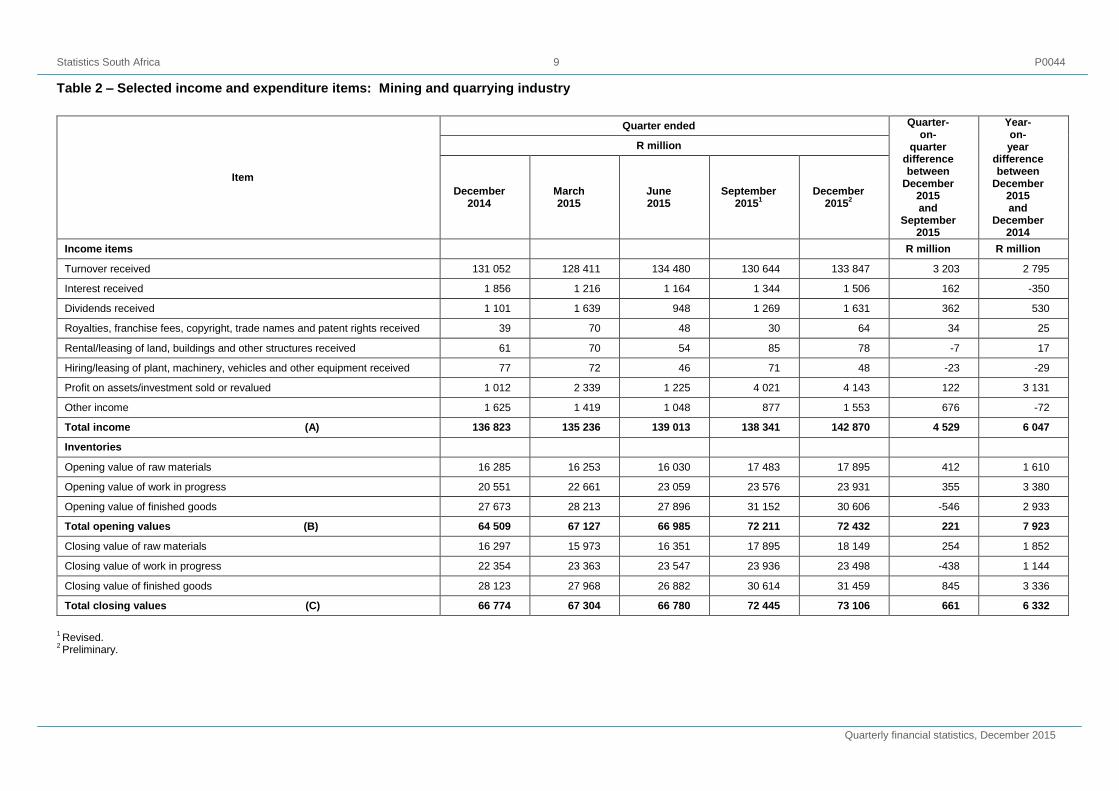
Table 2 – Selected income and expenditure items: Mining and quarrying industry
Item
Quarter ended Quarter- on-
quarter difference between
December 2015 and
September 2015
Year- on- year
difference between
December 2015 and
December 2014
R million
December 2014
March 2015
June 2015
September
20151
December 2015
2
Income items R million R million
Turnover received 131 052 128 411 134 480 130 644 133 847 3 203 2 795
Interest received 1 856 1 216 1 164 1 344 1 506 162 -350
Dividends received 1 101 1 639 948 1 269 1 631 362 530
Royalties, franchise fees, copyright, trade names and patent rights received 39 70 48 30 64 34 25
Rental/leasing of land, buildings and other structures received 61 70 54 85 78 -7 17
Hiring/leasing of plant, machinery, vehicles and other equipment received 77 72 46 71 48 -23 -29
Profit on assets/investment sold or revalued 1 012 2 339 1 225 4 021 4 143 122 3 131
Other income 1 625 1 419 1 048 877 1 553 676 -72
Total income (A) 136 823 135 236 139 013 138 341 142 870 4 529 6 047
Inventories
Opening value of raw materials 16 285 16 253 16 030 17 483 17 895 412 1 610
Opening value of work in progress 20 551 22 661 23 059 23 576 23 931 355 3 380
Opening value of finished goods 27 673 28 213 27 896 31 152 30 606 -546 2 933
Total opening values (B) 64 509 67 127 66 985 72 211 72 432 221 7 923
Closing value of raw materials 16 297 15 973 16 351 17 895 18 149 254 1 852
Closing value of work in progress 22 354 23 363 23 547 23 936 23 498 -438 1 144
Closing value of finished goods 28 123 27 968 26 882 30 614 31 459 845 3 336
Total closing values (C) 66 774 67 304 66 780 72 445 73 106 661 6 332
1 Revised.
2 Preliminary.
Statistics South Africa 10 P0044
Quarterly financial statistics, December 2015
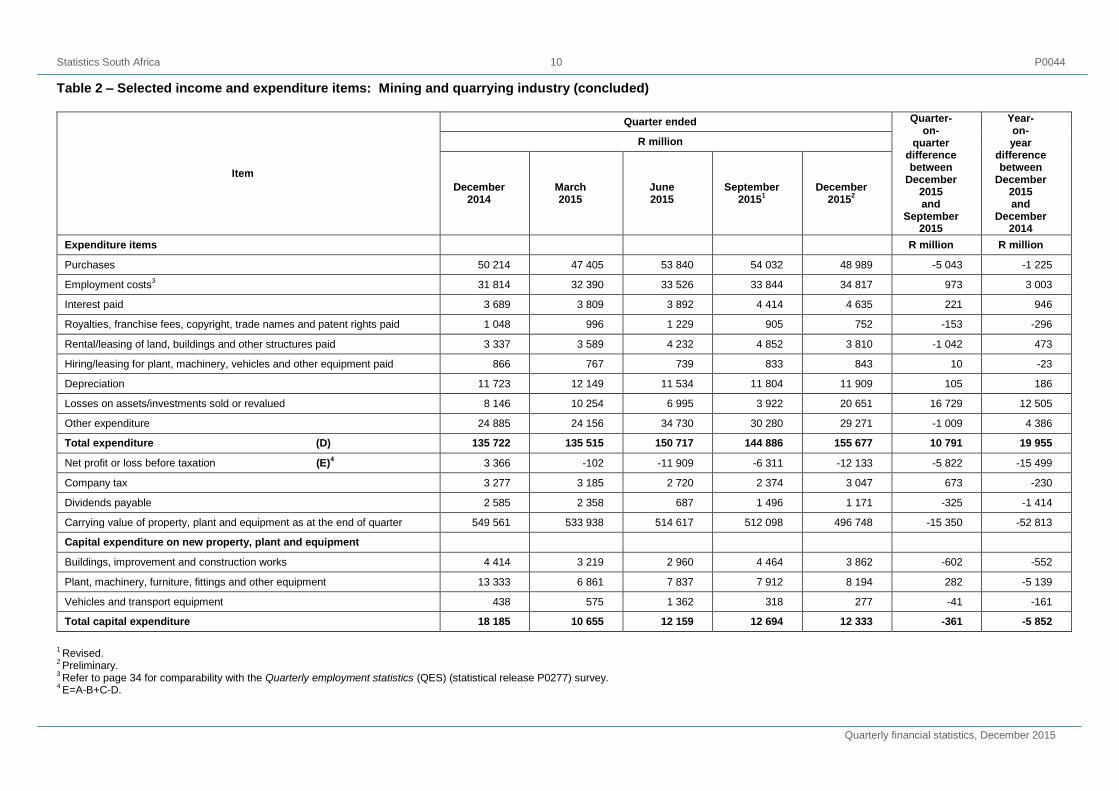
Table 2 – Selected income and expenditure items: Mining and quarrying industry (concluded)
Item
Quarter ended Quarter- on-
quarter difference between
December 2015 and
September 2015
Year- on- year
difference between
December 2015 and
December 2014
R million
December 2014
March 2015
June 2015
September
20151
December 2015
2
Expenditure items R million R million
Purchases 50 214 47 405 53 840 54 032 48 989 -5 043 -1 225
Employment costs3 31 814 32 390 33 526 33 844 34 817 973 3 003
Interest paid 3 689 3 809 3 892 4 414 4 635 221 946
Royalties, franchise fees, copyright, trade names and patent rights paid 1 048 996 1 229 905 752 -153 -296
Rental/leasing of land, buildings and other structures paid 3 337 3 589 4 232 4 852 3 810 -1 042 473
Hiring/leasing for plant, machinery, vehicles and other equipment paid 866 767 739 833 843 10 -23
Depreciation 11 723 12 149 11 534 11 804 11 909 105 186
Losses on assets/investments sold or revalued 8 146 10 254 6 995 3 922 20 651 16 729 12 505
Other expenditure 24 885 24 156 34 730 30 280 29 271 -1 009 4 386
Total expenditure (D) 135 722 135 515 150 717 144 886 155 677 10 791 19 955
Net profit or loss before taxation (E)4 3 366 -102 -11 909 -6 311 -12 133 -5 822 -15 499
Company tax 3 277 3 185 2 720 2 374 3 047 673 -230
Dividends payable 2 585 2 358 687 1 496 1 171 -325 -1 414
Carrying value of property, plant and equipment as at the end of quarter 549 561 533 938 514 617 512 098 496 748 -15 350 -52 813
Capital expenditure on new property, plant and equipment
Buildings, improvement and construction works 4 414 3 219 2 960 4 464 3 862 -602 -552
Plant, machinery, furniture, fittings and other equipment 13 333 6 861 7 837 7 912 8 194 282 -5 139
Vehicles and transport equipment 438 575 1 362 318 277 -41 -161
Total capital expenditure 18 185 10 655 12 159 12 694 12 333 -361 -5 852
1 Revised.
2 Preliminary.
3 Refer to page 34 for comparability with the Quarterly employment statistics (QES) (statistical release P0277) survey.
4 E=A-B+C-D.
Statistics South Africa 11 P0044
Quarterly financial statistics, December 2015
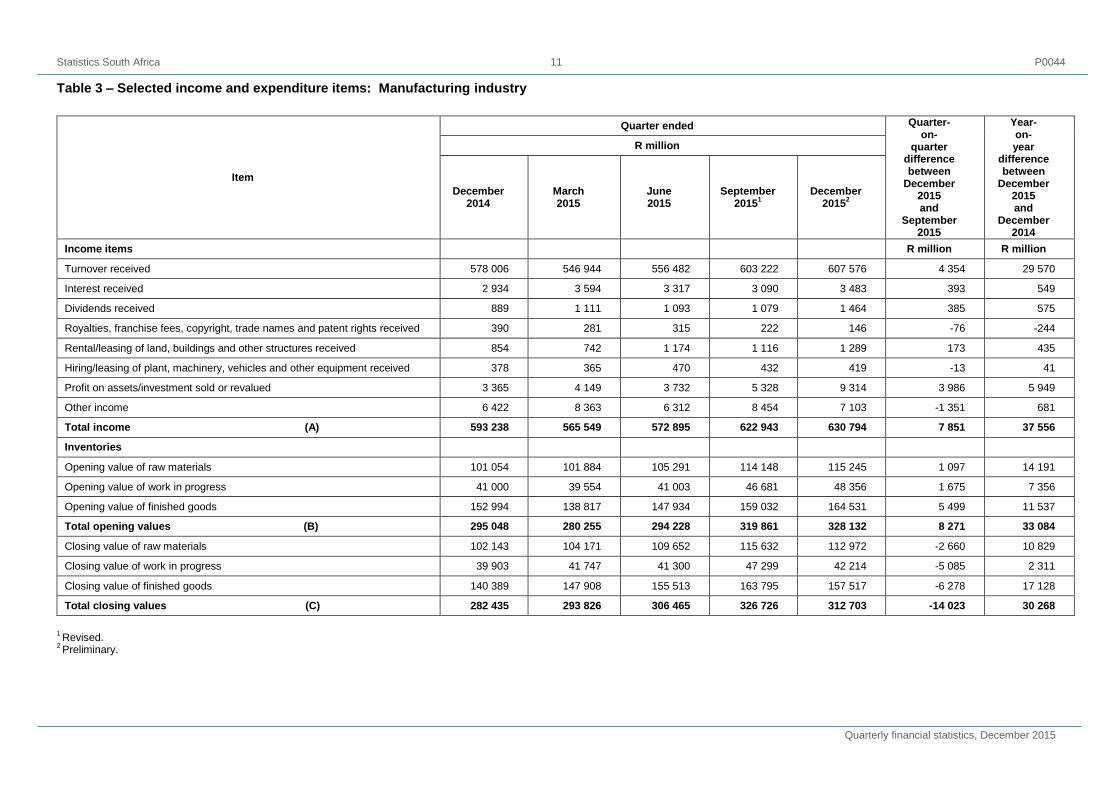
Table 3 – Selected income and expenditure items: Manufacturing industry
Item
Quarter ended Quarter- on-
quarter difference between
December 2015 and
September 2015
Year- on- year
difference between
December 2015 and
December 2014
R million
December 2014
March 2015
June 2015
September
20151
December 2015
2
Income items R million R million
Turnover received 578 006 546 944 556 482 603 222 607 576 4 354 29 570
Interest received 2 934 3 594 3 317 3 090 3 483 393 549
Dividends received 889 1 111 1 093 1 079 1 464 385 575
Royalties, franchise fees, copyright, trade names and patent rights received 390 281 315 222 146 -76 -244
Rental/leasing of land, buildings and other structures received 854 742 1 174 1 116 1 289 173 435
Hiring/leasing of plant, machinery, vehicles and other equipment received 378 365 470 432 419 -13 41
Profit on assets/investment sold or revalued 3 365 4 149 3 732 5 328 9 314 3 986 5 949
Other income 6 422 8 363 6 312 8 454 7 103 -1 351 681
Total income (A) 593 238 565 549 572 895 622 943 630 794 7 851 37 556
Inventories
Opening value of raw materials 101 054 101 884 105 291 114 148 115 245 1 097 14 191
Opening value of work in progress 41 000 39 554 41 003 46 681 48 356 1 675 7 356
Opening value of finished goods 152 994 138 817 147 934 159 032 164 531 5 499 11 537
Total opening values (B) 295 048 280 255 294 228 319 861 328 132 8 271 33 084
Closing value of raw materials 102 143 104 171 109 652 115 632 112 972 -2 660 10 829
Closing value of work in progress 39 903 41 747 41 300 47 299 42 214 -5 085 2 311
Closing value of finished goods 140 389 147 908 155 513 163 795 157 517 -6 278 17 128
Total closing values (C) 282 435 293 826 306 465 326 726 312 703 -14 023 30 268
1 Revised.
2 Preliminary.
Statistics South Africa 12 P0044
Quarterly financial statistics, December 2015
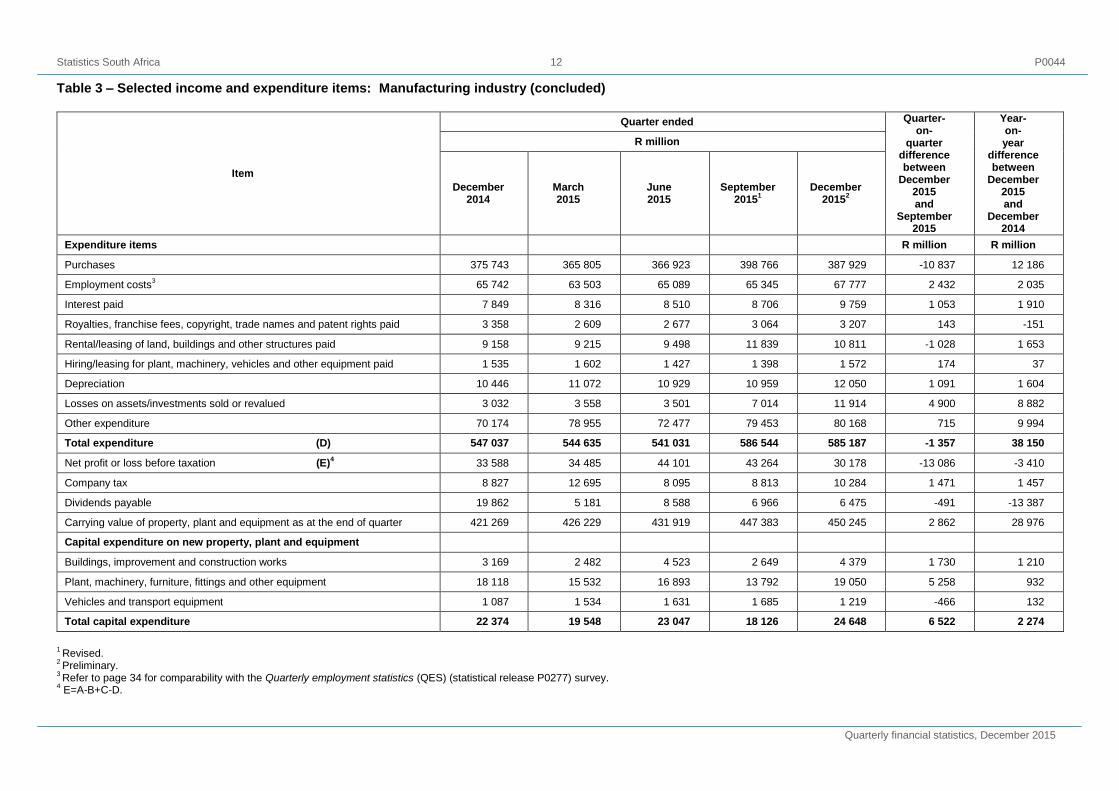
Table 3 – Selected income and expenditure items: Manufacturing industry (concluded)
Item
Quarter ended Quarter- on-
quarter difference between
December 2015 and
September 2015
Year- on- year
difference between
December 2015 and
December 2014
R million
December 2014
March 2015
June 2015
September
20151
December 2015
2
Expenditure items R million R million
Purchases 375 743 365 805 366 923 398 766 387 929 -10 837 12 186
Employment costs3 65 742 63 503 65 089 65 345 67 777 2 432 2 035
Interest paid 7 849 8 316 8 510 8 706 9 759 1 053 1 910
Royalties, franchise fees, copyright, trade names and patent rights paid 3 358 2 609 2 677 3 064 3 207 143 -151
Rental/leasing of land, buildings and other structures paid 9 158 9 215 9 498 11 839 10 811 -1 028 1 653
Hiring/leasing for plant, machinery, vehicles and other equipment paid 1 535 1 602 1 427 1 398 1 572 174 37
Depreciation 10 446 11 072 10 929 10 959 12 050 1 091 1 604
Losses on assets/investments sold or revalued 3 032 3 558 3 501 7 014 11 914 4 900 8 882
Other expenditure 70 174 78 955 72 477 79 453 80 168 715 9 994
Total expenditure (D) 547 037 544 635 541 031 586 544 585 187 -1 357 38 150
Net profit or loss before taxation (E)4 33 588 34 485 44 101 43 264 30 178 -13 086 -3 410
Company tax 8 827 12 695 8 095 8 813 10 284 1 471 1 457
Dividends payable 19 862 5 181 8 588 6 966 6 475 -491 -13 387
Carrying value of property, plant and equipment as at the end of quarter 421 269 426 229 431 919 447 383 450 245 2 862 28 976
Capital expenditure on new property, plant and equipment
Buildings, improvement and construction works 3 169 2 482 4 523 2 649 4 379 1 730 1 210
Plant, machinery, furniture, fittings and other equipment 18 118 15 532 16 893 13 792 19 050 5 258 932
Vehicles and transport equipment 1 087 1 534 1 631 1 685 1 219 -466 132
Total capital expenditure 22 374 19 548 23 047 18 126 24 648 6 522 2 274
1 Revised.
2 Preliminary.
3 Refer to page 34 for comparability with the Quarterly employment statistics (QES) (statistical release P0277) survey.
4 E=A-B+C-D.
Statistics South Africa 13 P0044
Quarterly financial statistics, December 2015
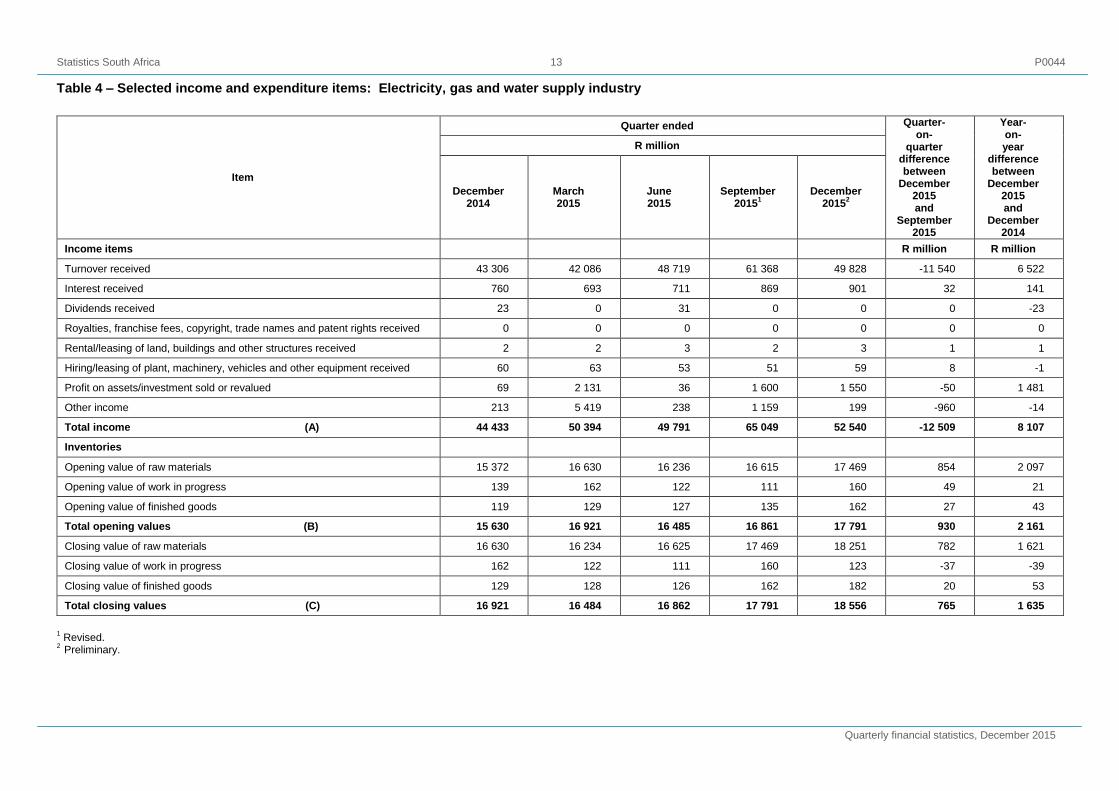
Table 4 – Selected income and expenditure items: Electricity, gas and water supply industry
Item
Quarter ended Quarter- on-
quarter difference between
December 2015 and
September 2015
Year- on- year
difference between
December 2015 and
December 2014
R million
December 2014
March 2015
June 2015
September
20151
December 2015
2
Income items R million R million
Turnover received 43 306 42 086 48 719 61 368 49 828 -11 540 6 522
Interest received 760 693 711 869 901 32 141
Dividends received 23 0 31 0 0 0 -23
Royalties, franchise fees, copyright, trade names and patent rights received 0 0 0 0 0 0 0
Rental/leasing of land, buildings and other structures received 2 2 3 2 3 1 1
Hiring/leasing of plant, machinery, vehicles and other equipment received 60 63 53 51 59 8 -1
Profit on assets/investment sold or revalued 69 2 131 36 1 600 1 550 -50 1 481
Other income 213 5 419 238 1 159 199 -960 -14
Total income (A) 44 433 50 394 49 791 65 049 52 540 -12 509 8 107
Inventories
Opening value of raw materials 15 372 16 630 16 236 16 615 17 469 854 2 097
Opening value of work in progress 139 162 122 111 160 49 21
Opening value of finished goods 119 129 127 135 162 27 43
Total opening values (B) 15 630 16 921 16 485 16 861 17 791 930 2 161
Closing value of raw materials 16 630 16 234 16 625 17 469 18 251 782 1 621
Closing value of work in progress 162 122 111 160 123 -37 -39
Closing value of finished goods 129 128 126 162 182 20 53
Total closing values (C) 16 921 16 484 16 862 17 791 18 556 765 1 635
1 Revised.
2 Preliminary.
Statistics South Africa 14 P0044
Quarterly financial statistics, December 2015
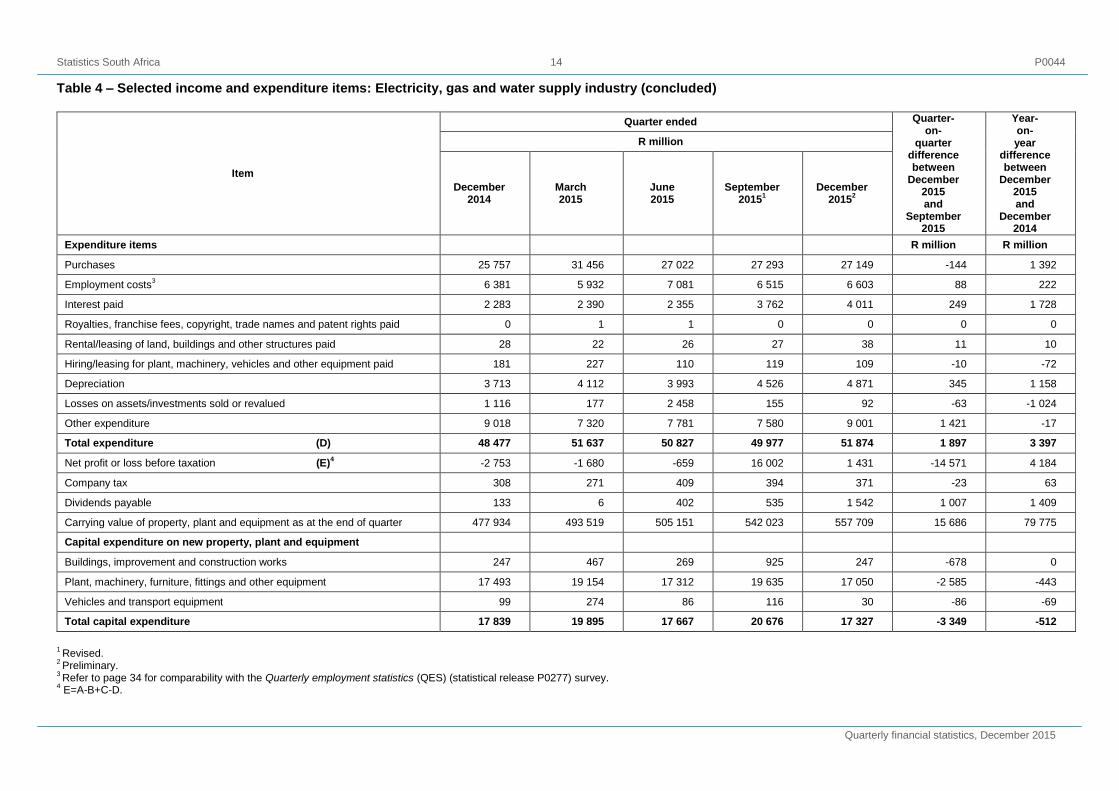
Table 4 – Selected income and expenditure items: Electricity, gas and water supply industry (concluded)
Item
Quarter ended Quarter- on-
quarter difference between
December 2015 and
September 2015
Year- on- year
difference between
December 2015 and
December 2014
R million
December 2014
March 2015
June 2015
September
20151
December 2015
2
Expenditure items R million R million
Purchases 25 757 31 456 27 022 27 293 27 149 -144 1 392
Employment costs3 6 381 5 932 7 081 6 515 6 603 88 222
Interest paid 2 283 2 390 2 355 3 762 4 011 249 1 728
Royalties, franchise fees, copyright, trade names and patent rights paid 0 1 1 0 0 0 0
Rental/leasing of land, buildings and other structures paid 28 22 26 27 38 11 10
Hiring/leasing for plant, machinery, vehicles and other equipment paid 181 227 110 119 109 -10 -72
Depreciation 3 713 4 112 3 993 4 526 4 871 345 1 158
Losses on assets/investments sold or revalued 1 116 177 2 458 155 92 -63 -1 024
Other expenditure 9 018 7 320 7 781 7 580 9 001 1 421 -17
Total expenditure (D) 48 477 51 637 50 827 49 977 51 874 1 897 3 397
Net profit or loss before taxation (E)4 -2 753 -1 680 -659 16 002 1 431 -14 571 4 184
Company tax 308 271 409 394 371 -23 63
Dividends payable 133 6 402 535 1 542 1 007 1 409
Carrying value of property, plant and equipment as at the end of quarter 477 934 493 519 505 151 542 023 557 709 15 686 79 775
Capital expenditure on new property, plant and equipment
Buildings, improvement and construction works 247 467 269 925 247 -678 0
Plant, machinery, furniture, fittings and other equipment 17 493 19 154 17 312 19 635 17 050 -2 585 -443
Vehicles and transport equipment 99 274 86 116 30 -86 -69
Total capital expenditure 17 839 19 895 17 667 20 676 17 327 -3 349 -512
1 Revised.
2 Preliminary.
3 Refer to page 34 for comparability with the Quarterly employment statistics (QES) (statistical release P0277) survey.
4 E=A-B+C-D.
Statistics South Africa 15 P0044
Quarterly financial statistics, December 2015
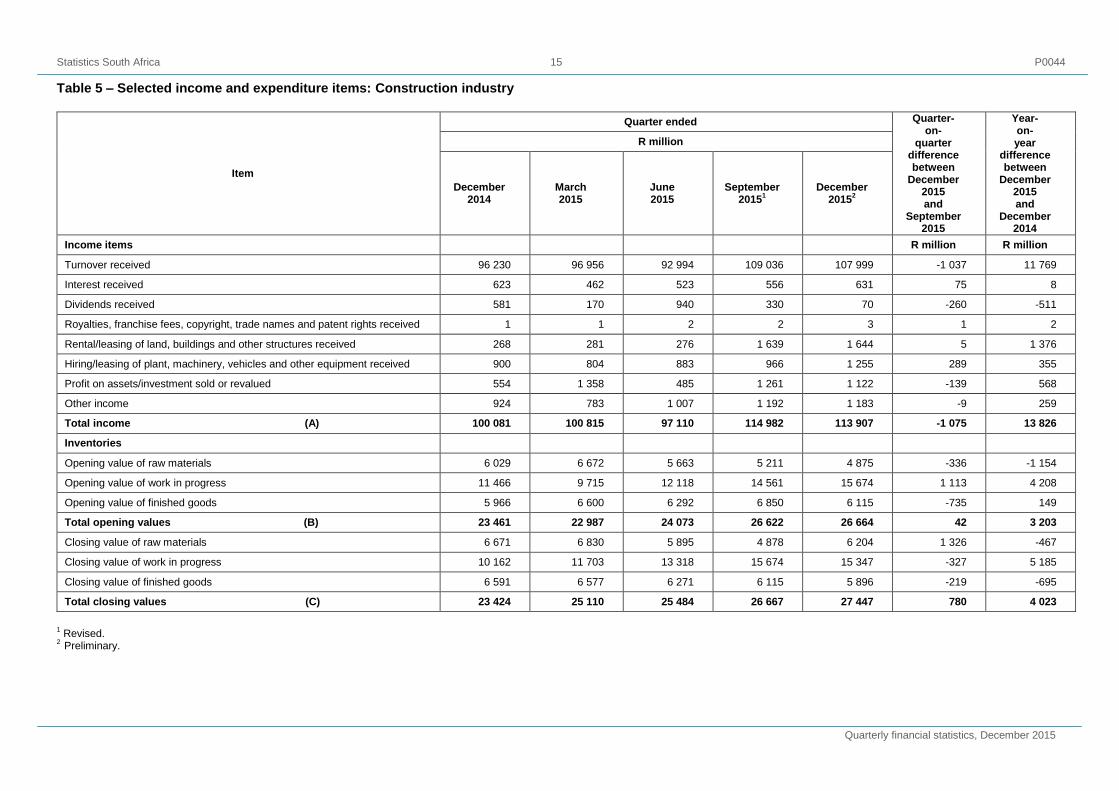
Table 5 – Selected income and expenditure items: Construction industry
Item
Quarter ended Quarter- on-
quarter difference between
December 2015 and
September 2015
Year- on- year
difference between
December 2015 and
December 2014
R million
December 2014
March 2015
June 2015
September
20151
December 2015
2
Income items R million R million
Turnover received 96 230 96 956 92 994 109 036 107 999 -1 037 11 769
Interest received 623 462 523 556 631 75 8
Dividends received 581 170 940 330 70 -260 -511
Royalties, franchise fees, copyright, trade names and patent rights received 1 1 2 2 3 1 2
Rental/leasing of land, buildings and other structures received 268 281 276 1 639 1 644 5 1 376
Hiring/leasing of plant, machinery, vehicles and other equipment received 900 804 883 966 1 255 289 355
Profit on assets/investment sold or revalued 554 1 358 485 1 261 1 122 -139 568
Other income 924 783 1 007 1 192 1 183 -9 259
Total income (A) 100 081 100 815 97 110 114 982 113 907 -1 075 13 826
Inventories
Opening value of raw materials 6 029 6 672 5 663 5 211 4 875 -336 -1 154
Opening value of work in progress 11 466 9 715 12 118 14 561 15 674 1 113 4 208
Opening value of finished goods 5 966 6 600 6 292 6 850 6 115 -735 149
Total opening values (B) 23 461 22 987 24 073 26 622 26 664 42 3 203
Closing value of raw materials 6 671 6 830 5 895 4 878 6 204 1 326 -467
Closing value of work in progress 10 162 11 703 13 318 15 674 15 347 -327 5 185
Closing value of finished goods 6 591 6 577 6 271 6 115 5 896 -219 -695
Total closing values (C) 23 424 25 110 25 484 26 667 27 447 780 4 023
1 Revised.
2 Preliminary.
Statistics South Africa 16 P0044
Quarterly financial statistics, December 2015
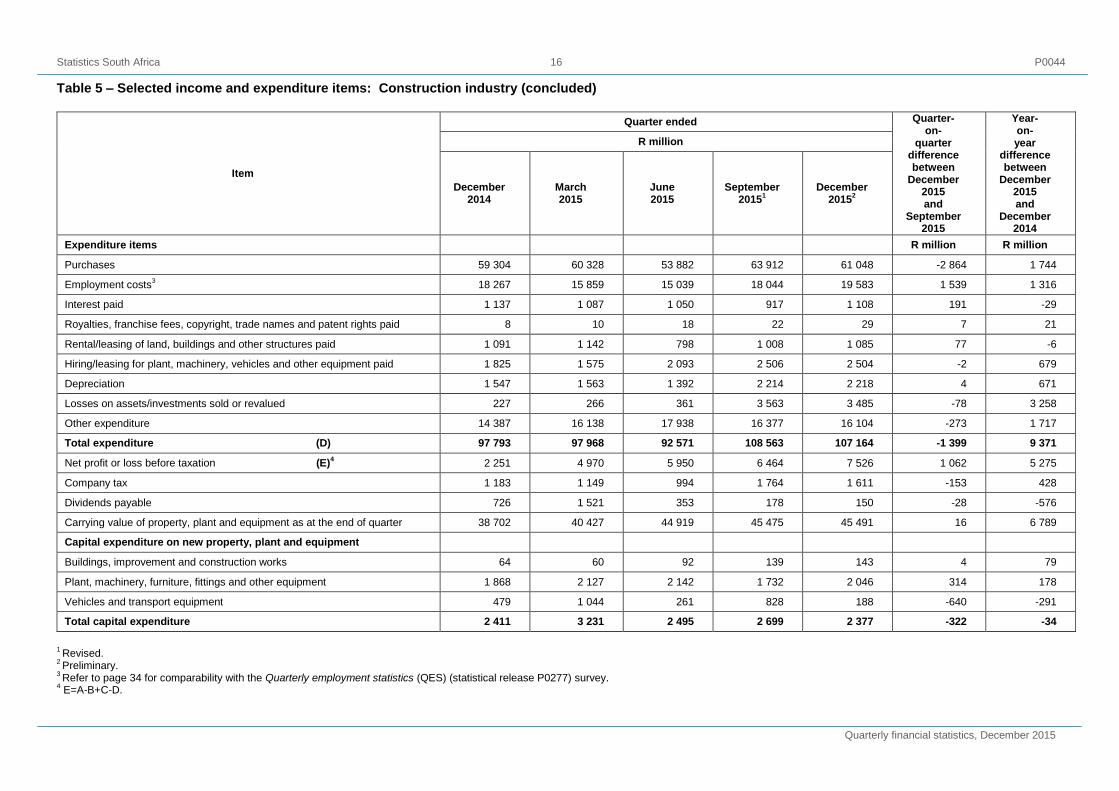
Table 5 – Selected income and expenditure items: Construction industry (concluded)
Item
Quarter ended Quarter- on-
quarter difference between
December 2015 and
September 2015
Year- on- year
difference between
December 2015 and
December 2014
R million
December 2014
March 2015
June 2015
September
20151
December 2015
2
Expenditure items R million R million
Purchases 59 304 60 328 53 882 63 912 61 048 -2 864 1 744
Employment costs3 18 267 15 859 15 039 18 044 19 583 1 539 1 316
Interest paid 1 137 1 087 1 050 917 1 108 191 -29
Royalties, franchise fees, copyright, trade names and patent rights paid 8 10 18 22 29 7 21
Rental/leasing of land, buildings and other structures paid 1 091 1 142 798 1 008 1 085 77 -6
Hiring/leasing for plant, machinery, vehicles and other equipment paid 1 825 1 575 2 093 2 506 2 504 -2 679
Depreciation 1 547 1 563 1 392 2 214 2 218 4 671
Losses on assets/investments sold or revalued 227 266 361 3 563 3 485 -78 3 258
Other expenditure 14 387 16 138 17 938 16 377 16 104 -273 1 717
Total expenditure (D) 97 793 97 968 92 571 108 563 107 164 -1 399 9 371
Net profit or loss before taxation (E)4 2 251 4 970 5 950 6 464 7 526 1 062 5 275
Company tax 1 183 1 149 994 1 764 1 611 -153 428
Dividends payable 726 1 521 353 178 150 -28 -576
Carrying value of property, plant and equipment as at the end of quarter 38 702 40 427 44 919 45 475 45 491 16 6 789
Capital expenditure on new property, plant and equipment
Buildings, improvement and construction works 64 60 92 139 143 4 79
Plant, machinery, furniture, fittings and other equipment 1 868 2 127 2 142 1 732 2 046 314 178
Vehicles and transport equipment 479 1 044 261 828 188 -640 -291
Total capital expenditure 2 411 3 231 2 495 2 699 2 377 -322 -34
1 Revised.
2 Preliminary.
3 Refer to page 34 for comparability with the Quarterly employment statistics (QES) (statistical release P0277) survey.
4 E=A-B+C-D.
Statistics South Africa 17 P0044
Quarterly financial statistics, December 2015
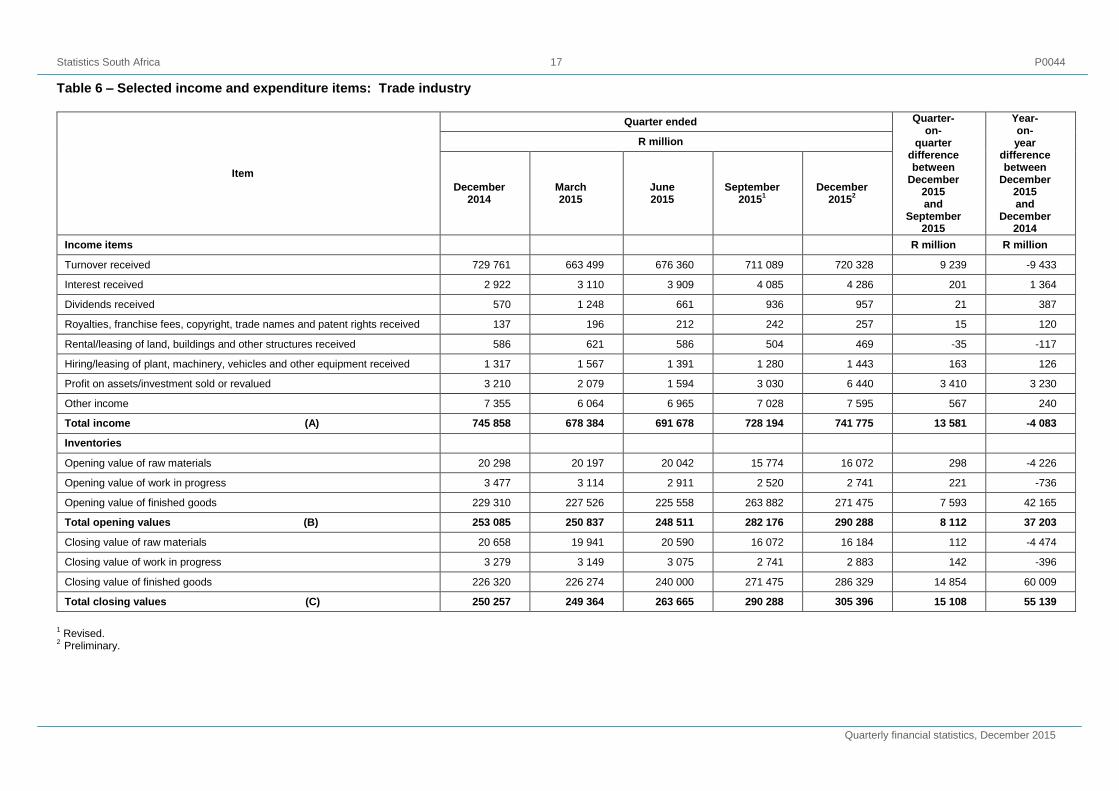
Table 6 – Selected income and expenditure items: Trade industry
Item
Quarter ended Quarter- on-
quarter difference between
December 2015 and
September 2015
Year- on- year
difference between
December 2015 and
December 2014
R million
December 2014
March 2015
June 2015
September
20151
December 2015
2
Income items R million R million
Turnover received 729 761 663 499 676 360 711 089 720 328 9 239 -9 433
Interest received 2 922 3 110 3 909 4 085 4 286 201 1 364
Dividends received 570 1 248 661 936 957 21 387
Royalties, franchise fees, copyright, trade names and patent rights received 137 196 212 242 257 15 120
Rental/leasing of land, buildings and other structures received 586 621 586 504 469 -35 -117
Hiring/leasing of plant, machinery, vehicles and other equipment received 1 317 1 567 1 391 1 280 1 443 163 126
Profit on assets/investment sold or revalued 3 210 2 079 1 594 3 030 6 440 3 410 3 230
Other income 7 355 6 064 6 965 7 028 7 595 567 240
Total income (A) 745 858 678 384 691 678 728 194 741 775 13 581 -4 083
Inventories
Opening value of raw materials 20 298 20 197 20 042 15 774 16 072 298 -4 226
Opening value of work in progress 3 477 3 114 2 911 2 520 2 741 221 -736
Opening value of finished goods 229 310 227 526 225 558 263 882 271 475 7 593 42 165
Total opening values (B) 253 085 250 837 248 511 282 176 290 288 8 112 37 203
Closing value of raw materials 20 658 19 941 20 590 16 072 16 184 112 -4 474
Closing value of work in progress 3 279 3 149 3 075 2 741 2 883 142 -396
Closing value of finished goods 226 320 226 274 240 000 271 475 286 329 14 854 60 009
Total closing values (C) 250 257 249 364 263 665 290 288 305 396 15 108 55 139
1 Revised.
2 Preliminary.
Statistics South Africa 18 P0044
Quarterly financial statistics, December 2015
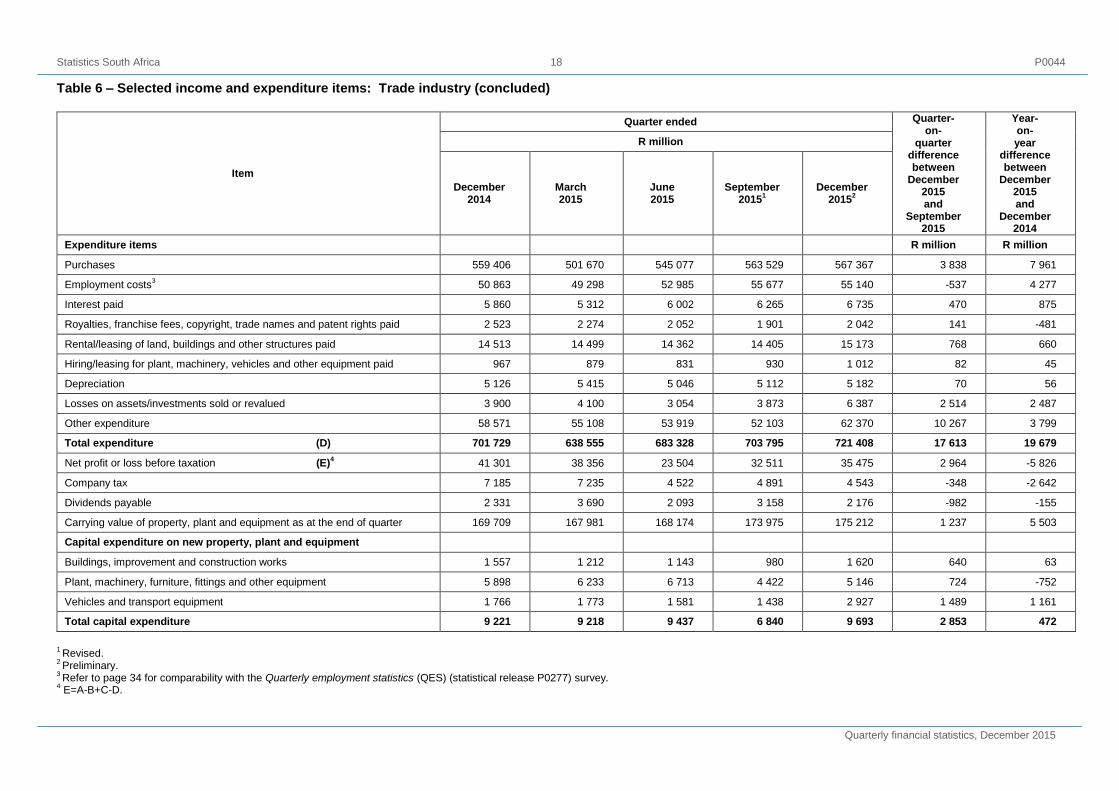
Table 6 – Selected income and expenditure items: Trade industry (concluded)
Item
Quarter ended Quarter- on-
quarter difference between
December 2015 and
September 2015
Year- on- year
difference between
December 2015 and
December 2014
R million
December 2014
March 2015
June 2015
September
20151
December 2015
2
Expenditure items R million R million
Purchases 559 406 501 670 545 077 563 529 567 367 3 838 7 961
Employment costs3 50 863 49 298 52 985 55 677 55 140 -537 4 277
Interest paid 5 860 5 312 6 002 6 265 6 735 470 875
Royalties, franchise fees, copyright, trade names and patent rights paid 2 523 2 274 2 052 1 901 2 042 141 -481
Rental/leasing of land, buildings and other structures paid 14 513 14 499 14 362 14 405 15 173 768 660
Hiring/leasing for plant, machinery, vehicles and other equipment paid 967 879 831 930 1 012 82 45
Depreciation 5 126 5 415 5 046 5 112 5 182 70 56
Losses on assets/investments sold or revalued 3 900 4 100 3 054 3 873 6 387 2 514 2 487
Other expenditure 58 571 55 108 53 919 52 103 62 370 10 267 3 799
Total expenditure (D) 701 729 638 555 683 328 703 795 721 408 17 613 19 679
Net profit or loss before taxation (E)4 41 301 38 356 23 504 32 511 35 475 2 964 -5 826
Company tax 7 185 7 235 4 522 4 891 4 543 -348 -2 642
Dividends payable 2 331 3 690 2 093 3 158 2 176 -982 -155
Carrying value of property, plant and equipment as at the end of quarter 169 709 167 981 168 174 173 975 175 212 1 237 5 503
Capital expenditure on new property, plant and equipment
Buildings, improvement and construction works 1 557 1 212 1 143 980 1 620 640 63
Plant, machinery, furniture, fittings and other equipment 5 898 6 233 6 713 4 422 5 146 724 -752
Vehicles and transport equipment 1 766 1 773 1 581 1 438 2 927 1 489 1 161
Total capital expenditure 9 221 9 218 9 437 6 840 9 693 2 853 472
1 Revised.
2 Preliminary.
3 Refer to page 34 for comparability with the Quarterly employment statistics (QES) (statistical release P0277) survey.
4 E=A-B+C-D.
Statistics South Africa 19 P0044
Quarterly financial statistics, December 2015
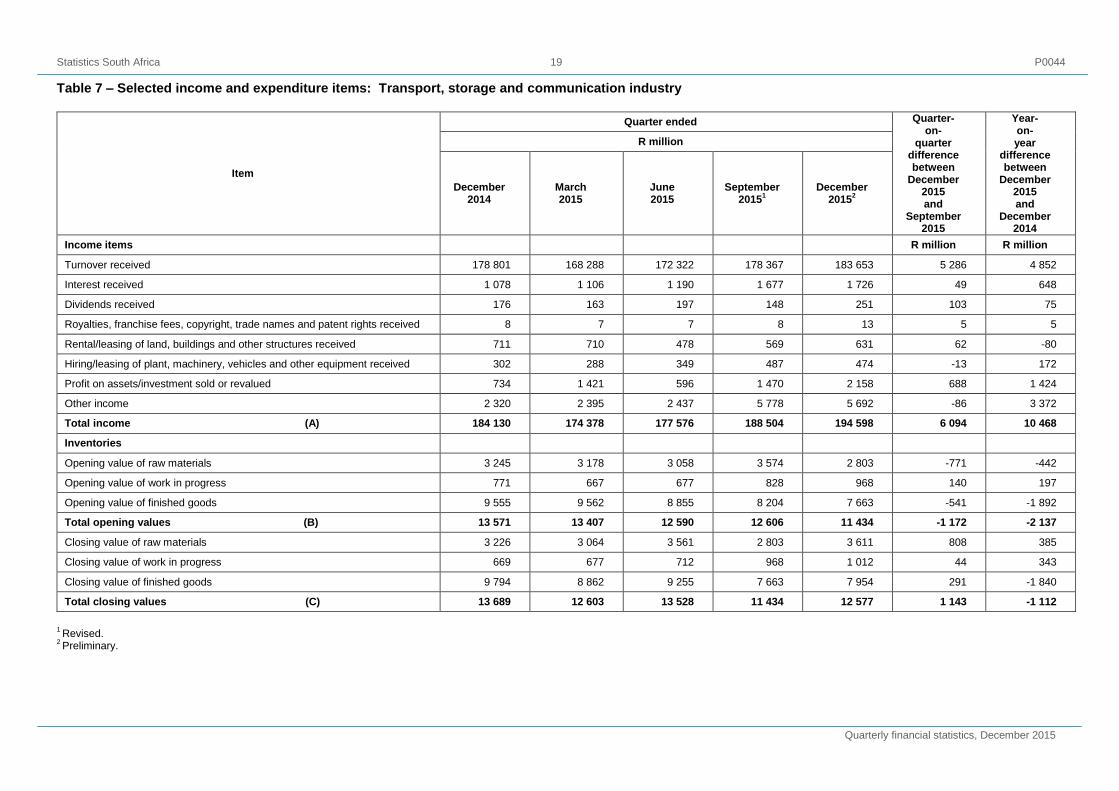
Table 7 – Selected income and expenditure items: Transport, storage and communication industry
Item
Quarter ended Quarter- on-
quarter difference between
December 2015 and
September 2015
Year- on- year
difference between
December 2015 and
December 2014
R million
December 2014
March 2015
June 2015
September
20151
December 2015
2
Income items R million R million
Turnover received 178 801 168 288 172 322 178 367 183 653 5 286 4 852
Interest received 1 078 1 106 1 190 1 677 1 726 49 648
Dividends received 176 163 197 148 251 103 75
Royalties, franchise fees, copyright, trade names and patent rights received 8 7 7 8 13 5 5
Rental/leasing of land, buildings and other structures received 711 710 478 569 631 62 -80
Hiring/leasing of plant, machinery, vehicles and other equipment received 302 288 349 487 474 -13 172
Profit on assets/investment sold or revalued 734 1 421 596 1 470 2 158 688 1 424
Other income 2 320 2 395 2 437 5 778 5 692 -86 3 372
Total income (A) 184 130 174 378 177 576 188 504 194 598 6 094 10 468
Inventories
Opening value of raw materials 3 245 3 178 3 058 3 574 2 803 -771 -442
Opening value of work in progress 771 667 677 828 968 140 197
Opening value of finished goods 9 555 9 562 8 855 8 204 7 663 -541 -1 892
Total opening values (B) 13 571 13 407 12 590 12 606 11 434 -1 172 -2 137
Closing value of raw materials 3 226 3 064 3 561 2 803 3 611 808 385
Closing value of work in progress 669 677 712 968 1 012 44 343
Closing value of finished goods 9 794 8 862 9 255 7 663 7 954 291 -1 840
Total closing values (C) 13 689 12 603 13 528 11 434 12 577 1 143 -1 112
1 Revised.
2 Preliminary.
Statistics South Africa 20 P0044
Quarterly financial statistics, December 2015
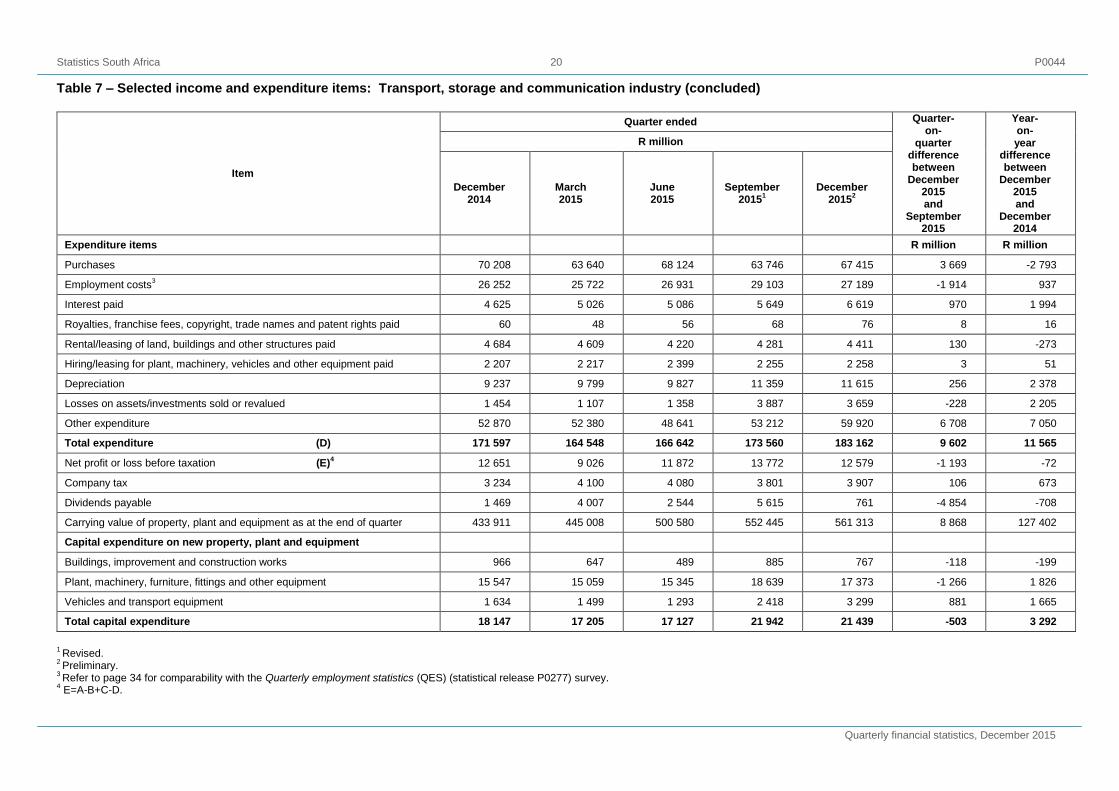
Table 7 – Selected income and expenditure items: Transport, storage and communication industry (concluded)
Item
Quarter ended Quarter- on-
quarter difference between
December 2015 and
September 2015
Year- on- year
difference between
December 2015 and
December 2014
R million
December 2014
March 2015
June 2015
September
20151
December 2015
2
Expenditure items R million R million
Purchases 70 208 63 640 68 124 63 746 67 415 3 669 -2 793
Employment costs3 26 252 25 722 26 931 29 103 27 189 -1 914 937
Interest paid 4 625 5 026 5 086 5 649 6 619 970 1 994
Royalties, franchise fees, copyright, trade names and patent rights paid 60 48 56 68 76 8 16
Rental/leasing of land, buildings and other structures paid 4 684 4 609 4 220 4 281 4 411 130 -273
Hiring/leasing for plant, machinery, vehicles and other equipment paid 2 207 2 217 2 399 2 255 2 258 3 51
Depreciation 9 237 9 799 9 827 11 359 11 615 256 2 378
Losses on assets/investments sold or revalued 1 454 1 107 1 358 3 887 3 659 -228 2 205
Other expenditure 52 870 52 380 48 641 53 212 59 920 6 708 7 050
Total expenditure (D) 171 597 164 548 166 642 173 560 183 162 9 602 11 565
Net profit or loss before taxation (E)4 12 651 9 026 11 872 13 772 12 579 -1 193 -72
Company tax 3 234 4 100 4 080 3 801 3 907 106 673
Dividends payable 1 469 4 007 2 544 5 615 761 -4 854 -708
Carrying value of property, plant and equipment as at the end of quarter 433 911 445 008 500 580 552 445 561 313 8 868 127 402
Capital expenditure on new property, plant and equipment
Buildings, improvement and construction works 966 647 489 885 767 -118 -199
Plant, machinery, furniture, fittings and other equipment 15 547 15 059 15 345 18 639 17 373 -1 266 1 826
Vehicles and transport equipment 1 634 1 499 1 293 2 418 3 299 881 1 665
Total capital expenditure 18 147 17 205 17 127 21 942 21 439 -503 3 292
1 Revised.
2 Preliminary.
3 Refer to page 34 for comparability with the Quarterly employment statistics (QES) (statistical release P0277) survey.
4 E=A-B+C-D.
Statistics South Africa 21 P0044
Quarterly financial statistics, December 2015
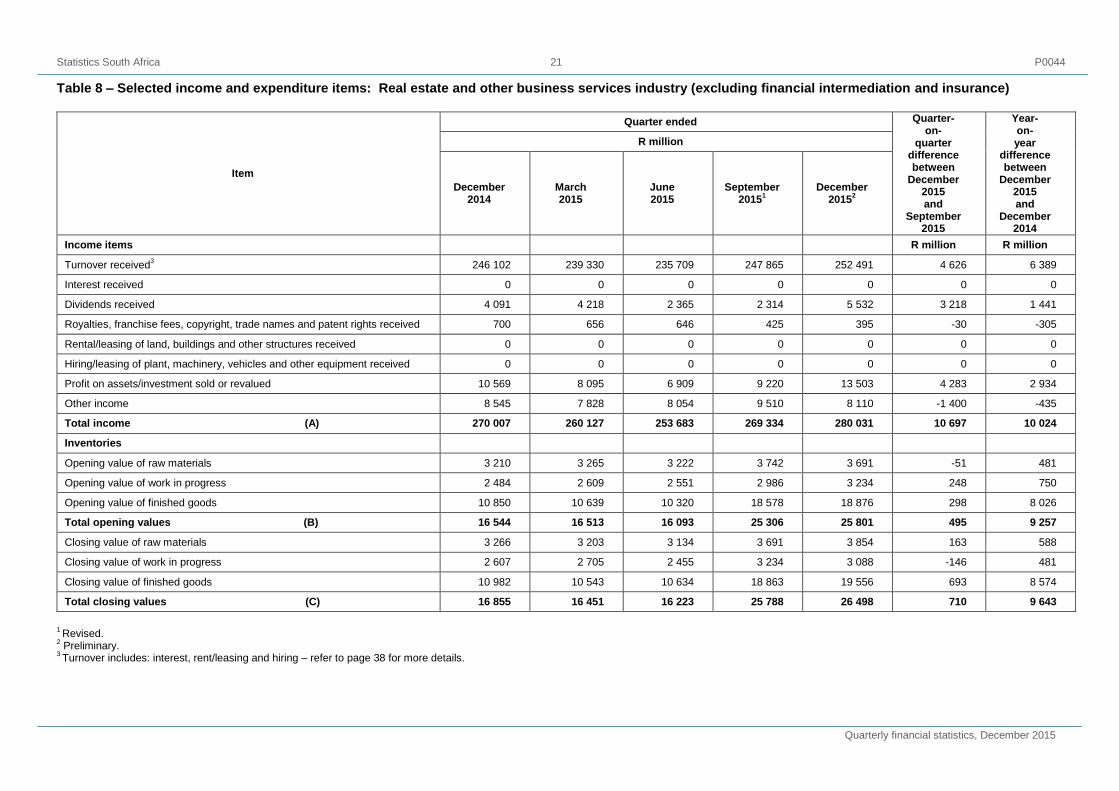
Table 8 – Selected income and expenditure items: Real estate and other business services industry (excluding financial intermediation and insurance)
Item
Quarter ended Quarter- on-
quarter difference between
December 2015 and
September 2015
Year- on- year
difference between
December 2015 and
December 2014
R million
December 2014
March 2015
June 2015
September
20151
December 2015
2
Income items R million R million
Turnover received3 246 102 239 330 235 709 247 865 252 491 4 626 6 389
Interest received 0 0 0 0 0 0 0
Dividends received 4 091 4 218 2 365 2 314 5 532 3 218 1 441
Royalties, franchise fees, copyright, trade names and patent rights received 700 656 646 425 395 -30 -305
Rental/leasing of land, buildings and other structures received 0 0 0 0 0 0 0
Hiring/leasing of plant, machinery, vehicles and other equipment received 0 0 0 0 0 0 0
Profit on assets/investment sold or revalued 10 569 8 095 6 909 9 220 13 503 4 283 2 934
Other income 8 545 7 828 8 054 9 510 8 110 -1 400 -435
Total income (A) 270 007 260 127 253 683 269 334 280 031 10 697 10 024
Inventories
Opening value of raw materials 3 210 3 265 3 222 3 742 3 691 -51 481
Opening value of work in progress 2 484 2 609 2 551 2 986 3 234 248 750
Opening value of finished goods 10 850 10 639 10 320 18 578 18 876 298 8 026
Total opening values (B) 16 544 16 513 16 093 25 306 25 801 495 9 257
Closing value of raw materials 3 266 3 203 3 134 3 691 3 854 163 588
Closing value of work in progress 2 607 2 705 2 455 3 234 3 088 -146 481
Closing value of finished goods 10 982 10 543 10 634 18 863 19 556 693 8 574
Total closing values (C) 16 855 16 451 16 223 25 788 26 498 710 9 643
1 Revised.
2 Preliminary.
3 Turnover includes: interest, rent/leasing and hiring – refer to page 38 for more details.
Statistics South Africa 22 P0044
Quarterly financial statistics, December 2015
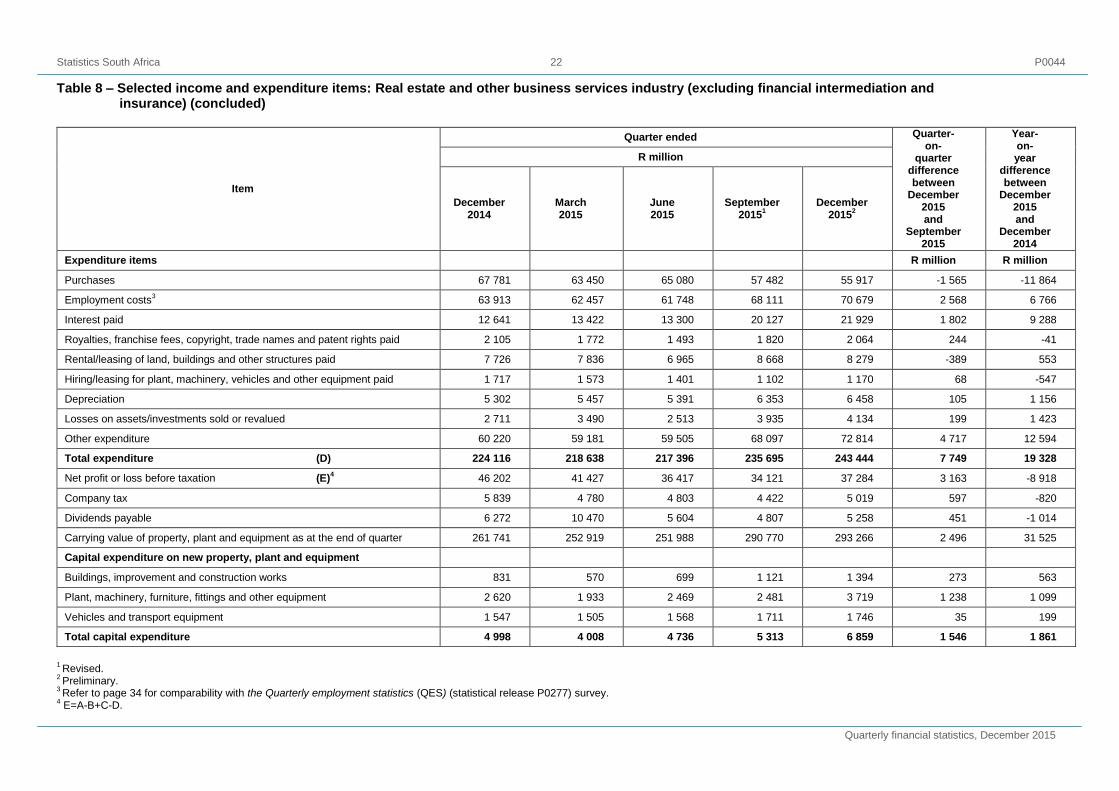
Table 8 – Selected income and expenditure items: Real estate and other business services industry (excluding financial intermediation and insurance) (concluded)
Item
Quarter ended Quarter- on-
quarter difference between
December 2015 and
September 2015
Year- on- year
difference between
December 2015 and
December 2014
R million
December 2014
March 2015
June 2015
September
20151
December 2015
2
Expenditure items R million R million
Purchases 67 781 63 450 65 080 57 482 55 917 -1 565 -11 864
Employment costs3 63 913 62 457 61 748 68 111 70 679 2 568 6 766
Interest paid 12 641 13 422 13 300 20 127 21 929 1 802 9 288
Royalties, franchise fees, copyright, trade names and patent rights paid 2 105 1 772 1 493 1 820 2 064 244 -41
Rental/leasing of land, buildings and other structures paid 7 726 7 836 6 965 8 668 8 279 -389 553
Hiring/leasing for plant, machinery, vehicles and other equipment paid 1 717 1 573 1 401 1 102 1 170 68 -547
Depreciation 5 302 5 457 5 391 6 353 6 458 105 1 156
Losses on assets/investments sold or revalued 2 711 3 490 2 513 3 935 4 134 199 1 423
Other expenditure 60 220 59 181 59 505 68 097 72 814 4 717 12 594
Total expenditure (D) 224 116 218 638 217 396 235 695 243 444 7 749 19 328
Net profit or loss before taxation (E)4 46 202 41 427 36 417 34 121 37 284 3 163 -8 918
Company tax 5 839 4 780 4 803 4 422 5 019 597 -820
Dividends payable 6 272 10 470 5 604 4 807 5 258 451 -1 014
Carrying value of property, plant and equipment as at the end of quarter 261 741 252 919 251 988 290 770 293 266 2 496 31 525
Capital expenditure on new property, plant and equipment
Buildings, improvement and construction works 831 570 699 1 121 1 394 273 563
Plant, machinery, furniture, fittings and other equipment 2 620 1 933 2 469 2 481 3 719 1 238 1 099
Vehicles and transport equipment 1 547 1 505 1 568 1 711 1 746 35 199
Total capital expenditure 4 998 4 008 4 736 5 313 6 859 1 546 1 861
1 Revised.
2 Preliminary.
3 Refer to page 34 for comparability with the Quarterly employment statistics (QES) (statistical release P0277) survey.
4 E=A-B+C-D.

Statistics South Africa 23 P0044
Quarterly financial statistics, December 2015
Table 9 – Selected income and expenditure items: Community, social and personal services industry (excluding government institutions)
Iterm
Quarter ended Quarter- on-
quarter difference between
December 2015 and
September 2015
Year- on- year
difference between
December 2015 and
December 2014
R million
December 2014
March 2015
June 2015
September
20151
December 2015
2
Income items R million R million
Turnover received 53 959 55 651 55 359 46 260 44 898 -1 362 -9 061
Interest received 663 549 528 606 572 -34 -91
Dividends received 85 170 112 142 592 450 507
Royalties, franchise fees, copyright, trade names and patent rights received 56 172 173 159 149 -10 93
Rental/leasing of land, buildings and other structures received 209 223 225 362 372 10 163
Hiring/leasing of plant, machinery, vehicles and other equipment received 32 39 45 126 153 27 121
Profit on assets/investment sold or revalued 1 696 1 558 1 254 1 563 1 522 -41 -174
Other income 3 509 3 905 2 718 3 386 3 325 -61 -184
Total income (A) 60 209 62 267 60 414 52 604 51 583 -1 021 -8 626
Inventories
Opening value of raw materials 2 808 2 848 2 393 2 672 2 637 -35 -171
Opening value of work in progress 42 41 40 89 84 -5 42
Opening value of finished goods 965 838 873 917 925 8 -40
Total opening values (B) 3 815 3 727 3 306 3 678 3 646 -32 -169
Closing value of raw materials 2 861 2 842 2 347 2 637 2 687 50 -174
Closing value of work in progress 41 46 106 84 82 -2 41
Closing value of finished goods 973 899 842 925 957 32 -16
Total closing values (C) 3 875 3 787 3 295 3 646 3 726 80 -149
1 Revised.
2 Preliminary.
Statistics South Africa 24 P0044
Quarterly financial statistics, December 2015
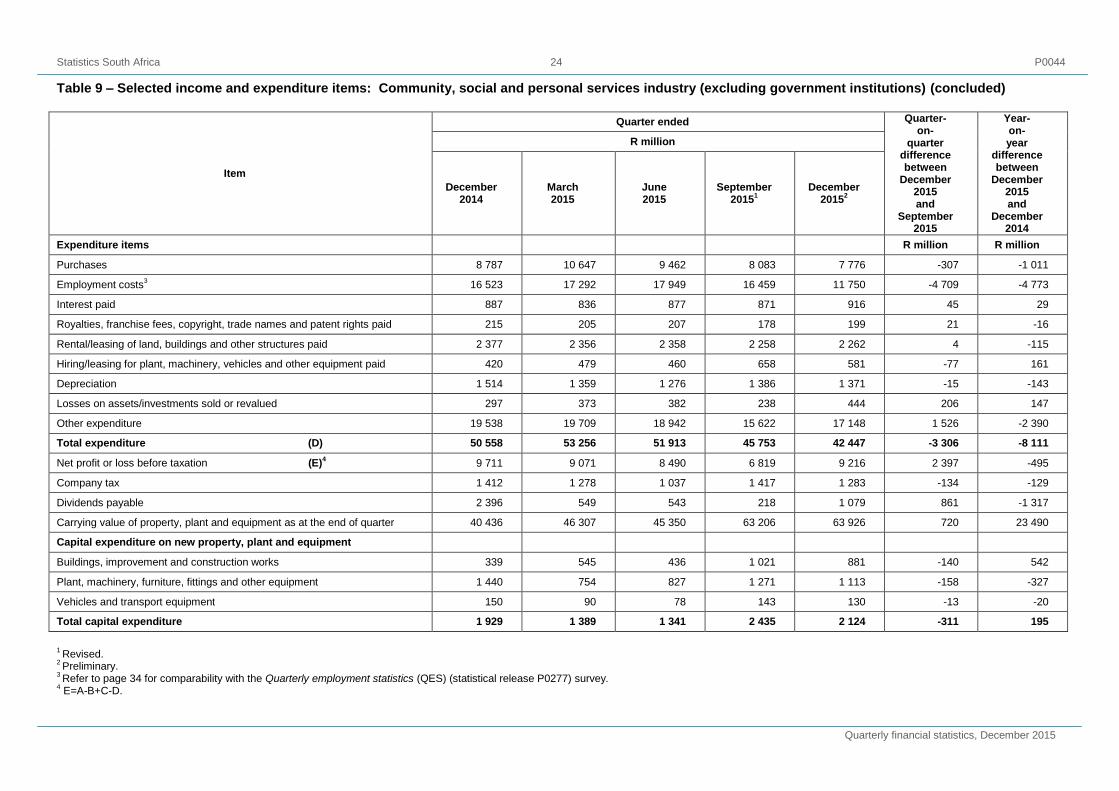
Table 9 – Selected income and expenditure items: Community, social and personal services industry (excluding government institutions) (concluded)
Item
Quarter ended Quarter- on-
quarter difference between
December 2015 and
September 2015
Year- on- year
difference between
December 2015 and
December 2014
R million
December 2014
March 2015
June 2015
September
20151
December 2015
2
Expenditure items R million R million
Purchases 8 787 10 647 9 462 8 083 7 776 -307 -1 011
Employment costs3 16 523 17 292 17 949 16 459 11 750 -4 709 -4 773
Interest paid 887 836 877 871 916 45 29
Royalties, franchise fees, copyright, trade names and patent rights paid 215 205 207 178 199 21 -16
Rental/leasing of land, buildings and other structures paid 2 377 2 356 2 358 2 258 2 262 4 -115
Hiring/leasing for plant, machinery, vehicles and other equipment paid 420 479 460 658 581 -77 161
Depreciation 1 514 1 359 1 276 1 386 1 371 -15 -143
Losses on assets/investments sold or revalued 297 373 382 238 444 206 147
Other expenditure 19 538 19 709 18 942 15 622 17 148 1 526 -2 390
Total expenditure (D) 50 558 53 256 51 913 45 753 42 447 -3 306 -8 111
Net profit or loss before taxation (E)4 9 711 9 071 8 490 6 819 9 216 2 397 -495
Company tax 1 412 1 278 1 037 1 417 1 283 -134 -129
Dividends payable 2 396 549 543 218 1 079 861 -1 317
Carrying value of property, plant and equipment as at the end of quarter 40 436 46 307 45 350 63 206 63 926 720 23 490
Capital expenditure on new property, plant and equipment
Buildings, improvement and construction works 339 545 436 1 021 881 -140 542
Plant, machinery, furniture, fittings and other equipment 1 440 754 827 1 271 1 113 -158 -327
Vehicles and transport equipment 150 90 78 143 130 -13 -20
Total capital expenditure 1 929 1 389 1 341 2 435 2 124 -311 195
1 Revised.
2 Preliminary.
3 Refer to page 34 for comparability with the Quarterly employment statistics (QES) (statistical release P0277) survey.
4 E=A-B+C-D.
Statistics South Africa 25 P0044
Quarterly financial statistics, December 2015
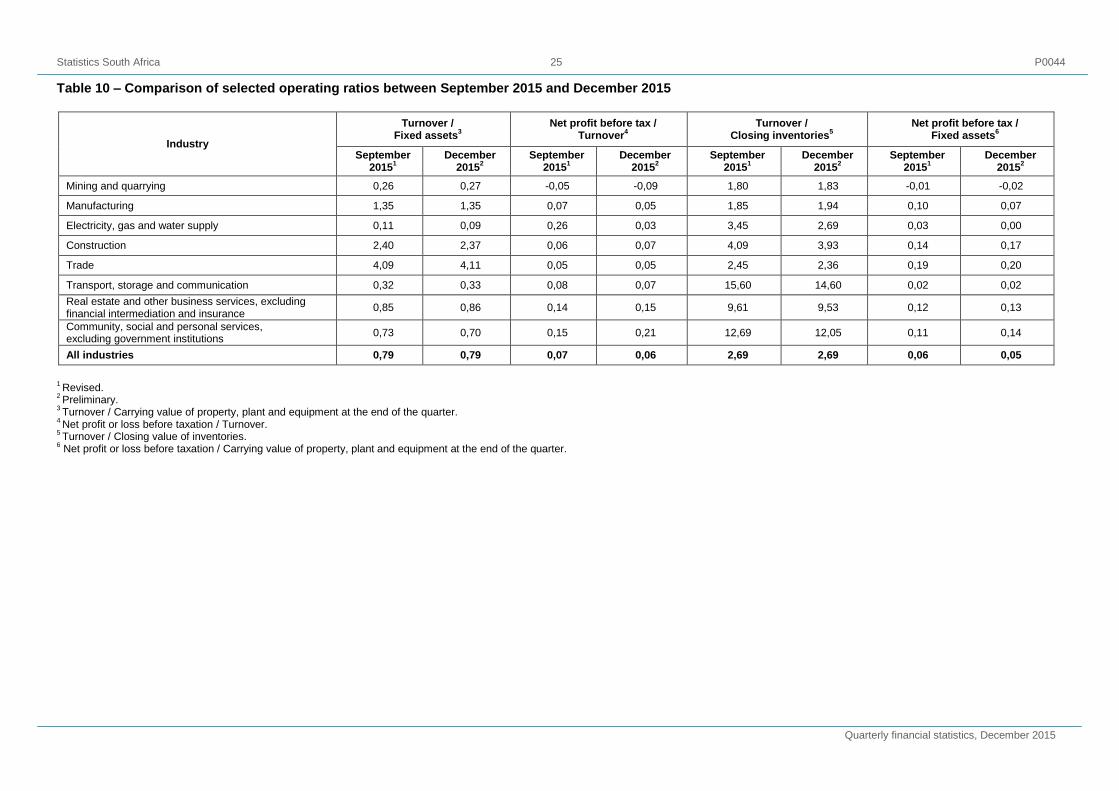
Table 10 – Comparison of selected operating ratios between September 2015 and December 2015
Industry
Turnover / Fixed assets
3
Net profit before tax / Turnover
4
Turnover / Closing inventories
5
Net profit before tax / Fixed assets
6
September 2015
1 December
20152
September 2015
1 December
20152
September 2015
1 December
20152
September 2015
1 December
20152
Mining and quarrying 0,26 0,27 -0,05 -0,09 1,80 1,83 -0,01 -0,02
Manufacturing 1,35 1,35 0,07 0,05 1,85 1,94 0,10 0,07
Electricity, gas and water supply 0,11 0,09 0,26 0,03 3,45 2,69 0,03 0,00
Construction 2,40 2,37 0,06 0,07 4,09 3,93 0,14 0,17
Trade 4,09 4,11 0,05 0,05 2,45 2,36 0,19 0,20
Transport, storage and communication 0,32 0,33 0,08 0,07 15,60 14,60 0,02 0,02
Real estate and other business services, excluding financial intermediation and insurance
0,85 0,86 0,14 0,15 9,61 9,53 0,12 0,13
Community, social and personal services, excluding government institutions
0,73 0,70 0,15 0,21 12,69 12,05 0,11 0,14
All industries 0,79 0,79 0,07 0,06 2,69 2,69 0,06 0,05
1 Revised.
2 Preliminary.
3 Turnover / Carrying value of property, plant and equipment at the end of the quarter.
4 Net profit or loss before taxation / Turnover.
5 Turnover / Closing value of inventories.
6 Net profit or loss before taxation / Carrying value of property, plant and equipment at the end of the quarter.
Statistics South Africa 26 P0044
Quarterly financial statistics, December 2015
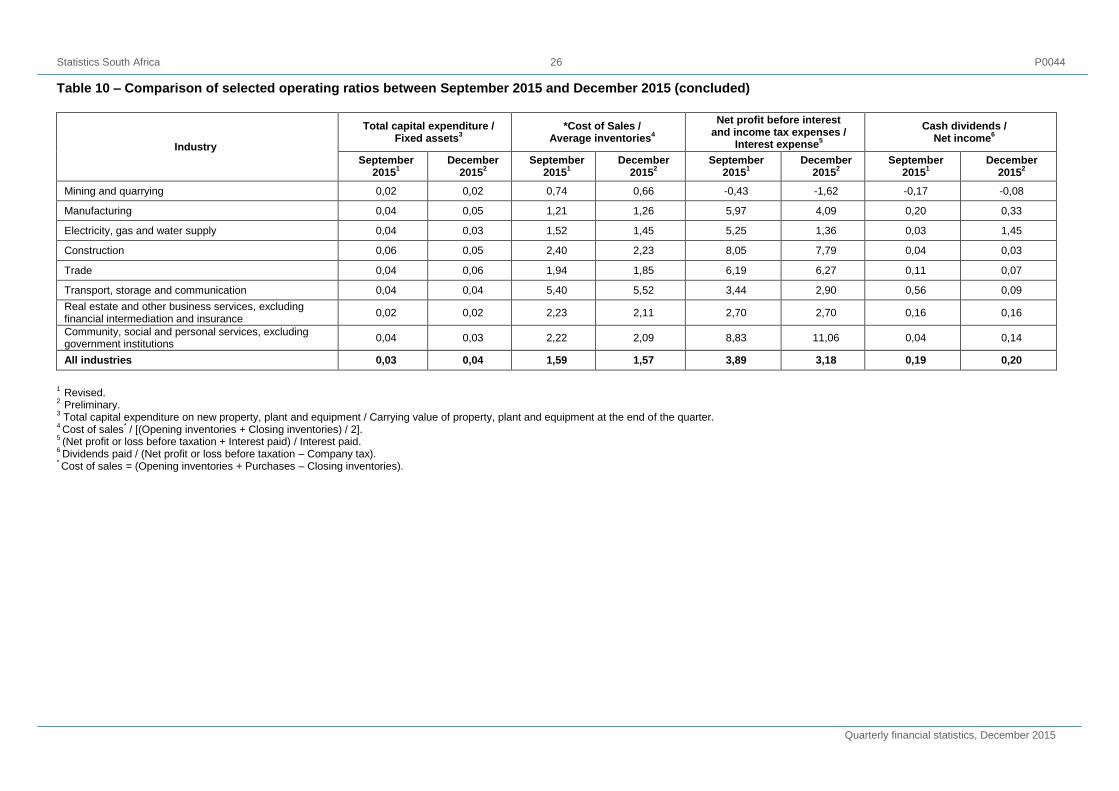
Table 10 – Comparison of selected operating ratios between September 2015 and December 2015 (concluded)
Industry
Total capital expenditure / Fixed assets
3
*Cost of Sales / Average inventories
4
Net profit before interest and income tax expenses /
Interest expense5
Cash dividends / Net income
6
September 2015
1 December
20152
September 2015
1 December
20152
September 2015
1 December
20152
September 2015
1 December
20152
Mining and quarrying 0,02 0,02 0,74 0,66 -0,43 -1,62 -0,17 -0,08
Manufacturing 0,04 0,05 1,21 1,26 5,97 4,09 0,20 0,33
Electricity, gas and water supply 0,04 0,03 1,52 1,45 5,25 1,36 0,03 1,45
Construction 0,06 0,05 2,40 2,23 8,05 7,79 0,04 0,03
Trade 0,04 0,06 1,94 1,85 6,19 6,27 0,11 0,07
Transport, storage and communication 0,04 0,04 5,40 5,52 3,44 2,90 0,56 0,09
Real estate and other business services, excluding financial intermediation and insurance
0,02 0,02 2,23 2,11 2,70 2,70 0,16 0,16
Community, social and personal services, excluding government institutions
0,04 0,03 2,22 2,09 8,83 11,06 0,04 0,14
All industries 0,03 0,04 1,59 1,57 3,89 3,18 0,19 0,20
1
Revised. 2
Preliminary. 3 Total capital expenditure on new property, plant and equipment / Carrying value of property, plant and equipment at the end of the quarter.
4 Cost of sales
* / [(Opening inventories + Closing inventories) / 2].
5 (Net profit or loss before taxation + Interest paid) / Interest paid.
6 Dividends paid / (Net profit or loss before taxation – Company tax).
* Cost of sales = (Opening inventories + Purchases – Closing inventories).
Statistics South Africa 27 P0044
Quarterly financial statistics, December 2015
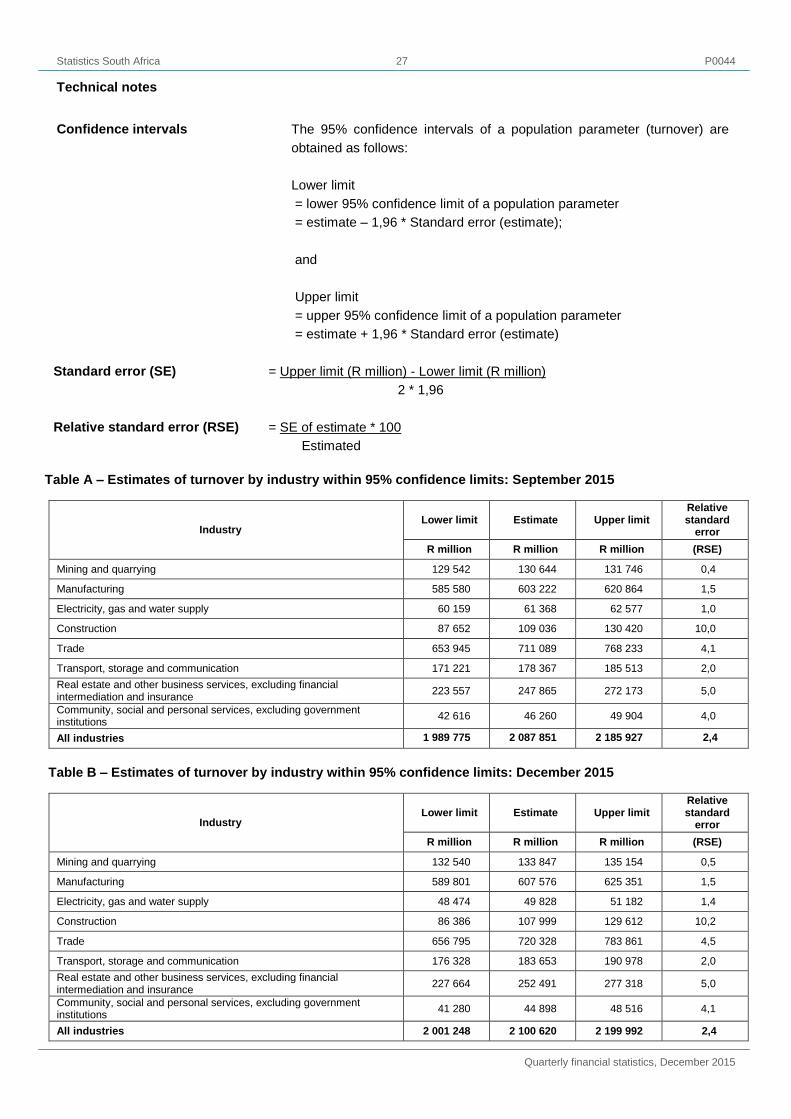
Technical notes
Confidence intervals The 95% confidence intervals of a population parameter (turnover) are
obtained as follows:
Lower limit
= lower 95% confidence limit of a population parameter
= estimate – 1,96 * Standard error (estimate);
and
Upper limit
= upper 95% confidence limit of a population parameter
= estimate + 1,96 * Standard error (estimate)
Standard error (SE) = Upper limit (R million) - Lower limit (R million)
2 * 1,96
Relative standard error (RSE) = SE of estimate * 100
Estimated
Table A – Estimates of turnover by industry within 95% confidence limits: September 2015
Industry Lower limit Estimate Upper limit
Relative standard
error
R million R million R million (RSE)
Mining and quarrying 129 542 130 644 131 746 0,4
Manufacturing 585 580 603 222 620 864 1,5
Electricity, gas and water supply 60 159 61 368 62 577 1,0
Construction 87 652 109 036 130 420 10,0
Trade 653 945 711 089 768 233 4,1
Transport, storage and communication 171 221 178 367 185 513 2,0
Real estate and other business services, excluding financial intermediation and insurance
223 557 247 865 272 173 5,0
Community, social and personal services, excluding government institutions
42 616 46 260 49 904 4,0
All industries 1 989 775 2 087 851 2 185 927 2,4
Table B – Estimates of turnover by industry within 95% confidence limits: December 2015
Industry Lower limit Estimate Upper limit
Relative standard
error
R million R million R million (RSE)
Mining and quarrying 132 540 133 847 135 154 0,5
Manufacturing 589 801 607 576 625 351 1,5
Electricity, gas and water supply 48 474 49 828 51 182 1,4
Construction 86 386 107 999 129 612 10,2
Trade 656 795 720 328 783 861 4,5
Transport, storage and communication 176 328 183 653 190 978 2,0 Real estate and other business services, excluding financial intermediation and insurance
227 664 252 491 277 318 5,0
Community, social and personal services, excluding government institutions
41 280 44 898 48 516 4,1
All industries 2 001 248 2 100 620 2 199 992 2,4
Statistics South Africa 28 P0044
Quarterly financial statistics, December 2015
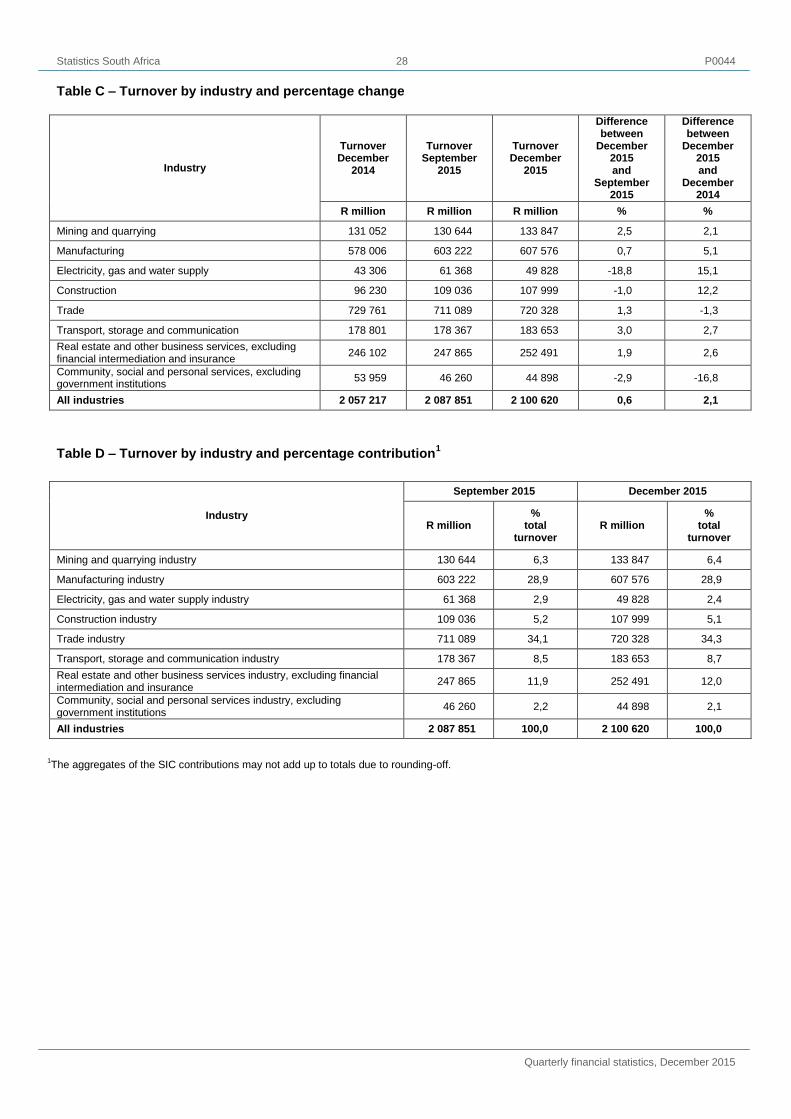
Table C – Turnover by industry and percentage change
Industry
Turnover December
2014
Turnover September
2015
Turnover December
2015
Difference between
December 2015 and
September 2015
Difference between
December 2015 and
December 2014
R million R million R million % %
Mining and quarrying 131 052 130 644 133 847 2,5 2,1
Manufacturing 578 006 603 222 607 576 0,7 5,1
Electricity, gas and water supply 43 306 61 368 49 828 -18,8 15,1
Construction 96 230 109 036 107 999 -1,0 12,2
Trade 729 761 711 089 720 328 1,3 -1,3
Transport, storage and communication 178 801 178 367 183 653 3,0 2,7
Real estate and other business services, excluding financial intermediation and insurance
246 102 247 865 252 491 1,9 2,6
Community, social and personal services, excluding government institutions
53 959 46 260 44 898 -2,9 -16,8
All industries 2 057 217 2 087 851 2 100 620 0,6 2,1
Table D – Turnover by industry and percentage contribution1
Industry
September 2015 December 2015
R million %
total turnover
R million %
total turnover
Mining and quarrying industry 130 644 6,3 133 847 6,4
Manufacturing industry 603 222 28,9 607 576 28,9
Electricity, gas and water supply industry 61 368 2,9 49 828 2,4
Construction industry 109 036 5,2 107 999 5,1
Trade industry 711 089 34,1 720 328 34,3
Transport, storage and communication industry 178 367 8,5 183 653 8,7
Real estate and other business services industry, excluding financial intermediation and insurance
247 865 11,9 252 491 12,0
Community, social and personal services industry, excluding government institutions
46 260 2,2 44 898 2,1
All industries 2 087 851 100,0 2 100 620 100,0
1The aggregates of the SIC contributions may not add up to totals due to rounding-off.
Statistics South Africa 29 P0044
Quarterly financial statistics, December 2015
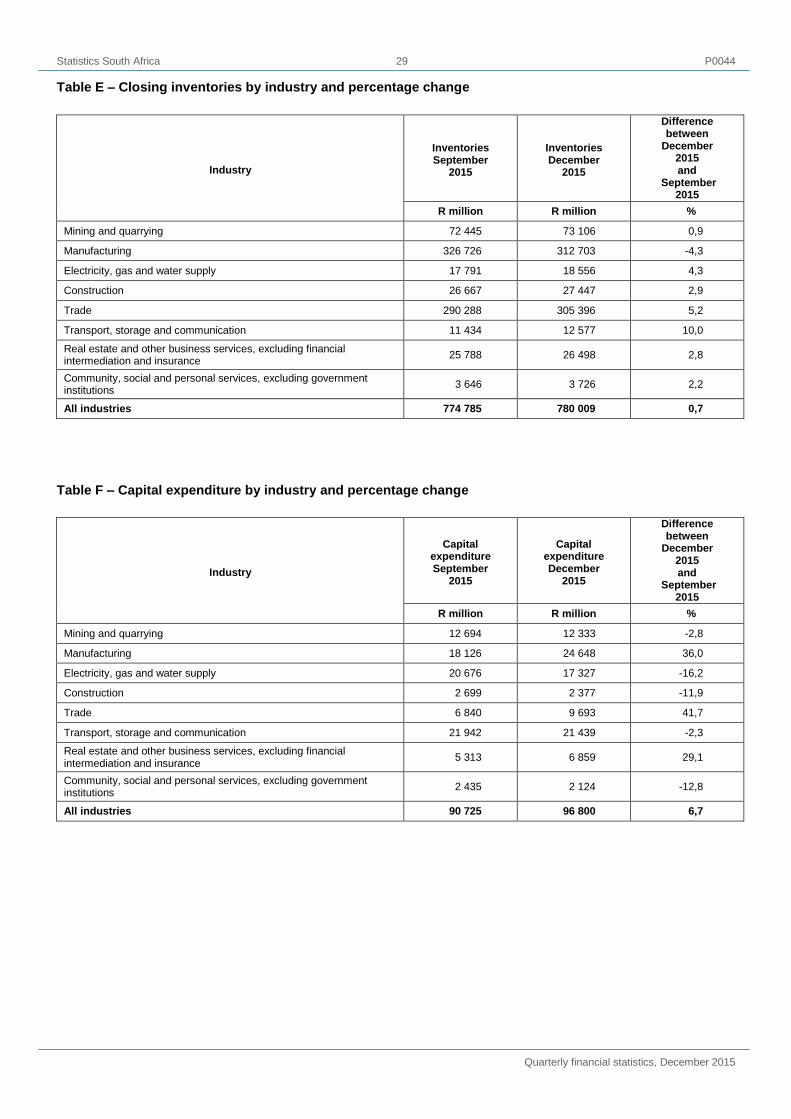
Table E – Closing inventories by industry and percentage change
Industry
Inventories September
2015
Inventories December
2015
Difference between
December 2015 and
September 2015
R million R million %
Mining and quarrying 72 445 73 106 0,9
Manufacturing 326 726 312 703 -4,3
Electricity, gas and water supply 17 791 18 556 4,3
Construction 26 667 27 447 2,9
Trade 290 288 305 396 5,2
Transport, storage and communication 11 434 12 577 10,0
Real estate and other business services, excluding financial intermediation and insurance
25 788 26 498 2,8
Community, social and personal services, excluding government institutions
3 646 3 726 2,2
All industries 774 785 780 009 0,7
Table F – Capital expenditure by industry and percentage change
Industry
Capital expenditure September
2015
Capital expenditure December
2015
Difference between
December 2015 and
September 2015
R million R million %
Mining and quarrying 12 694 12 333 -2,8
Manufacturing 18 126 24 648 36,0
Electricity, gas and water supply 20 676 17 327 -16,2
Construction 2 699 2 377 -11,9
Trade 6 840 9 693 41,7
Transport, storage and communication 21 942 21 439 -2,3
Real estate and other business services, excluding financial intermediation and insurance
5 313 6 859 29,1
Community, social and personal services, excluding government institutions
2 435 2 124 -12,8
All industries 90 725 96 800 6,7
Statistics South Africa 30 P0044
Quarterly financial statistics, December 2015
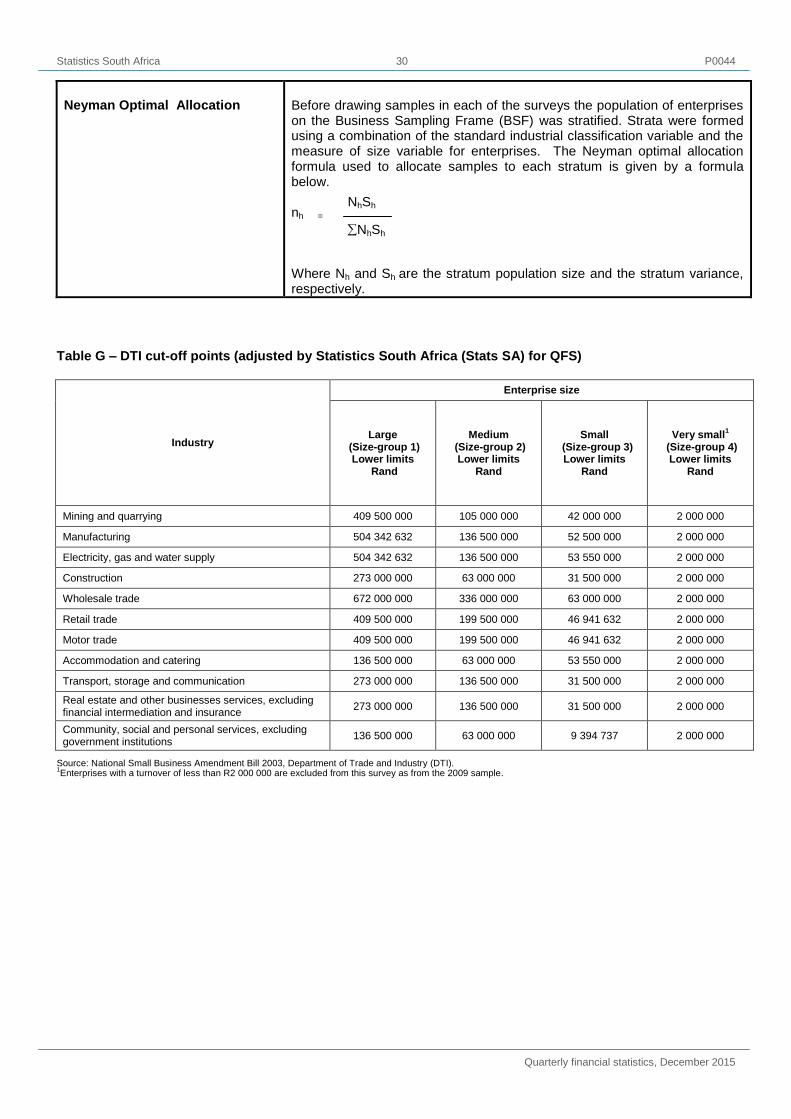
Neyman Optimal Allocation
Before drawing samples in each of the surveys the population of enterprises on the Business Sampling Frame (BSF) was stratified. Strata were formed using a combination of the standard industrial classification variable and the measure of size variable for enterprises. The Neyman optimal allocation formula used to allocate samples to each stratum is given by a formula below. nh = Where Nh and Sh are the stratum population size and the stratum variance, respectively.
Table G – DTI cut-off points (adjusted by Statistics South Africa (Stats SA) for QFS)
Industry
Enterprise size
Large (Size-group 1)
Lower limits Rand
Medium (Size-group 2) Lower limits
Rand
Small (Size-group 3)
Lower limits Rand
Very small1
(Size-group 4) Lower limits
Rand
Mining and quarrying 409 500 000 105 000 000 42 000 000 2 000 000
Manufacturing 504 342 632 136 500 000 52 500 000 2 000 000
Electricity, gas and water supply 504 342 632 136 500 000 53 550 000 2 000 000
Construction 273 000 000 63 000 000 31 500 000 2 000 000
Wholesale trade 672 000 000 336 000 000 63 000 000 2 000 000
Retail trade 409 500 000 199 500 000 46 941 632 2 000 000
Motor trade 409 500 000 199 500 000 46 941 632 2 000 000
Accommodation and catering 136 500 000 63 000 000 53 550 000 2 000 000
Transport, storage and communication 273 000 000 136 500 000 31 500 000 2 000 000
Real estate and other businesses services, excluding financial intermediation and insurance
273 000 000 136 500 000 31 500 000 2 000 000
Community, social and personal services, excluding government institutions
136 500 000 63 000 000 9 394 737 2 000 000
Source: National Small Business Amendment Bill 2003, Department of Trade and Industry (DTI). 1Enterprises with a turnover of less than R2 000 000 are excluded from this survey as from the 2009 sample.
NhSh
NhSh
Statistics South Africa 31 P0044
Quarterly financial statistics, December 2015
Explanatory notes
Introduction 1 Stats SA conducts a quarterly sample survey to collect a range of financial
statistics in respect of enterprises in the formal business sector of the South
African economy, excluding agriculture, hunting, forestry and fishing and financial
intermediation and insurance and government institutions. This statistical release
presents a selection of key findings and tables from Stats SA’s Quarterly Financial
Statistics (QFS) survey for the December 2014, March, June, September and
December 2015 quarters which examines key variables as required by the
Systems of National Accounts (SNA) 2008, and are mentioned below:
turnover;
interest received and paid;
dividends received and dividends payable;
royalties, franchise fees, copyright, trade names and trade and patent rights
received and paid;
income and expenditure in respect of rental/leasing of land, buildings and
other structures, including payments for water and electricity services;
income and expenditure in respect of hiring/leasing of plant, machinery,
vehicles and other equipment;
employment costs;
profit and loss on assets/investments sold or revalued;
depreciation provided for;
purchases;
other income and other expenditure;
total income and total expenditure;
net profit or loss before providing for company tax and dividends;
company tax;
carrying value of property, plant and equipment at the end of the quarter;
inventories as at the beginning and end of the quarter; and
capital expenditure on new property, plant and equipment at the end of the
quarter.
2 The statistical release also contains accounting ratios derived from estimates of
selected key variables.
3 In order to improve timeliness of the publication, some information for the current
quarter may have been estimated due to late or non-submission by respondents.
These estimates are revised as soon as the actual information is available.
4 Additional information regarding estimates of small, medium and large enterprises
by industry per variable for the quarters ended September 2015 and
December 2015 is available on the Stats SA website and can also be made
available on request.
Purpose of the
survey
5 The QFS survey covers a sample of enterprises operating in the formal non-
agricultural business sector of the South African economy, excluding financial
intermediation, insurance and government institutions. Results of the survey are
used in compiling estimates of the Gross Domestic Product (GDP) and its
components, which in turn are used to develop and monitor government policy.
Statistics South Africa 32 P0044
Quarterly financial statistics, December 2015
These statistics are also used by the private sector in analysis of comparative
business and industry performance. The results are published quarterly in
statistical release P0044: Quarterly financial statistics.
Scope of the
survey
6 This survey covers financial statistics of the following industries according to the
Standard Industrial Classification of All Economic Activities (SIC), Fifth edition,
January 1993:
mining and quarrying industry;
manufacturing industry;
electricity, gas and water supply industry;
construction industry;
trade industry;
transport, storage and communication industry;
real estate and business services industry, excluding financial intermediation
and insurance; and
community, social and personal services industry, excluding government
institutions.
Classification 7 The 1993 edition of the Standard Industrial Classification of All Economic Activities
(SIC), Fifth edition, January 1993, was used to classify the statistical units in the
survey. The SIC is based on the 1990 International Standard Industrial
Classification of All Economic Activities (ISIC) with suitable adaptations for local
conditions. Statistics in this publication are only presented at SIC major division
(one digit) level. Each enterprise is classified to an industry which reflects the
predominant activity of the enterprise. Estimates on lower digits SIC can be made
available on request.
Statistical unit 8 For the purpose of this publication, the statistical unit in the quarterly financial
statistics survey is the enterprise. An enterprise is defined as a legal unit or a
combination of legal units that includes and directly controls all functions
necessary to carry out its production activities. The statistical units are derived
from and linked to the South African Revenue Service (SARS) value added tax
(VAT) administrative data.
Survey
methodology and
design
9 The survey is conducted on a quarterly basis. Questionnaires are sent to a sample
of approximately 5 000 enterprises. Questionnaires have to be returned to Stats
SA within two weeks after the end of the quarter concerned. Fax, telephone and
electronic reminders are used to follow up on non-responding enterprises.
10 Samples are normally drawn each year and the resulting level changes in
estimates are indicated when the new sample is implemented. A new sample was
drawn in 2015 and implemented from the September 2015 quarter onwards.
11 The sample was drawn from a population of enterprises that contributed
approximately 95% to the total turnover per industry. Adjustments are made to the
estimates to account for enterprises contributing less than 5% of the total turnover
within each industry. All enterprises are stratified by type of enterprise according to
size groups based on the National Small Business Amendment Bill, 2003, size
group allocations for industries as defined in the Standard Industrial Classification
Statistics South Africa 33 P0044
Quarterly financial statistics, December 2015
of All Economic Activities (SIC), Fifth edition, January 1993. All large enterprises,
which comprise 51% of the number of enterprises in the sample, are completely
enumerated, while simple random sampling is applied for medium sized, small and
very small enterprises. Enterprises with a VAT turnover of less than R2 000 000
are excluded from this survey. The data reported by the enterprises in the sample
are weighted to represent all enterprises in the population.
Reliability of
estimates
12 Data presented in this publication are based on information obtained from a
sample of enterprises and are, therefore, subject to sampling variability, that is, the
data may differ from the figures that would have been produced if the data had
been obtained from all enterprises in the different industries in South Africa,
inaccuracies of this kind are referred to as sampling errors. See Tables A and B
(page 27) to determine the extent that estimates may vary.
13 Inaccuracies may occur because of imperfections in reporting by enterprises and
errors made with the collection and processing of the data. Inaccuracies of this
kind are referred to as non-sampling errors. Every effort is made to minimise non-
sampling errors by designing the questionnaire carefully, conducting pilot studies,
editing of data and the implementation of efficient operating procedures.
Preliminary figures are indicated in the relevant tables.
Reasons for
fluctuations in
data
14 The fluctuations in the data can be attributed to:
revisions to previous quarters made in the event of new or revised information
being furnished by the respondents;
restructuring of large businesses;
exchange rate fluctuations;
restating of previous estimates due to International Financial Reporting
Standards (IFRS);
once-off items reflected in one or more quarters, but not reflected in other
quarters;
year-end adjustments performed during the last quarter of the financial year;
seasonal factors;
items declared annually and not quarterly;
samples drawn annually (see paragraph 10 on page 32); and
response rates per industry and within sub sectors.
Standard error 15 The estimates in this publication are based on a sample drawn from units in the
surveyed population. The entire population is not surveyed. The published
estimates are subject to sampling error. The most common way of quantifying
such sampling error is to calculate the standard error for the published estimate or
statistic (see page 27, Tables A and B).
Revised figures 16 The revised figures are due to respondents reporting revisions or corrections in
their figures and late submissions of their data to Stats SA. Editing of data occurs
at individual enterprise level.
Reference period
17 The reference period for this publication is from 1 October 2015 to
31 December 2015.
Statistics South Africa 34 P0044
Quarterly financial statistics, December 2015
Related
publications
18
Users may also wish to refer to the following publications which are available from
Stats SA:
Annual financial statistics (P0021);
Bulletin of Statistics – issued quarterly;
Gross domestic product (P0441) – issued quarterly and annually;
Manufacturing: Production and sales (P3041.2) – issued monthly;
Mining: Production and sales (P2041) – issued monthly;
Motor trade sales (P6343.2) – issued monthly;
Quarterly employment statistics (P0277);
Retail trade sales (P6242.1) – issued monthly;
South African Statistics – issued annually; and
Wholesale trade sales (P6141.2) – issued monthly.
Rounding-off of
figures
19 The figures in the tables have, where necessary, been rounded off to the nearest
three digits shown.
Comparison of
results with
Quarterly
Employment
Statistics (QES)
survey
20 Employment costs estimates produced in this publication are based on information
as defined by the International Accounting Standards 19 (IAS19) from an
accounting perspective. The Quarterly employment statistics (QES) survey
produces estimates for employment and earnings from a payroll perspective.
The differences between the QFS employment costs and QES earnings can be
attributed, but not limited, to the following factors:
accounting and payroll timing differences in the recognition of employment-
related transactions. The QFS employment costs are recognised on an accrual
basis while the QES earnings are recognised on a cash basis;
classification differences between surveys;
changes in accounting standards (International Financial Reporting Standards
(IFRS) revisions in the QFS);
different sampling frames;
different sampling methodology and sampling specifications;
information sources (information from the payroll administrator vs. information
from the accounting officer); and
restructuring of businesses.
Adjustment of DTI
cut-off points
21 The DTI cut-off points sourced from the National Small Business Amendment Bill
2003 have been raised by a factor of 10,5 to comply with sample specifications.
Statistics South Africa 35 P0044
Quarterly financial statistics, December 2015
Symbols and
abbreviations
22
AFS
BSF
DTI
GDP
IAS
IFRS
ISIC
QES
QFS
RSE
SARS
SE
SIC
Stats SA
VAT
..
Annual financial statistics
Business Sampling Frame
Department of Trade and Industry
Gross domestic product
International Accounting Standards
International Financial Reporting Standards
International Standard Industrial Classification
Quarterly employment statistics
Quarterly financial statistics
Relative Standard Error
South African Revenue Service
Standard Error
Standard Industrial Classification of All Economic Activities
Statistics South Africa
Value-added tax
Not available
Technical enquiries
Krisseelan Govinden Tel: (012) 310 4651 Email: [email protected]
Khathutshelo Raluombe
Tel: (012) 310 8904 Email: [email protected]
Statistics South Africa 36 P0044
Quarterly financial statistics, December 2015
Glossary
Capital expenditure
on property, plant and
equipment
Capital expenditure on property, plant and equipment includes:
erection of new buildings and works, additions to and alterations of existing
buildings and works, whether payments were made to outside contractors
or concerns, or work done by the enterprise itself;
work in progress capitalised; and
new plant and machinery, vehicles and equipment.
Carrying value of
property, plant and
equipment
Carrying value of property, plant and equipment at the end of the quarter
includes:
land;
residential buildings and non-residential buildings;
construction works, roads and parking areas;
computers and other IT equipment;
motor vehicles and other transport equipment; and
plant, machinery, furniture, fittings and other office equipment.
Company tax Company tax brought into account consists of taxes on incomes, profits and
capital gains, excluding value-added tax (VAT). They are assessed on the
actual or presumed incomes of enterprises and exclude employees’ taxes,
deferred tax and compulsory loan levies.
Employment costs Employment/staff costs according to IAS 19 are costs incurred in exchange for
services rendered by employees. These costs are divided into four categories:
short-term employee benefits, post-employment benefits, other long-term
employee benefits and termination benefits.
Employment costs include (among other types of employment benefits):
wages and salaries;
compensated absences (paid vacation and sick leave);
commissions paid;
profit sharing plans;
bonuses;
medical and life insurance benefits during employment;
housing benefits;
free or subsidised goods or services given to employees;
pension benefits;
post-employment medical and life insurance benefits;
long-service or sabbatical leave;
jubilee' benefits;
deferred compensation programmes;
severance, termination and redundancy payments to staff; and
other employee-related costs not mentioned above.
Statistics South Africa 37 P0044
Quarterly financial statistics, December 2015
Enterprise
An enterprise is a legal unit or a combination of legal units that includes and
directly controls all functions necessary to carry out its production activities.
Establishment An establishment is defined as an enterprise or part of an enterprise that is
situated at a single location and in which only a single (non-ancillary) productive
activity is carried out or in which the principal productive activity accounts for
most of the value added.
Industry An industry consists of a group of enterprises engaged in the same or similar
kinds of economic activity, and is classified according to the Standard Industrial
Classification of All Economic Activities (SIC), Fifth edition, January 1993.
International Financial
Reporting Standards
(IFRS)
International Financial Reporting Standards (IFRS) are international accounting
standards stating how particular types of transactions and other events should
be reported in financial statements. IFRS are issued by the Accounting
Standards Board. The purpose of IFRS is to improve transparency and
comparability within financial reporting and introduce consistency in accounting.
Inventories Inventories consist of:
Outputs that are held by the enterprise that produced them prior to their
being further processed, sold, delivered to other units or used in other
ways.
Products acquired from other enterprises that are intended to be used for
intermediate consumption or for resale without further processing (factored
goods).
Raw materials consist of components for processing, packing materials, fuel,
consumable and maintenance stores.
Work in progress consists of goods in the process of manufacturing or work that
has been partially done, but which has not yet been completed at the beginning
and end of the quarter.
Finished goods include manufactured goods by own manufacturers and goods
not produced by the enterprise but purchased for resale, not sold at the
beginning and end of the quarter.
Net profit or loss Net profit or loss before drawings by proprietors or partners, company tax paid
or provided for and dividends paid or provided for are taken into account is
calculated as total income minus opening inventories plus closing inventories
less total expenditure.
Statistics South Africa 38 P0044
Quarterly financial statistics, December 2015
Purchases
Purchases includes:
raw materials, components, etc, used in production;
fuels;
spare parts and building materials; and
purchases and transfers-in of factored goods, intermediate products and
partially completed goods from related enterprises.
Purchases excludes:
subcontract and commission expenses;
motor vehicle running expenditure, including parts and fuel;
purchases of materials capitalised for “capital work done” by own
employees; and
containers and packaging materials.
Turnover
Turnover refers to the following items for all industries, excluding real estate
and other business services (excluding financial intermediation and insurance):
value of sales;
amounts received for work done; and
amounts received for services rendered.
Turnover refers to the following items for the real estate and other business
services industry (excluding financial intermediation and insurance):
value of sales;
amounts received for work done;
amounts received for services rendered;
interest received;
rent and or lease payments received for land and buildings; and
rent, leasing and hiring received for machinery, vehicles and other
equipment.
Turnover excludes:
value-added tax (VAT); and
net profit or loss on sales or revaluation of fixed assets (including profit or
loss on foreign exchange).
Value-added tax
VAT is an indirect tax based on consumption of goods and services in the
economy.
Statistics South Africa 39 P0044
Quarterly financial statistics, December 2015
General information
Stats SA publishes approximately 300 different statistical releases each year. It is not economically viable to
produce them in more than one of South Africa's eleven official languages. Since the releases are used
extensively, not only locally but also by international economic and social-scientific communities, Stats SA releases
are published in English only.
Stats SA has copyright on this publication. Users may apply the information as they wish, provided that they
acknowledge Stats SA as the source of the basic data wherever they process, apply, utilise, publish or distribute
the data, and also that they specify that the relevant application and analysis (where applicable) result from their
own processing of the data.
Stats SA products
A complete set of Stats SA publications is available at the Stats SA Library and the following libraries:
National Library of South Africa, Pretoria Division
National Library of South Africa, Cape Town Division
Natal Society Library, Pietermaritzburg
Library of Parliament, Cape Town
Bloemfontein Public Library
Johannesburg Public Library
Eastern Cape Library Services, King William’s Town
Central Regional Library, Polokwane
Central Reference Library, Mbombela
Central Reference Collection, Kimberley
Central Reference Library, Mmabatho
Stats SA also provides a subscription service.
Electronic services
A large range of data is available via online services. For more details about our electronic services, contact Stats
SA’s user information service at (012) 310 8600.
You can visit us on the Internet at: www.statssa.gov.za
Enquiries
User information services Telephone number: (012) 310 8600
Email address: [email protected]
Orders/subscription services Telephone number: (012) 310 8044
Email address: [email protected]
Postal address: Private Bag X44, Pretoria, 0001
Produced by Stats SA