Quarterly Economic Review - Central Bank of The … Quarterly Economic Review is a publication of...
34
Quarterly Economic Review December, 2013 Vol. 22, No. 4
Transcript of Quarterly Economic Review - Central Bank of The … Quarterly Economic Review is a publication of...

QuarterlyEconomic
Review
December, 2013
Vol. 22, No. 4

The Quarterly Economic Review is a publication of The Central Bank of The Bahamas, prepared by The Research Department for issue in March, June, September and December. It replaces the former Quarterly Review which was last published for March 1992. All correspondence pertaining to the Economic Review should be addressed to:
The ManagerResearch Department
The Central Bank of The BahamasP. O. Box N-4868Nassau, Bahamas
www.centralbankbahamas.comemail address: [email protected]

QUARTERLY ECONOMIC REVIEWVolume 22, No. 4December, 2013
C O N T E N T S
PAGE
1. REVIEW OF ECONOMIC AND FINANCIAL DEVELOPMENTS
DOMESTIC ECONOMIC DEVELOPMENTS 1
FISCAL OPERATIONS 1
REAL SECTOR 3
TOURISM 3CONSTRUCTION 4EMPLOYMENT 5PRICES 5
MONEY, CREDIT & INTEREST RATES 6
CAPITAL MARKETS DEVELOPMENTS 10
INTERNATIONAL TRADE & PAYMENTS 11
INTERNATIONAL ECONOMIC DEVELOPMENTS 12
2. STATISTICAL APPENDIX (TABLES 1-16) 14

REVIEW OF ECONOMIC AND FINANCIAL DEVELOPMENTS
D O M E S T I C E C O N O M I C DE V E L O P M E N T S
Indications are that domestic economic conditions were relatively flat during the fourth quarter of 2013, as the ongoing positive contribution from foreign-led con-struction investment activity was counterbalanced by weakness in the high value-added stopover component of the tourism market. With gains mostly in the construction sector, employment conditions improved slightly, while domestic inflation remained relatively benign, despite modest firming in international oil prices.
Based on provisional data for the second quarter of FY2013/14, the Government’s overall deficit narrowed, as a combination of lower lending to the public corporations and capital outlays reduced aggregate expenditure, countering the falloff in overall revenues. Financing for the deficit was sourced primarily from the domestic market in foreign currency.
In the monetary sector, both bank liquidity and ex-ternal reserves strengthened over the three-month peri-od, bolstered by the Government’s foreign currency borrowing activities. However, the persistence of high unemployment and subdued business conditions––which constrained borrowers’ capacity to service their debts––resulted in a further deterioration in banks’ asset quality indicators. Banks’ overall profitability, however, in-creased in the three-months to September, due to de-clines in interest expense and bad debt provisions.
On the external side, the current account deficit wid-ened in the fourth quarter, reflecting a deterioration in the merchandise trade deficit, associated with elevated outlays for construction services and reduced net inflows from tourism. The capital and financial account surplus stabilized over the review period, as an increase in pro-ject loan financing proceeds compensated for a reduction in direct investment inflows.
F I S C A L O P E R A T I O N S
OVERVIEW
Based on preliminary estimates for the second quar-ter of FY2013/14, the overall deficit narrowed by 10.4% ($13.0 million) to $112.3 million relative to the compara-tive period of FY2012/13. This outturn reflected a 5.0% ($24.8 million) contraction in aggregate spending to $468.5 million, primarily linked to a significant reduction in net lending to public sector entities, which outweighed a 3.2% ($11.8 million) decrease in total revenue to $356.2 million.
REVENUE
Tax receipts, at 79.0% of total collections, fell by 9.3% ($29.0 million) to $281.4 million—due in large measure to a 46.7% ($20.7 million) reduction in departure taxes to $23.6 million, back to trend levels, following last year’s one-off receipt of arrears payments. In addition, a timing-related decline in foreign realty tax collections, reduced property taxes by 22.5% ($11.0 million) to $37.7 million, and lower proceeds from hotel occupancy and gaming taxes explained the more than halving of selec-tive taxes on services to $4.8 million. International trade & transaction taxes also decreased, by 3.0% ($4.6 mil-lion) to $147.1 million, associated with declines in stamp taxes from imports ($4.3 million) and excise taxes ($4.2 million), which negated gains in export ($2.1 million) and import ($1.8 million) taxes. More muted decreases were posted for business and professional license fees ($0.4 million) and motor vehicle taxes ($0.1 million). In a partial offset, other “unallocated” tax receipts increased more than three-fold to $14.2 million, while non-trade related stamp taxes grew by 16.0% ($5.1 million) to $36.7 million.
Non-tax receipts—which constituted 21.0% of total revenue—expanded by $17.1 million (29.6%) to $74.7 million. Income from other miscellaneous sources ad-vanced by $17.6 million to $41.3 million, supported by increased dividend payments from a major utility, while
1
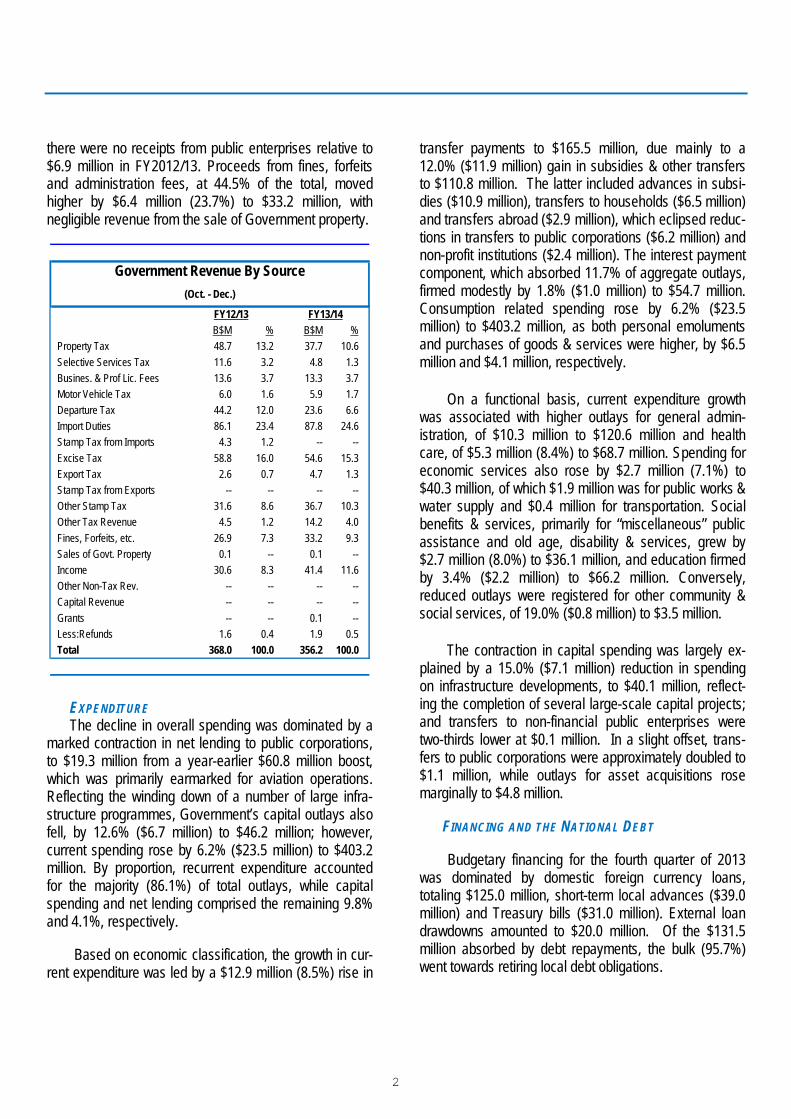
there were no receipts from public enterprises relative to $6.9 million in FY2012/13. Proceeds from fines, forfeits and administration fees, at 44.5% of the total, moved higher by $6.4 million (23.7%) to $33.2 million, with negligible revenue from the sale of Government property.
B$M % B$M %
Property Tax 48.7 13.2 37.7 10.6
Selective Services Tax 11.6 3.2 4.8 1.3
Busines. & Prof Lic. Fees 13.6 3.7 13.3 3.7
Motor Vehicle Tax 6.0 1.6 5.9 1.7
Departure Tax 44.2 12.0 23.6 6.6
Import Duties 86.1 23.4 87.8 24.6
Stamp Tax from Imports 4.3 1.2 -- --
Excise Tax 58.8 16.0 54.6 15.3
Export Tax 2.6 0.7 4.7 1.3
Stamp Tax from Exports -- -- -- --
Other Stamp Tax 31.6 8.6 36.7 10.3
Other Tax Revenue 4.5 1.2 14.2 4.0
Fines, Forfeits, etc. 26.9 7.3 33.2 9.3
Sales of Govt. Property 0.1 -- 0.1 --
Income 30.6 8.3 41.4 11.6
Other Non-Tax Rev. -- -- -- --
Capital Revenue -- -- -- --
Grants -- -- 0.1 --
Less:Refunds 1.6 0.4 1.9 0.5
Total 368.0 100.0 356.2 100.0
FY12/13 FY13/14
Government Revenue By Source
(Oct. - Dec.)
EXPENDITURE
The decline in overall spending was dominated by a marked contraction in net lending to public corporations, to $19.3 million from a year-earlier $60.8 million boost,which was primarily earmarked for aviation operations. Reflecting the winding down of a number of large infra-structure programmes, Government’s capital outlays also fell, by 12.6% ($6.7 million) to $46.2 million; however, current spending rose by 6.2% ($23.5 million) to $403.2 million. By proportion, recurrent expenditure accountedfor the majority (86.1%) of total outlays, while capital spending and net lending comprised the remaining 9.8% and 4.1%, respectively.
Based on economic classification, the growth in cur-rent expenditure was led by a $12.9 million (8.5%) rise in
transfer payments to $165.5 million, due mainly to a 12.0% ($11.9 million) gain in subsidies & other transfers to $110.8 million. The latter included advances in subsi-dies ($10.9 million), transfers to households ($6.5 million) and transfers abroad ($2.9 million), which eclipsed reduc-tions in transfers to public corporations ($6.2 million) and non-profit institutions ($2.4 million). The interest payment component, which absorbed 11.7% of aggregate outlays, firmed modestly by 1.8% ($1.0 million) to $54.7 million. Consumption related spending rose by 6.2% ($23.5 million) to $403.2 million, as both personal emoluments and purchases of goods & services were higher, by $6.5 million and $4.1 million, respectively.
On a functional basis, current expenditure growth was associated with higher outlays for general admin-istration, of $10.3 million to $120.6 million and health care, of $5.3 million (8.4%) to $68.7 million. Spending for economic services also rose by $2.7 million (7.1%) to $40.3 million, of which $1.9 million was for public works & water supply and $0.4 million for transportation. Social benefits & services, primarily for “miscellaneous” public assistance and old age, disability & services, grew by $2.7 million (8.0%) to $36.1 million, and education firmed by 3.4% ($2.2 million) to $66.2 million. Conversely, reduced outlays were registered for other community & social services, of 19.0% ($0.8 million) to $3.5 million.
The contraction in capital spending was largely ex-plained by a 15.0% ($7.1 million) reduction in spending on infrastructure developments, to $40.1 million, reflect-ing the completion of several large-scale capital projects; and transfers to non-financial public enterprises were two-thirds lower at $0.1 million. In a slight offset, trans-fers to public corporations were approximately doubled to $1.1 million, while outlays for asset acquisitions rose marginally to $4.8 million.
FINANCING AND THE NATIONAL DEBT
Budgetary financing for the fourth quarter of 2013 was dominated by domestic foreign currency loans, totaling $125.0 million, short-term local advances ($39.0 million) and Treasury bills ($31.0 million). External loan drawdowns amounted to $20.0 million. Of the $131.5 million absorbed by debt repayments, the bulk (95.7%) went towards retiring local debt obligations.
2

-250.0
-150.0
-50.0
50.0
150.0
250.0
350.0
450.0
550.0
II-12/13 III-12/13 IV-12/13 I-13/14 II-13/14
(B$M)Fiscal Operations
Rev. Exp. Sur./(Def.)
As a consequence of these combined develop-ments, the Direct Charge on the Government expanded by $83.7 million (1.7%) vis-à-vis the previous quarter, and by $576.1 million (13.1%), year-on-year, to $4,971.7 million at end-December, 2013. Bahamian dollar debt represented 73.8% of the total and was held mainly by commercial banks (36.7%), followed by private and institutional investors (29.6%), public corporations (18.7%), the Central Bank (14.8%) and Other Local Financial Institutions (0.2%). By type of instrument, Government securities constituted the largest share of domestic debt, at 80.5%, bearing an average maturity of 11.1 years, with Treasury bills and loans & advances accounting for smaller shares of 15.8% and 3.7%, re-spectively.
During the review period, Government’s guaranteed debt decreased by $15.5 million (0.9%) to $601.1 million. As a result, the National Debt advanced by 1.4% ($78.3 million) relative to the previous quarter, and by 11.5% ($573.8 million) over the year, to $5,572.7 million at end-December, 2013.
PUBLIC SECTOR FOREIGN CURRENCY DEBT
Public sector foreign currency debt rose by 5.4% ($108.3 million) to $2,127.3 million over the prior quarter, and by 12.6% ($238.5 million) relative to the same period last year, as new drawings of $148.5 million eclipsed amortization payments of $40.5 million. Buoyed by internal foreign currency borrowings, the Government’s outstanding liabilities, which accounted for the major share (61.2%) of the total, increased by 12.0% ($139.5 million) to $1,301.0 million over the quarter; however, the public corporations’ debt stock declined by 3.6% ($31.3 million) to $826.3 million.
Compared to the same period last year, total public sector debt service payments firmed by 53.7% ($28.3 million) to $80.8 million, as scheduled payments by anairport operator more than doubled the public corpora-tions’ portion to $48.9 million. In contrast, the Govern-ment’s portion was modestly lower, by 0.3% ($0.1 million) to $32.0 million—of which $26.3 million represented interest payments. By end-December, Government’s debt service to revenue ratio was 30 basis points higher at 9.0%, and the debt service ratio firmed by 4.2 percentage points to 10.6%, year-on-year.
By credit profile, the largest holders of foreign cur-rency debt were non-resident investors (35.1%), followed by private capital markets (28.2%), commercial banks (21.2%), multilateral institutions (12.8%) and bilateral companies (2.7%). The average age of the outstanding foreign currency debt narrowed to 13.4 years from 15.4 years in 2012, and the bulk (92.5%) of the debt was denominated in US Dollars, with euros and the Chinese Yuan accounting for the remaining 4.8% and 2.7%, respectively.
R E A L S E C T O R
TOURISM
Output in the tourism sector continued to be con-strained by weakness in the high value-added stopover segment of the market, amid increased competition from other regional destinations, a modest reduction in room inventory and the tempered recovery in several key source markets. Total visitor arrivals strengthened by 7.3% to 1.6 million, outpacing the modest year-earlier
3

0.7% increase, with gains dominated by an extended 9.6% hike in sea traffic from last year’s 1.1% expansion. However, the contraction in longer-stay air passengers broadened to 2.5% from 0.7% in the comparative 2012 period.
On a destination basis, visitor arrivals to New Provi-dence grew at a slightly lower rate of 2.5% to 0.9 million, from the prior year’s 2.9%, as a 4.5% hike in sea arrivals contrasted with the 3.3% decrease in the air component. Buoyed by the introduction of a new cruise ship service to a northern island resort, visitors to the Family Islands recovered by 31.3%, from 2012’s 7.0% falloff. This was led by a 33.7% upturn in sea arrivals, alongside a 7.8% gain in the air segment. In contrast, Grand Bahama’s respective declines in air and sea traffic, of 12.5% and 23.6%, resulted in a 22.3% reduction in total arrivals to 0.2 million, relative to a 9.4% expansion last year.
0
200
400
600
800
1,000
1,200
1,400
1,600
1,800
2,000
QIV-12 QI-13 QII-13 QIIl-13 QIV-13
ThousandsVisitor Arrivals
Air Sea Total
Weakness in the stopover segment of the market spilled over into hotel earnings which, according to provi-sional data from a sample of large hotels in New Provi-dence and Paradise Island, showed total room revenues contracting by 6.5% for the review quarter. Based on a reduction in available rooms at a few properties and the
temporary closure of one hotel, the average occupancy rate fell by 4.2 percentage points to 53.1%, offsetting the 2.5% rise in average daily room rate to $217.0.
CONSTRUCTION
During the quarter, construction sector activity con-tinued to be underpinned by the multi-billion dollar Baha Mar project and a number of smaller scale commercial developments in both New Providence and the Family Islands. In contrast, the domestic segment of the market remained subdued, reflecting the challenges faced by consumers in meeting their existing loan obligations, amid the elevated unemployment levels and conservative bank lending practices.
0
5
10
15
20
25
30
0
20
40
60
80
100
120
140
160
QIV-12 QI-13 QII-13 QIII-13 QIV-13V
alue
(B$M
)
Num
ber
Mortgage Commitments:New Construction and Repairs
Num Value
Total mortgage disbursements for new construction and repairs—as reported by commercial banks, insur-ance companies and the Bahamas Mortgage Corpora-tion—fell by 12.3% to $21.4 million, extending last year’s 27.5% reduction. Underlying this outturn, residential mortgages decreased by 11.8% to $21.4 million, vis-à-vis a 19.7% drop in 2012, while disbursements for the com-mercial segment were negligible for the second consecu-tive year.
4

Indications are that activity in the domestic market could improve modestly over the near-term, as mortgage commitments for new buildings and repairs—a forward looking indicator—rose in number, by 4.7% (5) to 111, and in value, by 52.8% ($8.1 million) to $23.3 million. The improvement was solely in the residential segment, as there were no new commitments for the commercial component, compared to two (2) valued at $0.4 million in the preceding year.
In terms of financing, the cost for commercial mort-gages firmed by 10 basis points to 8.5%; however, the average rate on the residential component softened by the same magnitude to 8.1%.
EMPLOYMENT
Based on data from the Department of Statistics’ La-bour Force Survey, employment conditions were slightly improved in the six months ending November 2013. The jobless rate moved lower by 0.8 of a percentage point to 15.4%, in line with the previous year’s contraction, as an additional 2,600 persons became employed. In a sign of improving job prospects, the number of discouraged workers fell by 15.1% (1,205 persons) to 6,765, boosting the labour force participation rate by one percentage point to 73.7%.
A disaggregation by major job centres showed the unemployment rate for New Providence narrowing by 30 basis points to 15.6%, as payrolls firmed by 1,080 per-sons and the number of unemployed persons fell by 320. Similarly, in Grand Bahama, the unemployment rate was modestly lower, by 2.7 percentage points to 16.8%, as an additional 820 persons gained employment and the number of jobless individuals fell by 660.
PRICES
During the review quarter, domestic prices remained relatively benign, although with some significant variability within the Retail Price Index (RPI), which firmed slightly by 5 basis points to 0.77%. Accelerated average price gains were recorded for alcoholic beverages, tobacco & narcotics, to 6.20% from 1.39%; miscellaneous goods & services, to 3.30% from 0.22% and restaurant & hotels, to 3.34% from 0.27%. Similarly, inflation firmed for educa-tion, by 2.21 percentage points to 2.93% and health, by 1.03 percentage points to 2.28%, while average pricehikes for communication (1.61%), recreation & culture,
(4.55%), and transportation (1.90%), represented a reversal from year-earlier respective declines of 5.17%, 1.59%, and 0.74%. These firmings were appreciably countered by contractions in average costs for clothing & footwear and housing, water, gas, electricity & other fuels—the largest component in the Index, by 3.75% and 1.40%, following prior period gains of 0.35% and 1.77%, respectively. In addition, average price accretions slowed for furnishing, household equipment & routine mainte-nance, by 1.5 percentage points to 0.40% and for food & non-alcoholic beverages, by 0.7 of a percentage point to 1.26%.
Items Weight Index % Index %
Food & Non-Alcoholic Beverages 120.4 105.2 1.9 106.5 1.3
Alcohol, Tobacco & Narcotics 6.4 105.0 1.4 111.5 6.2
Clothing & Footwear 37.76 100.7 0.4 96.9 -3.7
Housing, Water, Gas, Electricity 334.83 107.7 1.8 106.2 -1.4
Furn. & Household, Maintenance 64.26 106.8 1.9 107.3 0.4
Health 44.5 104.6 1.3 107.0 2.3
Transportation 119.13 110.6 -0.7 112.7 1.9
Communication 41.19 95.6 -5.2 97.1 1.6
Rec., & Culture 22.73 100.9 -1.6 105.5 4.6
Education 30.05 106.2 0.7 109.4 2.9
Restaurant & Hotels 38.24 105.7 0.3 109.2 3.3
Misc. Goods & Svcs. 140.52 101.7 0.2 105.1 3.3
ALL ITEMS 1000 105.6 0.7 106.4 0.8
Retail Price Index(Annual % Changes)
December
2012 2013
Domestic energy prices posted, on balance, a gen-eral downward trajectory over the fourth quarter. The average cost of gasoline was lower by 4.2% to $5.17 per gallon, although diesel prices rose, on average, by 4.1% to $5.18 per gallon. On an annual basis, the average cost of both gasoline and diesel fell, by 5.3% and 2.0%, respectively. Another important energy cost indicator, the fuel charge levied by the Bahamas Electricity Corporation (BEC), declined by 9.6% over the three-month period, to 23.66¢ per kilowatt hour (kWh), but advanced on anannualized basis by 10.1%.
5
M O N E Y , C R E D I T A N D I N T E R E S T RA T E S
OVERVIEW
Monetary conditions featured growth in both liquidity and external reserves in the fourth quarter, and a contin-uation of subdued lending, as the weakness in employ-ment conditions, as well as private sector demand, limited opportunities for improvement in credit quality indicators. Despite these trends, overall profitability in the banking sector firmed over the third quarter, reflecting a decline in interest costs.
LIQUIDITY
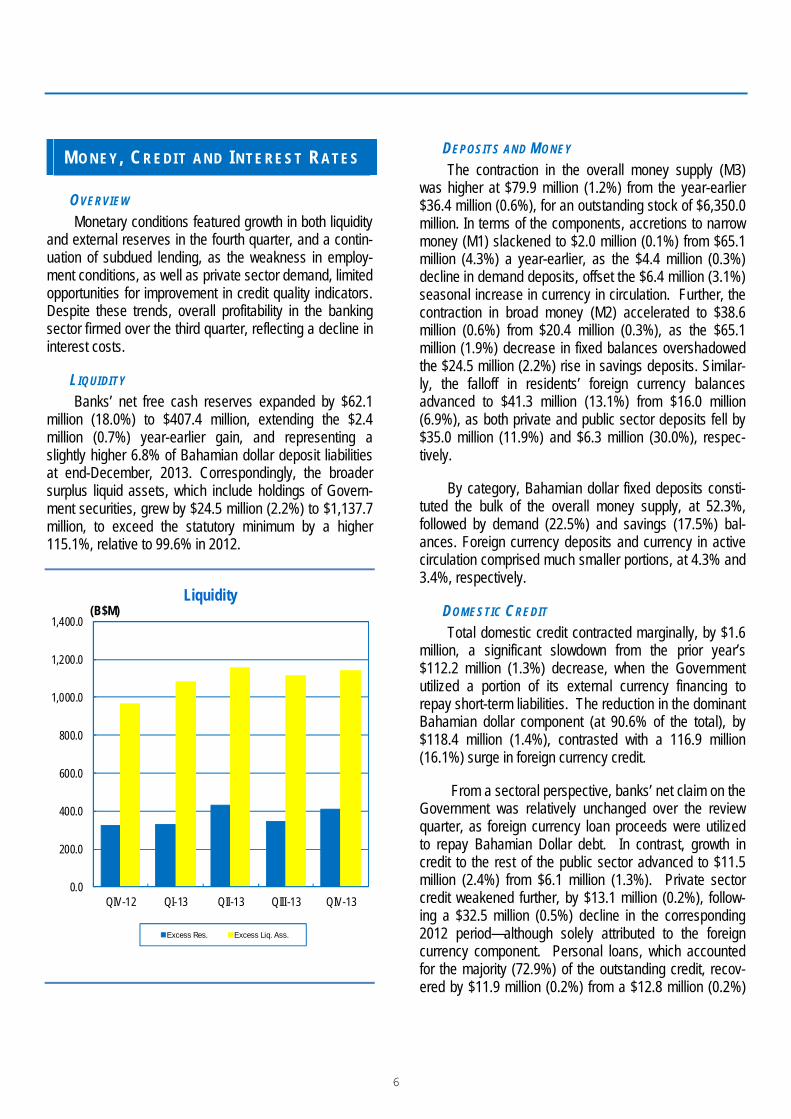
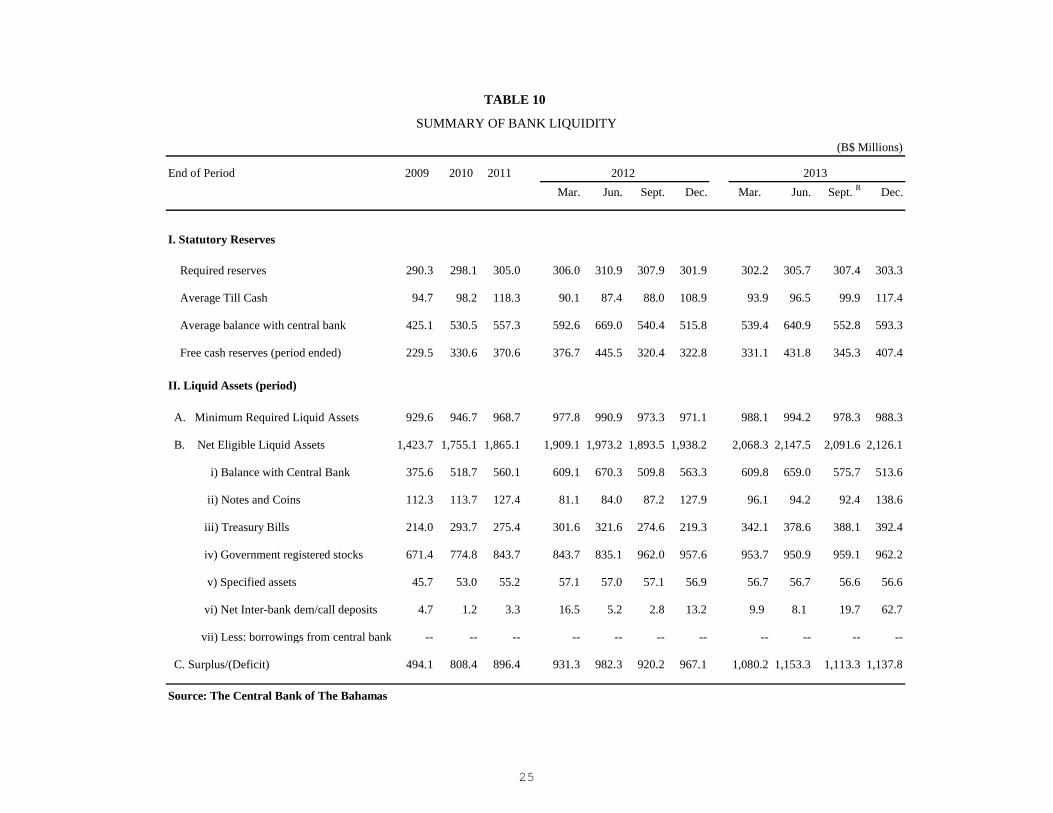
Banks’ net free cash reserves expanded by $62.1 million (18.0%) to $407.4 million, extending the $2.4 million (0.7%) year-earlier gain, and representing a slightly higher 6.8% of Bahamian dollar deposit liabilities at end-December, 2013. Correspondingly, the broader surplus liquid assets, which include holdings of Govern-ment securities, grew by $24.5 million (2.2%) to $1,137.7 million, to exceed the statutory minimum by a higher 115.1%, relative to 99.6% in 2012.
0.0
200.0
400.0
600.0
800.0
1,000.0
1,200.0
1,400.0
QIV-12 QI-13 QII-13 QIII-13 QIV-13
(B$M)Liquidity
Excess Res. Excess Liq. Ass.
DEPOSITS AND MONEY
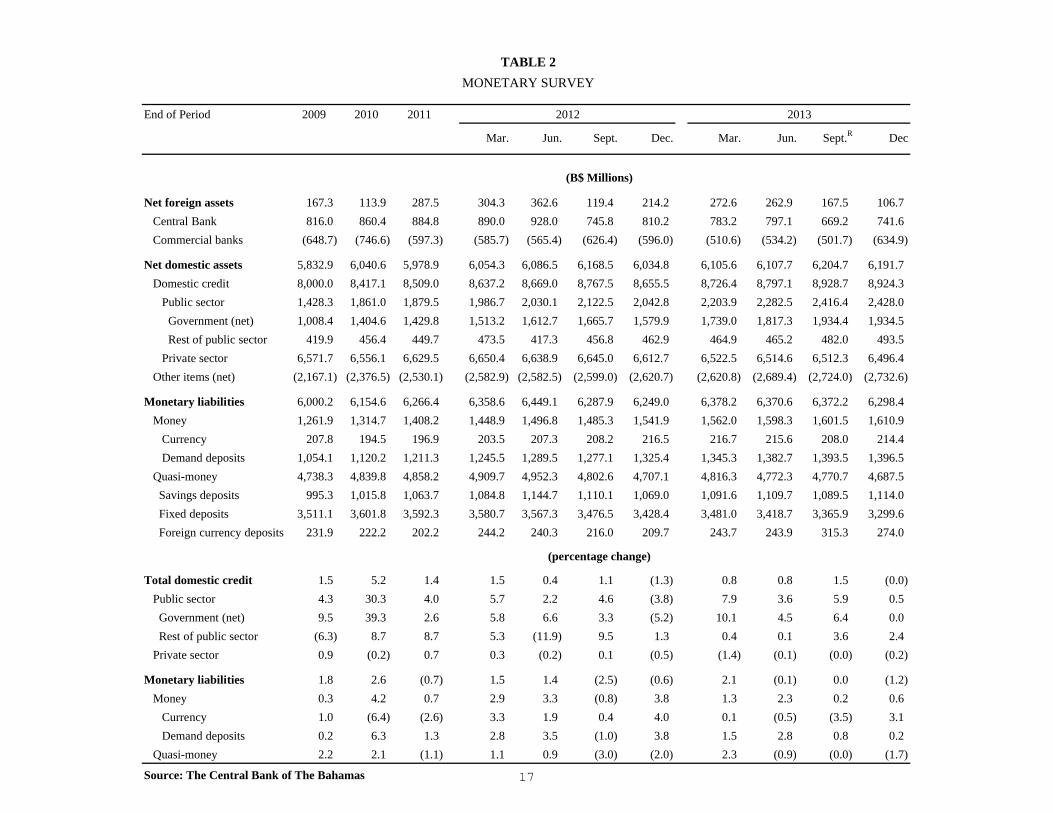
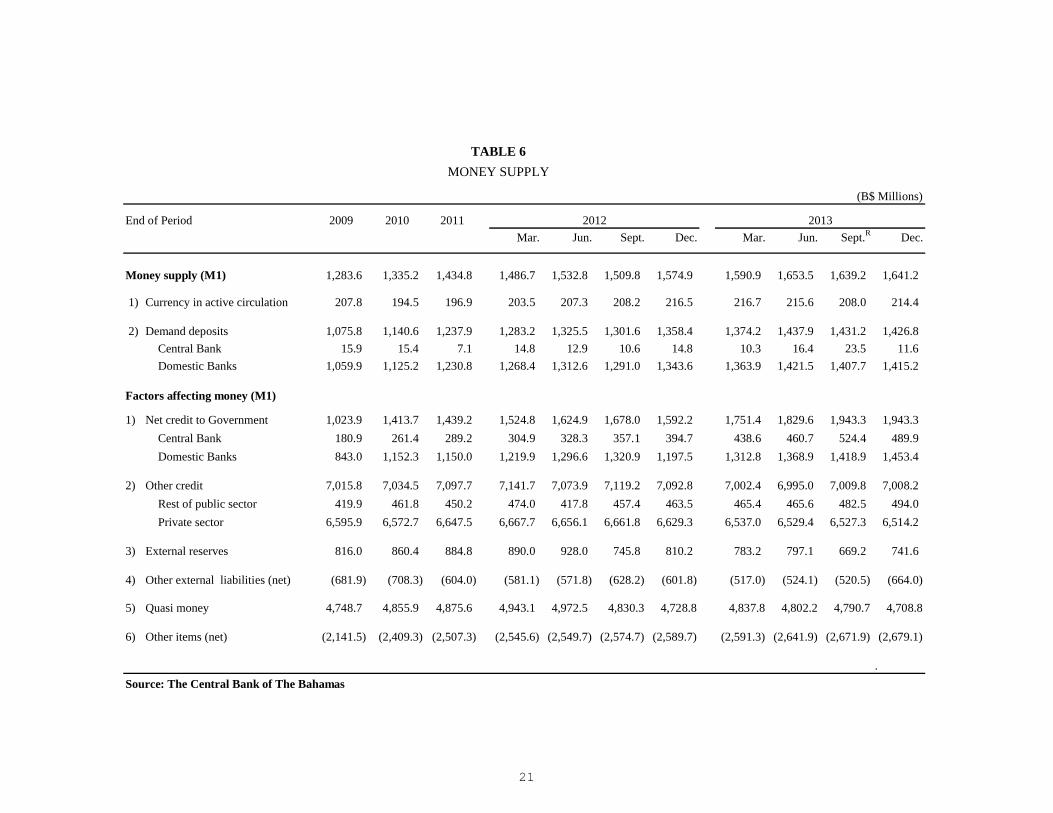
The contraction in the overall money supply (M3) was higher at $79.9 million (1.2%) from the year-earlier $36.4 million (0.6%), for an outstanding stock of $6,350.0 million. In terms of the components, accretions to narrow money (M1) slackened to $2.0 million (0.1%) from $65.1 million (4.3%) a year-earlier, as the $4.4 million (0.3%) decline in demand deposits, offset the $6.4 million (3.1%) seasonal increase in currency in circulation. Further, the contraction in broad money (M2) accelerated to $38.6 million (0.6%) from $20.4 million (0.3%), as the $65.1 million (1.9%) decrease in fixed balances overshadowed the $24.5 million (2.2%) rise in savings deposits. Similar-ly, the falloff in residents’ foreign currency balances advanced to $41.3 million (13.1%) from $16.0 million (6.9%), as both private and public sector deposits fell by $35.0 million (11.9%) and $6.3 million (30.0%), respec-tively.
By category, Bahamian dollar fixed deposits consti-tuted the bulk of the overall money supply, at 52.3%, followed by demand (22.5%) and savings (17.5%) bal-ances. Foreign currency deposits and currency in active circulation comprised much smaller portions, at 4.3% and3.4%, respectively.
DOMESTIC CREDIT
Total domestic credit contracted marginally, by $1.6 million, a significant slowdown from the prior year’s $112.2 million (1.3%) decrease, when the Government utilized a portion of its external currency financing to repay short-term liabilities. The reduction in the dominant Bahamian dollar component (at 90.6% of the total), by $118.4 million (1.4%), contrasted with a 116.9 million (16.1%) surge in foreign currency credit.
From a sectoral perspective, banks’ net claim on the Government was relatively unchanged over the review quarter, as foreign currency loan proceeds were utilized to repay Bahamian Dollar debt. In contrast, growth in credit to the rest of the public sector advanced to $11.5 million (2.4%) from $6.1 million (1.3%). Private sector credit weakened further, by $13.1 million (0.2%), follow-ing a $32.5 million (0.5%) decline in the corresponding 2012 period—although solely attributed to the foreign currency component. Personal loans, which accounted for the majority (72.9%) of the outstanding credit, recov-ered by $11.9 million (0.2%) from a $12.8 million (0.2%)
6

contraction last year. In particular, consumer lending firmed by $24.7 million (1.2%), to negate declines in overdrafts and residential mortgages, of $10.2 million (13.1%) and $1.7 million (0.1%), respectively.
-6.0
-4.0
-2.0
0.0
2.0
4.0
6.0
8.0
10.0
12.0
QIV-12 QI-13 QII-13 QIII-13 QIV-13
(%)
Changes in Credit
Private Govt (net) Rest of Pub.
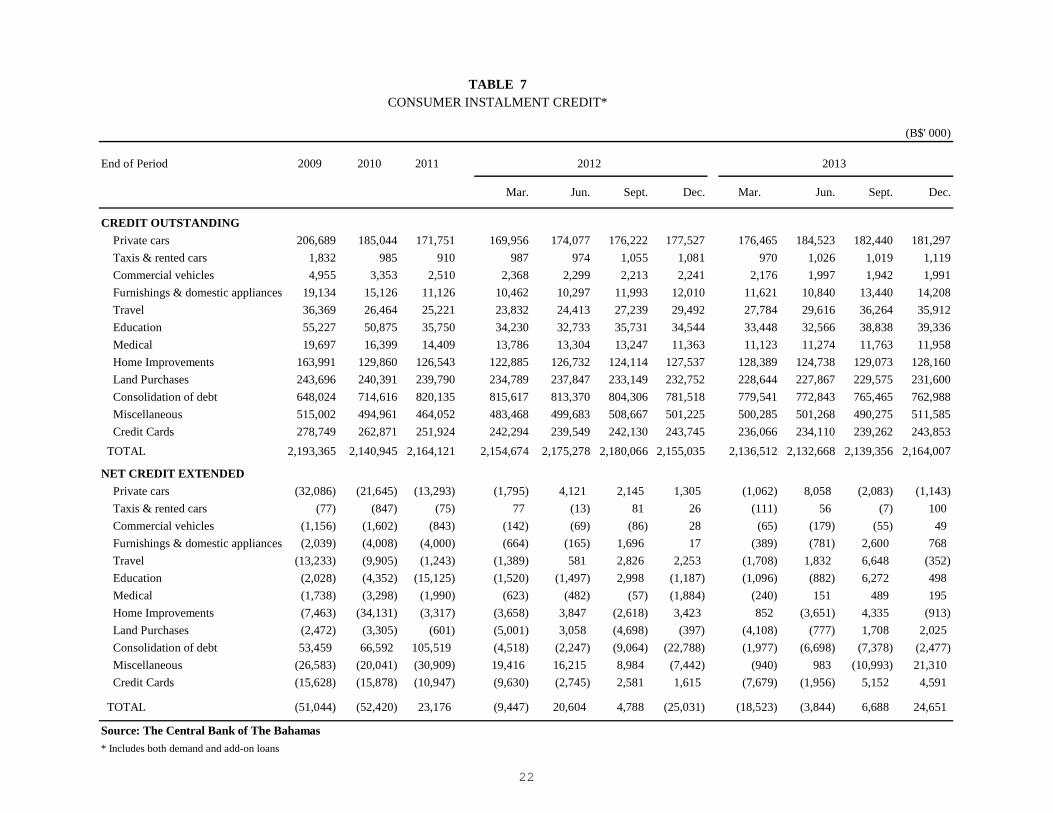
A further breakdown of consumer credit showed that loans for miscellaneous purposes advanced by $21.3 million, while smaller gains were recorded for credit cards and land purchases, of $4.6 million and $2.0 million, respectively. In a partial offset, decreases in lending were registered for debt consolidation ($2.5 million), private car loans ($1.1 million) and home improvement ($0.9 million).
The remaining private sector loan categories showed net repayments for construction ($18.6 million), professional & other services ($10.8 million), distribution ($4.8 million), tourism ($3.9 million), fisheries ($3.1 mil-lion) and transport ($1.9 million). In contrast, significant growth in lending was posted for private financial institu-tions ($9.4 million) and manufacturing ($2.1 million), while the other categories recorded gains of under $2.0 million.
B$M % B$M %
Agriculture 14.3 0.2 13.7 0.2
Fisheries 8.4 0.1 7.0 0.1
Mining & Quarry 2.4 0.0 2.5 0.0
Manufacturing 41.7 0.6 54.2 0.8
Distribution 216.1 3.0 214.9 3.0
Tourism 65.3 0.9 47.2 0.7
Enter. & Catering 64.1 0.9 79.7 1.1
Transport 42.0 0.6 35.1 0.5
Construction 422.2 5.9 401.6 5.6
Government 152.4 2.1 253.6 3.6
Public Corps. 338.5 4.8 369.2 5.2
Private Financial 18.5 0.3 30.6 0.4
Prof. & Other Ser. 116.1 1.6 92.9 1.3
Personal 5,205.7 73.3 5,191.3 72.9
Miscellaneous 398.1 5.6 327.0 4.6
TOTAL 7,106.0 100.0 7,120.4 100.0
Distribution of Bank Credit By Sector
End-December2012 2013
MORTGAGES
According to the latest data reported by banks, in-surance companies and the Bahamas Mortgage Corpora-tion, total mortgages outstanding were slightly higher, by $2.7 million (0.1%) to $3,312.1 million, although below the previous year’s $4.4 million (0.1%) gain. The com-mercial segment was up by $2.4 million (1.2%), to re-verse the year-earlier $7.0 million (3.4%) contraction, while residential mortgages––at 93.8% of the total––stabilized at $3,106.5 million, relative to a $11.4 million (0.4%) gain in 2012. At end-2013, commercial banks held the majority of mortgages outstanding, at 89.0%, with the shares of insurance companies and the Bahamas Mort-gage Corporation at 5.9% and 5.1%, respectively.
THE CENTRAL BANK
Following an expansion of $37.7 million (10.5%) in the final quarter of 2012, the Bank’s net claims on the Government declined by $34.5 million (6.6%) to $489.9 million, underpinned by a reduction in Government paper. Similarly, lower deposit holdings led to a contraction in the Bank’s net liabilities to the public corporations, by $11.9 million (66.2%) to $6.1 million, to contrast with a year-earlier $4.3 million (89.9%) gain. As commercial
7

banks acquired more Government securities, the Bank’s liabilities to this sector decreased by $16.3 million (2.5%) to $646.9 million, behind last year’s $87.9 million (14.8%) growth.
Supported by net proceeds from the Government’s foreign currency loans, external reserves increased by $72.4 million (10.8%) to $741.6 million, extending the prior year’s gain of $64.3 million (8.6%). In the underlying foreign currency transactions, the Bank’s net sale to public corporations was markedly higher at $142.2 mil-lion, from $113.7 million a year earlier, primarily explained by a boost in scheduled debt service payments; and the net sale to commercial banks was approximately doubled to $70.3 million. In contrast, the net purchase from the Government advanced to $248.0 million from $208.6 million.
At end-December, the stock of external reserves was equivalent to an estimated 15.7 weeks of non-oil merchandise imports, relative to 16.0 weeks at end-2012. After adjusting for the 50% statutory requirement on the Bank’s Bahamian dollar liabilities, “useable” reserves fell by $70.9 million to $277.1 million.
400
500
600
700
800
900
Dec-12 Mar-13 Jun-13 Sep-13 Dec-13
(B$M)External Reserves
DOMESTIC BANKS
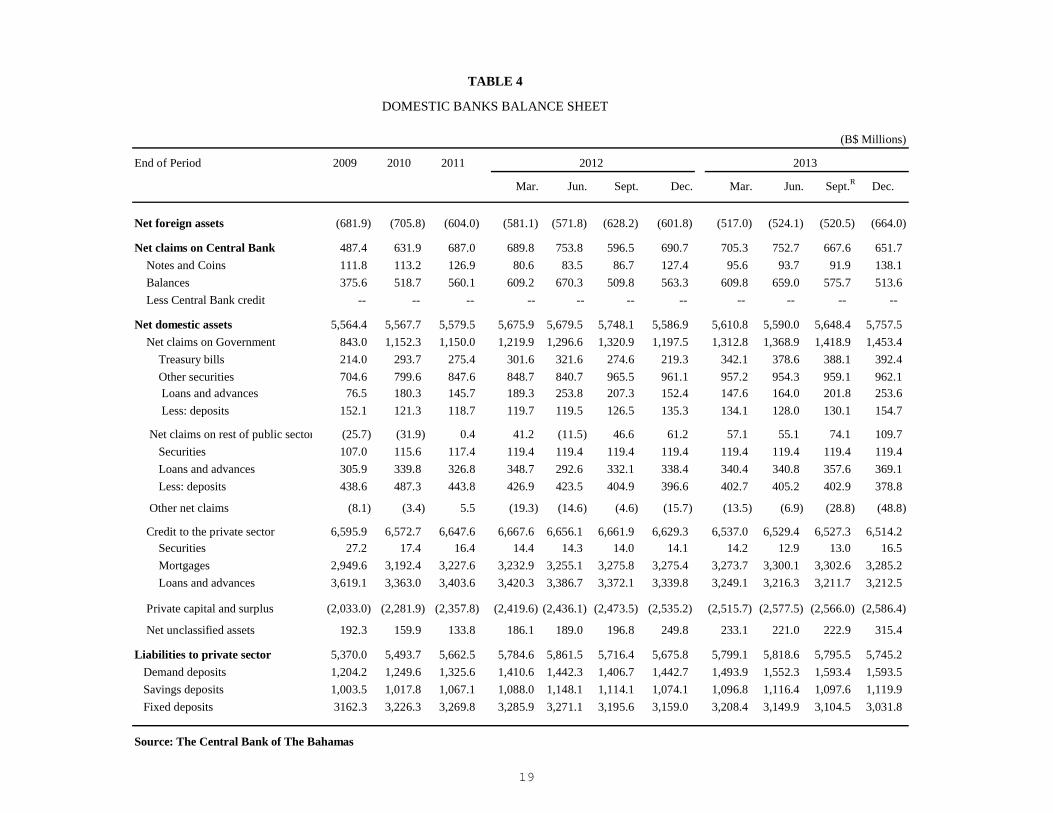
The contraction in banks’ private sector credit was lowered to $13.1 million (0.2%), from $32.5 million (0.5%) in 2012, whereas domestic foreign currency borrowings elevated the net claim on the Government, by $34.6 million (2.4%), in contrast to a $123.4 million (9.3%) external borrowing-led reduction last year. The expan-sion in credit to the rest of the public sector broadened to $11.5 million (2.4%) from 2012’s $6.3 million (1.4%).
In terms of deposits, banks’ liabilities to the private sector fell further, by $50.3 million (0.9%) to $5,745.2 million, relative to last year’s $40.5 million (0.7%) contrac-tion. The majority (95.5%) of deposit liabilities were denominated in Bahamian currency, with private individu-als accounting for the largest share (54.2%), followed by business firms (31.5%), the public sector (5.3%), private financial institutions (4.2%), other entities (3.9%) and public financial institutions (0.9%).
By contractual obligations, fixed deposits comprised the bulk (56.2%) of banks’ deposit liabilities, followed by demand and saving balances, with shares at 25.2% and 18.6%, respectively. Analyzed by range of value and number of accounts, some 88.9% of Bahamian dollar deposits held balances of less than $10,000, and repre-sented 5.9% of the total value. Balances between $10,000 and $50,000 constituted 7.3% of the aggregatenumber and 10.7% of the overall value, while those exceeding $50,000 made up the smallest proportion of the total (3.8%) but the dominant value share, at 83.4%.
Credit Quality
Commercial banks’ credit quality indicators deterio-rated during the review quarter, amid the persistence of subdued domestic economic conditions and limited scope for improvement in employment, which impacts debt servicing activities. Compared to the previous quarter, total private sector loan arrears expanded by $25.7 million (1.9%) and by $101.7 million (8.1%) over the same period last year, to $1,352.2 million. As a result, the ratio of arrears to total loans firmed by 42 basis points relative to the previous quarter and by 1.9 percentage points vis-à-vis December 2012, to 21.9%.
8
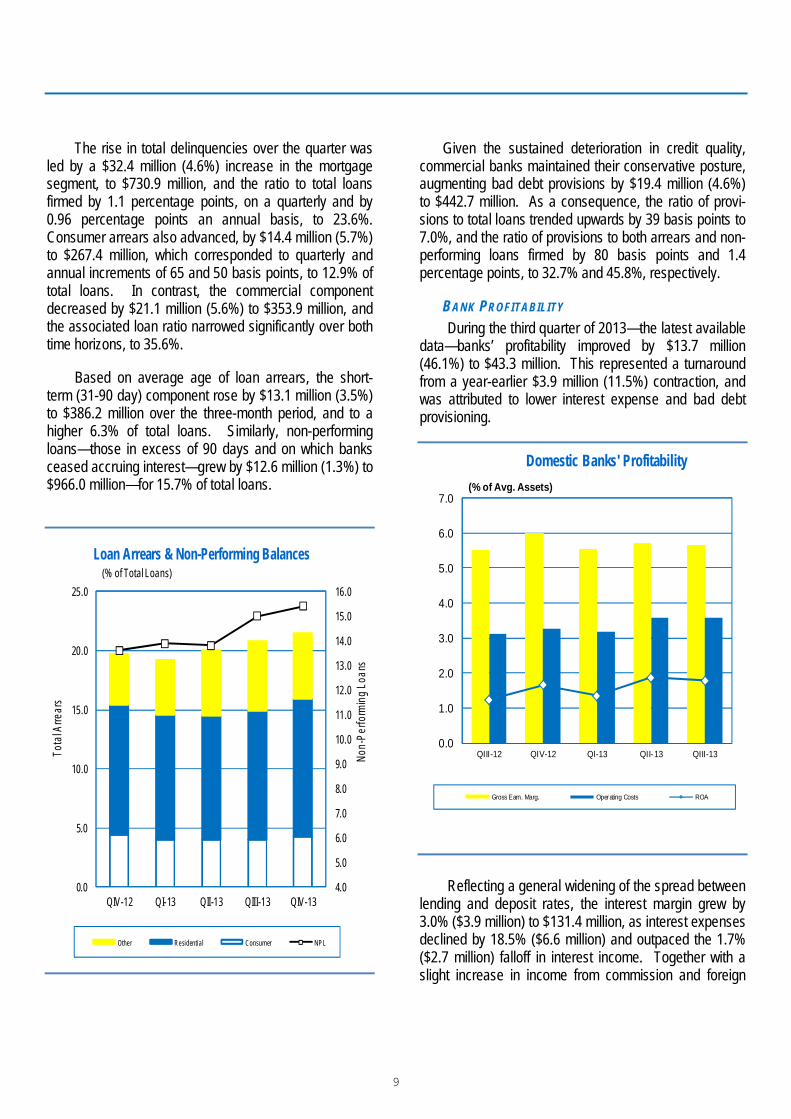
The rise in total delinquencies over the quarter was led by a $32.4 million (4.6%) increase in the mortgage segment, to $730.9 million, and the ratio to total loans firmed by 1.1 percentage points, on a quarterly and by 0.96 percentage points an annual basis, to 23.6%. Consumer arrears also advanced, by $14.4 million (5.7%) to $267.4 million, which corresponded to quarterly and annual increments of 65 and 50 basis points, to 12.9% of total loans. In contrast, the commercial component decreased by $21.1 million (5.6%) to $353.9 million, and the associated loan ratio narrowed significantly over both time horizons, to 35.6%.
Based on average age of loan arrears, the short-term (31-90 day) component rose by $13.1 million (3.5%) to $386.2 million over the three-month period, and to a higher 6.3% of total loans. Similarly, non-performing loans—those in excess of 90 days and on which banks ceased accruing interest—grew by $12.6 million (1.3%) to $966.0 million—for 15.7% of total loans.
4.0
5.0
6.0
7.0
8.0
9.0
10.0
11.0
12.0
13.0
14.0
15.0
16.0
0.0
5.0
10.0
15.0
20.0
25.0
QIV-12 QI-13 QII-13 QIII-13 QIV-13
Non
-Per
form
ing
Loan
s
(% of Total Loans)
Tota
l Arre
ars
Loan Arrears & Non-Performing Balances
Other Residential Consumer NPL
Given the sustained deterioration in credit quality, commercial banks maintained their conservative posture, augmenting bad debt provisions by $19.4 million (4.6%) to $442.7 million. As a consequence, the ratio of provi-sions to total loans trended upwards by 39 basis points to 7.0%, and the ratio of provisions to both arrears and non-performing loans firmed by 80 basis points and 1.4 percentage points, to 32.7% and 45.8%, respectively.
BANK PROFITABILITY
During the third quarter of 2013—the latest available data—banks’ profitability improved by $13.7 million (46.1%) to $43.3 million. This represented a turnaround from a year-earlier $3.9 million (11.5%) contraction, and was attributed to lower interest expense and bad debt provisioning.
0.0
1.0
2.0
3.0
4.0
5.0
6.0
7.0
QIII-12 QIV-12 QI-13 QII-13 QIII-13
(% of Avg. Assets)
Domestic Banks' Profitability
Gross Earn. Marg. Operating Costs ROA
Reflecting a general widening of the spread between lending and deposit rates, the interest margin grew by 3.0% ($3.9 million) to $131.4 million, as interest expenses declined by 18.5% ($6.6 million) and outpaced the 1.7% ($2.7 million) falloff in interest income. Together with a slight increase in income from commission and foreign
9

exchange fees, to $5.9 million, the gross earnings margin firmed by 3.0% ($4.0 million) to $137.2 million.
Total operational expenses rose by $12.2 million (16.3%) to $87.4 million, reflecting higher respective outlays for “miscellaneous” operating and staffing costs, of 32.8% ($8.8 million) and 10.9% ($4.4 million), which outstripped the 11.4% ($0.9 million) decrease in occu-pancy expenditures. As a result, the net earnings margin fell by $8.3 million (14.2%) to $49.9 million. In contrast, losses on non-core activities were reduced by more than one-fourth, to $6.6 million, as an almost 50% reduction in bad debt provisioning eclipsed the $1.4 million (45.9%) rise in depreciation costs.
In line with these trends, banks’ corresponding prof-itability ratios generally improved relative to average domestic assets. The interest margin ratio advanced by 13 basis points to 5.41%, while the commission & foreign exchange income ratio stabilized at 0.24%, resulting in an overall 14 basis point rise in the gross earning margin ratio to 5.65%. In contrast, a 49 basis point increase in the operational cost ratio, to 3.59%, engendered a 35 basis point decline in the net earnings margin ratio, to 2.05%, and a significant reduction in net losses from non-core activities elevated the net income ratio by 56 basis points to 1.78%.
INTEREST RATES
Over the fourth quarter, commercial banks’ weighted average interest rate spread widened by 33 basis points to 9.93 percentage points, as the average deposit rate fell by 25 basis points to 1.43%, and the corresponding lending rate firmed by 8 basis points to 11.36%.
In line with the general downward long-term trend in deposit rates, amid the persistence of robust levels of bank liquidity, the average range of interest earned on fixed balances softened, to 0.97% - 1.92% from 1.21% -2.12% in the prior quarter. In addition, the average rate offered on demand balances was relatively stable at 0.3%; however, the average rate on savings deposits rose by 7 basis points to 0.94%.
On the lending side, the average rate on overdrafts and consumer loans narrowed by 69 and 27 basis points, to 9.02% and 13.63%, respectively. In contrast, the average commercial mortgage rate firmed by 41 basis
points at 8.81%, and residential mortgage interest costs increased by 10 basis points to 7.26%.
Qtr. IV Qtr. III Qtr. IV
2012 2013 2013Deposit Rates
Demand Deposits 0.33 0.32 0.30
Savings Deposits 1.25 0.87 0.94
Fixed Deposits
Up to 3 months 1.44 1.44 1.12
Up to 6 months 1.72 1.21 0.97
Up to 12 months 2.30 2.07 1.87
Over 12 months 2.58 2.12 1.92
Weighted Avg Deposit Rate 1.83 1.68 1.43
Lending Rates
Residential mortgages 7.40 7.16 7.26
Commercial mortgages 8.40 8.40 8.81
Consumer loans 13.66 13.90 13.63
Other Local Loans 8.29 6.99 7.86
Overdrafts 9.36 9.71 9.02
Weighted Avg Loan Rate 11.10 11.28 11.36
Banking Sector Interest RatesPeriod Average (%)
In terms of other benchmark interest rates, the aver-age Treasury bill rate advanced by 19 basis points to 0.46%, while the Central Bank’s Discount Rate and commercial banks’ Prime Rate remained at 4.50% and 4.75%, respectively.
C A P I T A L M A R K E T S DE V E L O P M E N T S
In the context of the mildly positive domestic eco-nomic momentum, the volume of shares traded on the Bahamas International Stock Exchange (BISX) doubled to 1.4 million from 0.7 million in the same quarter a year earlier, when trading volumes fell by 19.0%. As a conse-quence, the value of trades firmed by 53.0% to $5.7 billion, relative to a 26.1% decline in 2012. Market capi-talization increased by 5.6% to $3.0 billion, following last year’s 0.5% decline, owing to broad-based gains in share prices. At end-December, the number of securities listed on the exchange was unchanged, at 27.
10
I N T E R N A T I O N A L T R A D E A N D P A Y M E N T S
Provisional estimates for the fourth quarter of 2013 signaled a deterioration in the current account deficit, by $130.8 million (29.9%) to $568.8 million, vis-à-vis the comparative 2012 period, as the merchandise trade deficit widened, and the services account surplus nar-rowed under the impact of higher outflows for construc-tion services and lower tourism inflows. The estimated surplus on the capital and financial account declined slightly by $0.9 million (0.2%) to $404.2 million, as lower net foreign direct investment inflows were substantially countered by higher external loan financing receipts.
The estimated merchandise trade deficit rose by $14.3 million (2.5%) to $584.7 million, as the $61.8 million (24.3%) contraction in exports to $201.8 million, out-weighed the decline in imports, by $47.5 million (5.7%) to $786.6 million. In terms of components, while net non-oil merchandise imports expanded by $23.0 million (5.0%) to $481.3 million, oil imports fell by $66.8 million (27.6%) to $175.2 million, due to both lower oil import volumes and average prices. Specifically, the average price per barrel decreased for jet fuel, by 16.3% to $133.19; for gas oil, by 9.6% to $114.92; aviation gas, by 8.7% to $82.20 and motor gas, by 6.1% to $119.11. In contrast, the average cost of propane increased, by 36.6% to $76.74 per barrel.
The estimated surplus on the services account nar-rowed by $68.5 million (36.4%) to $119.5 million—inclusive of a more than two-fold rise in foreign invest-ment-related construction services outflows, to $131.9 million. Amid the ongoing weakness in stopover arrivals, travel receipts contracted by $19.6 million (5.0%) to $369.6 million, while net outflows related to transportation and insurance services grew marginally by $1.9 million (3.4%) to $56.8 million and by $0.5 million (1.2%) to $45.9 million, respectively. Providing some offset, net inflows from offshore companies’ local expenses rose by $11.7 million (26.6%) to $55.9 million and Government’s net service receipts were marginally higher at $6.0 mil-lion. The net outflow for other “miscellaneous” services fell by $10.4 million (12.4%) to $73.4 million, and net royalty & license fee payments declined by $2.7 million (40.2%) to $4.0 million.
The deficit on the income account widened by $38.0 million (67.3%) to $94.6 million, owing mainly to an almost two-fold increase in net investment outflows to $91.1 million. In particular, private sector interest and dividend payments firmed by $43.0 million to $68.7 million, as accretions to non-bank net outlays accelerated more than two-fold to $74.7 million, while commercial bank net receipts fell marginally by $1.1 million to $6.1 million. In an offset, net labour income remittances were reduced by more than half to $3.5 million, and net official outflows were slightly lowered to $22.4 million.
Net current transfer payments were reversed, to a $9.0 million net outflow from a $1.0 million net receipt in 2012, explained by a $13.7 million (73.1%) rise in work-ers’ remittances and a slight $0.2 million (7.0%) increase in other “miscellaneous” net transfer outflows. Converse-ly, net Government receipts increased by $4.0 million (17.4%) to $27.3 million.
The relatively balanced outcome on the capital and financial account reflected the compensating impact of higher project loan financing inflows relative to the decline in direct investment flows. Specifically, net direct invest-ment inflows were lower by $15.1 million to $147.3 mil-lion, primarily explained by a more than halving in inflows from land purchases to $6.1 million, while net equity inflows fell modestly by $2.1 million to $141.3 million. In contrast, other “miscellaneous” net investment inflows expanded by $14.5 million to $273.5 million, reflecting the extension of short-term US$125.0 million in foreign currency loans to the Government, which elevated do-mestic banks’ short-term liabilities by $164.2 million, vis-à-vis a net reduction of $26.2 million in 2013. In addition, net portfolio outflows were marginally lower at $14.4 million, as the build-up in debt securities holdings slowed by one-half to $6.3 million, outpacing an almost four-fold growth in net outward equity investments to $8.2 million. Other private investments—mainly related to loan financ-ing—advanced by $29.1 million to $106.5 million. Net public sector inflows; however, contracted sharply to a mere $2.9 million, from the year-earlier external loan boost of $205.1 million. Owing to higher migrants’ remit-tances, net capital transfers rose by $0.4 million (19.7%) to $2.2 million.
As a result of these developments, and after adjust-ing for net errors and omissions, the surplus on the
11

overall balance, which corresponds to the change in the Central Bank’s external reserves, grew by $8.1 million to $72.4 million.
-800
-600
-400
-200
0
200
400
600
QIV-12 QI-13 QII-13 QIII-13 QIV-13
(B$M)
Balance of Payments
Invisible Bal . Curr. Acct . Bal. Trade Bal.
Economic indicators suggest that the mild growth path of the global economy was sustained during the fourth quarter, as both the United States and Asian economies continued to expand, while the euro zone showed modest signs of recovery. In this environment, labour markets conditions improved for most major economies, while inflation remained extremely low. In addition, amid increased optimism over the improving economic outlook, all major equity markets registered gains and, with the exception of the US Federal Reserve––which tapered its “quantitative easing” programme, all major central banks retained their highly accommodative monetary policy stance.
Real GDP growth in the United States slowed to an annualized 3.2% in the fourth quarter, from 4.1% in the prior three-month period, owing to a decline in private
investment, as well as reductions in Government spend-ing and fixed investments. Buoyed by higher output in the agriculture, production and services industries, real GDP in the United Kingdom grew by 0.7% in the final quarter, in line with the previous three-month period. Economic conditions also continued to improve in the euro zone, particularly in the southern states, as real output expanded by 0.3% in the fourth quarter, extending the slight 0.1% gain in the prior three-month period. Growth in factory output and investment spending fuelled a 7.7% expansion in Chinese real GDP, in line with the 7.8% improvement in the third quarter. Further, the Japanese economy continued to recover, as an uptick in consumption and capital spending led to annualized GDP firming by 1.0%, in line with the previous quarter’s 1.1% expansion.
Indications are that labour market conditions contin-ued to improve, with the unemployment rate in the United States narrowing by 30 basis points to 7.0%. Similarly, the jobless rate in the United Kingdom decreased by 40 basis points to 7.2%, owing to a 125,000 reduction in the number of unemployed persons, while the rate softened in the euro zone, by 20 basis points to 12.0% quarter-on-quarter. In Asia, the unemployment rate steadied at 4.1% for China, and moderated by 20 basis points to 3.7% for Japan.
Inflation remained relatively subdued over the review period. Annual consumer price inflation in the United States advanced by 30 basis points over the quarter to 1.5% at end-December, underpinned by increases in energy, housing and food costs. In contrast, annual inflation in the United Kingdom softened by 10 basis points to 2.0%, owing to decreases in prices for food & non-alcoholic beverages and recreational goods & ser-vices. Lower prices for telecommunications and fuels for transport resulted in euro zone annual inflation narrowing, by 10 basis points to 0.8%. In the Asian economies, China’s year-on-year consumer price inflation decreased to 2.5% in December, from 3.1% in September, while average prices in Japan firmed by 1.6% during the year, compared to a slight 0.1% decrease in the prior period.
In the foreign currency markets, the United States dollar depreciated against most of the major currencies, as investors increased their appetite for “riskier” assets. The dollar registered declines against all of the major
INTERNATIONAL ECONOMIC DEVELOPMENTS
12

European currencies, retreating in relation to the British Pound, by 2.2% to £0.60; the euro, by 1.6% to €0.73 and the Swiss Franc, by 1.4% to CHF0.89. The dollar also depreciated by 1.1% vis-à-vis the Chinese Yuan to CNY6.06, but appreciated against the Japanese Yen and Canadian dollar, by 7.2% to ¥105.31 and by 3.0% to CAD $1.06, respectively.
Most of the major equity markets registered broad-based gains over the review quarter, buoyed by the Federal Reserve’s decision to scale back its stimulus measures. In the United States, the S&P 500 and the Dow Jones Industrial Average (DIJA) surged by 9.9% and 9.6%, respectively. Gains were also recorded in Europe, led by an 11.1% rise in German’s DAX, with the United Kingdom’s FTSE and France’s CAC 40 higher by 4.4%, and 3.7%, respectively. Developments in the Asian markets were mixed, as Japan’s Nikkei 225 advanced by 12.7%; however, China’s SE Composite weakened by 2.7%, amid concerns over the state of the financial sector.
The combination of positive economic developments and heightened fuel demand, amid the severe cold weather conditions in the Northern hemisphere, largely explained the 2.4% rise in crude oil prices to US$111.59 per barrel in the fourth quarter of 2013. In terms of precious metals, gold prices fell by 9.6% to $1,201.64 per ounce at end-December, while the cost of silver was reduced by 10.3% to $19.47 per ounce.
In monetary policy developments, improving growth fundamentals led the Federal Reserve to announce a retrenchment of its $85 billion per month bond buying programme by $10 billion in January 2014, while retaining its key interest rate within the 0.00%-0.25% range. The Bank of England kept its benchmark interest rate at 0.5% and maintained the stock of Government debt asset purchases at £375 billion; however, the low inflationary environment, and significant excess capacity prompted the European Central Bank to reduce its key interest rates, by 25 basis points. To provide further stimulus to the economy and achieve its 2.0% inflation target, the Bank of Japan continued its ¥50 trillion asset purchase programme and held its uncollateralized overnight call rate within the 0.0%-0.1% range. The People’s Bank of China also sustained its highly accommodative policy
stance, and injected an additional US$5.0 billion into its banking system to ease tightening credit conditions.
Developments in the external sector of the major economies were mixed, with the trade deficit in the United States narrowing by $8.0 billion to $112.0 billion over the September quarter, benefitting from a 1.8% rise in ex-ports, which outweighed the 0.4% increase in imports. In the United Kingdom, a reduction in net imports secured an improvement in the trade deficit, by 21.3% to £8.0 billion in the fourth quarter, while the euro zone’s trade surplus surged by 29.1% to €47.5 billion, occasioned by growth in net exports. In Asia, China’s trade surplus widened by 47.1% to US$90.6 billion, as the expansion in exports overshadowed import gains. In contrast, Japan’s trade deficit deteriorated by 26.0% (¥763.5 billion) to ¥3,698.6 billion, mainly associated with a 5.6% increase in fuel-related imports.
13
STATISTICAL APPENDIX
(Tables 1-16)
14

STATISTICAL APPENDIX
Table 1 Financial Survey
Table 2 Monetary Survey
Table 3 Central Bank Balance Sheet
Table 4 Domestic Banks Balance Sheet
Table 5 Profit and Loss Accounts Of Banks In The Bahamas
Table 6 Money Supply
Table 7 Consumer Installment Credit
Table 8 Selected Average Interest Rates
Table 9 Selected Credit Quality Indicators of Domestic Banks
Table 10 Summary of Bank Liquidity
Table 11 Government Operations and Financing
Table 12 National Debt
Table 13 Public Sector Foreign Currency Debt Operations
Table 14 Balance of Payments Summary
Table 15 External Trade
Table 16 Selected Tourism Statistics
The following symbols and conventions are used throughout this report:
1. n.a. not available
2. -- nil
3. p provisional
4. Due to rounding, the sum of separate items may differ from the totals.
15

End of Period 2009 2010 2011
Mar. Jun. Sept. Dec. Mar. Jun. Sept.R Dec
Net foreign assets 134.1 152.1 280.8 308.9 356.2 117.6 208.4 266.2 273.0 148.7 77.6
Central Bank 816.0 860.4 884.8 890.0 928.0 745.8 810.2 783.2 797.1 669.2 741.6
Domestic Banks (681.9) (708.3) (604.0) (581.1) (571.8) (628.2) (601.8) (517.0) (524.1) (520.5) (664.0)
Net domestic assets 5,898.2 6,038.9 6,029.6 6,120.9 6,149.1 6,222.5 6,095.3 6,162.5 6,182.7 6,281.2 6,272.4
Domestic credit 8,039.7 8,448.2 8,536.9 8,666.5 8,698.8 8,797.2 8,685.0 8,753.8 8,824.6 8,953.1 8,951.5
Public sector 1,443.8 1,875.5 1,889.4 1,998.8 2,042.7 2,135.4 2,055.7 2,216.8 2,295.2 2,425.8 2,437.3
Government (net) 1023.9 1,413.7 1,439.2 1,524.8 1,624.9 1,678.0 1,592.2 1,751.4 1,829.6 1,943.3 1,943.3
Rest of public sector 419.9 461.8 450.2 474.0 417.8 457.4 463.5 465.4 465.7 482.5 494.0
Private sector 6,595.9 6,572.7 6,647.5 6,667.7 6,656.1 6,661.8 6,629.3 6,537.0 6,529.4 6,527.3 6,514.2
Other items (net) (2,141.5) (2,409.3) (2,507.3) (2,545.6) (2,549.7) (2,574.7) (2,589.7) (2,591.3) (2,641.9) (2,671.9) (2,679.1)
Monetary liabilities 6,032.3 6,191.1 6,310.4 6,429.8 6,505.3 6,340.1 6,303.7 6,428.7 6,455.7 6,429.9 6,350.0
Money 1,283.6 1,335.2 1,434.8 1,486.7 1,532.8 1,509.8 1,574.9 1,590.9 1,653.5 1,639.2 1,641.2
Currency 207.8 194.5 196.9 203.5 207.3 208.2 216.5 216.7 215.6 208.0 214.4
Demand deposits 1,075.8 1,140.6 1,237.9 1,283.2 1,325.5 1,301.6 1,358.4 1,374.2 1,437.9 1,431.2 1,426.8
Quasi-money 4,748.7 4,855.9 4,875.6 4,943.1 4,972.5 4,830.3 4,728.8 4,837.8 4,802.2 4,790.7 4,708.8
Fixed deposits 3,521.4 3,615.4 3,605.9 3,596.7 3,581.0 3,488.4 3,444.1 3,496.8 3,434.9 3,385.9 3,320.8
Savings deposits 995.4 1,015.8 1,063.7 1,084.8 1,144.8 1,110.2 1,069.0 1,091.7 1,109.7 1,089.5 1,114.0
Foreign currency 231.9 224.7 206.0 261.6 246.7 231.7 215.7 249.4 257.6 315.3 274.0
Total domestic credit 1.7 5.1 1.4 1.5 0.4 1.1 (1.3) 0.8 0.8 1.5 (0.0)
Public sector 5.2 29.9 4.1 5.8 2.2 4.5 (3.7) 7.8 3.5 5.7 0.5
Government (net) 10.8 38.1 2.7 5.9 6.6 3.3 (5.1) 10.0 4.5 6.2 (0.0)
Rest of public sector (6.3) 10.0 8.7 5.3 (11.9) 9.5 1.3 0.4 0.0 3.6 2.4
Private sector 0.9 (0.4) 0.7 0.3 (0.2) 0.1 (0.5) (1.4) (0.1) (0.0) (0.2)
Monetary liabilities 1.8 2.6 (0.7) 1.9 1.2 (2.5) (0.6) 2.0 0.4 (0.4) (1.2)
Money 0.7 4.0 0.8 3.6 3.1 (1.5) 4.3 1.0 3.9 (0.9) 0.1
Currency 1.0 (6.4) (2.6) 3.3 1.9 0.4 4.0 0.1 (0.5) (3.5) 3.1
Demand deposits 0.7 6.0 1.3 3.7 3.3 (1.8) 4.4 1.2 4.6 (0.5) (0.3)
Quasi-money 2.1 2.3 (1.1) 1.4 0.6 (2.9) (2.1) 2.3 (0.7) (0.2) (1.7)
Source: The Central Bank of The Bahamas
(B$ Millions)
2013
TABLE 1
FINANCIAL SURVEY
(percentage changes)
2012
16
End of Period 2009 2010 2011
Mar. Jun. Sept. Dec. Mar. Jun. Sept.R Dec
Net foreign assets 167.3 113.9 287.5 304.3 362.6 119.4 214.2 272.6 262.9 167.5 106.7
Central Bank 816.0 860.4 884.8 890.0 928.0 745.8 810.2 783.2 797.1 669.2 741.6
Commercial banks (648.7) (746.6) (597.3) (585.7) (565.4) (626.4) (596.0) (510.6) (534.2) (501.7) (634.9)
Net domestic assets 5,832.9 6,040.6 5,978.9 6,054.3 6,086.5 6,168.5 6,034.8 6,105.6 6,107.7 6,204.7 6,191.7
Domestic credit 8,000.0 8,417.1 8,509.0 8,637.2 8,669.0 8,767.5 8,655.5 8,726.4 8,797.1 8,928.7 8,924.3
Public sector 1,428.3 1,861.0 1,879.5 1,986.7 2,030.1 2,122.5 2,042.8 2,203.9 2,282.5 2,416.4 2,428.0
Government (net) 1,008.4 1,404.6 1,429.8 1,513.2 1,612.7 1,665.7 1,579.9 1,739.0 1,817.3 1,934.4 1,934.5
Rest of public sector 419.9 456.4 449.7 473.5 417.3 456.8 462.9 464.9 465.2 482.0 493.5
Private sector 6,571.7 6,556.1 6,629.5 6,650.4 6,638.9 6,645.0 6,612.7 6,522.5 6,514.6 6,512.3 6,496.4
Other items (net) (2,167.1) (2,376.5) (2,530.1) (2,582.9) (2,582.5) (2,599.0) (2,620.7) (2,620.8) (2,689.4) (2,724.0) (2,732.6)
Monetary liabilities 6,000.2 6,154.6 6,266.4 6,358.6 6,449.1 6,287.9 6,249.0 6,378.2 6,370.6 6,372.2 6,298.4
Money 1,261.9 1,314.7 1,408.2 1,448.9 1,496.8 1,485.3 1,541.9 1,562.0 1,598.3 1,601.5 1,610.9
Currency 207.8 194.5 196.9 203.5 207.3 208.2 216.5 216.7 215.6 208.0 214.4
Demand deposits 1,054.1 1,120.2 1,211.3 1,245.5 1,289.5 1,277.1 1,325.4 1,345.3 1,382.7 1,393.5 1,396.5
Quasi-money 4,738.3 4,839.8 4,858.2 4,909.7 4,952.3 4,802.6 4,707.1 4,816.3 4,772.3 4,770.7 4,687.5
Savings deposits 995.3 1,015.8 1,063.7 1,084.8 1,144.7 1,110.1 1,069.0 1,091.6 1,109.7 1,089.5 1,114.0
Fixed deposits 3,511.1 3,601.8 3,592.3 3,580.7 3,567.3 3,476.5 3,428.4 3,481.0 3,418.7 3,365.9 3,299.6
Foreign currency deposits 231.9 222.2 202.2 244.2 240.3 216.0 209.7 243.7 243.9 315.3 274.0
Total domestic credit 1.5 5.2 1.4 1.5 0.4 1.1 (1.3) 0.8 0.8 1.5 (0.0)
Public sector 4.3 30.3 4.0 5.7 2.2 4.6 (3.8) 7.9 3.6 5.9 0.5
Government (net) 9.5 39.3 2.6 5.8 6.6 3.3 (5.2) 10.1 4.5 6.4 0.0
Rest of public sector (6.3) 8.7 8.7 5.3 (11.9) 9.5 1.3 0.4 0.1 3.6 2.4
Private sector 0.9 (0.2) 0.7 0.3 (0.2) 0.1 (0.5) (1.4) (0.1) (0.0) (0.2)
Monetary liabilities 1.8 2.6 (0.7) 1.5 1.4 (2.5) (0.6) 2.1 (0.1) 0.0 (1.2)
Money 0.3 4.2 0.7 2.9 3.3 (0.8) 3.8 1.3 2.3 0.2 0.6
Currency 1.0 (6.4) (2.6) 3.3 1.9 0.4 4.0 0.1 (0.5) (3.5) 3.1
Demand deposits 0.2 6.3 1.3 2.8 3.5 (1.0) 3.8 1.5 2.8 0.8 0.2
Quasi-money 2.2 2.1 (1.1) 1.1 0.9 (3.0) (2.0) 2.3 (0.9) (0.0) (1.7)
Source: The Central Bank of The Bahamas
2013
(B$ Millions)
(percentage change)
2012
TABLE 2
MONETARY SURVEY
17

End of Period 2009 2010 2011
Mar. Jun. Sep. Dec. Mar. Jun. Sep. Dec.
Net foreign assets 816.0 860.4 884.8 890.0 928.0 745.8 810.2 783.2 797.1 669.2 741.6
Balances with banks abroad 270.9 175.2 115.0 124.1 164.9 5.4 216.5 200.7 209.1 80.7 122.4
Foreign securities 356.2 499.7 585.0 579.4 580.4 554.8 555.7 545.4 550.8 550.6 551.0
Reserve position in the Fund 9.8 9.6 9.6 9.7 9.5 9.6 9.6 9.4 9.4 9.6 9.6
SDR holdings 179.1 175.9 175.2 176.8 173.2 176.0 28.4 27.7 27.8 28.3 58.6
Net domestic assets 73.3 156.7 187.4 194.9 218.0 249.4 280.1 323.7 357.4 396.4 314.7
Net claims on Government 182.1 259.8 289.2 304.9 328.3 357.1 394.7 438.6 460.6 524.4 489.9
Claims 202.8 274.3 300.8 315.8 333.5 368.5 404.8 460.7 484.9 548.7 542.0
Treasury bills -- -- 26.2 20.0 21.5 63.5 129.6 187.0 209.5 200.0 186.4
Bahamas registered stock 105.8 162.3 164.0 165.2 174.3 169.4 169.5 168.0 169.7 223.0 220.9
Loans and advances 97.0 112.0 110.6 130.6 137.7 135.6 105.7 105.7 105.7 125.7 134.7
Deposits (20.7) (14.5) (11.6) (10.9) (5.2) (11.4) (10.1) (22.1) (24.3) (24.3) (52.1)
In local currency (20.7) (14.5) (11.6) (10.9) (5.2) (11.4) (10.1) (22.1) (24.3) (24.3) (52.1)
In foreign currency -- -- -- -- -- -- -- -- -- -- --
Deposits of rest of public sector (15.8) (15.4) (7.1) (14.8) (12.9) (10.6) (14.7) (10.3) (16.4) (23.5) (11.6)
Credit to commercial banks -- -- -- -- -- -- -- -- -- -- --
Official capital and surplus (140.5) (132.0) (139.2) (140.5) (141.1) (142.0) (139.3) (143.0) (143.0) (141.3) (140.7)
Net unclassified assets 40.5 38.0 38.4 39.2 37.8 39.0 33.7 32.8 50.7 31.3 (28.5)
Loans to rest of public sector 6.2 5.6 5.2 5.2 5.0 5.0 4.8 4.8 4.6 4.6 4.6
Public Corp Bonds/Securities 0.8 0.8 0.9 0.9 0.9 0.9 0.9 0.9 0.9 0.9 1.0
Liabilities To Domestic Banks (486.5) (631.0) (684.3) (688.8) (749.9) (595.1) (682.6) (703.7) (751.8) (666.7) (650.3)
Notes and coins (111.8) (113.2) (126.9) (80.6) (83.5) (86.7) (127.4) (95.6) (93.7) (91.9) (138.1)
Deposits (374.7) (517.8) (557.4) (608.2) (666.4) (508.4) (555.2) (608.1) (658.1) (574.8) (512.2)
SDR allocation (195.0) (191.6) (191.0) (192.7) (188.8) (191.9) (191.2) (186.5) (187.1) (190.9) (191.6)
Currency held by the private sector (207.8) (194.5) (196.9) (203.5) (207.3) (208.2) (216.5) (216.7) (215.6) (208.0) (214.4)
Source: The Central Bank of The Bahamas
2012 2013
(B$ Millions)
TABLE 3
CENTRAL BANK BALANCE SHEET
18
End of Period 2009 2010 2011
Mar. Jun. Sept. Dec. Mar. Jun. Sept.R Dec.
Net foreign assets (681.9) (705.8) (604.0) (581.1) (571.8) (628.2) (601.8) (517.0) (524.1) (520.5) (664.0)
Net claims on Central Bank 487.4 631.9 687.0 689.8 753.8 596.5 690.7 705.3 752.7 667.6 651.7
Notes and Coins 111.8 113.2 126.9 80.6 83.5 86.7 127.4 95.6 93.7 91.9 138.1
Balances 375.6 518.7 560.1 609.2 670.3 509.8 563.3 609.8 659.0 575.7 513.6
Less Central Bank credit -- -- -- -- -- -- -- -- -- -- --
Net domestic assets 5,564.4 5,567.7 5,579.5 5,675.9 5,679.5 5,748.1 5,586.9 5,610.8 5,590.0 5,648.4 5,757.5
Net claims on Government 843.0 1,152.3 1,150.0 1,219.9 1,296.6 1,320.9 1,197.5 1,312.8 1,368.9 1,418.9 1,453.4
Treasury bills 214.0 293.7 275.4 301.6 321.6 274.6 219.3 342.1 378.6 388.1 392.4
Other securities 704.6 799.6 847.6 848.7 840.7 965.5 961.1 957.2 954.3 959.1 962.1 Loans and advances 76.5 180.3 145.7 189.3 253.8 207.3 152.4 147.6 164.0 201.8 253.6
Less: deposits 152.1 121.3 118.7 119.7 119.5 126.5 135.3 134.1 128.0 130.1 154.7
Net claims on rest of public sector (25.7) (31.9) 0.4 41.2 (11.5) 46.6 61.2 57.1 55.1 74.1 109.7
Securities 107.0 115.6 117.4 119.4 119.4 119.4 119.4 119.4 119.4 119.4 119.4
Loans and advances 305.9 339.8 326.8 348.7 292.6 332.1 338.4 340.4 340.8 357.6 369.1
Less: deposits 438.6 487.3 443.8 426.9 423.5 404.9 396.6 402.7 405.2 402.9 378.8
Other net claims (8.1) (3.4) 5.5 (19.3) (14.6) (4.6) (15.7) (13.5) (6.9) (28.8) (48.8)
Credit to the private sector 6,595.9 6,572.7 6,647.6 6,667.6 6,656.1 6,661.9 6,629.3 6,537.0 6,529.4 6,527.3 6,514.2 Securities 27.2 17.4 16.4 14.4 14.3 14.0 14.1 14.2 12.9 13.0 16.5
Mortgages 2,949.6 3,192.4 3,227.6 3,232.9 3,255.1 3,275.8 3,275.4 3,273.7 3,300.1 3,302.6 3,285.2
Loans and advances 3,619.1 3,363.0 3,403.6 3,420.3 3,386.7 3,372.1 3,339.8 3,249.1 3,216.3 3,211.7 3,212.5
Private capital and surplus (2,033.0) (2,281.9) (2,357.8) (2,419.6) (2,436.1) (2,473.5) (2,535.2) (2,515.7) (2,577.5) (2,566.0) (2,586.4)
Net unclassified assets 192.3 159.9 133.8 186.1 189.0 196.8 249.8 233.1 221.0 222.9 315.4
Liabilities to private sector 5,370.0 5,493.7 5,662.5 5,784.6 5,861.5 5,716.4 5,675.8 5,799.1 5,818.6 5,795.5 5,745.2
Demand deposits 1,204.2 1,249.6 1,325.6 1,410.6 1,442.3 1,406.7 1,442.7 1,493.9 1,552.3 1,593.4 1,593.5
Savings deposits 1,003.5 1,017.8 1,067.1 1,088.0 1,148.1 1,114.1 1,074.1 1,096.8 1,116.4 1,097.6 1,119.9
Fixed deposits 3162.3 3,226.3 3,269.8 3,285.9 3,271.1 3,195.6 3,159.0 3,208.4 3,149.9 3,104.5 3,031.8
Source: The Central Bank of The Bahamas
2013
(B$ Millions)
TABLE 4
DOMESTIC BANKS BALANCE SHEET
2012
19

(B$'000s)
Period 2009 2010 2011
Qtr. I Qtr. II Qtr. III Qtr. IV Qtr. I Qtr. II Qtr. III
1. Interest Income 728,878 742,174 168,979 168,204 165,179 163,140 170,532 158,479 163,483 160,402
2. Interest Expense 244,468 225,990 39,658 39,034 37,892 35,607 32,364 30,765 30,449 29,015
3. Interest Margin (1-2) 484,410 516,184 129,321 129,170 127,287 127,533 138,168 127,714 133,034 131,387
4. Commission & Forex Income 22,005 22,820 6,052 6,224 5,145 5,701 5,935 5,593 5,916 5,850
5. Gross Earnings Margin (3+4) 506,415 539,004 135,373 135,394 132,432 133,234 144,103 133,307 138,950 137,237
6. Staff Costs 149,222 158,233 41,676 39,136 41,456 40,230 41,526 39,139 45,831 44,6027. Occupancy Costs 23,417 23,964 6,712 7,019 7,036 8,081 7,608 7,175 7,797 7,1578. Other Operating Costs 87,245 107,051 26,753 28,138 27,582 26,815 29,379 30,695 33,230 35,6079. Operating Costs (6+7+8) 259,884 289,248 75,141 74,293 76,074 75,126 78,513 77,009 86,858 87,366
10. Net Earnings Margin (5-9) 246,531 249,756 60,232 61,101 56,358 58,108 65,590 56,298 52,092 49,871
11. Depreciation Costs 14,134 15,238 1,810 3,521 3,469 3,041 3,333 3,378 3,659 4,43812. Provisions for Bad Debt 121,092 124,686 24,711 37,789 36,123 48,570 45,616 42,894 27,716 24,99813. Other Income 96,990 111,284 26,429 21,124 20,981 23,142 23,037 22,633 24,737 22,878
14. Other Income (Net) (13-11-12) (38,236) (28,640) (92) (20,186) (18,611) (28,469) (25,912) (23,639) (6,638) (6,558)
15. Net Income (10+14) 208,295 221,116 60,140 40,915 37,747 29,639 39,678 32,659 45,454 43,313
16. Effective Interest Rate Spread (%) 6.34 6.17 6.28 6.44 6.40 6.44 6.36 6.64 7.12 6.76
Interest Margin 5.31 5.60 5.47 5.39 5.23 5.27 5.74 5.29 5.47 5.41
Commission & Forex Income 0.24 0.25 0.26 0.26 0.21 0.24 0.25 0.23 0.24 0.24
Gross Earnings Margin 5.55 5.84 5.72 5.65 5.45 5.51 5.99 5.52 5.71 5.65
Operating Costs 2.85 3.14 3.18 3.10 3.13 3.11 3.26 3.19 3.57 3.59
Net Earnings Margin 2.70 2.71 2.55 2.55 2.32 2.40 2.72 2.33 2.14 2.05
Net Income 2.28 2.40 2.54 1.71 1.55 1.23 1.65 1.35 1.87 1.78
*Commercial Banks and OLFIs with domestic operations
Source: The Central Bank of The Bahamas
(Ratios To Average Assets)
TABLE 5
PROFIT AND LOSS ACCOUNTS OF BANKS IN THE BAHAMAS*
20132012
20
End of Period 2009 2010
Mar. Jun. Sept. Dec. Mar. Jun. Sept.R Dec.
Money supply (M1) 1,283.6 1,335.2 1,434.8 1,486.7 1,532.8 1,509.8 1,574.9 1,590.9 1,653.5 1,639.2 1,641.2
1) Currency in active circulation 207.8 194.5 196.9 203.5 207.3 208.2 216.5 216.7 215.6 208.0 214.4
2) Demand deposits 1,075.8 1,140.6 1,237.9 1,283.2 1,325.5 1,301.6 1,358.4 1,374.2 1,437.9 1,431.2 1,426.8
Central Bank 15.9 15.4 7.1 14.8 12.9 10.6 14.8 10.3 16.4 23.5 11.6
Domestic Banks 1,059.9 1,125.2 1,230.8 1,268.4 1,312.6 1,291.0 1,343.6 1,363.9 1,421.5 1,407.7 1,415.2
Factors affecting money (M1)
1) Net credit to Government 1,023.9 1,413.7 1,439.2 1,524.8 1,624.9 1,678.0 1,592.2 1,751.4 1,829.6 1,943.3 1,943.3
Central Bank 180.9 261.4 289.2 304.9 328.3 357.1 394.7 438.6 460.7 524.4 489.9
Domestic Banks 843.0 1,152.3 1,150.0 1,219.9 1,296.6 1,320.9 1,197.5 1,312.8 1,368.9 1,418.9 1,453.4
2) Other credit 7,015.8 7,034.5 7,097.7 7,141.7 7,073.9 7,119.2 7,092.8 7,002.4 6,995.0 7,009.8 7,008.2
Rest of public sector 419.9 461.8 450.2 474.0 417.8 457.4 463.5 465.4 465.6 482.5 494.0
Private sector 6,595.9 6,572.7 6,647.5 6,667.7 6,656.1 6,661.8 6,629.3 6,537.0 6,529.4 6,527.3 6,514.2
3) External reserves 816.0 860.4 884.8 890.0 928.0 745.8 810.2 783.2 797.1 669.2 741.6
4) Other external liabilities (net) (681.9) (708.3) (604.0) (581.1) (571.8) (628.2) (601.8) (517.0) (524.1) (520.5) (664.0)
5) Quasi money 4,748.7 4,855.9 4,875.6 4,943.1 4,972.5 4,830.3 4,728.8 4,837.8 4,802.2 4,790.7 4,708.8
6) Other items (net) (2,141.5) (2,409.3) (2,507.3) (2,545.6) (2,549.7) (2,574.7) (2,589.7) (2,591.3) (2,641.9) (2,671.9) (2,679.1)
.
Source: The Central Bank of The Bahamas
2013
(B$ Millions)
20122011
TABLE 6
MONEY SUPPLY
21
(B$' 000)
End of Period 2010 2011
Mar. Jun. Sept. Dec. Mar. Jun. Sept. Dec.
CREDIT OUTSTANDING
Private cars 206,689 185,044 171,751 169,956 174,077 176,222 177,527 176,465 184,523 182,440 181,297
Taxis & rented cars 1,832 985 910 987 974 1,055 1,081 970 1,026 1,019 1,119
Commercial vehicles 4,955 3,353 2,510 2,368 2,299 2,213 2,241 2,176 1,997 1,942 1,991
Furnishings & domestic appliances 19,134 15,126 11,126 10,462 10,297 11,993 12,010 11,621 10,840 13,440 14,208
Travel 36,369 26,464 25,221 23,832 24,413 27,239 29,492 27,784 29,616 36,264 35,912
Education 55,227 50,875 35,750 34,230 32,733 35,731 34,544 33,448 32,566 38,838 39,336
Medical 19,697 16,399 14,409 13,786 13,304 13,247 11,363 11,123 11,274 11,763 11,958
Home Improvements 163,991 129,860 126,543 122,885 126,732 124,114 127,537 128,389 124,738 129,073 128,160
Land Purchases 243,696 240,391 239,790 234,789 237,847 233,149 232,752 228,644 227,867 229,575 231,600
Consolidation of debt 648,024 714,616 820,135 815,617 813,370 804,306 781,518 779,541 772,843 765,465 762,988
Miscellaneous 515,002 494,961 464,052 483,468 499,683 508,667 501,225 500,285 501,268 490,275 511,585
Credit Cards 278,749 262,871 251,924 242,294 239,549 242,130 243,745 236,066 234,110 239,262 243,853
TOTAL 2,193,365 2,140,945 2,164,121 2,154,674 2,175,278 2,180,066 2,155,035 2,136,512 2,132,668 2,139,356 2,164,007
NET CREDIT EXTENDED
Private cars (32,086) (21,645) (13,293) (1,795) 4,121 2,145 1,305 (1,062) 8,058 (2,083) (1,143)
Taxis & rented cars (77) (847) (75) 77 (13) 81 26 (111) 56 (7) 100
Commercial vehicles (1,156) (1,602) (843) (142) (69) (86) 28 (65) (179) (55) 49
Furnishings & domestic appliances (2,039) (4,008) (4,000) (664) (165) 1,696 17 (389) (781) 2,600 768
Travel (13,233) (9,905) (1,243) (1,389) 581 2,826 2,253 (1,708) 1,832 6,648 (352)
Education (2,028) (4,352) (15,125) (1,520) (1,497) 2,998 (1,187) (1,096) (882) 6,272 498
Medical (1,738) (3,298) (1,990) (623) (482) (57) (1,884) (240) 151 489 195
Home Improvements (7,463) (34,131) (3,317) (3,658) 3,847 (2,618) 3,423 852 (3,651) 4,335 (913)
Land Purchases (2,472) (3,305) (601) (5,001) 3,058 (4,698) (397) (4,108) (777) 1,708 2,025
Consolidation of debt 53,459 66,592 105,519 (4,518) (2,247) (9,064) (22,788) (1,977) (6,698) (7,378) (2,477)
Miscellaneous (26,583) (20,041) (30,909) 19,416 16,215 8,984 (7,442) (940) 983 (10,993) 21,310
Credit Cards (15,628) (15,878) (10,947) (9,630) (2,745) 2,581 1,615 (7,679) (1,956) 5,152 4,591
TOTAL (51,044) (52,420) 23,176 (9,447) 20,604 4,788 (25,031) (18,523) (3,844) 6,688 24,651
Source: The Central Bank of The Bahamas
* Includes both demand and add-on loans
20132009
TABLE 7CONSUMER INSTALMENT CREDIT*
2012
22

(%)
Period 2011 2012 2013
Qtr. I Qtr. II Qtr. III Qtr. IV Qtr. I Qtr. II Qtr. III Qtr. IV Qtr. I Qtr. II Qtr. III Qtr. IV
DOMESTIC BANKS
Deposit rates
Savings deposits 1.75 1.53 0.97 1.85 1.89 1.63 1.61 1.88 1.67 1.31 1.25 1.11 0.96 0.87 0.94
Fixed deposits
Up to 3 months 2.33 1.60 1.37 2.82 2.64 1.97 1.89 1.71 1.71 1.56 1.43 1.48 1.41 1.44 1.12
Up to 6 months 2.67 1.95 1.35 3.31 2.79 2.56 2.01 2.08 2.09 1.89 1.72 1.63 1.59 1.21 0.97
Up to 12 months 3.25 2.54 2.15 3.92 3.54 2.77 2.75 2.69 2.68 2.49 2.30 2.59 2.06 2.07 1.87
Over 12 months 3.20 2.65 2.20 3.89 3.55 2.75 2.59 2.96 2.53 2.52 2.58 2.49 2.29 2.12 1.92
Weighted average rate 2.64 2.02 1.68 3.18 2.90 2.27 2.19 2.23 2.08 1.93 1.83 1.92 1.69 1.68 1.43
Lending rates
Residential mortgages 7.77 7.51 7.27 8.07 7.94 7.57 7.50 7.58 7.61 7.43 7.40 7.51 7.13 7.16 7.26
Commercial mortgages 8.37 8.29 8.21 8.75 8.57 8.04 8.12 8.09 8.35 8.33 8.40 8.06 7.57 8.40 8.81
Consumer loans 13.35 13.43 13.65 13.51 13.29 13.29 13.32 12.82 13.41 13.84 13.66 13.55 13.51 13.90 13.63
Overdrafts 10.04 9.81 9.32 10.21 10.15 9.94 9.84 9.36 10.61 9.91 9.36 9.07 9.48 9.71 9.02
Weighted average rate 10.98 10.88 11.10 11.18 11.08 11.01 10.64 10.25 10.99 11.18 11.10 10.91 10.85 11.28 11.36
Other rates
Prime rate 4.94 4.75 4.75 5.50 4.75 4.75 4.75 4.75 4.75 4.75 4.75 4.75 4.75 4.75 4.75
Treasury bill (90 days) 1.25 0.20 0.30 1.80 1.52 0.96 0.71 0.10 0.32 0.10 0.28 0.17 0.29 0.27 0.46
Treasury bill re-discount rate 1.75 0.70 0.80 2.30 2.02 1.46 1.21 0.60 0.82 0.60 0.78 0.67 0.79 0.77 0.96
Bank rate (discount rate) 4.69 4.50 4.50 5.25 4.50 4.50 4.50 4.50 4.50 4.50 4.50 4.50 4.50 4.50 4.50
Source: The Central Bank of The Bahamas
2012
SELECTED AVERAGE INTEREST RATESTABLE 8
2011 2013
23

Period 2009 2011
Qtr. I Qtr. II Qtr. III Qtr. IVR Qtr. I Qtr. IIR Qtr. IIIR Qtr. IV
Loan PortfolioCurrent Loans (as a % of total loans) 82.3 81.8 81.1 81.5 81.7 81.9 80.3 80.7 79.9 79.1 78.4
Arrears (% by loan type) Consumer 5.2 4.3 4.2 3.9 4.0 4.0 4.4 4.0 4.0 4.0 4.3 Mortgage 8.6 9.8 10.1 9.8 10.2 10.2 11.0 10.6 10.5 10.9 11.6 Commercial 3.8 4.0 4.5 4.7 4.0 3.8 4.3 4.6 5.5 5.9 5.6
Public 0.1 0.1 0.1 0.1 0.1 0.1 0.1 0.1 0.1 0.1 0.1
Total Arrears 17.7 18.2 18.9 18.5 18.3 18.1 19.7 19.3 20.1 20.9 21.6
Total B$ Loan Portfolio 100.0 100.0 100.0 100.0 100.0 100.0 100.0 100.0 100.0 100.0 100.0
Loan PortfolioCurrent Loans (as a % of total loans) 82.3 81.8 81.1 81.5 81.7 81.9 80.3 80.7 79.9 79.1 78.4
Arrears (% by days outstanding)
2010
TABLE 9
SELECTED CREDIT QUALITY INDICATORS OF DOMESTIC BANKS
20132012
Arrears (% by days outstanding) 30 - 60 days 5.6 4.0 4.1 3.6 3.3 3.1 3.7 3.7 3.2 3.6 3.7 61 - 90 days 2.7 2.3 2.05 2.2 2.1 2.0 2.3 1.7 3.0 2.3 2.5
90 - 179 days 3.0 2.6 2.3 2.1 2.3 2.3 2.5 2.2 2.0 2.7 2.1 over 180 days 6.3 9.3 10.5 10.7 10.6 10.8 11.3 11.7 11.9 12.3 13.3
Total Arrears 17.7 18.2 18.9 18.5 18.3 18.1 19.7 19.3 20.1 20.9 21.6
Total B$ Loan Portfolio 100.0 100.0 100.0 100.0 100.0 100.0 100.0 100.0 100.0 100.0 100.0
Non Accrual Loans (% by loan type) Consumer 29.8 21.4 20.3 19.8 20.0 19.6 20.5 19.4 19.5 17.6 17.5 Mortgage 41.4 52.1 54.8 55.4 55.0 57.1 57.0 56.8 57.7 52.6 53.4 Other Private 27.8 25.7 24.2 24.1 24.3 22.6 21.9 23.2 22.2 29.2 28.5
Public 1.0 0.8 0.7 0.7 0.7 0.7 0.6 0.6 0.6 0.6 0.6Total Non Accrual Loans 100.0 100.0 100.0 100.0 100.0 100.0 100.0 100.0 100.0 100.0 100.0
Provisions to Loan Portfolio
Consumer 4.2 5.1 4.9 5.4 5.5 5.4 5.4 5.5 7.2 7.5 7.9 Mortgage 1.8 2.4 2.7 3.2 3.6 3.7 4.3 5.6 4.8 5.1 5.2 Other Private 6.9 9.1 10.6 10.6 10.9 11.2 8.7 11.2 11.0 11.1 11.9
Public 0.0 0.0 0.0 0.0 0.0 0.0 0.0 0.0 0.0 0.0 0.0
Total Provisions to Total Loans 3.4 4.3 4.7 5.1 5.3 5.3 5.9 6.3 6.5 6.6 7.0Total Provisions to Non-performing Loans 37.1 36.6 36.8 40.0 41.3 41.2 43.0 45.6 46.7 44.4 45.8Total Non-performing Loans to Total Loans 9.3 11.9 12.7 12.7 12.8 13.0 13.6 13.9 13.8 15.0 15.3
Source: The Central Bank of The BahamasSource: The Central Bank of The BahamasFigures may not sum to total due to rounding. 24
End of Period 2009 2010 2011
Mar. Jun. Sept. Dec. Mar. Jun. Sept. R Dec.
I. Statutory Reserves
Required reserves 290.3 298.1 305.0 306.0 310.9 307.9 301.9 302.2 305.7 307.4 303.3
Average Till Cash 94.7 98.2 118.3 90.1 87.4 88.0 108.9 93.9 96.5 99.9 117.4
Average balance with central bank 425.1 530.5 557.3 592.6 669.0 540.4 515.8 539.4 640.9 552.8 593.3
Free cash reserves (period ended) 229.5 330.6 370.6 376.7 445.5 320.4 322.8 331.1 431.8 345.3 407.4
II. Liquid Assets (period)
A. Minimum Required Liquid Assets 929.6 946.7 968.7 977.8 990.9 973.3 971.1 988.1 994.2 978.3 988.3
B. Net Eligible Liquid Assets 1,423.7 1,755.1 1,865.1 1,909.1 1,973.2 1,893.5 1,938.2 2,068.3 2,147.5 2,091.6 2,126.1
i) Balance with Central Bank 375.6 518.7 560.1 609.1 670.3 509.8 563.3 609.8 659.0 575.7 513.6
ii) Notes and Coins 112.3 113.7 127.4 81.1 84.0 87.2 127.9 96.1 94.2 92.4 138.6
iii) Treasury Bills 214.0 293.7 275.4 301.6 321.6 274.6 219.3 342.1 378.6 388.1 392.4
iv) Government registered stocks 671.4 774.8 843.7 843.7 835.1 962.0 957.6 953.7 950.9 959.1 962.2
v) Specified assets 45.7 53.0 55.2 57.1 57.0 57.1 56.9 56.7 56.7 56.6 56.6
vi) Net Inter-bank dem/call deposits 4.7 1.2 3.3 16.5 5.2 2.8 13.2 9.9 8.1 19.7 62.7
vii) Less: borrowings from central bank -- -- -- -- -- -- -- -- -- -- --
C. Surplus/(Deficit) 494.1 808.4 896.4 931.3 982.3 920.2 967.1 1,080.2 1,153.3 1,113.3 1,137.8
Source: The Central Bank of The Bahamas
2013
(B$ Millions)
2012
SUMMARY OF BANK LIQUIDITY
TABLE 10
25

Period 2010/11p 2011/12p 2012/13p 2012/13 2013/14 QTR. II QTR. III QTR. IV QTR. I QTR. II
Total Revenue & Grants 1,433.0 1,446.7 1,354.6 1,535.5 1,493.2 368.0 342.1 347.7 305.3 356.2
Current expenditure 1,524.5 1,549.7 1,545.0 1,679.0 1,635.2 379.7 384.6 410.8 360.8 403.2
Capital expenditure 206.3 245.4 258.3 358.2 235.3 52.8 59.1 84.1 30.2 46.2
Net lending 72.9 102.4 96.4 45.8 57.6 60.8 12.4 14.0 11.1 19.2
Overall balance (370.7) (450.6) (545.2) (547.5) (437.2) (125.3) (114.0) (161.2) (96.8) (112.3)
FINANCING (I+II-III+IV+V) 370.7 450.6 545.2 547.5 437.2 125.3 114.0 161.2 96.8 112.2
I. Foreign currency borrowing 127.6 80.3 231.8 157.0 55.5 210.1 12.9 4.1 103.7 145.0
External 73.7 80.3 231.8 157.0 55.5 210.1 12.9 4.1 103.7 20.0
Domestic -- -- -- -- -- -- -- -- -- 125.0
II. Bahamian dollar borrowing 293.6 354.9 792.0 512.2 465.8 105.0 180.0 179.1 155.0 70.0
i) Treasury bills -- 90.6 294.1 -- -- 50.0 180.0 59.1 20.0 31.0
Central Bank -- 90.6 294.1 -- -- 50.0 180.0 59.1 20.0 31.0
Commercial banks & OLFI's -- -- -- -- -- -- -- -- -- --
Public corporations -- -- -- -- -- -- -- -- -- --
Other -- -- -- -- -- -- -- -- -- --
ii) Long-term securities 235.0 170.6 375.0 -- -- 25.0 -- 50.0 115.0 --
Central Bank 65.0 18.0 31.5 -- -- -- -- 5.0 53.0 --
Commercial banks & OLFI's 16.8 107.8 14.3 -- -- -- -- 2.2 13.1 --
Public corporations 26.3 3.3 52.6 -- -- 25.0 -- -- -- --
Other 126.9 41.5 276.6 -- -- -- -- 42.8 48.9 --
iii) Loans and Advances 58.6 93.7 123.0 -- -- 30.0 -- 70.0 20.0 39.0
Central Bank 58.6 93.7 53.0 -- -- 30.0 -- -- 20.0 39.0
Commercial banks -- -- -- -- -- -- -- 70.0 -- --
III. Debt repayment 269.3 84.1 260.6 114.8 85.2 95.6 62.0 39.8 61.2 81.5
Domestic 260.5 75.0 247.0 103.1 66.8 90.0 60.0 35.0 60.0 75.8
Bahamian dollars 189.6 75.0 247.0 103.1 66.8 90.0 60.0 35.0 60.0 75.8
Internal foreign currency 70.9 -- -- -- -- -- -- -- -- --
External 8.8 9.1 13.6 11.7 18.4 5.6 2.0 4.8 1.2 5.7
IV.Net Sale of Shares & Other Equity 203.7 -- -- -- -- -- -- -- -- --
V. Cash balance change 26.4 5.5 (27.5) -- -- (7.4) (10.8) 3.9 (2.0) (52.5)
VI.Other Financing 192.3 94.0 (190.5) (6.9) 1.1 (86.7) (6.1) 13.9 (98.7) 31.2
Source: Treasury Monthly Printouts. Data compiled according to the International Monetary Fund's Government Finance Statistics format.
TABLE 11
GOVERNMENT OPERATIONS AND FINANCING
2013/14p
(B$ Millions)
2012/13pBudget
26

(B$' 000s)
End of Period 2011p 2012p 2013p
Dec. Mar Jun. Sept. Dec.
TOTAL EXTERNAL DEBT 799,515 1,038,300 1,176,009 1,038,300 1,053,677 1,058,911 1,161,461 1,176,009
By Instrument Government Securities 600,000 600,000 600,000 600,000 600,000 600,000 600,000 600,000
Loans 199,515 438,300 576,009 438,300 453,677 458,911 561,461 576,009By Holder 0 0 0 Commercial Banks -- -- -- -- -- -- -- -- Offshore Financial Institutions -- -- -- -- -- -- -- -- Multilateral Institutions 171,793 216,541 239,202 216,541 223,403 222,538 224,697 239,202 Bilateral Institutions 27,722 41,759 56,807 41,759 50,274 56,373 56,764 56,807 Private Capital Markets 600,000 600,000 600,000 600,000 600,000 600,000 600,000 600,000 Other Financial Institutions -- 180,000 280,000 180,000 180,000 180,000 280,000 280,000
TOTAL INTERNAL DEBT 3,006,080 3,357,317 3,795,658 3,357,317 3,477,317 3,631,458 3,726,457 3,795,658
By Instrument Foreign Currency -- -- 125,000 -- -- -- -- 125,000 Government Securities -- -- -- -- -- -- -- -- Loans -- -- 125,000 -- -- -- -- 125,000
Bahamian Dollars 3,006,080 3,357,317 3,670,658 3,357,317 3,477,317 3,631,458 3,726,457 3,670,658 Advances 110,588 105,657 134,657 105,657 105,657 105,657 125,657 134,657 Treasury Bills 301,609 349,142 579,282 349,142 529,142 588,282 588,282 579,282 Government Securities 2,593,637 2,872,273 2,956,473 2,872,273 2,842,273 2,867,273 2,962,273 2,956,473 Loans 246 30,246 246 30,246 246 70,246 50,246 246
By Holder Foreign Currency -- -- 125,000 -- -- -- -- 125,000 Commercial Banks -- -- 125,000 -- -- -- -- 125,000 Other Local Financial Institutions -- -- -- -- -- -- -- --
Bahamian Dollars 3,006,080 3,357,317 3,670,658 3,357,317 3,477,317 3,631,458 3,726,457 3,670,658 The Central Bank 292,802 404,992 542,419 404,992 460,731 485,076 548,860 542,419 Commercial Banks 1,118,286 1,187,797 1,345,740 1,187,797 1,276,391 1,389,354 1,388,364 1,345,740 Other Local Financial Iinstitutions 9,357 9,357 9,357 9,357 9,357 9,357 9,357 9,357 Public Corporations 684,963 730,169 684,911 730,169 709,637 700,106 687,546 684,911 Other 900,672 1,025,002 1,088,231 1,025,002 1,021,201 1,047,565 1,092,330 1,088,231TOTAL FOREIGN CURRENCY DEBT 799,515 1,038,300 1,301,009 1,038,300 1,053,677 1,058,911 1,161,461 1,301,009
TOTAL DIRECT CHARGE 3,805,595 4,395,618 4,971,667 4,395,617 4,530,994 4,690,369 4,887,918 4,971,667
TOTAL CONTINGENT LIABILITIES 558,227 603,316 601,064 603,316 598,477 604,564 606,515 601,064
TOTAL NATIONAL DEBT 4,363,822 4,998,934 5,572,731 4,998,934 5,129,471 5,294,933 5,494,433 5,572,731
Source: Treasury Accounts & Treasury Statistical Summary Printouts Public Corporation Reports Creditor Statements, Central Bank of The Bahamas
2013p2012p
TABLE 12
NATIONAL DEBT
27

(B$' 000s)
2011p 2012p 2013p
Dec. Mar. Jun. Sep. Dec.
2013p2012p
TABLE 13
PUBLIC SECTOR FOREIGN CURRENCY DEBT OPERATIONS
Dec. Mar. Jun. Sep. Dec.
Outstanding Debt at Beginning of Period 1,374,652 1,460,614 1,888,334 1,682,622 1,888,790 1,902,671 1,912,558 2,019,074
Government 798,460 799,118 1,037,844 833,768 1,038,300 1,053,677 1,058,911 1,161,461
Public Corporations 576,192 661,496 850,490 848,854 850,490 848,994 853,647 857,613
Plus: New Drawings 244,312 533,160 303,378 218,440 22,142 19,239 113,481 148,516
Government 79,519 250,078 276,218 210,106 17,355 10,075 103,745 145,043Government 79,519 250,078 276,218 210,106 17,355 10,075 103,745 145,043
Public Corporations 164,793 283,082 27,160 8,334 4,787 9,164 9,736 3,473
Less: Amortization 174,537 105,440 65,055 12,331 8,261 9,352 6,965 40,477
Government 78,861 11,352 13,724 5,633 1,978 4,841 1,195 5,710
Public Corporations 95,676 94,088 51,331 6,698 6,283 4,511 5,770 34,767
Other Changes in Debt Stock 16,412 -- 215 59 -- -- -- 215
Government -- -- 215 59 -- -- -- 215Government -- -- 215 59 -- -- -- 215
Public Corporations 16,187 -- -- -- -- -- -- --0 0 0
Outstanding Debt at End of Period 1,460,614 1,888,334 2,126,872 1,888,790 1,902,671 1,912,558 2,019,074 2,127,328
Government 799,118 1,037,844 1,300,553 1,038,300 1,053,677 1,058,911 1,161,461 1,301,009
Public Corporations 661,496 850,490 826,319 850,490 848,994 853,647 857,613 826,319
Interest Charges 73,800 98,493 109,902 40,256 18,632 36,243 14,659 40,368
Government 48,002 51,052 57,725 26,444 7,216 21,651 2,592 26,266
Public Corporations 25,798 47,441 52,177 13,812 11,416 14,592 12,067 14,102Public Corporations 25,798 47,441 52,177 13,812 11,416 14,592 12,067 14,102
Debt Service 248,337 203,933 174,957 52,587 26,893 45,595 21,624 80,845
Government 126,863 62,404 71,449 32,077 9,194 26,492 3,787 31,976
Public Corporations 121,474 141,529 103,508 20,510 17,699 19,103 17,837 48,869
Debt Service Ratio (%) 7.5 5.5 5.1 6.4 2.8 4.9 2.7 10.7
Government Debt Service/ 8.1 4.5 5.3 8.7 2.7 7.6 1.2 9.0Government Debt Service/ 8.1 4.5 5.3 8.7 2.7 7.6 1.2 9.0
Government Revenue (%)MEMORANDUM 0 0 0 0 0 0 0 0
Holder Distribution (B$ Mil): 1461.01 1888.79 2127.33 1,889 1,903 1,913 2,019 2,127
Commercial Banks 362.2 345.9 451.9 345.9 341.0 337.8 332.5 451.9
Multilateral Institutions 187.2 239.1 272.3 239.1 246.4 250.2 258.5 272.3
Bilateral Institutions 43.7 41.8 56.8 41.8 50.3 56.4 56.8 56.8
Other 267.9 662.1 746.3 662.1 665.0 668.1 771.3 746.3 Other 267.9 662.1 746.3 662.1 665.0 668.1 771.3 746.3
Private Capital Markets 600.0 600.0 600.0 600.0 600.0 600.0 600.0 600.0
Source: Treasury Accounts, Treasury Statistical Printouts and Quarterly Reports from Public Corporations, Central Bank of The Bahamas.
28

(B$ Millions)
2011p 2012p 2013p
Qtr.Ip Qtr.IIp Qtr.IIIp Qtr.IVp Qtr.Ip Qtr.IIp Qtr.IIIp Qtr.IVp
A. Current Account Balance (I+II+III+IV) (1,203.1) (1,499.7) (1,632.7) (360.2) (185.6) (517.2) (436.7) (237.0) (293.8) (533.1) (568.8)
I. Merchandise (Net) (2,132.1) (2,401.4) (2,217.1) (671.4) (578.7) (580.9) (570.4) (558.0) (536.0) (538.4) (584.7)
Exports 833.5 984.0 909.3 236.1 230.1 254.2 263.6 233.9 243.2 230.4 201.8
Imports 2,965.7 3,385.5 3,126.4 907.5 808.8 835.1 834.1 791.9 779.2 768.8 786.6
II. Services (Net) 1,201.2 1,153.7 902.4 362.8 453.0 149.9 188.0 367.5 307.2 108.2 119.5
Transportation (195.8) (264.6) (252.5) (75.8) (67.8) (66.0) (54.9) (65.6) (63.1) (67.0) (56.8)
Travel 1,895.3 2,025.7 1,899.1 606.7 609.1 420.8 389.2 594.2 543.3 392.1 369.6
Insurance Services (185.9) (193.7) (157.6) (44.9) (31.5) (71.9) (45.4) (33.1) (34.6) (44.0) (45.9)
Offshore Companies Local Expenses 138.9 176.4 170.1 40.2 47.7 44.4 44.1 35.1 41.4 37.7 55.9
Other Government 13.4 27.7 27.6 9.2 5.1 7.8 5.5 6.7 8.7 6.2 6.0
Other Services (464.7) (617.8) (784.3) (172.6) (109.5) (185.1) (150.6) (169.7) (188.5) (216.7) (209.3)
III. Income (Net) (236.0) (262.5) (325.0) (56.4) (65.4) (85.6) (55.2) (51.5) (77.7) (101.2) (94.6)
1. Compensation of Employees (47.9) (45.1) (35.8) (12.6) (13.6) (10.5) (8.4) (12.1) (9.7) (10.5) (3.5)
2. Investment Income (188.1) (217.4) (289.2) (43.8) (51.8) (75.0) (46.8) (39.4) (68.0) (90.7) (91.1)
IV. Current Transfers (Net) (36.2) 10.5 7.1 4.8 5.4 (0.7) 1.0 5.1 12.7 (1.8) (9.0)
1. General Government 113.4 120.7 126.4 32.0 33.1 32.2 23.2 34.8 35.4 28.9 27.3
2. Private Sector (149.6) (110.2) (119.3) (27.2) (27.7) (32.9) (22.3) (29.7) (22.7) (30.6) (36.2)
B. Capital and Financial Account (I+II) 986.4 1,140.4 895.5 171.0 399.6 330.6 239.2 38.5 226.4 226.3 404.2
(excl. Reserves)
I. Capital Account (Net Transfers) (5.5) (7.3) (9.6) (1.6) (1.3) (2.5) (1.8) (4.2) (1.3) (2.0) (2.2)
II. Financial Account (Net) 992.0 1,147.7 905.1 172.7 400.9 333.1 241.0 42.7 227.7 228.3 406.4
1. Direct Investment 666.6 360.2 366.1 49.3 255.9 58.5 (3.5) 101.6 82.6 34.6 147.3
2. Portfolio Investment (44.2) (37.0) (34.0) (6.3) (6.3) (9.9) (14.6) (9.2) (8.3) (2.1) (14.4)
3. Other Investments 369.6 824.4 573.0 129.6 151.2 284.5 259.1 (49.7) 153.4 195.7 273.5
Central Gov't Long Term Capital 70.7 238.7 28.2 9.3 21.4 3.5 204.5 12.7 0.6 0.6 14.3
Other Public Sector Capital 57.7 172.4 (0.2) 10.2 73.0 85.7 3.5 0.4 4.7 6.1 (11.5)
Banks (101.4) (2.3) 62.2 (23.0) (9.3) 56.2 (26.2) (84.8) 7.1 (24.3) 164.2
Other 342.6 415.6 482.9 133.0 66.1 139.1 77.4 22.0 141.1 213.3 106.50.0 0.0 0.0
C. Net Errors and Omissions 241.1 284.7 668.7 194.4 (176.0) 4.5 261.8 171.5 81.3 179.0 236.9
D. Overall Balance (A+B+C) 24.4 (74.7) (68.6) 5.2 37.9 (182.1) 64.3 (27.0) 13.9 (127.9) 72.40.0 0.0 0.0
E. Financing (Net) (24.4) 74.7 68.6 (5.2) (37.9) 182.1 (64.3) 27.0 (13.9) 127.9 (72.4)
Change in SDR holdings 0.7 146.8 (30.1) (1.6) 3.6 (2.8) 147.5 0.7 (0.1) (0.5) (30.3)
Change in Reserve Position with the IMF 0.0 (0.0) (0.0) (0.1) 0.2 (0.2) 0.0 0.2 (0.0) (0.2) (0.0)
Change in Ext. Foreign Assets ( ) = Increase (25.1) (72.1) 98.7 (3.5) (41.8) 185.1 (211.9) 26.0 (13.8) 128.6 (42.1)
Source: The Central Bank of the Bahamas
* Figures may not sum to total due to rounding
2012 2013
TABLE 14
BALANCE OF PAYMENTS SUMMARY*
29

(B$ '000)
2010 2011 2012
Qtr. III Qtr. IV Qtr. I Qtr. II Qtr. III Qtr. IV Qtr. I Qtr. II
I. OIL TRADE
i) Exports 159,706 216,129 319,713 42,222 48,530 59,996 71,162 97,536 91,019 80,629 60,271
ii) Imports 687,073 930,047 874,839 251,101 204,288 233,012 215,571 211,509 214,747 199,474 139,758
II. OTHER MERCHANDISE
Domestic Exports
Crawfish 68,371 64,337 70,936 10,387 29,559 19,132 8,633 13,613 29,558 10,943 8,959
Fish Conch & other Crustacea 4,013 4,371 3,141 548 166 633 1,349 636 524 835 2,243
Other cordials &Similar Materials/Sponge 546 842 488 -- 152 186 143 159 -- -- 157
Fruits & Vegs. 195 24 -- -- -- -- -- -- -- -- --
Aragonite 11,688 11,497 7,298 1,248 2,889 3,604 1,132 2,298 264 188 617
Other Natural Sands 2,931 2,893 3,175 1,232 783 1,352 325 773 726 35 34
Rum/Beverages/Spirits & Vinegar -- -- -- -- -- -- -- -- -- -- --
Crude Salt 16,429 12,022 11,687 1,577 1,465 1,117 1,658 2,684 6,228 4,212 4,872
Polystrene Products 104,076 135,846 7,676 35,826 35,519 1,307 1,691 2,727 1,951 41,286 44,002
Other 96,570 94,611 86,633 32,280 18,151 20,726 26,465 20,738 18,704 7,605 25,831
i) Total Domestic Exports 304,819 326,443 336,522 83,098 88,684 84,933 78,371 79,218 94,000 65,088 86,716
ii) Re-Exports 156,969 184,371 171,449 52,302 42,026 58,476 40,841 37,424 34,708 46,555 68,906
iii) Total Exports (i+ii) 461,788 510,814 507,972 135,400 130,710 143,408 119,213 116,643 128,708 111,644 155,622
iv) Imports 2,175,688 2,480,809 2,772,177 645,961 720,180 788,696 652,039 652,799 678,643 621,868 670,844
v) Retained Imports (iv-ii) 2,018,719 2,296,438 2,600,728 593,659 678,154 730,220 611,198 615,375 643,935 575,313 601,938
vi) Trade Balance (i-v) (1,713,900) (1,969,995) (2,264,206) (510,561) (589,470) (645,287) (532,827) (536,157) (549,935) (510,225) (515,222)
Source: Department of Statistics Quarterly Statistical Summaries
TABLE 15
EXTERNAL TRADE
2012 20132011
30

Period 2011 2012 2013
Qtr. I Qtr. II Qtr. III Qtr. IV Qtr. I Qtr. II Qtr. III Qtr. IV
Visitor ArrivalsR
5,587,585 4,447,565 6,150,784 1,690,249 1,490,389 1,266,927 1,492,605 1,745,420 1,479,221 1,325,162 1,600,981
Air 1,267,540 1,072,963 1,280,736 356,608 396,980 319,375 284,468 344,494 362,465 296,503 277,274
Sea 4,320,045 3,374,602 4,870,048 1,333,641 1,093,409 947,552 1,208,137 1,400,926 1,116,756 1,028,659 1,323,707
Visitor Type
StopoverR1,345,920 1,136,787 1,363,496 370,298 418,551 347,938 284,789 359,371 388,218 329,790 286,117
Cruise 4,161,556 3,248,694 4,709,236 1,302,956 1,042,882 902,856 1,185,467 1,368,283 1,066,465 980,081 1,294,407
Day/Transit n.a. n.a. n.a n.a n.a n.a n.a n.a n.a n.a n.a
Tourist Expenditure(B$ 000's) 2,142 2,311 n.a n.a n.a n.a n.a n.a n.a n.a n.a
Stopover 1,792 1,897 n.a n.a n.a n.a n.a n.a n.a n.a n.a
Cruise 347 413 n.a n.a n.a n.a n.a n.a n.a n.a n.a
Day 3 2 n.a n.a n.a n.a n.a n.a n.a n.a n.a
Number of Hotel Nights n.a n.a n.a n.a n.a n.a n.a n.a n.a n.a n.a
Average Length of Stay n.a n.a n.a n.a n.a n.a n.a n.a n.a n.a n.a
Average Hotel Occupancy Rates (%)R
New Providence 58.8 66.1 n.a 68.0 68.3 62.1 48.0 62.6 61.1 58.3 n.a
Grand Bahama 42.3 47.1 n.a 51.0 52.1 38.3 33.0 46.4 45.4 40.9 n.a
Other Family Islands 39.0 42.0 n.a 40.0 45.3 40.7 26.0 40.4 42.2 41.4 n.a
Average Nightly Room Rates ($)R
New Providence 224.8 227.3 n.a 258.0 227.1 196.9 210.1 263.6 232.4 200.5 n.a
Grand Bahama 86.8 79.7 n.a 80.7 84.7 73.7 96.0 87.3 82.0 83.9 n.a
Other Family Islands 152.2 153.5 n.a 163.5 165.4 131.7 209.1 196.4 172.7 147.6 n.a
Source: The Ministry of Tourism
2012
TABLE 16
SELECTED TOURISM STATISTICS
2013
31