Quarterly Economic Report Fourth Quarter 2017 - Jeffco...
13
Jefferson County, Colorado Quarterly Economic Report – Fourth Quarter 2017
Transcript of Quarterly Economic Report Fourth Quarter 2017 - Jeffco...
Jefferson County, Colorado
Quarterly Economic Report – Fourth Quarter 2017
Jefferson County Quarterly Economic Report – Fourth Quarter 2017
Page 1
Quarterly Economic Summary
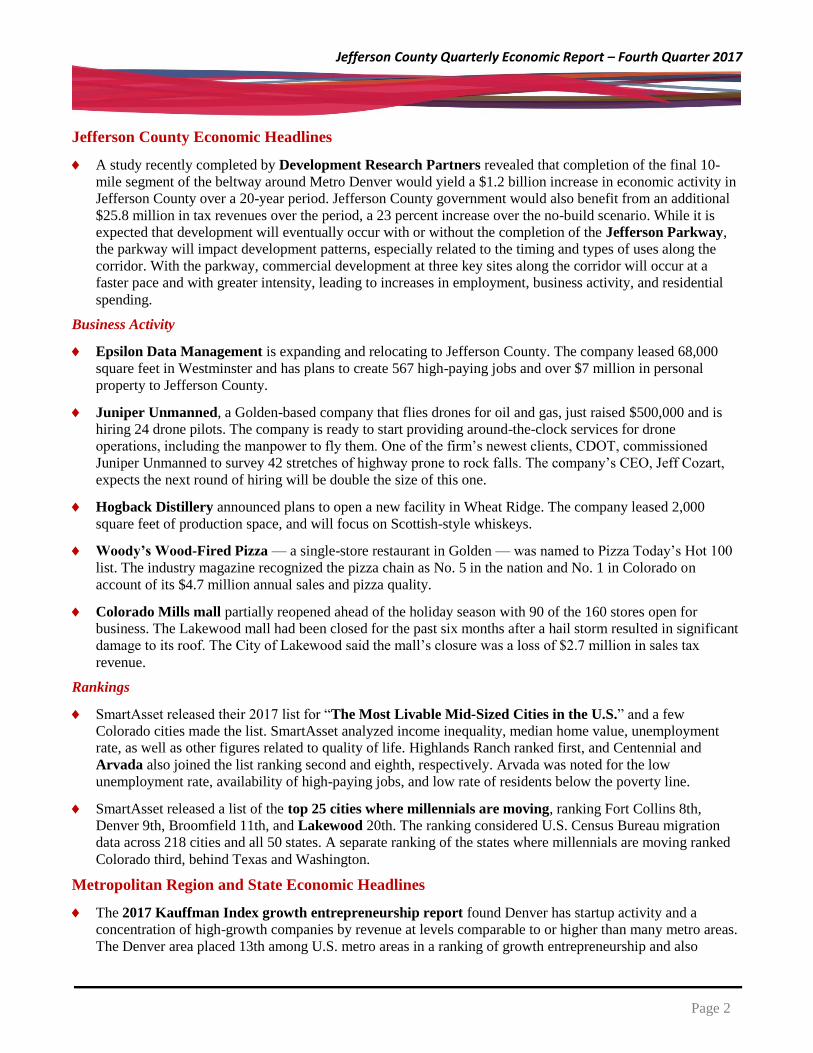
Employment233,109
Down 0.3% from 2Q 2016
Existing Home Sales3,125
Down 4.3% from 3Q 2016
2017Fourth Quarter
Unemployment Rate2.2%
Down 0.7 percentage points
from 3Q 2016
Single-Family Detached Average Price$459,296
Up 5.6% from 3Q 2016
Single-Family Attached Average Price$261,144
Up 10.7% from 3Q 2016
Retail Vacancy Rate 4.9%
Office Class A Average Lease Rate $26.65
Industrial Warehouse Average Lease Rate $8.83
Flex R&D Vacancy Rate 10.2%
Flex R&D Average Lease Rate $10.20
Retail Average Lease Rate $15.01
3.4%
Apartment Vacancy Rate
Apartment Average Lease Rate
Up 0.3 percentage points from
3Q 2016
Up 2% from 3Q 2016
4.4%
Industrial Warehouse Vacancy Rate
Office Class A Vacancy Rate 9.7%
$1,370
Residential Building
Permits
915Up 21.8% from 3Q 2016
220,000
225,000
230,000
235,000
240,000
2Q16 3Q16 4Q16 1Q17 2Q17
0.0% 1.0% 2.0% 3.0% 4.0% 5.0%
U.S.
Colorado
Metro Denver
Jefferson County
3Q 2017
-
600
1,200
1,800
2,400
3Q16 3Q17
SFA
SFD
$200,000
$300,000
$400,000
$500,000
3Q16 4Q16 1Q17 2Q17 3Q17
SFA SFD
3.5%
4.0%
4.5%
5.0%
$1,000
$1,100
$1,200
$1,300
$1,400
3Q16 4Q16 1Q17 2Q17 3Q17
0
300
600
900
1,200
3Q16 4Q16 1Q17 2Q17 3Q17
0.0%
4.0%
8.0%
12.0%
Class A
Office
Industrial Flex Retail
3Q16 3Q17
$0.00 $6.00 $12.00 $18.00 $24.00
Retail
Flex
Industrial
Class A Office
3Q16 3Q17
Jefferson County Quarterly Economic Report – Fourth Quarter 2017
Page 2
Jefferson County Economic Headlines
A study recently completed by Development Research Partners revealed that completion of the final 10-
mile segment of the beltway around Metro Denver would yield a $1.2 billion increase in economic activity in
Jefferson County over a 20-year period. Jefferson County government would also benefit from an additional
$25.8 million in tax revenues over the period, a 23 percent increase over the no-build scenario. While it is
expected that development will eventually occur with or without the completion of the Jefferson Parkway,
the parkway will impact development patterns, especially related to the timing and types of uses along the
corridor. With the parkway, commercial development at three key sites along the corridor will occur at a
faster pace and with greater intensity, leading to increases in employment, business activity, and residential
spending.
Business Activity
Epsilon Data Management is expanding and relocating to Jefferson County. The company leased 68,000
square feet in Westminster and has plans to create 567 high-paying jobs and over $7 million in personal
property to Jefferson County.
Juniper Unmanned, a Golden-based company that flies drones for oil and gas, just raised $500,000 and is
hiring 24 drone pilots. The company is ready to start providing around-the-clock services for drone
operations, including the manpower to fly them. One of the firm’s newest clients, CDOT, commissioned
Juniper Unmanned to survey 42 stretches of highway prone to rock falls. The company’s CEO, Jeff Cozart,
expects the next round of hiring will be double the size of this one.
Hogback Distillery announced plans to open a new facility in Wheat Ridge. The company leased 2,000
square feet of production space, and will focus on Scottish-style whiskeys.
Woody’s Wood-Fired Pizza — a single-store restaurant in Golden — was named to Pizza Today’s Hot 100
list. The industry magazine recognized the pizza chain as No. 5 in the nation and No. 1 in Colorado on
account of its $4.7 million annual sales and pizza quality.
Colorado Mills mall partially reopened ahead of the holiday season with 90 of the 160 stores open for
business. The Lakewood mall had been closed for the past six months after a hail storm resulted in significant
damage to its roof. The City of Lakewood said the mall’s closure was a loss of $2.7 million in sales tax
revenue.
Rankings
SmartAsset released their 2017 list for “The Most Livable Mid-Sized Cities in the U.S.” and a few
Colorado cities made the list. SmartAsset analyzed income inequality, median home value, unemployment
rate, as well as other figures related to quality of life. Highlands Ranch ranked first, and Centennial and
Arvada also joined the list ranking second and eighth, respectively. Arvada was noted for the low
unemployment rate, availability of high-paying jobs, and low rate of residents below the poverty line.
SmartAsset released a list of the top 25 cities where millennials are moving, ranking Fort Collins 8th,
Denver 9th, Broomfield 11th, and Lakewood 20th. The ranking considered U.S. Census Bureau migration
data across 218 cities and all 50 states. A separate ranking of the states where millennials are moving ranked
Colorado third, behind Texas and Washington.
Metropolitan Region and State Economic Headlines
The 2017 Kauffman Index growth entrepreneurship report found Denver has startup activity and a
concentration of high-growth companies by revenue at levels comparable to or higher than many metro areas.
The Denver area placed 13th among U.S. metro areas in a ranking of growth entrepreneurship and also
Jefferson County Quarterly Economic Report – Fourth Quarter 2017
Page 3
reached 13th in a study focused on tech startup job openings. While Denver is one of the top U.S. cities for
entrepreneurs and tech startups, companies starting here are not adding as many jobs as quickly or growing as
large as they are in the most entrepreneurial American metro areas.
The ACBJ Economic Index rated Denver 10 out of 100 largest U.S. cities on the strength of their economies.
Denver was noted for its almost non-existent unemployment rate, currently the lowest of all 100 markets.
Provo, Utah ranked first.
According to a new report by the University of Minnesota, Denver ranked No. 10 nationally when it comes to
the "top 10 metro areas for job accessibility by transit." The nation's 49 largest cities were ranked by the
study, which ranked New York No. 1 in the country, followed by San Francisco. According to the report,
Denver grew its transit-oriented job base by 5.14 percent from 2015 to 2016, the 14th-highest growth rate in
the country.
The University of Colorado Boulder Leeds School of Business released their fourth quarter Leeds Business
Confidence Index (LBCI) for 2017. The overall expectations for both the national economy and state
economy slowed for the second consecutive quarter in the fourth quarter of 2017, but the outlook remained
positive. The index value of 56.5 for the fourth quarter of 2017 was down 3.2 points from last quarter but up
3.5 points from the fourth quarter of 2016. Of the index components, national expectations decreased from
54.6 to 51.4, and state expectations fell from 60.9 in the third quarter to 58.8 in the fourth. LBCI panelists
responded that there were concerns in Colorado about labor market shortages and statewide housing prices.
For the nation, respondents expressed concern about the general political landscape.
The annual “State Business Tax Climate Index” prepared by the Tax Foundation ranked Colorado No. 18
overall. The rank is meant to look at each state’s tax structure, to show that states with transparent, less
complicated tax codes rank higher in business tax climates. Of the various index components, Colorado
ranked No. 14 for property tax, No. 15 for individual income tax, and No. 18 for corporate tax.
Small businesses in Colorado secured a record $902 million in U.S. Small Business Administration-
backed loans in the fiscal year that ended September 30th. Across the state there were 1,758 guaranteed loans
given to small businesses through the SBA lending program. 547 loans worth $263.5 million went to women-
owned businesses.
Business filings in Colorado were up 5.1 percent over-the-year, according to the latest report issued by
Colorado Secretary of State Wayne Williams. The pace of business dissolution filings also accelerated in the
third quarter, up 18.1 percent year over year. Richard Wobbekind, executive director of the CU/Leeds
Business Research Division, believes employment growth in 2018 will be more subdued than in 2017. He
suggests that the low unemployment rate, coupled with slow growth in the primary working-age population,
will constrain potential growth.
Employment Activity
Business Count, Average Weekly Wage, and Employment by Supersector
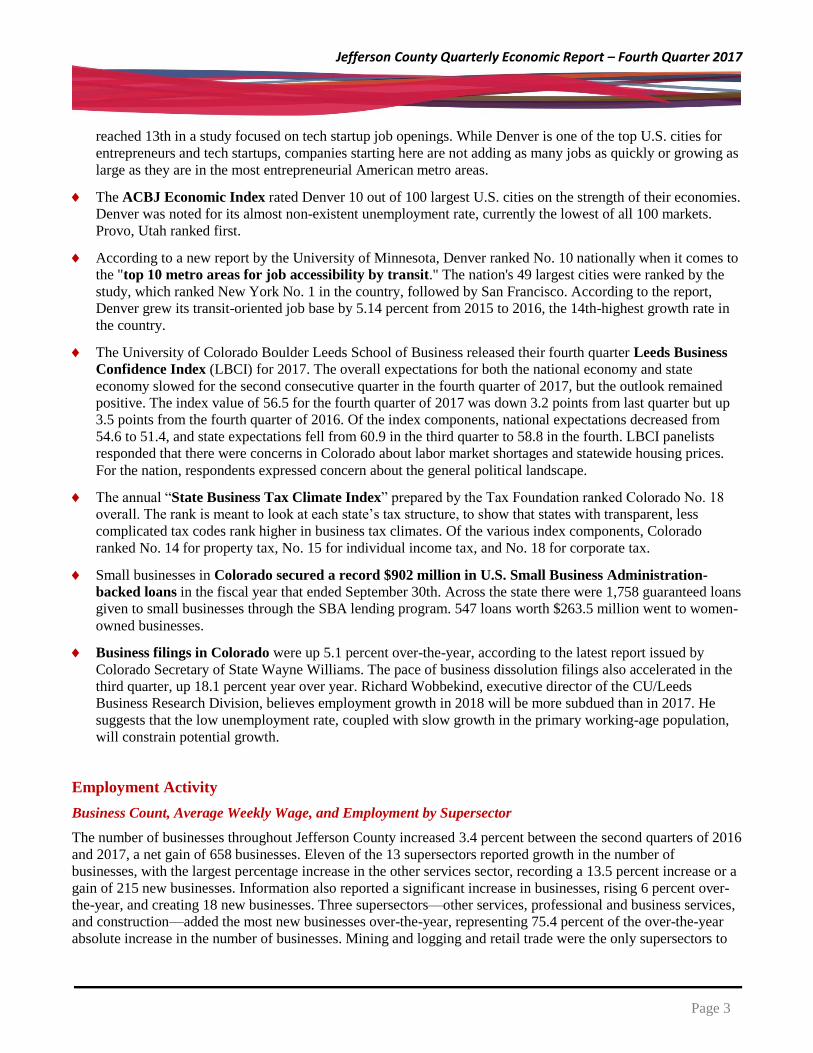
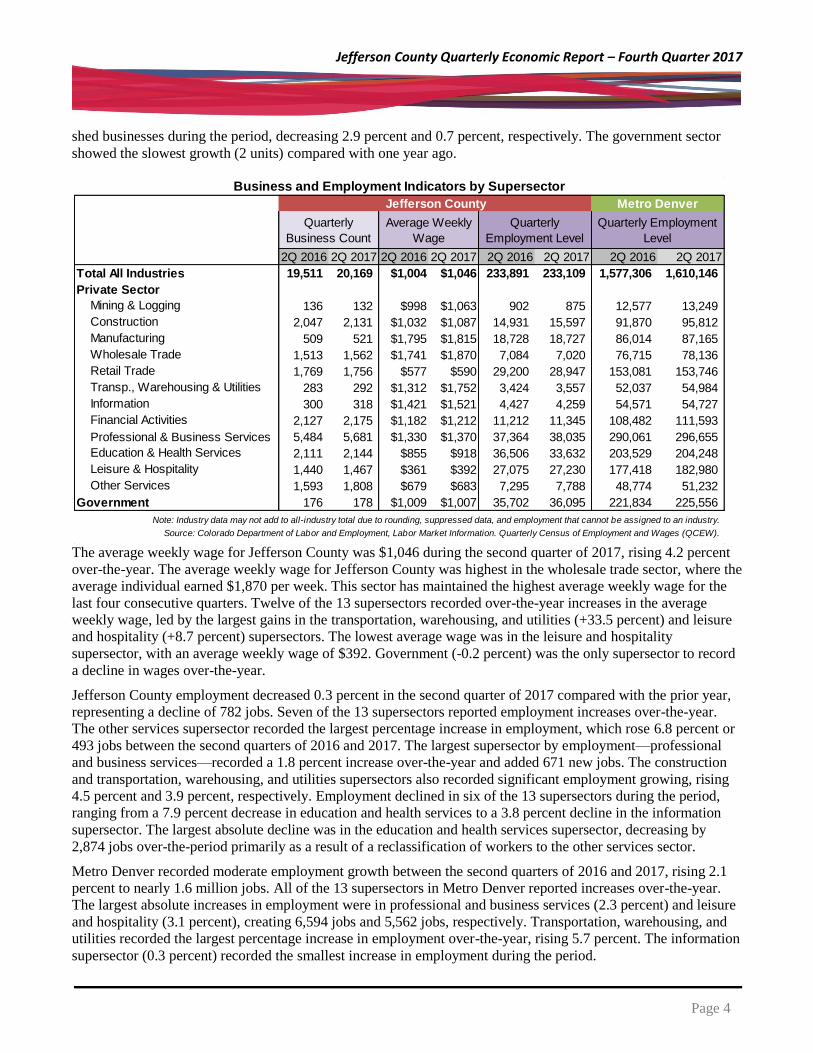
The number of businesses throughout Jefferson County increased 3.4 percent between the second quarters of 2016
and 2017, a net gain of 658 businesses. Eleven of the 13 supersectors reported growth in the number of
businesses, with the largest percentage increase in the other services sector, recording a 13.5 percent increase or a
gain of 215 new businesses. Information also reported a significant increase in businesses, rising 6 percent over-
the-year, and creating 18 new businesses. Three supersectors—other services, professional and business services,
and construction—added the most new businesses over-the-year, representing 75.4 percent of the over-the-year
absolute increase in the number of businesses. Mining and logging and retail trade were the only supersectors to
Jefferson County Quarterly Economic Report – Fourth Quarter 2017
Page 4
shed businesses during the period, decreasing 2.9 percent and 0.7 percent, respectively. The government sector
showed the slowest growth (2 units) compared with one year ago.
The average weekly wage for Jefferson County was $1,046 during the second quarter of 2017, rising 4.2 percent
over-the-year. The average weekly wage for Jefferson County was highest in the wholesale trade sector, where the
average individual earned $1,870 per week. This sector has maintained the highest average weekly wage for the
last four consecutive quarters. Twelve of the 13 supersectors recorded over-the-year increases in the average
weekly wage, led by the largest gains in the transportation, warehousing, and utilities (+33.5 percent) and leisure
and hospitality (+8.7 percent) supersectors. The lowest average wage was in the leisure and hospitality
supersector, with an average weekly wage of $392. Government (-0.2 percent) was the only supersector to record
a decline in wages over-the-year.
Jefferson County employment decreased 0.3 percent in the second quarter of 2017 compared with the prior year,
representing a decline of 782 jobs. Seven of the 13 supersectors reported employment increases over-the-year.
The other services supersector recorded the largest percentage increase in employment, which rose 6.8 percent or
493 jobs between the second quarters of 2016 and 2017. The largest supersector by employment—professional
and business services—recorded a 1.8 percent increase over-the-year and added 671 new jobs. The construction
and transportation, warehousing, and utilities supersectors also recorded significant employment growing, rising
4.5 percent and 3.9 percent, respectively. Employment declined in six of the 13 supersectors during the period,
ranging from a 7.9 percent decrease in education and health services to a 3.8 percent decline in the information
supersector. The largest absolute decline was in the education and health services supersector, decreasing by
2,874 jobs over-the-period primarily as a result of a reclassification of workers to the other services sector.
Metro Denver recorded moderate employment growth between the second quarters of 2016 and 2017, rising 2.1
percent to nearly 1.6 million jobs. All of the 13 supersectors in Metro Denver reported increases over-the-year.
The largest absolute increases in employment were in professional and business services (2.3 percent) and leisure
and hospitality (3.1 percent), creating 6,594 jobs and 5,562 jobs, respectively. Transportation, warehousing, and
utilities recorded the largest percentage increase in employment over-the-year, rising 5.7 percent. The information
supersector (0.3 percent) recorded the smallest increase in employment during the period.
2Q 2016 2Q 2017 2Q 2016 2Q 2017 2Q 2016 2Q 2017 2Q 2016 2Q 2017
19,511 20,169 $1,004 $1,046 233,891 233,109 1,577,306 1,610,146
Mining & Logging 136 132 $998 $1,063 902 875 12,577 13,249
Construction 2,047 2,131 $1,032 $1,087 14,931 15,597 91,870 95,812
Manufacturing 509 521 $1,795 $1,815 18,728 18,727 86,014 87,165
Wholesale Trade 1,513 1,562 $1,741 $1,870 7,084 7,020 76,715 78,136
Retail Trade 1,769 1,756 $577 $590 29,200 28,947 153,081 153,746
Transp., Warehousing & Utilities 283 292 $1,312 $1,752 3,424 3,557 52,037 54,984
Information 300 318 $1,421 $1,521 4,427 4,259 54,571 54,727
Financial Activities 2,127 2,175 $1,182 $1,212 11,212 11,345 108,482 111,593
Professional & Business Services 5,484 5,681 $1,330 $1,370 37,364 38,035 290,061 296,655
Education & Health Services 2,111 2,144 $855 $918 36,506 33,632 203,529 204,248
Leisure & Hospitality 1,440 1,467 $361 $392 27,075 27,230 177,418 182,980
Other Services 1,593 1,808 $679 $683 7,295 7,788 48,774 51,232
176 178 $1,009 $1,007 35,702 36,095 221,834 225,556
Total All Industries
Jefferson County Metro Denver
Average Weekly
Wage
Quarterly
Business Count
Note: Industry data may not add to all-industry total due to rounding, suppressed data, and employment that cannot be assigned to an industry.
Source: Colorado Department of Labor and Employment, Labor Market Information. Quarterly Census of Employment and Wages (QCEW).
Business and Employment Indicators by Supersector
Quarterly Employment
Level
Quarterly
Employment Level
Government
Private Sector
Jefferson County Quarterly Economic Report – Fourth Quarter 2017
Page 5
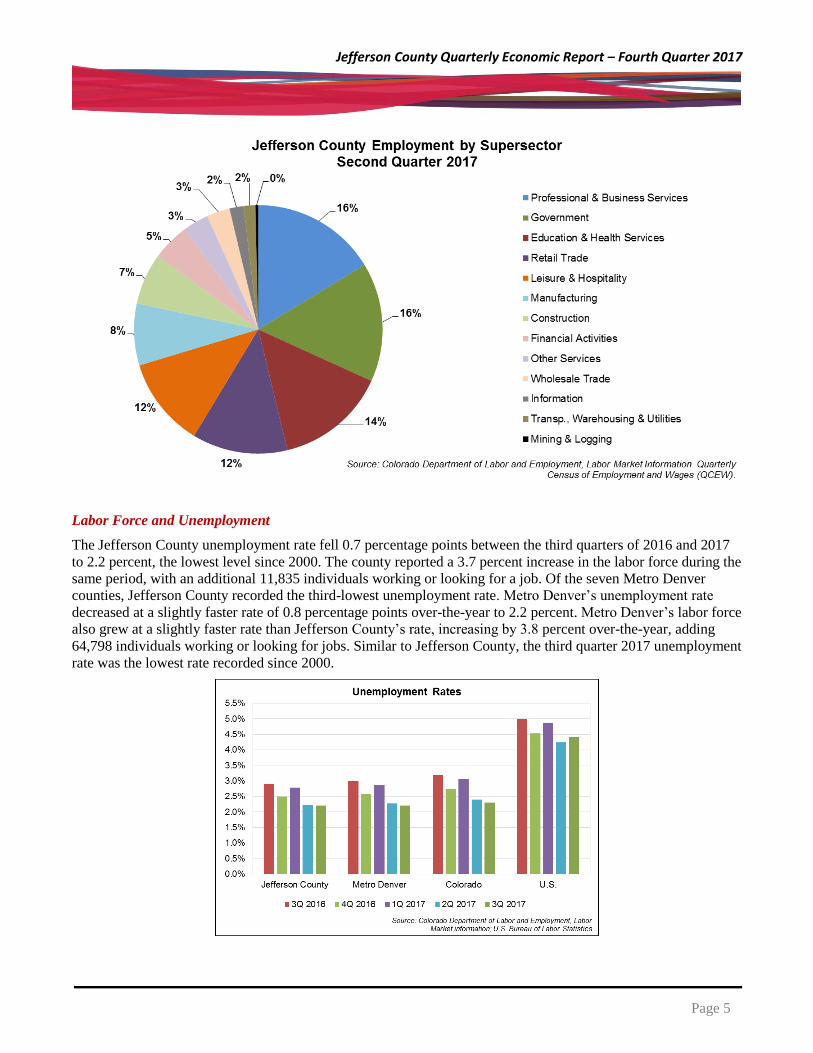
Labor Force and Unemployment
The Jefferson County unemployment rate fell 0.7 percentage points between the third quarters of 2016 and 2017
to 2.2 percent, the lowest level since 2000. The county reported a 3.7 percent increase in the labor force during the
same period, with an additional 11,835 individuals working or looking for a job. Of the seven Metro Denver
counties, Jefferson County recorded the third-lowest unemployment rate. Metro Denver’s unemployment rate
decreased at a slightly faster rate of 0.8 percentage points over-the-year to 2.2 percent. Metro Denver’s labor force
also grew at a slightly faster rate than Jefferson County’s rate, increasing by 3.8 percent over-the-year, adding
64,798 individuals working or looking for jobs. Similar to Jefferson County, the third quarter 2017 unemployment
rate was the lowest rate recorded since 2000.
Jefferson County Quarterly Economic Report – Fourth Quarter 2017
Page 6
Colorado’s unemployment rate declined 0.9 percentage points over-the-year to 2.3 percent and the state’s labor
force rose 3.6 percent over-the-year. The unemployment rate in the U.S. declined 0.6 percentage points
between the third quarters of 2016 and 2017 to 4.4 percent, with a 0.8 percent increase in the labor force over
this period of time.
Consumer Activity
Consumer Confidence
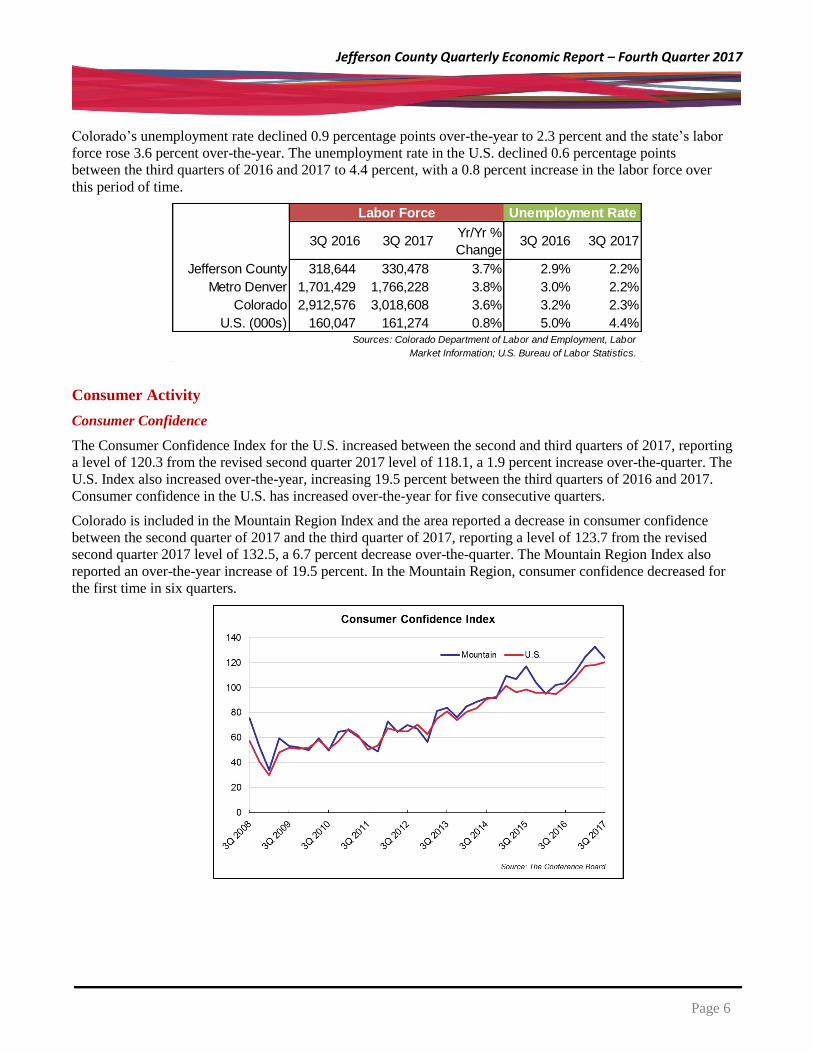
The Consumer Confidence Index for the U.S. increased between the second and third quarters of 2017, reporting
a level of 120.3 from the revised second quarter 2017 level of 118.1, a 1.9 percent increase over-the-quarter. The
U.S. Index also increased over-the-year, increasing 19.5 percent between the third quarters of 2016 and 2017.
Consumer confidence in the U.S. has increased over-the-year for five consecutive quarters.
Colorado is included in the Mountain Region Index and the area reported a decrease in consumer confidence
between the second quarter of 2017 and the third quarter of 2017, reporting a level of 123.7 from the revised
second quarter 2017 level of 132.5, a 6.7 percent decrease over-the-quarter. The Mountain Region Index also
reported an over-the-year increase of 19.5 percent. In the Mountain Region, consumer confidence decreased for
the first time in six quarters.
3Q 2016 3Q 2017Yr/Yr %
Change3Q 2016 3Q 2017
Jefferson County 318,644 330,478 3.7% 2.9% 2.2%
Metro Denver 1,701,429 1,766,228 3.8% 3.0% 2.2%
Colorado 2,912,576 3,018,608 3.6% 3.2% 2.3%
U.S. (000s) 160,047 161,274 0.8% 5.0% 4.4%
Labor Force Unemployment Rate
Sources: Colorado Department of Labor and Employment, Labor
Market Information; U.S. Bureau of Labor Statistics.
Jefferson County Quarterly Economic Report – Fourth Quarter 2017
Page 7
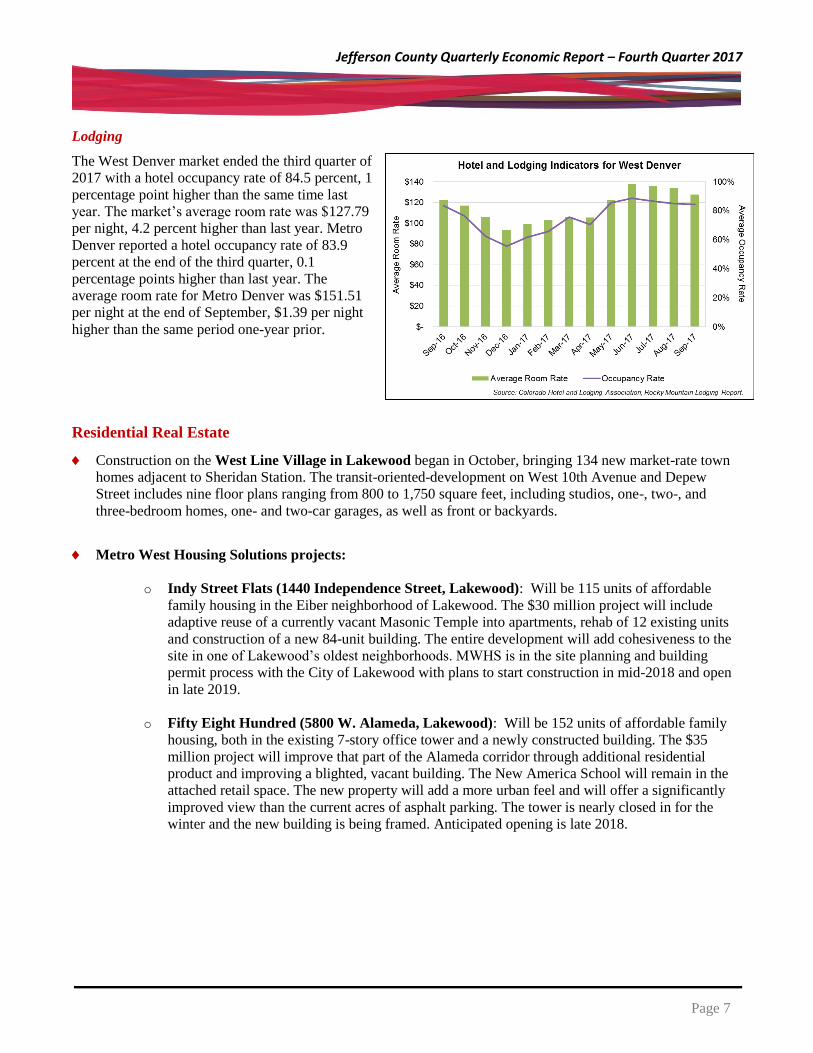
Lodging
The West Denver market ended the third quarter of
2017 with a hotel occupancy rate of 84.5 percent, 1
percentage point higher than the same time last
year. The market’s average room rate was $127.79
per night, 4.2 percent higher than last year. Metro
Denver reported a hotel occupancy rate of 83.9
percent at the end of the third quarter, 0.1
percentage points higher than last year. The
average room rate for Metro Denver was $151.51
per night at the end of September, $1.39 per night
higher than the same period one-year prior.
Residential Real Estate
Construction on the West Line Village in Lakewood began in October, bringing 134 new market-rate town
homes adjacent to Sheridan Station. The transit-oriented-development on West 10th Avenue and Depew
Street includes nine floor plans ranging from 800 to 1,750 square feet, including studios, one-, two-, and
three-bedroom homes, one- and two-car garages, as well as front or backyards.
Metro West Housing Solutions projects:
o Indy Street Flats (1440 Independence Street, Lakewood): Will be 115 units of affordable
family housing in the Eiber neighborhood of Lakewood. The $30 million project will include
adaptive reuse of a currently vacant Masonic Temple into apartments, rehab of 12 existing units
and construction of a new 84-unit building. The entire development will add cohesiveness to the
site in one of Lakewood’s oldest neighborhoods. MWHS is in the site planning and building
permit process with the City of Lakewood with plans to start construction in mid-2018 and open
in late 2019.
o Fifty Eight Hundred (5800 W. Alameda, Lakewood): Will be 152 units of affordable family
housing, both in the existing 7-story office tower and a newly constructed building. The $35
million project will improve that part of the Alameda corridor through additional residential
product and improving a blighted, vacant building. The New America School will remain in the
attached retail space. The new property will add a more urban feel and will offer a significantly
improved view than the current acres of asphalt parking. The tower is nearly closed in for the
winter and the new building is being framed. Anticipated opening is late 2018.
Jefferson County Quarterly Economic Report – Fourth Quarter 2017
Page 8
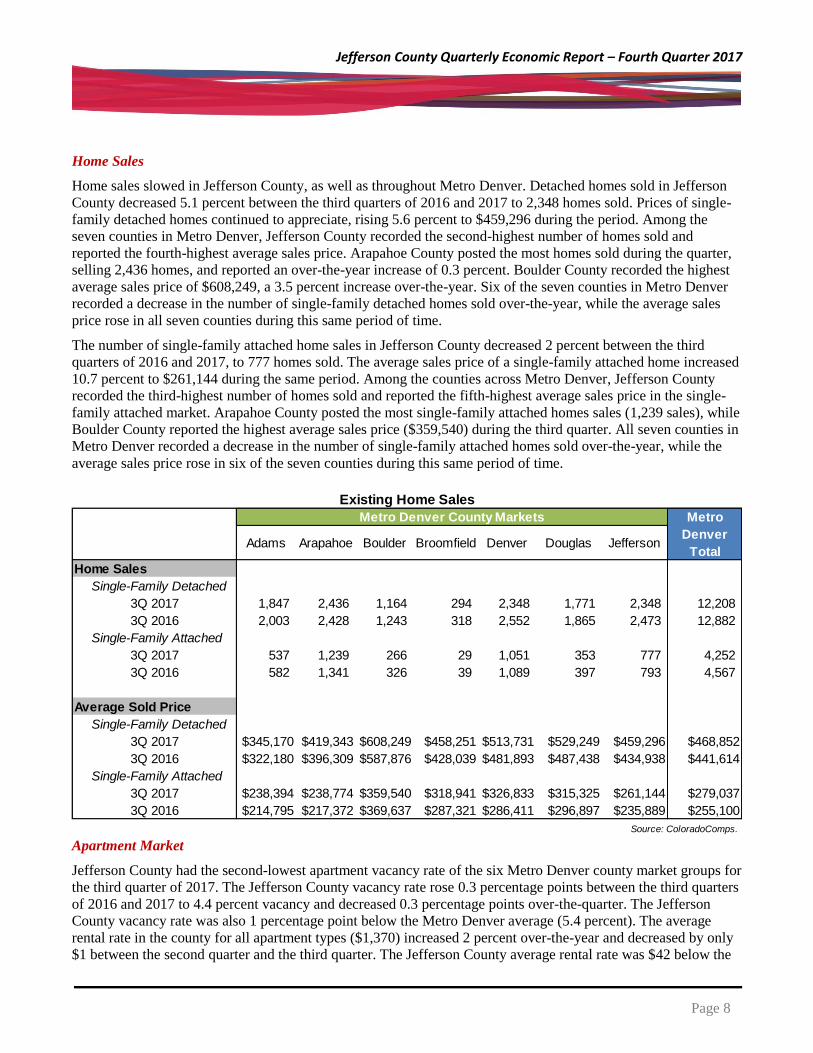
Home Sales
Home sales slowed in Jefferson County, as well as throughout Metro Denver. Detached homes sold in Jefferson
County decreased 5.1 percent between the third quarters of 2016 and 2017 to 2,348 homes sold. Prices of single-
family detached homes continued to appreciate, rising 5.6 percent to $459,296 during the period. Among the
seven counties in Metro Denver, Jefferson County recorded the second-highest number of homes sold and
reported the fourth-highest average sales price. Arapahoe County posted the most homes sold during the quarter,
selling 2,436 homes, and reported an over-the-year increase of 0.3 percent. Boulder County recorded the highest
average sales price of $608,249, a 3.5 percent increase over-the-year. Six of the seven counties in Metro Denver
recorded a decrease in the number of single-family detached homes sold over-the-year, while the average sales
price rose in all seven counties during this same period of time.
The number of single-family attached home sales in Jefferson County decreased 2 percent between the third
quarters of 2016 and 2017, to 777 homes sold. The average sales price of a single-family attached home increased
10.7 percent to $261,144 during the same period. Among the counties across Metro Denver, Jefferson County
recorded the third-highest number of homes sold and reported the fifth-highest average sales price in the single-
family attached market. Arapahoe County posted the most single-family attached homes sales (1,239 sales), while
Boulder County reported the highest average sales price ($359,540) during the third quarter. All seven counties in
Metro Denver recorded a decrease in the number of single-family attached homes sold over-the-year, while the
average sales price rose in six of the seven counties during this same period of time.
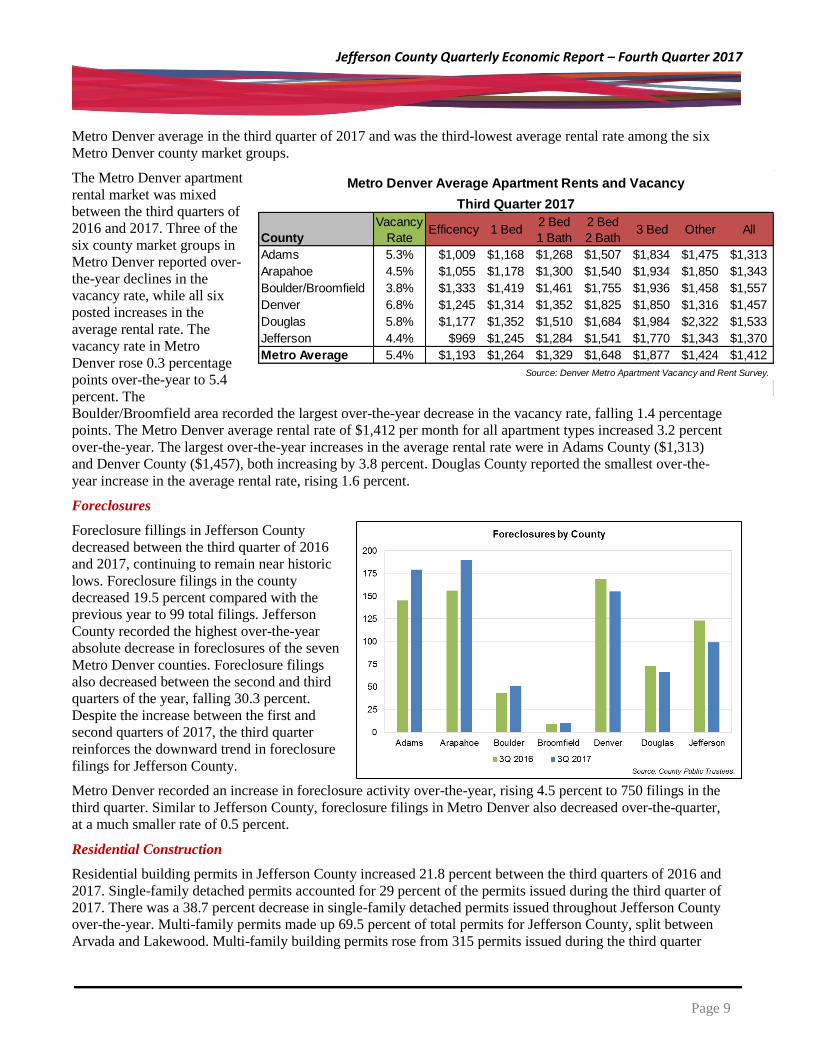
Apartment Market
Jefferson County had the second-lowest apartment vacancy rate of the six Metro Denver county market groups for
the third quarter of 2017. The Jefferson County vacancy rate rose 0.3 percentage points between the third quarters
of 2016 and 2017 to 4.4 percent vacancy and decreased 0.3 percentage points over-the-quarter. The Jefferson
County vacancy rate was also 1 percentage point below the Metro Denver average (5.4 percent). The average
rental rate in the county for all apartment types ($1,370) increased 2 percent over-the-year and decreased by only
$1 between the second quarter and the third quarter. The Jefferson County average rental rate was $42 below the
Adams Arapahoe Boulder Broomfield Denver Douglas Jefferson
Home Sales
Single-Family Detached
3Q 2017 1,847 2,436 1,164 294 2,348 1,771 2,348 12,208
3Q 2016 2,003 2,428 1,243 318 2,552 1,865 2,473 12,882
Single-Family Attached
3Q 2017 537 1,239 266 29 1,051 353 777 4,252
3Q 2016 582 1,341 326 39 1,089 397 793 4,567
Average Sold Price
Single-Family Detached
3Q 2017 $345,170 $419,343 $608,249 $458,251 $513,731 $529,249 $459,296 $468,852
3Q 2016 $322,180 $396,309 $587,876 $428,039 $481,893 $487,438 $434,938 $441,614
Single-Family Attached
3Q 2017 $238,394 $238,774 $359,540 $318,941 $326,833 $315,325 $261,144 $279,037
3Q 2016 $214,795 $217,372 $369,637 $287,321 $286,411 $296,897 $235,889 $255,100
Metro
Denver
Total
Metro Denver County Markets
Source: ColoradoComps.
Existing Home Sales
Jefferson County Quarterly Economic Report – Fourth Quarter 2017
Page 9
Metro Denver average in the third quarter of 2017 and was the third-lowest average rental rate among the six
Metro Denver county market groups.
The Metro Denver apartment
rental market was mixed
between the third quarters of
2016 and 2017. Three of the
six county market groups in
Metro Denver reported over-
the-year declines in the
vacancy rate, while all six
posted increases in the
average rental rate. The
vacancy rate in Metro
Denver rose 0.3 percentage
points over-the-year to 5.4
percent. The
Boulder/Broomfield area recorded the largest over-the-year decrease in the vacancy rate, falling 1.4 percentage
points. The Metro Denver average rental rate of $1,412 per month for all apartment types increased 3.2 percent
over-the-year. The largest over-the-year increases in the average rental rate were in Adams County ($1,313)
and Denver County ($1,457), both increasing by 3.8 percent. Douglas County reported the smallest over-the-
year increase in the average rental rate, rising 1.6 percent.
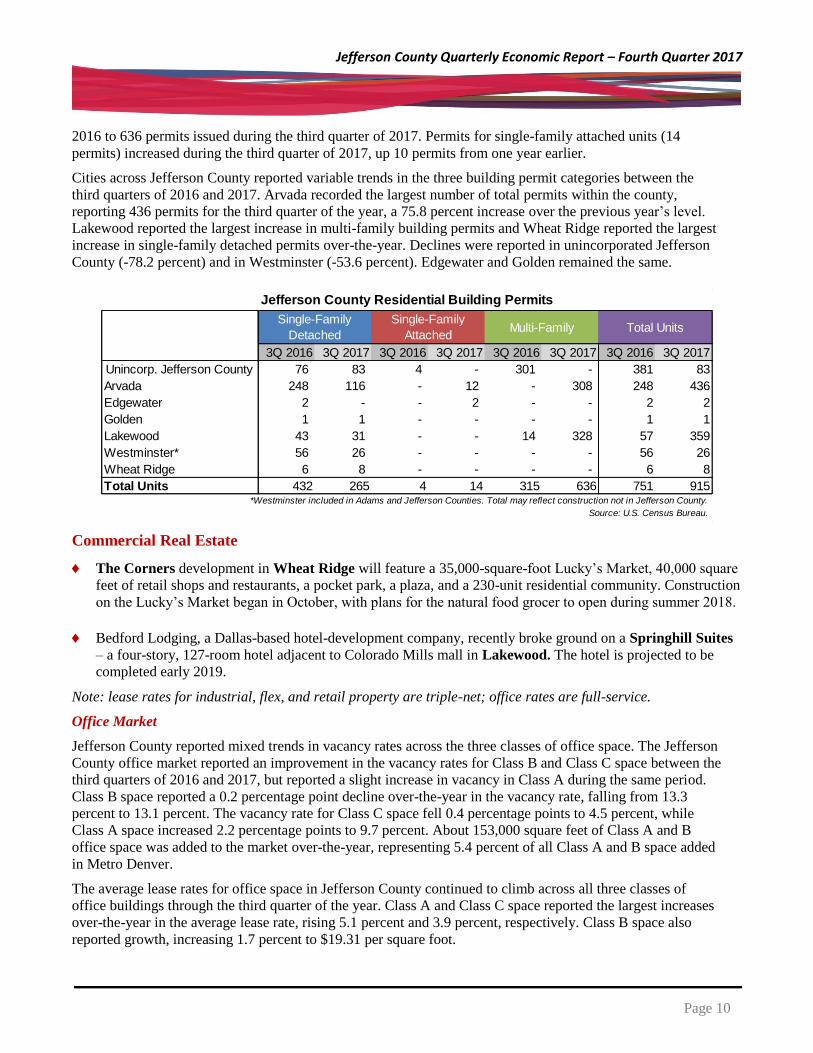
Foreclosures
Foreclosure fillings in Jefferson County
decreased between the third quarter of 2016
and 2017, continuing to remain near historic
lows. Foreclosure filings in the county
decreased 19.5 percent compared with the
previous year to 99 total filings. Jefferson
County recorded the highest over-the-year
absolute decrease in foreclosures of the seven
Metro Denver counties. Foreclosure filings
also decreased between the second and third
quarters of the year, falling 30.3 percent.
Despite the increase between the first and
second quarters of 2017, the third quarter
reinforces the downward trend in foreclosure
filings for Jefferson County.
Metro Denver recorded an increase in foreclosure activity over-the-year, rising 4.5 percent to 750 filings in the
third quarter. Similar to Jefferson County, foreclosure filings in Metro Denver also decreased over-the-quarter,
at a much smaller rate of 0.5 percent.
Residential Construction
Residential building permits in Jefferson County increased 21.8 percent between the third quarters of 2016 and
2017. Single-family detached permits accounted for 29 percent of the permits issued during the third quarter of
2017. There was a 38.7 percent decrease in single-family detached permits issued throughout Jefferson County
over-the-year. Multi-family permits made up 69.5 percent of total permits for Jefferson County, split between
Arvada and Lakewood. Multi-family building permits rose from 315 permits issued during the third quarter
County
Vacancy
RateEfficency 1 Bed
2 Bed
1 Bath
2 Bed
2 Bath3 Bed Other All
Adams 5.3% $1,009 $1,168 $1,268 $1,507 $1,834 $1,475 $1,313
Arapahoe 4.5% $1,055 $1,178 $1,300 $1,540 $1,934 $1,850 $1,343
Boulder/Broomfield 3.8% $1,333 $1,419 $1,461 $1,755 $1,936 $1,458 $1,557
Denver 6.8% $1,245 $1,314 $1,352 $1,825 $1,850 $1,316 $1,457
Douglas 5.8% $1,177 $1,352 $1,510 $1,684 $1,984 $2,322 $1,533
Jefferson 4.4% $969 $1,245 $1,284 $1,541 $1,770 $1,343 $1,370
Metro Average 5.4% $1,193 $1,264 $1,329 $1,648 $1,877 $1,424 $1,412
Source: Denver Metro Apartment Vacancy and Rent Survey.
Metro Denver Average Apartment Rents and Vacancy
Third Quarter 2017
Jefferson County Quarterly Economic Report – Fourth Quarter 2017
Page 10
2016 to 636 permits issued during the third quarter of 2017. Permits for single-family attached units (14
permits) increased during the third quarter of 2017, up 10 permits from one year earlier.
Cities across Jefferson County reported variable trends in the three building permit categories between the
third quarters of 2016 and 2017. Arvada recorded the largest number of total permits within the county,
reporting 436 permits for the third quarter of the year, a 75.8 percent increase over the previous year’s level.
Lakewood reported the largest increase in multi-family building permits and Wheat Ridge reported the largest
increase in single-family detached permits over-the-year. Declines were reported in unincorporated Jefferson
County (-78.2 percent) and in Westminster (-53.6 percent). Edgewater and Golden remained the same.
Commercial Real Estate
The Corners development in Wheat Ridge will feature a 35,000-square-foot Lucky’s Market, 40,000 square
feet of retail shops and restaurants, a pocket park, a plaza, and a 230-unit residential community. Construction
on the Lucky’s Market began in October, with plans for the natural food grocer to open during summer 2018.
Bedford Lodging, a Dallas-based hotel-development company, recently broke ground on a Springhill Suites
– a four-story, 127-room hotel adjacent to Colorado Mills mall in Lakewood. The hotel is projected to be
completed early 2019.
Note: lease rates for industrial, flex, and retail property are triple-net; office rates are full-service.
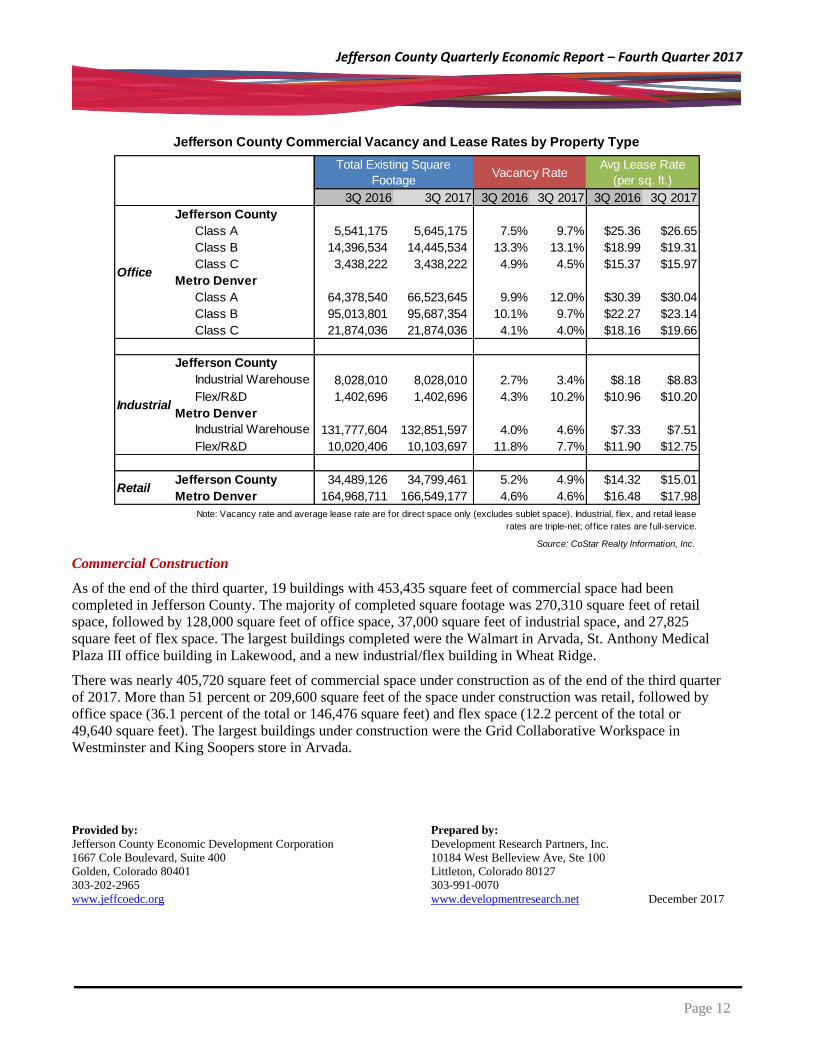
Office Market
Jefferson County reported mixed trends in vacancy rates across the three classes of office space. The Jefferson
County office market reported an improvement in the vacancy rates for Class B and Class C space between the
third quarters of 2016 and 2017, but reported a slight increase in vacancy in Class A during the same period.
Class B space reported a 0.2 percentage point decline over-the-year in the vacancy rate, falling from 13.3
percent to 13.1 percent. The vacancy rate for Class C space fell 0.4 percentage points to 4.5 percent, while
Class A space increased 2.2 percentage points to 9.7 percent. About 153,000 square feet of Class A and B
office space was added to the market over-the-year, representing 5.4 percent of all Class A and B space added
in Metro Denver.
The average lease rates for office space in Jefferson County continued to climb across all three classes of
office buildings through the third quarter of the year. Class A and Class C space reported the largest increases
over-the-year in the average lease rate, rising 5.1 percent and 3.9 percent, respectively. Class B space also
reported growth, increasing 1.7 percent to $19.31 per square foot.
3Q 2016 3Q 2017 3Q 2016 3Q 2017 3Q 2016 3Q 2017 3Q 2016 3Q 2017
76 83 4 - 301 - 381 83
248 116 - 12 - 308 248 436
2 - - 2 - - 2 2
1 1 - - - - 1 1
43 31 - - 14 328 57 359
56 26 - - - - 56 26
6 8 - - - - 6 8
432 265 4 14 315 636 751 915
Single-Family
Detached
Jefferson County Residential Building Permits
Single-Family
AttachedMulti-Family Total Units
Unincorp. Jefferson County
Arvada
Lakewood
Edgewater
*Westminster included in Adams and Jefferson Counties. Total may reflect construction not in Jefferson County.
Source: U.S. Census Bureau.
Total Units
Golden
Westminster*
Wheat Ridge
Jefferson County Quarterly Economic Report – Fourth Quarter 2017
Page 11
Similar to Jefferson County, the Metro Denver office market also reported varied trends across all three classes
of office space between the third quarters of 2016 and 2017. Class B and Class C space reported declines in
the vacancy rate, falling 0.4 and 0.1 percentage points, respectively. Class A space recorded an increase in the
vacancy rate, rising 2.1 percentage points to 12 percent. The average lease rate in the office market increased
for Class B and Class C office space over-the-year, rising 3.9 percent and 8.3 percent, respectively. Class A
office space reported a decline, falling 1.2 percent to $30.04 per square foot.
Industrial Market
Industrial warehouse vacancy in Jefferson County increased 0.7 percentage points between the third quarters
of 2016 and 2017. Nevertheless, the average lease rate rose significantly, increasing 7.9 percent over-the-year
to $8.83 per square foot. The vacancy rate in the flex/R&D market reported an over-the-year increase of 5.9
percentage points, rising from 4.3 percent to 10.2 percent. The average lease rate fell 6.9 percent during the
same period, decreasing to $10.20 per square foot.
The industrial warehouse market in Metro Denver reported mixed signals over-the-year. The industrial
warehouse market reported a 0.6 percentage point increase in the vacancy rate, rising from 4 percent to 4.6
percent. The average lease rate rose 2.5 percent to $7.51 per square foot. The flex/R&D market in Metro
Denver reported a 4.1 percentage point decrease in the vacancy rate over-the-year, falling to 7.7 percent from
11.8 percent. The average lease rate rose 7.1 percent during the period to $12.75 per square foot.
Retail Market
The Jefferson County retail market continued to gain momentum through the third quarter of 2017. The
vacancy rate decreased 0.3 percentage points between the third quarters of 2016 and 2017, falling to 4.9
percent. The average lease rate increased 4.8 percent over-the-year, rising to $15.01 per square foot. The
Jefferson County average lease rate was the highest average lease rate recorded since the data series began in
2008. The county added 310,335 square feet to the retail market over-the-year, representing 19.6 percent of the
nearly 1.6 million square feet added in Metro Denver during the period.
The Metro Denver retail market reported similar trends as Jefferson County through the third quarter of the
year. The vacancy rate in the area held steady at 4.6 percent during the period. The average lease rate increased
9.1 percent during the same period, rising from $16.48 per square foot to $17.98 per square foot. Similar to
Jefferson County, the average lease rate in the third quarter of 2017 was the highest rate reported since the start
of the data series.
Jefferson County Quarterly Economic Report – Fourth Quarter 2017
Page 12
Commercial Construction
As of the end of the third quarter, 19 buildings with 453,435 square feet of commercial space had been
completed in Jefferson County. The majority of completed square footage was 270,310 square feet of retail
space, followed by 128,000 square feet of office space, 37,000 square feet of industrial space, and 27,825
square feet of flex space. The largest buildings completed were the Walmart in Arvada, St. Anthony Medical
Plaza III office building in Lakewood, and a new industrial/flex building in Wheat Ridge.
There was nearly 405,720 square feet of commercial space under construction as of the end of the third quarter
of 2017. More than 51 percent or 209,600 square feet of the space under construction was retail, followed by
office space (36.1 percent of the total or 146,476 square feet) and flex space (12.2 percent of the total or
49,640 square feet). The largest buildings under construction were the Grid Collaborative Workspace in
Westminster and King Soopers store in Arvada.
Provided by:
Jefferson County Economic Development Corporation
1667 Cole Boulevard, Suite 400
Golden, Colorado 80401
303-202-2965
www.jeffcoedc.org
Prepared by:
Development Research Partners, Inc.
10184 West Belleview Ave, Ste 100
Littleton, Colorado 80127
303-991-0070
www.developmentresearch.net December 2017
3Q 2016 3Q 2017 3Q 2016 3Q 2017 3Q 2016 3Q 2017
Class A 5,541,175 5,645,175 7.5% 9.7% $25.36 $26.65
Class B 14,396,534 14,445,534 13.3% 13.1% $18.99 $19.31
Class C 3,438,222 3,438,222 4.9% 4.5% $15.37 $15.97
Class A 64,378,540 66,523,645 9.9% 12.0% $30.39 $30.04
Class B 95,013,801 95,687,354 10.1% 9.7% $22.27 $23.14
Class C 21,874,036 21,874,036 4.1% 4.0% $18.16 $19.66
Industrial Warehouse 8,028,010 8,028,010 2.7% 3.4% $8.18 $8.83
Flex/R&D 1,402,696 1,402,696 4.3% 10.2% $10.96 $10.20
Industrial Warehouse 131,777,604 132,851,597 4.0% 4.6% $7.33 $7.51
Flex/R&D 10,020,406 10,103,697 11.8% 7.7% $11.90 $12.75
34,489,126 34,799,461 5.2% 4.9% $14.32 $15.01
164,968,711 166,549,177 4.6% 4.6% $16.48 $17.98Retail
Jefferson County
Metro Denver
Source: CoStar Realty Information, Inc.
Jefferson County
Metro Denver
Jefferson County
Metro Denver
Note: Vacancy rate and average lease rate are for direct space only (excludes sublet space). Industrial, f lex, and retail lease
rates are triple-net; off ice rates are full-service.
Office
Avg Lease Rate
(per sq. ft.)
Jefferson County Commercial Vacancy and Lease Rates by Property Type
Total Existing Square
FootageVacancy Rate
Industrial