Quarterly Economic and Market Review EI - Russell...
27
AS OF APRIL 30, 2018 Economic and Market Review Volatility strikes back
Transcript of Quarterly Economic and Market Review EI - Russell...

AS OF APRIL 30, 2018
Economic and Market ReviewVolatility strikes back

Important information and disclosures
Please remember that all investments carry some level of risk, including the potential loss of Principal invested. They do not typically grow at an even rate of return and may experience negative growth. As with any type of portfolio structuring, attempting to reduce risk and increase return could, at certain times, unintentionally reduce returns.
Diversification does not assure a profit and does not protect against loss in declining markets.
Nothing contained in this material is intended to constitute legal, tax, securities, or investment advice, nor an opinion regarding the appropriateness of any investment, nor a solicitation of any type. The general information contained in this publication should not be acted upon without obtaining specific legal, tax, and investment advice from a licensed professional.
Source for MSCI data: MSCI. MSCI makes no express or implied warranties or representations and shall have no liability whatsoever with respect to any MSCI data contained herein. The MSCI data may not be further redistributed or used as a basis for other indices or any securities or financial products. This report is not approved, reviewed or produced by MSCI.
Standard & Poor’s Corporation is the owner of the trademarks, service marks, and copyrights related to its indexes. Indexes are unmanaged and cannot be invested in directly.
Standard Deviation is a statistical measure of the degree to which an individual value in a probability distribution tends to vary from the mean of the distribution. The greater the degree of dispersion, the greater the risk.
Correlations measure the strength and direction of a linear relationship between two random variables. The value will range between -1 and 1. Rolling correlations are trailing correlations in overlapping cycles for a given period of time. The periods shift based on a chosen length (typically 1 month) resulting in a continuous stream of trailing correlations e.g. a three year rolling value shifted by 1 month will show you the trailing 3 year value for each month displayed. Correlations are useful for understanding the behavior of correlations over multiple time periods. Demonstrates patterns or longer term trends in the return data.
Rolling returns are trailing returns in overlapping cycles for a given period of time. The returns shift based on a chosen length (typically 1 month) resulting in a continuous stream of trailing returns e.g. a three year rolling return shifted by 1 month will show you the trailing 3 year return for each month displayed.
Russell Investments’ ownership is composed of a majority stake held by funds managed by TA Associates with minority stakes he ld by funds managed by
Reverence Capital Partners and Russell Investments’ management.
Frank Russell Company is the owner of the Russell trademarks contained in this material and all trademark rights related to the Russell trademarks, which the
members of the Russell Investments group of companies are permitted to use under license from Frank Russell Company. The members of the Russell
Investments group of companies are not affiliated in any manner with Frank Russell Company or any entity operating under the “FTSE RUSSELL” brand.
Russell Investments Financial Services, LLC, member FINRA, part of Russell Investments.
Copyright © 2018 Russell Investments Group, LLC. All rights reserved. This material is proprietary and may not be reproduced, transferred, or distributed in any form without prior written permission from Russell Investments. It is delivered on an “as is” basis without warranty.
Date of First Use: May 2018
RIFIS-20083
Not FDIC Insured
May Lose Value
No Bank Guarantee
p.2

p.3
Table of contents
TOPIC PAGE
Markets in review 4-8
Perspective on the U.S. stock market 9-10
Diversification and downside risk management 11-13
Global economic and market outlook 14
Interest rates and inflation 15-17
Global equity investing themes 18-19
Taxes and staying the course in 2018 20-21

We’re not in 2017 anymoreU.S. EQUITIES HAD QUITE A RIDE IN 1Q 2018
p.4
IND
EX
LE
VE
L
Source: S&P 500® Index
EARLY FEBRUARY:Markets rattled by concerns
about high valuations, robust
U.S. wage growth, risks of
inflation and a more
hawkish-sounding Fed
MARCH: Market sentiment
bruised by escalating
trade war worries
MARCH: Tech sold off over fears of
heightened regulation and
setbacks
EARLY JANUARY:Record-setting start to the
year supported by strong
economic data and
prospective impact of
corporate tax cuts
MID-JANUARY:Markets watched
carefully as U.S. trade
policy became
Administration’s focus
MID-FEBRUARY:Markets shrugged off
stronger U.S. core CPI
and weaker retail sales
2,500
2,600
2,700
2,800
2,900
2-Jan-2018 17-Jan-2018 1-Feb-2018 16-Feb-2018 3-Mar-2018 18-Mar-2018

-4.5
-4.0
-3.5
-3.0
-2.5
-2.0
-1.5
-1.0
-0.5
0.0
0.5
1.0
1.5
2.0
2.5
3.0
DA
ILY
RE
TU
RN
(%
)The return of volatility
Number of days the S&P 500® Index gained or lost more than 1%
All of 2017: 8
1Q 2018: 23
2017 1Q 2018
Source: Morningstar Direct
p.5
Smooth 2017 has given way to a more volatile 2018.
Multi-asset diversification can help navigate periods of market volatility.

p.6
http://www.russellinvestments.com, current state as of 5/07/2018. See appendix for category definitions.
Russell Investments’ Economic Indicators Dashboard charts several key indicators to help investors assess economic and market trends.
Economic Indicators Dashboard
MARKET VOLATILITY
› Down slightly from the
end of March, but still in
the “normal” range
TREASURY YIELD
› Up from 2.41% at the
end of 2017
INFLATION
› Fed raised rates in
March, signaling the
increase may be in
response to a healthy
economy rather than
inflation
CONSUMER SENTIMENT
› Remains strong in spite
of tariff negotiations and
tensions in Syria

U.S. equity: (Russell 3000® Index) U.S. stock index which includes the
3,000 largest U.S. stocks as measured by market capitalization
Non-U.S. developed equity: (MSCI EAFE Index) International market
index that includes Western Europe, Japan, Australia
Emerging markets: (MSCI Emerging Markets Index) Emerging
markets index that includes S. Korea, Brazil, Russia, India and China
U.S. bonds: (Bloomberg Barclays U.S. Aggregate Bond Index) Broad
index for U.S. Fixed Income market
Global REITs: (FTSE EPRA/NAREIT Developed Index) Index for
global publicly traded real estate securities
Commodities: (Bloomberg Commodity Index Total Return) Broad
index of common commodities
Annualized
CAPITAL MARKETS APRIL 2018:
› U.S. equity down year-to-date as market volatility continued in April
› Developed non-U.S. experienced slightly positive returns as
uncertainty eased slightly on tariffs and geopolitical uncertainty
› Emerging markets were up year-to-date on a U.S. weak dollar and
continued economic growth
› U.S. bonds were down due to pressure from rising interest rates
› Global real estate was down across most regions on fears of rising
rates
› Commodities was the top performer year-to-date; sector returns were
mixed
-0.3
13.0
10.2
12.8
9.1
0.7
14.5
4.95.9
2.41.0
21.7
6.04.7
2.2
-2.2-0.3
1.1 1.53.6
-2.7
4.12.7 3.1 3.02.2
8.0
-4.2
-7.3 -7.8-10
-5
0
5
10
15
20
25
30U.S. Equity
Non-U.S. Developed Equity
Emerging Markets
U.S. Bonds
Global REITs
Commodities
Capital Market Returns
YTD April 2018 1-Year 3-Years 5-Years 10-Years
RA
TE
OF
RE
TU
RN
(%
)
Capital marketsPERIODS ENDING APRIL 2018
p.7
Source: Russell Investments, Barclays, Bloomberg, MSCI and FTSE NAREIT.
Index returns represent past performance, are not a guarantee of future performance, and are not indicative of any specific investment.

Year-to-date returns as of April 30, 2018
2.2
1.0 0.8 0.7 0.5
-0.1 -0.4 -0.6 -0.9
-2.2-2.7
-3.4 -3.5
-5.0
-4.0
-3.0
-2.0
-1.0
0.0
1.0
2.0
3.0
Commodities EM Equity U.S. Small Cap Non-U.S. Equity Cash Global Equity U.S. Large Cap Global HY Balanced U.S. Bonds Global REITs Infrastructure EMD
p.8
Advisors PartnersWhat worked What didn’t work
Equities Alternatives Fixed Income
RE
TU
RN
(%
)
› Commodities rebounding in April with cocoa
as the top performing commodity YTD
› Emerging markets equity up in spite of
changing market conditions and tariff and
geopolitical uncertainty
WHAT
WORKED
› Global REITS and Infrastructure down
year to date on concerns over rising rates
› Emerging markets debt down as rates
edge up and volatility remains
WHAT
DIDN’T
WORK
U.S. Small Cap: Russell 2000® Index; U.S. Large Cap: Russell 1000® Index; Global: MSCI World Net Index; Non-U.S.: MSCI EAFE Net index; Infrastructure: S&P Global Infrastructure Index; Global High Yield: Bloomberg Barclays Global High
Yield Index; Global REITs: FTSE EPRA/NAREIT Developed Index; Cash: Citigroup 1-3 Month T-Bill Index; EM Equity: MSCI Emerging Markets Index; U.S. Bonds: Bloomberg Barclays U.S. Aggregate Bond Index; EMD: JPM EMBI Plus Bond
Index; Commodities: Bloomberg Commodity Index Total Return; Balanced Index: 5% U.S. Small Cap,15% U.S. Large Cap, 10% Global, 12% Non-U.S., 4% Infrastructure, 5% Global High Yield, 4% Global REITs, 0% Cash, 6% EM Equity, 30%
U.S. Bonds, 5% EMD and 4% Commodities.
Index returns represent past performance, are not a guarantee of future performance, and are not indicative of any specific investment. Indexes are unmanaged and cannot be invested in directly.
What worked and what didn’t work April 30, 2018

There’s a pullback every yearLONG-TERM INVESTORS SHOULD NOT BE RATTLED
CALENDAR-YEAR U.S. EQUITY RETURNS (%) AND INTRA-YEAR DECLINES
In 19 of the last 23
years, U.S. equity
markets finished in
positive territory
The average
annual pullback
(peak-to-trough)
was 14.3%
38
23
33
29
21
-9-12
-22
29
11
5
16
5
-37
26
15
2
16
32
15
1
12
22
-3
-7-11
-19
-12
-17
-29-33
-14
-7 -7 -7-10
-48
-27
-16-19
-10
-6-7
-12 -11
-3
-10
-50
-40
-30
-20
-10
0
10
20
30
40
50
CA
LE
ND
AR
YE
AR
RE
TU
RN
(%
)
U.S. Equity Maximum peak-to-trough during the year
?
p.9
U.S. Equity: S&P 500® Index.
Source: Morningstar. Returns calculated with dividends included. Maximum peak-to-trough represents the return difference between the largest peak-to-trough of the calendar year.
Index returns represent past performance, are not a guarantee of future performance, and are not indicative of any specific investment. Indexes are unmanaged and cannot be invested in directly.
When pullbacks
were greater than
10%, 10 of those
14 years finished in
positive territory

› Technology is more than FAANG stocks
› Don’t get caught up in the headlines
› Diversification is still likely the best solution for many investors
Tech volatility picked up during the first quarterMEANINGFUL GIVEN THE INDUSTRY’S 25% WEIGHT
Consumer Discretionary
13%
Consumer Staples 7%
Energy 6%
Financials15%
Health Care14%
Industrials10%
Information Technology
25%
Materials 3%
REITs 3%
Telecom 2% Utilities 3%
Source: S&P 500® Index and index sectors as of 3/31/2018.
Index returns represent past performance, are not a guarantee of future performance, and are not indicative of any specific investment. Indexes are unmanaged and cannot be invested in directly.
1Q
2018
ANNUALIZED RETURNS THROUGH 3/31/18
ONE
YEAR
FIVE
YEARS
TEN
YEARS
SINCE
2000
3.5% 27.7% 20.7% 15.3% 6.9%
3.1% 18.0% 15.7% 14.6% 6.6%
S&P 16.9% 15.5% 14.2% 6.4%
-1.0% S&P 13.9% 12.3% 5.9%
-1.2% 14.0% 14.0% 9.5% 5.8%
-1.6% 11.3% S&P S&P S&P
-3.3% 10.5% 9.9% 8.9% 5.6%
-5.5% 1.9% 9.2% 7.1% 4.6%
-5.9% -0.2% 8.6% 6.2% 3.6%
-7.3% -0.9% 5.6% 5.9% 3.5%
-7.5% -4.7% 4.1% 5.8% -0.4%
-8.2% -4.9% -0.4% 1.3% N/A
S&P 500® INDEX INDUSTRY BREAKDOWN
p.10

-38
-46
-9
-56
-26
-16-19
-1
-25
-6 -5 -72 -9 -1 -3 0 4
4
2
63
5 6 6
61
83
35
99
44
33
53
20
40
28 29
39
2027 25
19 2315
2017
18
14 1114 15
-60
-40
-20
0
20
40
60
80
100
AN
NU
AL
IZE
D R
ET
UR
NS
(%
)
ASSET CLASS RETURNS1976 – 1Q 2018
Time is on your side DON’T LET SHORT-TERM VOLATILITY AFFECT LONG-TERM GOALS
1-YEAR 3-YEARS 5-YEARS 10-YEARS 20-YEARS
U.S. Equity
Non-U.S. Equity
Fixed Income
U.S. Real Estate
Balanced Portfolio
High Return
Low Return
Return as of 3/31/18
Short-term unpredictability Long-term stability
Source: Morningstar Direct. U.S Equity: S&P 500® Index; Non-U.S. Equity: MSCI World ex-U.S.; Fixed Income: Bloomberg Barclays U.S. Aggregate Bond; U.S. Real Estate: FTSE NAREIT All REITs; Balanced Index: 39% U.S. Equity, 17%
Non-U.S. Equity, 40% Fixed Income, 4% U.S. Real Estate.
Index returns represent past performance, are not a guarantee of future performance, and are not indicative of any specific investment. Indexes are unmanaged and cannot be invested in directly.
Staying the course is not always easy, but historically, patient investors have been rewarded
p.11
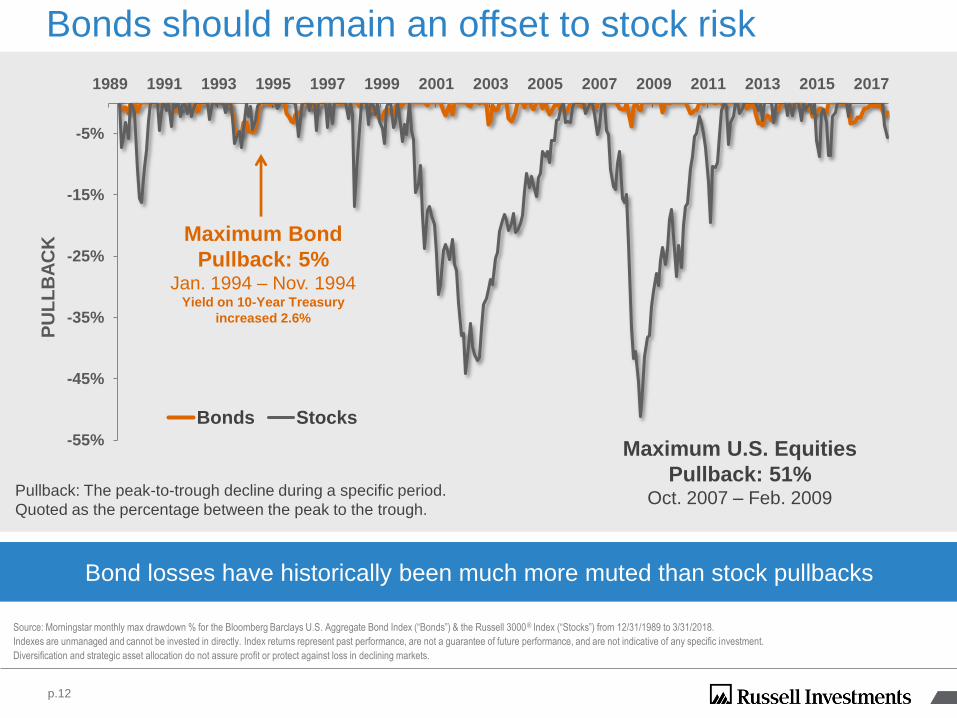
Pullback: The peak-to-trough decline during a specific period.
Quoted as the percentage between the peak to the trough.
p.12
Source: Morningstar monthly max drawdown % for the Bloomberg Barclays U.S. Aggregate Bond Index (“Bonds”) & the Russell 3000® Index (“Stocks”) from 12/31/1989 to 3/31/2018.
Indexes are unmanaged and cannot be invested in directly. Index returns represent past performance, are not a guarantee of future performance, and are not indicative of any specific investment.
Diversification and strategic asset allocation do not assure profit or protect against loss in declining markets.
-55%
-45%
-35%
-25%
-15%
-5%
1989 1991 1993 1995 1997 1999 2001 2003 2005 2007 2009 2011 2013 2015 2017
Bonds Stocks
Maximum Bond
Pullback: 5%Jan. 1994 – Nov. 1994
Yield on 10-Year Treasury
increased 2.6%
Bonds should remain an offset to stock risk
Maximum U.S. Equities
Pullback: 51% Oct. 2007 – Feb. 2009
Bond losses have historically been much more muted than stock pullbacks
PU
LL
BA
CK

Winning by not losingTHE VALUE OF MANAGING DOWNSIDE RISK
-10%-20%
-30%-40%
-50%Drawdown return
11%
25%
43%
67%
100%
For illustrative purposes only.
Return required to
recover after a drawdown
Consider incorporating strategies designed to protect on the
downside- particularly in a more volatile environment
p.13
A return of -50%
requires a +100% return
to get back to 0%

Russell Investments’ 2018 global market outlookSHIFTING WINDS
› 3-4 Fed rate hikes in 2018
› 2.6% GDP growth
› 12%-15% S&P 500® Index
earnings growth
› 10-year Treasury yield at 2.8%
in 12 months
› 1.8%-2.4% GDP growth
› 5%-10% earnings growth
› Neutral valuations
› Rising euro headwind is
probably in the rear-view
mirror
› 4.8% GDP growth
› Valuations less expensive
following February sell-off
› Still positive outlook for
China
KE
Y E
XP
EC
TA
TIO
NS
UNITED STATESTug of war
EUROZONEStuck in the middle
ASIA-PACIFICThe show rolls on
Underweight: Strong economy
and corporate profits in 2018,
but valuations too expensive
Overweight: Strong
fundamentals and relatively
attractive valuation
Overweight: Global growth
underpins demand and
monetary policy remains
relatively accommodative
There is no guarantee the stated expectations will be met.
As of 3/31/2018. Forecasting represents predictions of market prices and/or volume patterns utilizing varying analytical data. It is not representative of a projection of the stock market, or of any specific investment.
Given global uncertainty and high valuations, we believe in
diversifying sources of returns
p.14

-6%
-4%
-2%
0%
2%
4%
6%
8%
BankLoans
GlobalHigh Yield
EMD Non-AgencyCMBS
Corp AggregateBonds
IntTreasury
RE
TU
RN
(%
)
Price impact of rate increase Average current coupon Total return
Impact of rising interest rates on bonds
› Rising interest rates can be a headwind for fixed income
› Not all fixed income sectors respond similarly
› Total return is a combination of price changes and coupon payments
p.15
Bank Loans – Barclays U.S. Corporate High Yield FRN Index; Int Treasury – Barclays Intermediate Treasury Index; Aggregate Bonds – Barclays U.S. Aggregate Bond Index; Corp – Barclays U.S. Corporate Bond Index; Global High Yield –
Barclays Global High Yield Index; EMD – Barclays Emerging Market Debt Index; Non-Agency CMBS – Barclays Non-Agency Investment Grade CMBS.
Other time periods will produce different results. Indexes are unmanaged and cannot be invested in directly. Returns represent past performance, are not a guarantee of future performance, and are not indicative of any specific investment.
Diversification does not assure a profit and does not protect against loss in declining markets.
Interest rate change +0.5%
× Portfolio duration (years) 3.9
= Price impact on bonds -1.9%
+ Coupon rate +1.9%
= TOTAL RETURN 0.0%
IMPACT OF A PROSPECTIVE 50 BASIS POINT INTEREST RATE INCREASE AS OF MARCH 31, 2018

0.0
0.5
1.0
1.5
2.0
01/30/09 01/30/10 01/30/11 01/30/12 01/30/13 01/30/14 01/30/15 01/30/16 01/30/17 01/30/18
RA
TE
(%
)
Inflation US Fed Funds Rate Target Inflation Rate
WHAT IT IS The year-by-year increase in the prices of various goods
WHY IT’S IMPORTANT Modest inflation is typically a sign of a healthy and growing economy
WHAT’S THE
OBJECTIVE
In 2012, the Federal Reserve announced a 2% target inflation rate (Core PCE)
to promote growth and price stability
WHAT’S NEXT?
If inflation rises unexpectedly If inflation falls again
Fed can continue to raise rates to curb
price increases
Fed has ability to cut rates to stimulate
the economy
Source: Factset
Inflation on the rise STILL BELOW TARGET
p.16
INFLATION AND FED FUNDS RATE:
2009 – 1Q 2018

Commodities ready to earn their keep?INFLATION MAY STRENGTHEN THE CASE
Source: Morningstar Direct, Federal Reserve Economic Data (FRED). Data as of 02/28/2018. Bloomberg Commodity TR USD Index & CPI: Consumer Price Index for All Urban Consumers – All items, Percent Change from year ago, monthly, seasonally adjusted.
Methodology: Rolling 1 Year period returns illustrated with one month step. Asset class definitions: U.S. Large Cap Equity = Russell 1000® TR USD; Non-U.S. Equity = MSCI EAFE NR USD; REITs = FTSE NAREIT All Equity REITs TR USD; U.S. Bonds = Bloomberg
Barclays U.S. Aggregate Bond TR USD. Index returns represent past performance, are not a guarantee of future performance, and are not indicative of any specific investment. Indexes are unmanaged and cannot be invested in directly.
› DiversificationLow historical and
forecasted correlation
with equities and bonds
› Historical offset to
inflationStrong historical
relationship between
CPI and commodity
prices
› Strong returns when
inflation is highLike real estate, has
delivered strong returns
during inflationary
periods
-3.0
-2.0
-1.0
0.0
1.0
2.0
3.0
4.0
5.0
6.0
-60.0
-40.0
-20.0
0.0
20.0
40.0
60.0
CO
NS
UM
ER
PR
ICE
IN
DE
X
YO
Y C
HN
AG
E (
%)
BL
OO
MB
ER
G C
OM
MO
DIT
Y IN
DE
X
YO
Y C
HA
NG
E (
%)
Bloomberg Commodity Index
Consumer Price Index (CPI)
10.6
8.7
13.314.6
6.6
0.0
2.0
4.0
6.0
8.0
10.0
12.0
14.0
16.0
U.S. Large CapEquity
Non-U.S. Equity Commodities REITs U.S. Bonds
AN
NU
AL
IZE
D R
ET
UR
N (
%)
p.17
RELATIONSHIP BETWEEN COMMODITIES AND INFLATION
(Jan 1991 to Feb 2018)
ASSET CLASS RETURNS WHEN CPI WAS GREATER THAN OR EQUAL TO 2.5%
(Jan 1991 to Feb 2018)

9.5
3.9
2.5
6.6
3.5
12.5
April 2008 - March 2018 1998 - 2007
AN
NU
AL
IZE
D %
U.S. Stocks Non-U.S. Stocks EM Stocks
p.18
Can the non-U.S. stock rally continue?MEAN REVERSION MAY BENEFIT NON-U.S. STOCKS
› Solid ten-year return stretch for U.S. stocks
› Relatively attractive valuations to start the period
› Looking more expensive after ten-year run
› A reversion could bode well for international stocks
EQUITY MARKET VALUATIONS
Price-to-Earnings
26.0Dec 07
32.7Mar 18
17.8Mar 18
Sources: U.S. Stocks = Russell 3000® Index; Non-US Stocks = MSCI EAFE Index; EM Stocks = MSCI Emerging Markets Index; Price-to-Earnings is the CAPE Shiller PE, sources from Research Affiliates.
Index returns represent past performance, are not a guarantee of future performance, and are not indicative of any specific investment.
28.6Dec 07
34.7Dec 07
15.3Mar 18
35.015.0
10-YEAR EQUITY MARKET RETURNS

Tariffs and trade barriersCOMPLEXITY IN AN INTERCONNECTED WORLD
› Foster specific industries
› Protect national security interests
› Help domestic producers and jobs
› Source for government revenue
› Address international trade distortions
› Slow down economic growth
› Raise prices and stimulate inflation
› Hurt consumers
› Job loss in downstream industries
› Harm domestic exporters
POTENTIAL BENEFITS POTENTIAL RISKS
Intelligent diversification and dynamic management can help protect
investment portfolios from potential unintended consequences
p.19

Return lost to federal taxes by U.S. investors
Taxes are not just an April 15th issue
Source: Return lost to taxes—Morningstar Tax Cost Ratio calculated as the arithmetic average of active, passive, ETF products within U.S. equity and taxable bond categories.
2.09%
On $500,000 U.S.
equity investment =
$10,450 in lost value
1.39%
On $500,000 U.S.
bond investment =
$6,950 in lost value
1 YEAR ENDING MARCH 2018
U.S. EQUITY U.S. FIXED INCOME
Tax Cut & Jobs Act (TCJA)
p.20
› Reduced taxable
income rates for
many
› Did not change tax
rates for long-term
capital gains and
qualified dividends
› Work with your
advisor to understand
tax impact across
your portfolio – not
just on April 15th

p.21
Optimism
Excitement
Thrill
Euphoria Anxiety
Fear
Panic
Despondency
Hope
Relief
Optimism
This hypothetical example is for illustration only.
Staying the long-term courseDESPITE SHORT-TERM EMOTIONAL TUGS
Successful
investors
recognize this is
the point of
Maximum
financial risk
Successful
investors
recognize this is
the point of
Maximum
financial
opportunity

Important information and disclosures
Risks of asset classes discussed in this presentation:
Global, International and Emerging markets return may be significantly affected by political or economic conditions and regulatory requirements in a particular country. Investments in non-U.S. markets can involve risks of currency fluctuation, political and economic instability, different accounting standards and foreign taxation. Such securities may be less liquid and more volatile. Investments in emerging or developing markets involve exposure to economic structures that are generally less diverse and mature, and political systems with less stability than in more developed countries.
Real Asset risks:
Investments in infrastructure-related companies have greater exposure to adverse economic, financial, regulatory, and political risks, including, governmental regulations. Global securities may be significantly affected by political or economic conditions and regulatory requirements in a particular country.
Commodities may have greater volatility than traditional securities. The value of commodities may be affected by changes in overall market movements, changes in interest rates or sectors affecting a particular industry or commodity, and international economic, political and regulatory developments.
Declines in the value of real estate, economic conditions, property taxes, tax laws and interest rates all present potential risks. Investments in international markets can involve risks of currency fluctuation, political and economic instability, different accounting standards, and foreign taxation.
Small capitalization (small cap) investments involve stocks of companies with smaller levels of market capitalization (generally less than $2 billion) than larger company stocks (large cap). Small cap investments are subject to considerable price fluctuations and are more volatile than large company stocks. Investors should consider the additional risks involved in small cap investments.
Large capitalization (large cap) investments involve stocks of companies generally having a market capitalization between $10 billion and $200 billion. The value of securities will rise and fall in response to the activities of the company that issued them, general market conditions and/or economic conditions.
Defensive style emphasizes investments in equity securities of companies that are believed to have lower than average stock price volatility, characteristics indicating high financial quality, (which may include lower financial leverage) and/or stable business fundamentals.
Dynamic style emphasizes investments in equity securities of companies that are believed to be currently undergoing or are expected to undergo positive change that will lead to stock price appreciation. Dynamic stocks typically have higher than average stock price volatility, characteristics indicating lower financial quality, (which may include greater financial leverage) and/or less business stability.
Although stocks have historically outperformed bonds, they also have historically been more volatile. Investors should carefully consider their ability to invest during volatile periods in the market.
An Investment Grade is a system of gradation for measuring the relative investment qualities of bonds by the usage of rating symbols, which range from the highest investment quality (least investment risk) to the lowest investment quality (greatest investment risk).
Gross domestic product (GDP) refers to the market value of all final goods and services produced within a country in a given period. It is often considered an indicator of a country's standard of living.
Bonds:
With fixed income securities, such as bonds, interest rates and bond prices tend to move in opposite directions. When interest rates fall, bond prices typically rise and conversely when interest rates rise, bond prices typically fall. When interest rates are at low levels there is risk that a sustained rise in interest rates may cause losses to the price of bonds. Bond investors should carefully consider these risks such as interest rate, credit, repurchase and reverse repurchase transaction risks. Greater risk, such as increased volatility, limited liquidity, prepayment, non-payment and increased default risk, is inherent in portfolios that invest in high yield ("junk") bonds or mortgage backed securities, especially mortgage backed securities with exposure to sub-prime mortgages. Investment in non-U.S. and emerging market securities is subject to the risk of currency fluctuations and to economic and political risks associated with such foreign countries. When interest rates are at low levels there is risk that a sustained rise in interest rates may cause losses to the price of bonds.
Growth:
Growth investments focus on stocks of companies whose earnings/profitability are accelerating in the short-term or have grown consistently over the long-term. Such investments may provide minimal dividends which could otherwise cushion stock prices in a market decline. A stock’s value may rise and fall significantly based, in part, on investors' perceptions of the company, rather than on fundamental analysis of the stocks. Investors should carefully consider the additional risks involved in growth investments.
Value:
Value investments focus on stocks of income-producing companies whose price is low relative to one or more valuation factors, such as earnings or book value. Such investments are subject to risks that the stocks’ intrinsic values may never be realized by the market, or, that the stocks may turn out not to have been undervalued. Investors should carefully consider the additional risks involved in value investments.
p.22

Bloomberg Barclays Global High-Yield Index: An index which
provides a broad-based measure of the global high-yield fixed income
markets. The Global High-Yield Index represents that union of the
U.S. High-Yield, Pan-European High-Yield, U.S. Emerging Markets
High-Yield, CMBS High-Yield, and Pan-European Emerging Markets
High-Yield Indices.
Bloomberg Barclays High Yield Municipal Bond Index: An
unmanaged index considered representative of noninvestment-grade
bonds. FactSet Research Systems Inc. Barclays Intermediate U.S.
Credit Index is an unmanaged index of dollar-denominated,
investment-grade, publicly issued securities with maturities of one to
10 years.
Bloomberg Barclays Intermediate Treasury Index: Measures the
performance of U.S. Dollar denominated U.S. Treasuries,
government-related and investment grade U.S. corporate securities
that have a remaining maturity of greater than one year and less than
ten years.
Bloomberg Barclays Short Treasury Index: Is composed of all
treasuries that have a remaining maturity between one and twelve
months.
Bloomberg Barclays U.S. Aggregate Bond Index: An index, with
income reinvested, generally representative of intermediate-term
government bonds, investment grade corporate debt securities, and
mortgage-backed securities. (specifically: Barclays
Government/Corporate Bond Index, the Asset-Backed Securities
Index, and the Mortgage-Backed Securities Index).
Bloomberg Barclays U.S. Credit Bond Index: Measures the
performance of investment grade corporate debt and agency bonds
that are dollar denominated and have a remaining maturity of greater
than one year.
Bloomberg Commodity Index Family: Represents the major commodity sectors within the broad index: Energy (including petroleum and natural gas), Petroleum (including crude oil, heating oil and unleaded gasoline), Precious Metals, Industrial Metals, Grains, Livestock, Softs, Agriculture and ExEnergy. Also available are individual commodity sub-indexes on the 19 components currently included in the DJ-UBSCI℠, plus brent crude, cocoa, feeder cattle, gas oil, lead, orange juice, platinum, soybean meal and tin.
Bloomberg Commodity Index Total Return: Composed of futures contracts on physical commodities. Unlike equities, which typically entitle the holder to a continuing stake in a corporation, commodity futures contracts normally specify a certain date for the delivery of the underlying physical commodity. In order to avoid the delivery process and maintain a long futures position, nearby contracts must be sold and contracts that have not yet reached the delivery period must be purchased. This process is known as "rolling" a futures position.
BofA Merrill Lynch Global High Yield Index: Tracks the performance of USD, CAD, GBP and EUR denominated below investment grade corporate debt publicly issued in the major domestic or Eurobond markets.
Citigroup 1-3 Month T-Bill Index: An unmanaged index that tracks short-term U.S. government debt instruments.
FTSE NAREIT: An Index designed to present investors with a comprehensive family of REIT performance indexes that span the commercial real estate space across the U.S. economy, offering exposure to all investment and property sectors. In addition, the more narrowly focused property sector and sub-sector indexes provide the facility to concentrate commercial real estate exposure in more selected markets.
FTSE NAREIT all Equity Index: Measures the performance of the commercial real estate space across the U.S. economy offering exposure to all investment and property sectors.
FTSE EPRA/NAREIT Developed Index: A global market capitalization weighted index composed of listed real estate securities in the North American, European and Asian real estate markets.
JPM Emerging Market Bond Index (EMBI): Dollar-denominated sovereign bonds issued by a selection of emerging market countries.
JPM EMBI Plus Bond Index: Tracks total returns for traded external debt instruments in the emerging markets.
MSCI country indices: Indices which include securities that are classified in that country according to the MSCI Global Investable Market Index Methodology, together with companies that are headquartered or listed in that country and carry out the majority of their operations in that country.
The MSCI AC (All Country) Asia ex Japan Index: A free float‐adjusted market capitalization weighted index that is designed to measure the equity market performance of Asia, excluding Japan. The MSCI AC Asia ex Japan Index consists of the following 10 developed and emerging market country indexes: China, Hong Kong, India, Indonesia, Korea, Malaysia, Philippines, Singapore, Taiwan, and Thailand.
MSCI EAFE (Europe, Australasia, Far East) Index: A free float-adjusted market capitalization index that is designed to measure the equity market performance of developed markets, excluding the U.S. and Canada.
MSCI Emerging Markets Index: A float-adjusted market capitalization index that consists of indices in 21 emerging economies: Brazil, Chile, China, Colombia, Czech Republic, Egypt, Hungary, India, Indonesia, Korea, Malaysia, Mexico, Morocco, Peru, Philippines, Poland, Russia, South Africa, Taiwan, Thailand, and Turkey.
MSCI Emerging Markets Information Technology Index: Tracks the information technology sector of the emerging markets (GICS sector classification).
MSCI Europe Index: A free float‐adjusted market capitalization weighted index that is designed to measure the equity market performance of the developed markets in Europe. The MSCI Europe Index consists of the following 15 developed market country indexes: Austria, Belgium, Denmark, Finland, France, Germany, Ireland, Italy, the Netherlands, Norway, Portugal, Spain, Sweden, Switzerland, and the United Kingdom.
MSCI World Index: A market cap weighted stock market index of 1,653 stocks from companies throughout the world.
MSCI World ex-USA Index: The MSCI All Country (AC) World ex U.S. Index tracks global stock market performance that includes developed and emerging markets but excludes the U.S.
Russell 1000® Index: Measures the performance of the large-cap segment of the U.S. equity universe. It is a subset of the Russell 3000® Index and includes approximately 1000 of the largest securities based on a combination of their market cap and current index membership.
Russell 1000® Growth Index: Measures the performance of the large-cap growth segment of the U.S. equity universe. It includes those Russell 1000 companies with higher price-to-book ratios and higher forecasted growth values.
Russell 1000® Value Index: Measures the performance of the large-cap value segment of the U.S. equity universe. It includes those Russell 1000 companies with lower price-to-book ratios and lower expected growth values.
Russell 1000® Defensive Index: Subset of top 1000 U.S. equities with companies that demonstrate less than average exposure to certain risk. (lower stock price volatility, higher quality balance sheets, stronger earnings profile).
Russell 1000® Dynamic Index: Subset of top 1000 U.S. equities with companies that demonstrate than average exposure to certain risks. (higher stock price volatility, lower quality balance sheets, uneven earnings profile).
Russell 2000® Index: Measures the performance of the small-cap segment of the U.S. equity universe. The Russell 2000 Index is a subset of the Russell 3000® Index representing approximately 10% of the total market capitalization of that index. It includes approximately 2000 of the smallest securities based on a combination of their market cap and current index membership.
Russell 2000® Growth Index: Measures the performance of the large-cap growth segment of the U.S. equity universe. It includes those Russell 2000 companies with higher price-to-book ratios and higher forecasted growth values.
Russell 2000® Value Index: Measures the performance of the large-cap value segment of the U.S. equity universe. It includes those Russell 2000 companies with lower price-to-book ratios and lower expected growth values.
Index definitions
p.23

Index definitions (cont’d)
Russell 3000® Index: Index measures the performance of the largest 3000 U.S. companies representing approximately 98% of the investable U.S. equity market.
Russell 3000® Growth Index: Measures the performance of the broad growth segment of the U.S. equity universe. It includes those Russell 3000 companies with higher price-to-book ratios and higher forecasted growth values.
Russell 3000® Value Index: Measures the performance of the broad value segment of U.S. equity value universe. It includes those Russell 3000 companies with lower price-to-book ratios and lower forecasted growth values.
The S&P 500® Index is a free-float capitalization-weighted index published since 1957 of the prices of 500 large-cap common stocks actively traded in the United States. The stocks included in the S&P 500® are those of large publicly held companies that trade on either of the two largest American stock market exchanges: the New York Stock Exchange and the NASDAQ.
The S&P Global Infrastructure Index: Provides liquid and tradable exposure to 75 companies from around the world that represent the listed infrastructure universe. To create diversified exposure across the global listed infrastructure market, the index has balanced weights across three distinct infrastructure clusters: Utilities, Transportation, and Energy.
U.S. Energy: Within the Russell 3000®, those energy-related businesses, such as oil companies involved in the exploration, production, servicing, drilling and refining processes, and companies primarily involved in the production and mining of coal and other fuels used in the generation of consumable energy. Gas extraction, distribution and pipeline companies classify into this Sector.
U.S. Health Care: Within the Russell 3000®, those companies that manufacture health care equipment and supplies or provide health care-related services such as lab services, in-home medical care and health care facilities. Also included are companies involved in research, development and production of pharmaceuticals and biotechnology.
U.S. Material & Processing: Within the Russell 3000®, those companies that extract or process raw materials, and companies that manufacture chemicals, construction materials, glass, paper, plastic, forest products and related packaging products. Metals and minerals miners, metal alloy producers, and metal fabricators are included.
U.S. Technology: Within the Russell 3000®, those companies that serve the information technology, telecommunications technology and electronics industries.
p.24

Market Indicators
HOME PRICES – The S&P/Case-Shiller Home Price Index is a measurement of U.S. residential real estate prices, tracking changes in top 20 metropolitan regions. This indicator value represents the trailing year over year % change in the home prices index as of last month-end. Residential real estate represents a large portion of the US economy and the Home Price index helps us monitor the value of real estate.
MARKET VOLATILITY(VIX) – CBOE VIX (Chicago Board Options Exchange Volatility Index) measures annualized implied volatility as conveyed by S&P 500 stock index option prices and is quoted in percentage points per annum. For instance, a VIXvalue of 15 represents an annualized implied volatility of 15% over the next 30 day period. The VIX measures implied volatility,which is a barometer of investor sentiment and market risk.
10 YR. U.S. TREASURY YIELD – The yield on the 10 year U.S. Treasury note issued by the U.S. Government. It is important because it is seen as a benchmark for interest rate movements and borrowing costs in the economy.
YIELD SPREAD – The spread between 3 month Treasury bill yields and 10 year Treasury note yields measures the market outlook for future interest rates. A normal or upward-sloping yield curve, can imply that investors expect the economy to grow and inflation to eat into asset returns. They thus demand a higher yield for long-term Treasuries. An inverted yield curve has often been an indicator of coming recessions, but not always. For example, reduced inflation expectations could cause the yield curve to flatten.
Economic Indicators
CONSUMER SENTIMENT – The University of Michigan Survey of Consumer Sentiment Index is an economic indicator which measures the degree of optimism that consumers feel about the overall state of the economy and their personal financial situation.
ECONOMIC EXPANSION (GDP) – GDP (Gross Domestic Product) measures the total market value of a nation’s output of goods and services during a specific time period. It is usually measured on a quarterly basis. Current GDP is based on the current prices of the period being measured. Nominal GDP growth refers to GDP growth in nominal prices (unadjusted for price changes). Real GDP growth refers to GDP growth adjusted for price changes. Calculating Real GDP growth allows economists to determine if production increased or decreased, regardless of changes in the purchasing power of the currency.
INFLATION – The Consumer Price Index (CPI) NSA (non-seasonally adjusted) measures changes in the price level of a market basket of consumer goods and services purchased by households. This indicator value represents the trailing year over year % change in the CPI index as of last month-end.
UNEMPLOYMENT – The Bureau of Labor Statistics measures employment and unemployment of all persons over the age of 15 using two different labor force surveys conducted by the United States Census Bureau (within the United States Department of Commerce) and the Bureau of Labor Statistics (within the United States Department of Labor) that gather employment statistics monthly. The data reported here is seasonally adjusted (SA) to account for seasonal gains in employment leading up to Christmas.
Economic Indicators Dashboard definitions
p.25

Appendix and disclosures (cont’d)
METHODOLOGY FOR UNIVERSE CONSTRUCTION:
› Average of Morningstar’s Tax Cost Ratio for universes as defined. Passive is defined as being an index fund as reported by Morningstar or part
of an ETF Category.
› Averages calculated on a given category. For example, average reflects the arithmetic average of the Morningstar Tax Cost Ratio for the
universe/category as listed.
› Large Cap/Small Cap determination based upon Morningstar Category.
› If fund is indicated by Morningstar as passive or an ETF, the fund is considered to be passively managed. Otherwise, the fund is considered to
be actively managed. Tax Drag: Morningstar calculated Tax Cost Ratio.
› The Morningstar categories are as reported by Morningstar and have not been modified.
› Morningstar Categories included: U.S. ETF Large Blend, U.S. ETF Large Growth, U.S. ETF Large Value, U.S. ETF Small Blend, U.S. ETF
Small Growth, U.S. ETF Small Value, U.S. OE Large Blend, U.S. OE Large Growth, U.S. OE Large Value, U.S. OE Small Blend, U.S. OE Small
Growth, U.S. OE Small Value.
The Morningstar categories are as reported by Morningstar and have not been modified. © 2018 Morningstar, Inc. All Rights Reserved. The information contained herein: (1) is proprietary to Morningstar; (2) may not be copied or distributed; and (3) is not warranted to be accurate, complete or timely. Neither Morningstar nor its content providers are responsible for any damages or losses arising from any use of this information. Past performance is no guarantee of future results.
Methodology for Tax Drag:
› Include all open ended investment products – mutual funds/ETFs that are both active and passive. Tax Drag reflects the arithmetic average of
Morningstar Tax Cost Ratio. Data includes all share classes and reflects Morningstar category of US Equity and Taxable Bond for equities and
fixed income respectively.
p.26

https://russellinvestments.com
01-01-343 (04/18)