Quarter 3/2008 Interim Report - Deutsche Börse · Operating cash flow per share (basic and...
30
Quarter 3/2008 Interim Report
Transcript of Quarter 3/2008 Interim Report - Deutsche Börse · Operating cash flow per share (basic and...

Quarter 3/2008Interim Report
DTB_Quartal2-3_Titel_Vorab 07.07.2008 12:33 Uhr Seite 2
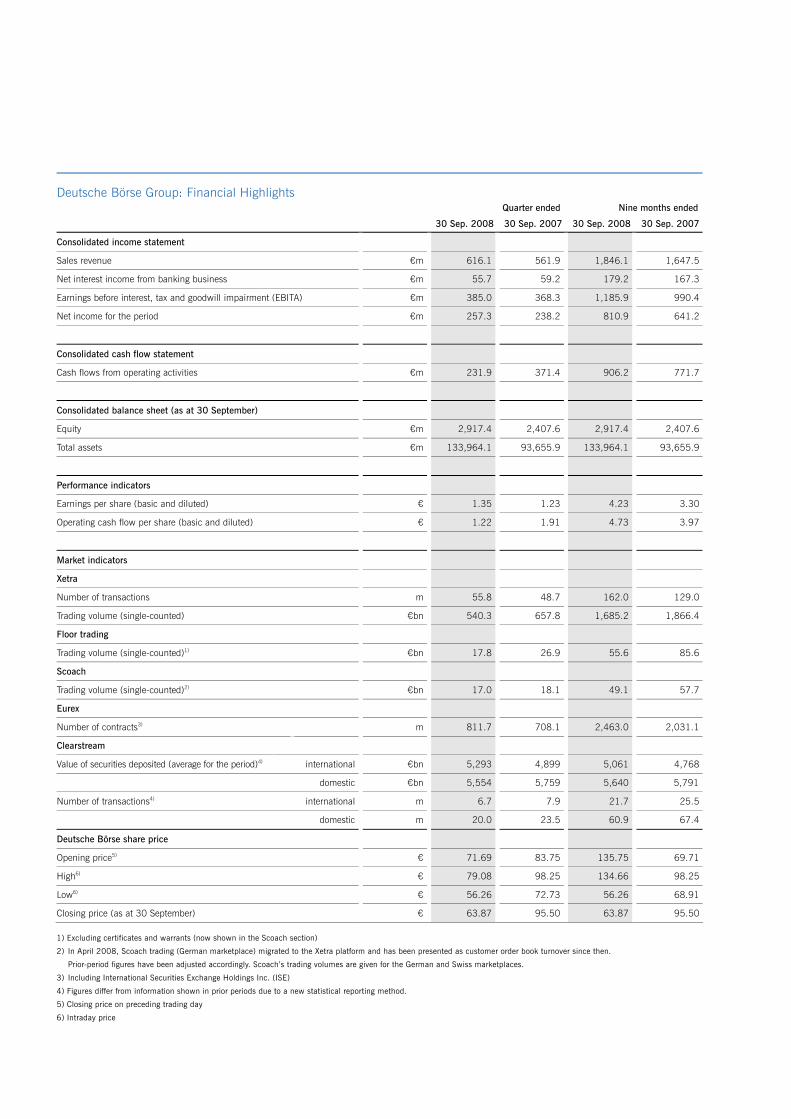
Deutsche Börse Group: Financial Highlights Quarter ended Nine months ended
30 Sep. 2008 30 Sep. 2007 30 Sep. 2008 30 Sep. 2007
Consolidated income statement
Sales revenue €m 616.1 561.9 1,846.1 1,647.5
Net interest income from banking business €m 55.7 59.2 179.2 167.3
Earnings before interest, tax and goodwill impairment (EBITA) €m 385.0 368.3 1,185.9 990.4
Net income for the period €m 257.3 238.2 810.9 641.2
Consolidated cash flow statement
Cash flows from operating activities €m 231.9 371.4 906.2 771.7
Consolidated balance sheet (as at 30 September)
Equity €m 2,917.4 2,407.6 2,917.4 2,407.6
Total assets €m 133,964.1 93,655.9 133,964.1 93,655.9
Performance indicators
Earnings per share (basic and diluted) € 1.35 1.23 4.23 3.30
Operating cash flow per share (basic and diluted) € 1.22 1.91 4.73 3.97
Market indicators
Xetra
Number of transactions m 55.8 48.7 162.0 129.0
Trading volume (single-counted) €bn 540.3 657.8 1,685.2 1,866.4
Floor trading
Trading volume (single-counted)1) €bn 17.8 26.9 55.6 85.6
Scoach
Trading volume (single-counted)2) €bn 17.0 18.1 49.1 57.7
Eurex
Number of contracts3) m 811.7 708.1 2,463.0 2,031.1
Clearstream
Value of securities deposited (average for the period)4) international €bn 5,293 4,899 5,061 4,768
domestic €bn 5,554 5,759 5,640 5,791
Number of transactions4) international m 6.7 7.9 21.7 25.5
domestic m 20.0 23.5 60.9 67.4
Deutsche Börse share price
Opening price5) € 71.69 83.75 135.75 69.71
High6) € 79.08 98.25 134.66 98.25
Low6) € 56.26 72.73 56.26 68.91
Closing price (as at 30 September) € 63.87 95.50 63.87 95.50
1) Excluding certificates and warrants (now shown in the Scoach section)
2) In April 2008, Scoach trading (German marketplace) migrated to the Xetra platform and has been presented as customer order book turnover since then.
Prior-period figures have been adjusted accordingly. Scoach’s trading volumes are given for the German and Swiss marketplaces.
3) Including International Securities Exchange Holdings Inc. (ISE)
4) Figures differ from information shown in prior periods due to a new statistical reporting method.
5) Closing price on preceding trading day
6) Intraday price

1
Successful quarter for Deutsche Börse: Sales revenue and earnings increase
Sales revenue up 10 percent year-on-year to €616.1 million (Q3/2007: €561.9 million).
Net interest income from banking business down 6 percent to €55.7 million (Q3/2007: €59.2 million).
Total costs rose by 13 percent to €311.2 million (Q3/2007: €274.5 million); excluding ISE, costs decreased by 2 percent.
Consolidated earnings before interest, tax and good- will impairment (EBITA) improved by 5 percent to €385.0 million (Q3/2007: €368.3 million).
Currency losses of around €7 million in connection with the long-term financing of ISE had a negative effect on the financial result.
Earnings per share rose by 10 percent and amounted to €1.35 for an average of 190.7 million shares (Q3/2007: €1.23 for 194.4 million shares).
The Group achieved the second strongest quarter in its history as measured by sales revenue and EBITA figures.
As part of its capital management activities, Deutsche Börse resumed its share buy-back program on 1 July 2008 and repurchased shares worth €200.0 million in the third quarter, as planned.
Development of Deutsche Börse AG shares since the beginning of Q3/2008
Order book turnover of Deutsche Börse share
Quoted price € Turnover €m
Dow Jones EURO STOXX 50® (EUR) (Return)1)
Daily Deutsche Börse closing share priceDAX® performance1)
1) Index-linked, closing price on 30 June 2008
0
2,100
1,200
600
300
20
50
60
70
80
90
30
40
900
1,500
1,800
30.6
.-4.7
.
7.7
.-11.7
.
14.7
.-18.7
.
21.7
.-25.7
.
28.7
.-1.8
.
4.8
.-8.8
.
11.8
.-15.8
.
18.8
.-22.8
.
25.8
.-29.8
.
1.9
.-5.9
.
8.9
.-12.9
.
15.9
.-19.9
.
22.9
.-26.9
.
29.9
.-3.1
0.
6.1
0.-
10.1
0.
13.1
0.-
17.1
0.
27.1
0.-
31.1
0.
20.1
0.-
24.1
0.
Order book turnover of Deutsche Börse share
Quoted price € Turnover €m
Dow Jones EURO STOXX 50® (EUR) (Return)1)
Daily Deutsche Börse closing share priceDAX® performance1)
1) Index-linked, closing price on 30 June 2008
0
2,100
1,200
600
300
20
50
60
70
80
90
30
40
900
1,500
1,800
30.6
.-4.7
.
7.7
.-11.7
.
14.7
.-18.7
.
21.7
.-25.7
.
28.7
.-1.8
.
4.8
.-8.8
.
11.8
.-15.8
.
18.8
.-22.8
.
25.8
.-29.8
.
1.9
.-5.9
.
8.9
.-12.9
.
15.9
.-19.9
.
22.9
.-26.9
.
29.9
.-3.1
0.
6.1
0.-
10.1
0.
13.1
0.-
17.1
0.
27.1
0.-
31.1
0.
20.1
0.-
24.1
0. 0
2,1002,100
1,2001,200
600600
300300
20
5050
6060
7070
8080
9090
3030
4040
900900
1,5001,500
1,8001,800
30.6
.-4.7
.
7.7
.-11.7
.
14.7
.-18.7
.
21.7
.-25.7
.
28.7
.-1.8
.
4.8
.-8.8
.
11.8
.-15.8
.
18.8
.-22.8
.
25.8
.-29.8
.
1.9
.-5.9
.
8.9
.-12.9
.
15.9
.-19.9
.
22.9
.-26.9
.
29.9
.-3.1
0.
6.1
0.-
10.1
0.
13.1
0.-
17.1
0.
27.1
0.-
31.1
0.
20.1
0.-
24.1
0.
30.6
.-4.7
.
7.7
.-11.7
.
14.7
.-18.7
.
21.7
.-25.7
.
28.7
.-1.8
.
4.8
.-8.8
.
11.8
.-15.8
.
18.8
.-22.8
.
25.8
.-29.8
.
1.9
.-5.9
.
8.9
.-12.9
.
15.9
.-19.9
.
22.9
.-26.9
.
29.9
.-3.1
0.
6.1
0.-
10.1
0.
13.1
0.-
17.1
0.
27.1
0.-
31.1
0.
20.1
0.-
24.1
0.

2 Group Management Report Financial Statements Notes
Group Interim Management Report
Deutsche Börse AG prepared this interim financial report in accordance with Interna-tional Financial Reporting Standards (IFRSs) as adopted by the EU. As stipulated by the WpHG (Wertpapierhandelsgesetz – German Securities Trading Act), it is supple-mented by a Group interim management report. This report also takes into account the requirements of German Accounting Standard (GAS) 16. Results of operations, financial position and net assets
Results of operations Following completion of the acquisition of International Securities Exchange Holdings Inc. (ISE) in December 2007, ISE’s results have been fully consolidated in Deutsche Börse Group’s financial reporting since Q1/2008. All disclosures relating to ISE’s financial indi-cators refer to the ISE subgroup, including integration costs and synergy effects. Deutsche Börse Group’s sales revenue rose by 10 percent in the third quarter of 2008 to €616.1 million (Q3/2007: €561.9 million). The greatest contribution to this in-crease was provided by the ISE, sales revenue for which amounted to €66.1 million in the third quarter. Net inter-est income from banking business decreased by 6 per-cent to €55.7 million (Q3/2007: €59.2 million), primar-ily due to lower cash deposits from customers.
90 percent of sales revenue in the third quarter, including net interest income from banking business, was gener-ated by the Eurex, Clearstream and Xetra segments. Eurex accounted for 38 percent (Q3/2007: 30 percent), Clear-stream for 37 percent (Q3/2007: 41 percent) and Xetra for 15 percent (Q3/2007: 18 percent). The increase in the Eurex segment is due to a large extent to the consoli-dation of ISE. Due to the additional costs resulting from the consolida-tion of ISE, total costs were up 13 percent year-on-year to €311.2 million (Q3/2007: €274.5 million). The ISE-related costs in the third quarter of 2008 amounted to €42.0 mil-lion and include amortization of intangible assets from the purchase price allocation for the ISE transaction amount-ing to €10.1 million. Adjusted for ISE costs, total costs decreased by 2 percent. The Group’s strict cost manage-ment continued to have a positive effect on costs.
Sales revenue and EBITA by quarter Breakdown of sales revenue by segment1)

Group Management Report 3
Deutsche Börse Group’s EBITA increased to €385.0 mil-lion, a year-on-year growth of 5 percent (Q3/2007: €368.3 million). ISE’s EBITA contribution amounted to €26.1 million. Sales revenue from ISE’s derivatives, stock exchange and market data business is reported in the Eurex segment. The SIX Swiss Exchange AG’s share in the ISE subgroup’s post-tax earnings is shown within minority interests. Xetra segment
Sales revenue down 12 percent to €99.9 million (Q3/2007: €113.4 million).
Costs increased 13 percent to €50.1 million (Q3/2007: €44.5 million).
EBITA decreased by 27 percent to €56.7 million (Q3/2007: €77.8 million).
The ongoing uncertainty on the financial markets and the resulting investor caution in the months of July and August in particular led to a year-on-year decrease in trading volume in the cash market in the third quarter of 2008. Market trading only picked up in September. The worsening of the financial market crisis in the middle of September led to extremely volatile days on the market with large order quantities. The number of transactions
in Xetra® trading grew by 15 percent in the third quarter to 55.8 million, although the trading volume decreased by 18 percent to €540.3 billion. The main reason for this divergence is the average transaction size, which fell in the third quarter to €19.4 thousand (Q3/2007: €27.0 thousand). This is due in part to the 44 percent share of algorithmic trading (Q3/2007: 42 percent), in which order sizes tend to be smaller, but also to the lower mar-ket valuations of the securities. Besides institutional investors, who trade primarily on Xetra, private investors in particular were reluctant to place orders: floor-traded volumes at the Frankfurt Stock Exchange fell by 34 percent year-on-year to €17.8 billion. Pricing models in the cash market consider both volumes and the number of orders: the trading fees are calculated per executed order, depending on the order value. The order value is more important for the segment’s total revenue due to the price structure. The pricing model for algorithmic trading on Xetra was adjusted with effect from 1 September 2008. The minimum fee of €0.60 for orders executed in the Automated Trading Programm (ATP) no longer applies, while the number of discount levels and the maximum discount rate were adjusted. Since the new model favours smaller and particularly price-sensitive algo-rithmic orders, Deutsche Börse predicts that the price effect will be largely offset by a further increase in ATP volume. Alternative trading platforms have expanded their market position over the course of the year. According to current estimates, this did not lead to a reduction in the volumes traded on Xetra by market participants. Rather, the new providers seem primarily to attract orders that were previously traded over-the-counter or that represent incremental trading volumes. As a result, alternative trad-ing platforms provide for additional arbitrage opportunities for trading participants and thus are increasing total trad-ing volumes. However, on-exchange trading has proven its value in times of extremely high volatility offering high liquidity, reliability and high-speed systems under maxi-mum loads, along with protection against counterparty default due to the central counterparty.
EBITA by segment

4 Group Management Report Financial Statements Notes
Following its migration to Xetra in April 2008, Scoach acquired an additional 100 international trading partici-pants in 19 European countries. Scoach lifted its share of the market for stock exchange trading of structured prod-ucts to around 35 percent in the third quarter (Q3/2007: 30 percent). However, this increase was unable to offset the decrease in trading activity caused by the unfavour-able market environment. The customer trading volume (single-counted) fell by 6 percent to €17.0 billion. During the migration of German Scoach trading from lead broker trading to the Xetra platform, the reporting method for the German order book turnover was changed. Only the customer order book turnover is shown. This presen-tation simplifies the comparison with other trading plat-forms for structured products and also correlates more closely with the sales revenue generated.
Xetra segment: key indicators
Q3/2008 Q3/2007 ChangeTrading volume (single-counted) €bn €bn %
Xetra® 540.3 657.8 –18
Floor1) 17.8 26.9 –34
Scoach2) 17.0 18.1 –6
Transactions m m %
Xetra (transactions) 55.8 48.7 +15
1) Excluding certificates and warrants (now shown in the Scoach section)
2) In April 2008, Scoach trading (German marketplace) migrated to the Xetra platform
and has been presented as customer order book turnover since then. Prior-period
figures have been adjusted accordingly. Scoach’s trading volumes are given for the
German and Swiss marketplaces. The XTF Exchange Traded Funds® segment achieved a trading volume of €30.1 billion in the third quarter of 2008, down 10 percent year-on-year (Q3/2007: €33.4 billion). By contrast, the volume of funds in the XTF segment hit another record level at the end of Q3/2008: the figure of €77.5 billion represents a year-on-year increase of 25 percent (Q3/2007: €61.8 billion).
Investors benefit from the continually expanding product offering and high liquidity. With a product portfolio cur-rently comprising 364 exchange-traded funds (Q3/2007: 256 ETFs) – the broadest offering of all European ex-changes – and a current market share in Europe of 37 percent, the segment maintained its position as Europe’s leading marketplace for ETF trading. The costs for the segment were up 13 percent year-on-year, due to Scoach’s migration to Xetra. Traders using the Specialist model receive a part of the trading fee as pay-ment for making liquidity available on an ongoing basis. Such fees are recognized as sales-related costs in the Xetra segment. These costs, however, have a correspond-ing positive counterpart in sales revenue. Xetra-Gold®, the physically backed no par value note issued by Deutsche Börse Commodities GmbH, further increased sales revenue and market share in the third quarter. Order book turnover increased to around €288 million, while the market share of physically backed gold ETCs in September was 58 percent. On 30 September, sales reached their highest level since the introduction of Xetra-Gold: a total of 1.6 tons of gold were traded on this day alone. The total holdings of the issuer, Deutsche Börse Commodities, amounted to 13.6 tons of gold. On 1 October 2008, Deutsche Börse introduced the First Quotation Board in order to clearly identify primary listings in the Open Market. This primary market covers all com-panies included or to be included in trading in the Open Market on the Frankfurt Stock Exchange that have not previously been listed on another stock exchange. All other companies traded in the Open Market that are already traded on a stock exchange in Germany or abroad and that are subject to home market regulations are listed on the Second Quotation Board. In addition, companies listed on the First Quotation Board as of 1 October must prove that they have a minimum share capital of €250,000.

Group Management Report 5
Breakdown of sales revenue in the Xetra segment
Eurex segment Eurex sales revenue rose by 36 percent to €257.5 million (Q3/2007: €189.4 million, excluding ISE)
Costs were up 58 percent year-on-year to €122.4 million (Q3/2007: €77.4 million, excluding ISE).
EBITA increased by 21 percent to €153.0 million (Q3/2007: €126.4 million, excluding ISE).
Eurex including ISE recorded a year-on-year increase of 15 percent in the volume of contracts traded during the third quarter of 2008, to 811.7 million (pro forma Q3/2007: 708.1 million, including ISE). After a weak August, the volume of contracts grew significantly, partly due to the worsening financial crisis in September. With 330.9 million contracts traded in September, Eurex including ISE recorded the highest monthly volume in its history. Eurex generated its largest absolute and relative contract growth in the European equity index derivatives and the US options product groups. Equity index derivatives increased by 29 percent to 273.6 million traded contracts (Q3/2007: 211.9 million). This increase was driven in particular by trading in equity index options, which increased by 45 percent to a total of 135.6 million con-tracts. Due to the changed product mix and a higher proportion of over-the-counter (OTC) block trades with a
fee cap, the increase in sales revenue from European equity index derivatives failed to keep pace with the underlying trading volumes. In the case of European equity derivatives, Eurex recorded a 23 percent increase in contracts traded to 97.2 million (Q3/2007: 79.1 million). Single-stock futures generated the strongest growth year-on-year (up 71 percent), although as expected, they re-mained below the contract volume in the second quarter following the end of the German dividend season. The number of OTC block trades grew in this product group as well. As in the case of equity index derivatives, sales revenue did not increase at the same rate as the trading volume due to the trading fee cap, the changed product mix within the equity derivatives segment and the price changes described later on. European interest rate derivatives recorded a volume decrease of approximately 19 percent year-on-year, to a total of 164.3 million contracts traded (Q3/2007: 202.5 million). Before the financial crisis worsened in September, the stable long-term interest rate trend in the euro zone was in line with market expectations. As a result, market participants traded less long-term interest rate derivatives in the third quarter – a product group in which Eurex has a leading market position. The contract volume for interest rate derivatives increased again in September, climbing 17 percent year-on-year. On ISE, the trading volume in US options in the second quarter rose by 29 percent year-on-year to 276.6 million contracts. On 18 September 2008, ISE recorded a new daily record with 7.9 million contracts traded.
Contract volumes in the derivatives market
Q3/2008 Q3/2007 Change m contracts m contracts %
European equity index derivatives 273.6 211.9 +29
European equity derivatives 97.2 79.1 +23
European interest rate derivatives 164.3 202.5 –19
US options 276.6 214.6 +29
Total 811.7 708.1 +15
Segment costs were up 58 percent year-on-year mainly due to the consolidation of ISE. Adjusted for the consoli-dation of ISE, costs in the Eurex segment rose by only 3 percent.

6 Group Management Report Financial Statements Notes
In the third quarter of 2008, Eurex Repo, which operates CHF and EUR repo markets, achieved a record out-standing volume. This was driven by the collateralized money market segment Euro GC Pooling®, thanks to the link with the pools of international securities held in cus-tody by Clearstream. Especially in difficult and rapidly changing market conditions such as at the present time, customers trust this collateralized liquidity management model for securities financing in Europe. Euro GC Pooling achieved an average outstanding volume of €43.5 billion in the third quarter (Q3/2007: €13.1 billion). Eurex Repo set a new overall record for all of its markets with an average outstanding volume of €137.1 billion in the third quarter, an increase of 49 percent year-on-year. To increase the attractiveness of its OTC clearing offering, Eurex Clearing has offered a new Multilateral Trade Regis-tration (MTR) function since 1 July 2008. MTR enables the entry of block trades in equity options involving sev-eral counterparties. At the same time a fee for the entire block trade is calculated independent of the number of counterparties involved (deal-based pricing). In addition, Eurex introduced new fee caps for OTC block trades in equity options and equity futures as of 1 July 2008, and lowered the trading fees for single-stock futures in the on-exchange order book and for OTC transactions. Eurex expects the trend towards using the central counterparty for OTC transactions will continue and generate additional volume growth, thus largely offsetting the price reductions. The OTC share of traded contracts rose to 37 percent in the third quarter 2008 (Q3/2007: 30 percent). Eurex also added new products to its portfolio in the third quarter of 2008 including futures on well-known indices such as the Dow Jones Global Sector Titans indices and the TecDAX®, as well as a total of 52 single-stock futures.
Breakdown of sales revenue in the Eurex segment
Eurex Zürich AG holds 34.7 percent of the shares in the European Energy Exchange AG (EEX). The EEX is the first integrated cash and derivatives market for electricity in Central Europe. Volumes of emission derivatives, which have been available to Eurex members since the EEX/Eurex cooperation started on 5 December 2007, increased significantly in the third quarter of 2008 to 22.8 million tons (Q3/2007 before the cooperation: 8.1 million tons). Clearstream segment
Sales revenue decreased by 2 percent to €189.2 million (Q3/2007: €193.0 million).
Net interest income from banking business decreased by 6 percent to €55.7 million (Q3/2007: €59.2 million).
Costs decreased by 8 percent to €129.6 million (Q3/2007: €140.9 million).
EBITA increased by 2 percent to €118.9 million (Q3/2007: €116.3 million).
In the custody business, the average value of assets under custody in the third quarter 2008 increased by 2 percent year-on-year, reaching €10.8 trillion. This growth was primarily due to the growth in Clearstream’s international business. The value of international deposits increased by 8 percent to €5.3 trillion, while domestic assets fell by 4 percent to €5.5 trillion, mainly due to the decrease in equities’ market value. In the context of the consolidation in financial markets, customers merged and

Group Management Report 7
jointly achieved higher volumes and subsequently benefited from higher rebates. Therefore, custody business sales revenue decreased by 1 percent to €116.0 million (Q3/2007: €117.5 million). The total number of settlement transactions processed by Clearstream went down by 15 percent to 26.7 million (Q3/2007: 31.4 million). The number of domestic stock exchange transactions declined by 17 percent and the number of international stock exchange transactions by 45 percent. These transactions are generated mainly from German retail investors’ trading. OTC transactions on the domestic market fell by 12 percent. However, international OTC transactions increased by 5 percent year-on-year. Due to a shift in the product mix, settlement sales revenue declined more sharply than business volumes. In total, settlement sales revenue went down by 23 percent to €31.2 million (Q3/2007: €40.3 million). Average overnight customer deposits amounted to €4.7 bil-lion in the third quarter 2008 (Q3/2007: €5.9 billion). Despite lower average customer cash balances, net interest income from the banking business decreased by only 6 percent to €55.7 million in the third quarter 2008 (Q3/2007: €59.2 million). This is mainly due to the increase of net interest income from Clearstream’s own funds. Within the Global Securites Financing business (GSF), which includes triparty repo, securities lending and col-lateral management, strong growth continued with aver-age outstandings reaching €394.1 billion for the third quarter 2008, an increase of 19 percent year-on-year (Q3/2007: €332.2 billion). The rise reflects the growing importance of secured financing and the continued move of collateral towards central international liquidity pools. In particular, collateral management services significantly contributed to the increase of outstandings. Sales reve-nue in the GSF business increased by 31 percent to €20.0 million (Q3/2007: €15.3 million) and partly offset the decrease in sales revenue from the custody and set-tlement business.
Clearstream segment: key indicators
Q3/2008 Q3/2007 Change
Custody1) €bn €bn %
Value of securities deposited (average value during Q3) 10,847 10,658 +2
international 5,293 4,899 +8
domestic 5,554 5,759 –4
Settlement1) m m %
Securities transactions 26.7 31.4 –15
international 6.7 7.9 –15
domestic 20.0 23.5 –15
Global Securities Financing1) €bn €bn %
Outstanding volume (average value during Q3) 394.1 332.2 +19
Average daily cash balances €m €m %
Total 4,666 5,912 –21
euros 1,549 2,727 –43
US dollars 1,963 1,619 +21
other currencies 1,154 1,566 –26
1) Figures differ from information shown in previous periods due to a new statistical
reporting method.
Costs went down by 8 percent primarily due to a de-crease in staff costs, lower depreciation as well as effects from the restructuring program. This cost development offset the small reduction in sales revenue and led to a 2 percent increase in EBITA.

8 Group Management Report Financial Statements Notes
Breakdown of sales revenue in the Clearstream segment
As of October 2008, the Central Facility for Funds (CFF®), Clearstream’s post trade solution for investment funds, opened up to the UK market, the fifth market in Europe (after Luxembourg, Belgium, Ireland and Switzerland). CFF was initially launched in March 2007 for investment funds domiciled in Luxembourg, the largest market in Europe for international funds. Clearstream designed CFF as an answer to growing mar-ket demand in Europe. CFF brings multiple transfer agents and multiple distributors together through one single point of access. It offers a straight-through process-ing (STP) solution for settlement and custody processes in an industry characterized by little standardization and thus operational risk. According to a study by Deloitte, a consultancy, the cross border investment funds industry could save up to 30 percent of processing costs and thus gain over €300 million by streamlining the processes of cross border mutual funds distribution. However, Clearstream’s solutions to streamline the in-vestment funds industry post trade processes are not limited to Europe. In October, a Japanese fund distributor has become the first Japanese customer of CFF. Alto-gether, CFF counts 31 members and offers access to more than 24,000 fund classes.
Clearstream is the first securities settlement system out-side Japan to have become a legally recognized interme-diary by the Japanese authorities for corporate bonds and municipal bonds. This means that Clearstream’s custom-ers are fully protected under Japanese law for their bond holdings in Clearstream. Clearstream has been granted the Foreign Indirect Management Institution status from the Japan Securities Depository Center, Inc. Due to this status, Clearstream will be able to offer services for Japa-nese municipal bonds as well as value-added services, such as withholding tax exemption benefits on Japanese corporate bonds. These services will be operational as soon as the relevant Japanese Tax Offices approve Clear-stream’s Qualified Foreign Intermediary status. Market Data & Analytics segment
Segment sales revenue rose by 9 percent to €46.1 million (Q3/2007: €42.3 million).
Costs amounted to €21.1 million, a year-on-year decline of 13 percent (Q3/2007: €24.2 million).
EBITA increased significantly by 30 percent year-on-year to €30.5 million (Q3/2007: €23.5 million).
Front Office Data & Analytics, the segment’s largest revenue driver, acquired additional users for its CEF® technology in the third quarter. Increased income from the use of data for algorithmic trading also contributed to the expansion of Front Office Data & Analytics’ business. Issuer Data & Analytics’ index business remains the seg-ment’s fastest-growing area with its innovative products. However, growth tailed off somewhat in the third quarter, since issuers launched fewer new products on the market overall due to the financial crisis. Accordingly, license revenue for index-based products is trending downwards. In Back Office Data & Analytics, business with mandatory data using the TRICE® system, which transmits data on reportable transactions to the German Federal Financial Supervisory Authority (Bundesanstalt für Finanzdienstleis-tungsaufsicht, BaFin), declined year-on-year in the third quarter of 2008. As in the first two quarters of 2008, this is due to both the EU Markets in Financial Instruments Directive (MiFID), which specifies that many transactions no longer have to be reported, and to lower trading volumes.

Group Management Report 9
By contrast, Avox Ltd., in which Deutsche Börse holds a 77 percent stake, expanded its network and increased its customer base. The larger the Avox community becomes, the greater the synergy potential Avox can use in data cleansing. On 1 September, Market Data & Analytics expanded its data service by adding information on European Directors’ Dealings (EDD). This makes Deutsche Börse the only provider to publish information on insider transactions throughout Europe as a single, consolidated data flow. Securities transactions by executive board members, supervisory board members and their families involving their companies’ own instruments are collected, cleansed, verified and made available in a standardized format in real-time. In addition to the vendors, potential customers include traders who pursue algorithmic trading strategies. The segment has already recorded successful sales and acquired its first customers for the new product. Information Technology segment
External sales revenue generated by the IT segment fell slightly to €23.4 million (Q3/2007: €23.8 million).
Costs were up 4 percent year-on-year, at €93.0 million (Q3/2007: €89.2 million).
EBITA increased by 7 percent to €31.9 million (Q3/2007: €29.7 million).
External sales revenue declined slightly to €23.4 million due to the decrease in floor trading activity. As part of its technology roadmap, Deutsche Börse Group invests con-tinuously in the performance of its systems and network. The value of these investments was proven in recent weeks in the wake of the financial crisis, as the systems processed peak loads on some market days with no ad-verse effects on performance: over 1 million transactions were processed on Xetra, over 800 million quotes on Eurex, and around 1.5 billion quotes on Scoach – all that in the course of a single trading day. The systems re-mained stable and offered their customary level of effi-ciency, settling even these volumes with minimal execu-tion times. Automated processes on high-performance systems prevented noticeable delays in order processing. Deutsche Börse’s reliable trading and settlement systems help minimize the operational risks of trading participants.
Clearstream Services, the Luxembourg branch of the IT segment, will develop the software for Link Up Markets and operate the system. Link-Up Capital Markets, S.L., an organization founded by seven leading central securi-ties depositories, improves post-trade processing of cross-border securities transactions by offering a single access point to connected markets instead of the previous multi-ple interfaces. Link Up Markets is scheduled to be launched in the first half of 2009. The segment’s total costs increased slightly year-on-year as a result of the consolidation of ISE in Deutsche Börse Group. Internal sales revenue, which the IT segment gen-erates among other things by providing development and network services for the Group’s market segments, in-creased by €6.1 million year-on-year to €97.3 million. As a result, the segment’s overall EBITA growth was positive. Financial position Cash flow In the first three quarters of 2008, Deutsche Börse Group recorded a 17 percent increase in cash flows from operating activities to €906.2 million (Q1–3/2007: €771.7 million). The increase is attributable primarily to the higher net income for the period. Cash outflows from investing activities decreased to €–261.0 million (Q1–3/2007: €–368.5 million), primar-ily because of the changed maturities of cash investments. Cash flows from financing activities amounted to €–668.7 million (Q1–3/2007: €–477.7 million). This is primarily attributable to the following items:
Net cash inflow from long-term financing of €1,481.6 million
Net cash inflow from Deutsche Börse AG’s commercial paper issued in July. Under the program, commercial paper amounting to a total of €395.6 million with maturities of between one and four months was issued as part of short-term liquidity management. Interest payments are in line with market interest rates, oriented towards EURIBOR.
Cash outflow from repayment of the ISE bridge financing in the amount of €1,341.8 million and repayment of parts of commercial paper in the amount of €107.5 million
Repayment of a corporate bond from 2003 that ma-tured in May 2008 in the amount of €500.0 million

10 Group Management Report Financial Statements Notes
A dividend payment of €403.0 million that was higher than in the previous year (Q1–3/2007: €329.8 million)
Repurchase of own shares worth €200.0 million (Q1–3/2007: €161.3 million).
Cash and cash equivalents as at 30 September 2008 amounted to €1,021.3 million (30 September 2007: €952.3 million). The strong cash flows from operating activities continue to ensure the Group’s liquidity. At €848.8 million, free cash flow, i.e. cash flows from operating activities less payments to acquire intangible assets and property, plant and equipment, significantly exceeded the previous year’s level (Q1–3/2007: €722.3 million). Capital management program Under its capital management program, Deutsche Börse AG distributes funds not required for the Group’s operat-ing business to its shareholders. Deutsche Börse intends to continue its dividend policy to distribute 40 to 60 per-cent of consolidated net income to shareholders. The remaining funds are earmarked for the continued repur-chase of own shares. These measures are implemented subject to unbudgeted investment needs, capital require-ments as well as general liquidity considerations. The program is the result of an intensive review of capital requirements, which considers the Group’s capital needs from legal, regulatory, credit rating and economic capital perspectives. To ensure the continued success of the Clearstream segment, which is engaged in securities custody and settlement, the Company aims to maintain Clearstream Banking S.A.’s strong “AA” credit rating. In addition, Deutsche Börse AG needs to maintain a strong credit profile for the benefit of its subsidiary Eurex Clear-ing AG. Deutsche Börse Group’s primary objective is therefore to ensure that the interest coverage ratio (ratio of EBITDA to interest expenses from financing activities) does not fall below 16 at the Group level.
Since the launch of the capital management program in 2005, the Company has distributed around €1.0 billion as dividends and around €1.7 billion in the form of share buy-backs. Most recently, €403.0 million was distributed on 22 May 2008 as an annual dividend and shares worth €200.0 million were repurchased in July and September 2008. Of the 35.5 million shares repurchased since 2005, the Company has cancelled 28.6 million shares so far. A further 0.9 million shares were acquired by employees under the terms of the Group Share Plan. As at 30 Septem-ber 2008, the remaining 6.0 million shares were held by the Company as treasury shares. Deutsche Börse is planning to buy back shares with a volume of up to €200.0 million in the remainder of the year. As usual, the actual extent of the share buy-backs is subject to unbud-geted investment needs, capital requirements as well as general liquidity considerations. Net assets Deutsche Börse Group’s noncurrent assets amounted to €4,288.9 million as at 30 September 2008 (30 Septem-ber 2007: €2,197.3 million). As in the first six months of the year, the largest share of noncurrent assets were intangible assets of €3,427.9 million (30 September 2007: €1,227.2 million). Intangible assets consist of the following items: goodwill of €1,977.7 million (30 September 2007: €1,120.6 million), which changed primarily due to the acquisition of ISE; other intangible assets of €1,330.7 million resulting from the ISE acquisi-tion; and investments in trading and settlement systems, which are capitalized as software and amortized over their expected useful lives. The net carrying amount of software was €99.0 million as at 30 September 2008 (30 September 2007: €91.2 million). Deutsche Börse Group’s financial assets increased slightly to €740.5 million (30 September 2007: €710.1 million) mainly due to higher investments in noncurrent financial instruments as part of liquidity management for Clear-stream Banking S.A. and Clearstream Banking AG.

Group Management Report 11
Noncurrent assets were financed by equity amounting to €2,917.4 million (30 September 2007: €2,407.6 mil-lion) and noncurrent liabilities, mainly from the long- term financing of ISE and deferred tax liabilities, of €2,240.8 million (30 September 2007: €657.7 million). While the corporate bond was redeemed on 23 May 2008, the debt instruments raised to refinance the ISE transaction were recognized as noncurrent liabilities. The bridge loan that had existed since the ISE acqui-sition in December 2007, which was recognized under other current liabilities, was fully repaid in July 2008. Deutsche Börse resumed its commercial paper program in July for the purpose of short-term liquidity management. As at 30 September 2008, the outstanding volume amounted to €291.9 million. Risk report
Deutsche Börse Group provides detailed information on its risk management strategy, organization, processes and methods in its annual reports. Risk management is a fundamental component of the management and control of Deutsche Börse Group, which has therefore established a Group-wide risk management concept. This comprises roles, processes and responsibili-ties and is binding on all staff and organizational entities. The concept ensures that emerging risks can be identified and dealt with appropriately at an early stage. The front office areas are responsible for identifying risks and reporting these promptly to Group Risk Management (GRM), a central function with Group-wide responsibili-ties. GRM assesses all new and existing risks and reports these on a monthly basis to the Executive Board and on a quarterly basis to the Supervisory Board. In special cases, GRM also reports to these boards on an ad hoc basis. Risk control is performed in the front office areas, i.e. in the areas where the risks occur. The Group uses the con-cept of “Value at Risk” (VaR) to measure and report all risks. The Group’s models are based on a one-year time horizon and a 99 percent confidence level, and assume uncorrelated events.
In 2008 to date, the Group has reinforced its risk man-agement organization, for example by recruiting further employees to the Group Risk Management central func-tion. Having received regulatory approval from the CSSF (Commission de Surveillance du Secteur Financier), the Clearstream subgroup companies have been using the Advanced Measurement Approach (AMA) since 1 January 2008 to calculate their capital requirements for opera-tional risks. Despite the global financial crisis, Deutsche Börse Group’s risk situation has not changed significantly. Deutsche Börse AG had to write off fee receivables from Lehman in the amount of €2.4 million. Apart from this, no companies in Deutsche Börse Group were directly impacted by the global financial crisis, e.g. through losses from investments in subprime securities. The potential future effects to which the Group or one of its subsidiaries might be exposed to are mitigated by preventive measures such as those described below. At Eurex Clearing AG, these measures include an increase in the margin requirements and safety margins. Eurex Clearing AG successfully wound down all positions involving Lehman Brothers International (Europe) in an orderly and timely manner. During this process, all risks were covered by sufficient collateral at all times. As an additional measure, Eurex Clearing AG increased its equity by €20 million. Cash margins in the treasury department are solely deposited with highly rated coun-terparties and are collateralized to the extent possible. For the Clearstream subgroup, the measures include further reductions of uncollateralized credit lines in the area of securities transactions settlement, a reduction of collateralized credit lines in the ASLplus business, and increased collateral requirements in all areas subject to risk. Based on the market environment – including the ongoing global financial crisis – and Deutsche Börse Group’s busi-ness model, the Executive Board considers the risks for the Group to be limited and manageable. There is no reason to believe that the Group’s risk situation will change significantly.

12 Group Management Report Financial Statements Notes
Report on expected developments
The report on expected developments describes the ex-pected development of Deutsche Börse Group in financial year 2008. It contains statements and information on events in the future. These forward-looking statements and information are based on the Company’s expectations and assumptions at the time of publication of this report on expected developments. These expectations and as-sumptions are in turn subject to known and unknown risks and uncertainties. Numerous factors influence the success, the business strategy and the financial results of the Company. Many of these factors are outside the Company’s control. Should one of the risks or uncertain-ties materialize or one of the assumptions made turn out to be incorrect, the actual development of the Company could deviate either positively or negatively from the expectations and assumptions contained in these for-ward-looking statements and information in this report. Development of results of operations For the remainder of financial year 2008, Deutsche Börse Group expects no significant deviations to the forecasts for year-on-year earnings growth in 2008 that were made in the consolidated financial statements for full-year 2007. However, the global financial markets look set to remain unsettled over the rest of the year. As a result, the Company expects less favourable conditions for the global economy’s growth.
Sales revenue in the Xetra cash market segment will con-tinue to depend on equity market trends, equity market volatility and structural changes relating to trading activity. In addition, the Company is closely monitoring events as they occur in the competitive environment of the European cash markets. The Company believes that, in contrast to the cash market, the general trend on the financial mar-kets will, in comparison with structural changes, play a subordinated role in the Eurex derivatives market segment in the medium and long term. Due to the existing price structure, the trend towards the decoupling of sales reve-nue and transaction growth that emerged in the second and third quarters 2008 can be expected to continue if the share of over-the-counter block transactions increases further. Additionally, further structural growth in both seg-ments is anticipated, especially due to computerized algo-rithmic trading. In addition to the European products, the integration of the US options business resulting from the acquisition of ISE will lead to further growth in the Eurex segment in the forecast period. For the Clearstream seg-ment, the Group expects that the volume of bonds issued internationally will continue to grow faster than that of fixed-income securities issued nationally. Development of the Group’s financial position The Company expects its ongoing business activities to generate positive operating cash flow in the remaining quarter of the current financial year. As part of its cash flow from investing activities, Deutsche Börse Group continues to plan to invest around €80 million in intangible assets and property, plant and equipment (2007: €79.7 million) for 2008. These investments will serve primarily to develop new and enhance existing Group products, services and systems in the Xetra, Eurex and Clearstream segments.

Financial Statements 13
Consolidated Income Statement for the period 1 January to 30 September 2008
Quarter ended Nine months ended 30 Sep. 2008 30 Sep. 2007 30 Sep. 2008 30 Sep. 2007
€m €m €m €m
Sales revenue 616.1 561.9 1,846.1 1,647.5
Net interest income from banking business 55.7 59.2 179.2 167.3
Own expenses capitalized 6.9 6.3 19.6 18.6
Other operating income 13.4 14.5 53.7 56.0
692.1 641.9 2,098.6 1,889.4
Fee and commission expenses from banking business – 44.3 – 42.8 – 125.8 – 119.0
Staff costs – 94.5 – 95.1 – 321.7 – 353.2
Depreciation, amortization and impairment losses (other than goodwill) – 33.2 – 29.8 – 99.4 – 96.7
Other operating expenses – 139.2 – 106.8 – 377.4 – 330.8
Result from equity investments 4.1 0.9 11.6 0.7
Earnings before interest, tax and goodwill impairment (EBITA) 385.0 368.3 1,185.9 990.4
Goodwill impairment 0 0 0 0
Earnings before interest and tax (EBIT) 385.0 368.3 1,185.9 990.4
Financial income 44.7 25.5 161.4 85.1
Financial expense – 73.0 – 23.4 – 190.3 – 75.8
Earnings before tax (EBT) 356.7 370.4 1,157.0 999.7
Income tax expense – 98.1 – 132.5 – 334.0 – 358.5
Net profit for the period1) 258.6 237.9 823.0 641.2
Minority interests – 1.3 0.3 – 12.1 0
Net income for the period2) 257.3 238.2 810.9 641.2
Earnings per share (basic and diluted) (€) 1.35 1.23 4.23 3.30
1) Total recognized income for the period (including gains and losses taken to equity) amounted to €808.0 million (2007: €596.1 million),
of which €788.3 million (2007: €596.5 million) were attributable to shareholders of the parent company.
2) Profit attributable to shareholders of the parent company

14 Group Management Report Financial Statements Notes
Consolidated Balance Sheet as at 30 September 2008
30 Sep. 2008 31 Dec. 2007 30 Sep. 2007 €m €m €m
ASSETS
Noncurrent assets
Intangible assets 3,427.9 3,419.8 1,227.2
Property, plant and equipment 99.2 98.3 229.4
Financial assets and investment property 740.5 630.2 710.1
Other noncurrent assets 21.3 35.5 30.6
4,288.9 4,183.8 2,197.3
Current assets
Financial instruments of Eurex Clearing AG 106,774.9 60,424.0 79,403.1
Current receivables and securities from banking business 11,902.4 9,619.7 9,056.2
Other receivables and other assets1) 490.1 660.8 314.1
Restricted bank balances 9,870.1 4,221.7 2,077.2
Other cash and bank balances 637.7 547.6 608.0
129,675.2 75,473.8 91,458.6
Total assets 133,964.1 79,657.6 93,655.9
EQUITY AND LIABILITIES
Equity
Shareholders’ equity 2,582.7 2,377.3 2,388.6
Minority interests 334.7 312.9 19.0
Total equity 2,917.4 2,690.2 2,407.6
Noncurrent liabilities
Provisions for pensions and other employee benefits 34.2 20.6 33.3
Other noncurrent provisions 78.5 118.4 62.8
Deferred tax liabilities 618.8 626.0 6.6
Interest-bearing liabilities 1,505.1 1.2 499.9
Other noncurrent liabilities 4.2 5.2 55.12)
2,240.8 771.4 657.7
Current liabilities
Tax provisions 251.6 273.3 276.9
Other current provisions 77.7 205.0 118.7
Financial instruments of Eurex Clearing AG 106,774.9 60,424.0 79,403.1
Liabilities from banking business3) 11,235.5 9,125.9 8,705.3
Cash deposits by market participants 9,867.9 4,016.2 1,770.0
Other current liabilities 598.3 2,151.6 316.6
128,805.9 76,196.0 90,590.6
Total liabilities 131,046.7 76,967.4 91,248.3
Total equity and liabilities 133,964.1 79,657.6 93,655.9
1) Thereof €16.2 million (31 December 2007: €17.4 million, and 30 September 2007: €14.3 million) with a remaining maturity of more
than one year from corporation tax credits in accordance with section 37 (5) KStG (Körperschaftsteuergesetz, German Corporation Tax Act)
2) Thereof €53.3 million from cancellable equity instruments attributable to the minority shareholder
3) Thereof €130.0 million (31 December 2007: €95.1 million, and 30 September 2007: €0 million) payables to associates

Financial Statements 15
Consolidated Cash Flow Statement for the period 1 January to 30 September 2008
Nine months ended 30 Sep. 2008 30 Sep. 2007
€m €m
Net profit for the period 823.0 641.2
Depreciation, amortization and impairment losses 99.4 96.7
Decrease in noncurrent provisions – 26.7 – 24.3
Deferred tax income – 22.3 – 5.1
Other non-cash expense 0.6 26.9
Changes in working capital, net of non-cash items 32.2 45.7
Net gain on disposal of noncurrent assets 0 – 9.4
Cash flows from operating activities 906.2 771.7
Payments to acquire intangible assets and property, plant and equipment – 57.4 – 49.4
Payments to acquire noncurrent financial instruments – 128.2 – 124.8
Payments to acquire investments in associates – 33.3 0
Acquisition of subsidiaries, net of cash acquired 0 – 5.5
Proceeds from disposal of investments in associates 16.8 0
Net increase in current receivables, securities and liabilities from banking business with an original term greater than three months – 79.0 – 252.0
Proceeds from disposals of available-for-sale noncurrent financial instruments 19.9 45.8
Proceeds from disposal of other noncurrent assets 0.2 17.4
Cash flows from investing activities – 261.0 – 368.5
Purchase of treasury shares – 200.0 – 161.3
Proceeds from disposal of treasury shares 7.0 14.6
Repayment of long-term financing – 500.0 0
Proceeds from long-term financing 1,481.6 0
Repayment of short-term financing – 1,449.3 0
Proceeds from short-term financing 395.6 0
Finance lease payments – 0.6 – 1.2
Dividends paid – 403.0 – 329.8
Cash flows from financing activities – 668.7 – 477.7
Net change in cash and cash equivalents – 23.5 – 74.5
Effect of exchange rate changes1) 4.6 0
Cash and cash equivalents as at beginning of period2) 1,040.2 1,026.8
Cash and cash equivalents as at end of period2) 1,021.3 952.3
Operating cash flow per share (basic and diluted) (€) 4.73 3.97
Interest income and other similar income 139.9 85.4
Dividends received3) 11.7 9.3
Interest paid – 154.1 – 79.0
Income tax paid – 363.8 – 338.6
1) Primarily includes the exchange differences arising on translation of the ISE subgroup
2) Excluding cash deposits by market participants
3) Dividends received from investments in associates and other equity investments

16 Group Management Report Financial Statements Notes
Consolidated Statement of Changes in Equity for the period 1 January to 30 September 2008
Nine months ended 30 Sep. 2008 30 Sep. 2007
€m €m
Subscribed capital
Balance as at 1 January 200.0 102.0
Retirement of treasury shares – 5.0 – 2.0
Capital increase from share premium 0 100.0
Balance as at 30 September 195.0 200.0
Share premium
Balance as at 1 January 1,242.0 1,340.0
Retirement of treasury shares 5.0 2.0
Capital increase from share premium 0 – 100.0
Balance as at 30 September 1,247.0 1,242.0
Treasury shares
Balance as at 1 January – 589.8 – 443.1
Purchase of treasury shares – 200.0 – 161.3
Retirement of treasury shares 363.6 227.5
Sales within the Group Share Plan 10.2 18.7
Balance as at 30 September – 416.0 – 358.2
Revaluation surplus
Balance as at 1 January 32.1 12.9
Increase due to share-based payments 9.4 2.8
Remeasurement of cash flow hedges – 2.5 – 73.6
Remeasurement of other financial instruments – 25.1 5.7
Deferred taxes on remeasurement of financial instruments 1.8 25.4
Balance as at 30 September 15.7 – 26.8
Accumulated profit
Balance as at 1 January 1,493.0 1,251.6
Dividends paid – 403.0 – 329.8
Net income for the period 810.9 641.2
Exchange rate differences and other adjustments 15.4 – 3.9
Retirement of treasury shares – 363.6 – 227.5
Deferred taxes – 11.7 0
Balance as at 30 September 1,541.0 1,331.6
Shareholders' equity as at 30 September 2,582.7 2,388.6
Minority interests
Balance as at 1 January 312.9 19.9
Changes due to equity increases 2.1 – 0.5
Changes due to share in net gain of subsidiaries for the period 12.1 0
Exchange rate differences 7.6 – 0.4
Balance as at 30 September 334.7 19.0
Total equity as at 30 September 2,917.4 2,407.6

Notes 17
Notes to the Interim Financial Statements 1. Accounting policies
These interim financial statements were prepared in accordance with the International Financial Reporting Standards (IFRSs) as adopted by the European Commission. The significant accounting policies applied by the Company to the consolidated financial state-ments for the year ended 31 December 2007 were also applied to the interim financial statements. In addition, IAS 34 (“Interim Financial Reporting”) was applied. In accordance with the provisions of the WpHG (Wertpapierhandelsgesetz, German Securi-ties Trading Act), these interim financial statements are supplemented by a Group interim management report. IFRIC 14 “IAS 19: The Limit on a Defined Benefit Asset, Minimum Funding Requirements and their Interaction”, which the IASB issued in 2007, is effective for financial years beginning on or after 1 January 2008. IFRIC 14 has not yet been endorsed by the EU. The first-time application therefore would have had no impact on Deutsche Börse Group’s interim financial statements and the conformity with IFRSs as endorsed by the EU. On 13 October 2008, the IASB published its amendments to IAS 39 “Financial Instru-ments: Recognition and Measurement” and IFRS 7 “Financial Instruments: Disclosures” relating to the reclassification of financial instruments. The amendments include the option to reclassify non-derivative financial instruments that were acquired principally for the purpose of sale or repurchase in the near term (i.e. are held for trading) out of the “finan-cial assets at fair value through profit or loss” category and out of the “available-for-sale financial assets” category. This applies in particular to financial instruments that would have originally met the definition of loans and receivables if they are not held for trading or designated as available for sale. This eliminates the remaining differences between IFRSs and US GAAP with regard to the reclassification of financial instruments. The option may be exercised from 1 July 2008. The amendments were adopted by the European Commis-sion on 15 October 2008 and published on 16 October 2008. Deutsche Börse Group did not exercise this option in its interim financial statements.

18 Group Management Report Financial Statements Notes
By the end of the third quarter of 2008, the IASB also issued the following standards and interpretations, although they have not yet been adopted by the EU Commission: Amendments IFRS 1 “First-time Adoption of International Financial Reporting Standards” and IAS 27 “Consolidated and Separate Financial Statements” The amendments are compiled in a document entitled “Cost of an Investment in a Sub-sidiary, Jointly Controlled Entity or Associate”. On first-time adoption of IFRSs, the cost of acquiring investments in subsidiaries, jointly controlled entities and associates can be reported in separate IFRS financial statements at either the fair value determined in accor-dance with IAS 39 or the previous national GAAP carrying amount. Other changes relate to the removal of the definition of the cost method from IAS 27 and the restructuring of an existing group structure. The amended standards are effective for financial years beginning on or after 1 January 2009. Amendments to IAS 39 relating to eligible hedged items The IASB published the revised IAS 39 “Financial Instruments: Recognition and Measure-ment” on 31 July 2008. The amendments serve to clarify the designation of inflation risk as a hedged item and the designation of a one-sided risk in a hedged item. The revised standard is required to be applied retrospectively to financial years beginning on or after 1 July 2009. Changes resulting from the “Annual Improvement Project” The IASB published the “Improvements to IFRSs” on 22 May 2008. This collection of amendments to IFRSs is the outcome of the IASB’s first annual improvements process project. The amendments to the standards give rise to accounting changes for presenta-tion, recognition or measurement purposes (see table below) as well as terminology or editorial changes with minimal effect on accounting. Terminology or editorial changes were made to IFRS 7 and IAS 8, 10, 18, 20, 29, 34, 40 and IAS 41. These changes are effec-tive for financial years beginning on or after 1 January 2009 (except for IFRS 5: effective for financial years beginning on or after 1 July 2009).

Notes 19
Amendments to Standards (Improvement to IFRSs relating to Presentation, Recognition and Measurement)
Standard Subject of Amendment
IFRS 5 Non-current Assets Held for Sale and Discontinued Operations
Plan to sell the controlling interest in a subsidiary: an entity that is committed to a sale plan involving loss of control of a subsidiary should classify all the assets and liabilities of that subsidiary as held for sale when the specific criteria are met, regardless of whether the entity will retain a non-controlling interest in its former subsidiary after the sale.
IAS 1 Presentation of Financial Statements
Current/noncurrent classification of derivatives: clarification that derivatives should be presented as current or noncurrent on the basis of their settlement dates
IAS 16 Property, plant and equipment New definition of recoverable amount: the higher of an asset's fair value less costs to sell and its value in use
Sale of assets held for rental: an entity that, in the course of its ordinary activities, routinely sells items of property, plant and equipment that it has held for rental to others should transfer such assets to inventories at their carrying amount when they cease to be rented and become held for sale. IFRS 5 does not apply in this case. The proceeds from the sale of such assets should be recognized as cash flows from operating activities.
IAS 19 Employee Benefits Curtailments and negative past service cost: clarification with respect to distinction
Plan administration costs: plan administration costs can be deducted only to the extent that such costs have not been reflected in the measurement of the defined benefit obligation, as they would otherwise be double-counted.
Guidance on contingent liabilities
IAS 20 Accounting for Government Grants and Disclosure of Government Assistance
Recognition of government loans with a below-market rate of interest: in future, the benefit of a government loan at a below-market rate of interest is treated as a government grant.
IAS 23 Borrowing Costs Components of borrowing costs: interest expense calculated using the effective interest rate method as described in IAS 39
IAS 27 Consolidated and Separate Financial Statements
Measurement of subsidiaries held for sale: investments in subsidiaries accounted for at cost should be accounted for in accordance with IFRS 5. If the investments are accounted for in accordance with IAS 39 they should continue to be measured in accordance with IAS 39.
IAS 28 Investments in Associates Required disclosures when investments in associates are accounted for at fair value through profit or loss
Impairment of investments in associates: an impairment loss recognized is not allocated to any asset, including goodwill, that forms part of the carrying amount of the investment in the associate. Instead, the entire carrying amount of the investment in the associate is treated as a single asset for impairment testing. If there is an indication that an impairment loss recognized may no longer exist a reversal should be recognized.
IAS 29 Financial Reporting in Hyperinflationary Economies
Description of measurement basis in financial statements: certain assets and liabilities may or must be measured at fair value rather than on the historical cost basis in hyperinflatory economies.
IAS 31 Interests in Joint Ventures Required disclosures when interests in jointly controlled entities are accounted for at fair value through profit or loss
IAS 36 Impairment of Assets Disclosure of estimates used to determine recoverable amount
IAS 38 Intangible assets Expenditure on advertising and promotional activities: clarification of the meaning of "incurred" and that mail order catalogues are advertising expenses and are not therefore recognized as assets.
Unit of production method of amortization: removal of wording that there is rarely, if ever, persuasive evidence to support an amortization method for intangible assets with finite useful lives that results in a lower amount of accumulated amortization than under the straight line method
IAS 39 Reclassification of derivatives into or out of the fair value through profit or loss category
Financial Instruments: Recognition and Measurement Removal of reference to designating and documenting hedges at the segment level
Applicable effective interest rate on cessation of fair value hedge accounting
IAS 40 Investment Property Property under construction or development for future use as investment property brought within the scope of IAS 40 (previously IAS 16).
IAS 41 Agriculture Discount rate for measuring fair value: additional biological transformation

20 Group Management Report Financial Statements Notes
IFRIC 15 “Agreements for the Construction of Real Estate” This Interpretation applies to accounting for real estate sales where an agreement for the construction of real estate is entered into with the buyer before construction is complete or at the start of construction. IFRIC 15 defines criteria for determining whether the agree-ment is within the scope of IAS 11 “Construction Contracts” (recognition of revenue by reference to the stage of completion) or IAS 18 “Revenue” (recognition of all revenue only when the specified unit is ready for occupation and has been delivered to the buyer). This Interpretation is effective for financial years beginning on or after 1 January 2009. IFRIC 16 “Hedges of a Net Investment in a Foreign Operation” IFRIC 16 provides guidance on the reporting of hedges of a net investment in a foreign operation that arise in connection with IAS 21 “The Effects of Changes in Foreign Ex-change Rates” and IAS 39 “Financial Instruments: Recognition and Measurement”. The Interpretation clarifies that the hedged risk may be designated as the foreign currency exposure arising from differences between the functional currency of the foreign operation and the functional currency of any parent entity of that foreign operation, but not exchange differences from the translation into the presentation currency of the parent entity. The IFRIC states that the hedging instrument(s) may be held by any entity or entities within the group. It also provides guidance on the procedure for the disposal of an investment. IFRIC 16 is effective for financial years beginning on or after 1 October 2008 and may be applied prospectively. Deutsche Börse Group does not expect the application of the revised IFRS/IAS and of the new interpretations to have any material or any impact. 2. Group structure
The International Securities Exchange Holdings Inc. (ISE) subgroup was included in the consolidated financial statements as at 31 December 2007. The ISE subgroup’s income statement is included in the consolidated financial statements for the first time in the 2008 reporting period. On 26 March 2008, Deutsche Börse AG established Finnovation S.A., Luxembourg, a wholly owned subsidiary that has been fully consolidated since the first quarter. Clearstream Services (UK) Ltd. was deconsolidated in the first quarter after its liquidation was completed. With effect from 2 April 2008, Clearstream Banking AG acquired an 18.18 percent interest in Link-Up Capital Markets, S.L., Madrid, Spain. This company was classified as an associ-ate and accounted for using the equity method because Clearstream Services S.A. provides the IT infrastructure for Link-Up Capital Markets, S.L. Under IAS 28 this constitutes signifi-cant influence over the organization.

Notes 21
In addition, on 8 April 2008 Eurex Frankfurt AG and the energy exchange Borzen organi-zator trga z električno energijo d.o.o. established the joint venture BSP Regional Energy Exchange LLC, Llubiljana, Slovenia, in which Eurex Frankfurt AG holds a 49 percent interest. The joint venture agreement does not envisage a joint control. Thus, the company is classi-fied as an associate under IAS 28 and accounted for using the equity method. On 30 April 2008, Clearstream International S.A. founded Clearstream Operations Prague s.r.o., a wholly owned subsidiary domiciled in Prague, Czech Republic, that is fully consolidated in the consolidated financial statements of Deutsche Börse Group. The interest held by Eurex Zürich AG in European Energy Exchange AG was increased to a total of 34.73 percent in two steps. On 15 May 2008, a 3.46 percent interest was purchased for €9.2 million. A further 8.05 percent shareholding was acquired on 2 July 2008 for the purchase price of €21.3 million. The interest is still accounted for using the equity method. 3. Seasonal influences
The Group’s revenues are influenced more by the volatility and the transaction volume on the capital markets than by seasonal factors. Owing to a concentration of costs for projects only coming to completion in the fourth quarter, costs in the fourth quarter tend to be higher than in the first three quarters of the business year. 4. Total assets
The increase in consolidated total assets by €6.2 billion to €134.0 billion as at 30 Sep-tember 2008 (30 June 2008: €127.8 billion) depends to a significant extent on financial instruments of Eurex Clearing AG, liabilities from banking business and cash deposits by market participants. The level of these items can vary widely on a daily basis according to customers’ needs and actions.

22 Group Management Report Financial Statements Notes
5. Segment reporting
Sales revenue
Quarter ended Nine months ended 30 Sep. 2008 30 Sep. 2007 30 Sep. 2008 30 Sep. 2007
€m €m €m €m
Xetra 99.9 113.4 306.8 329.9
Eurex 257.5 189.4 762.2 547.0
Clearstream 189.2 193.0 569.7 570.9
Market Data & Analytics 46.1 42.3 136.4 124.7
Information Technology 23.4 23.8 71.0 75.0
Total 616.11) 561.9 1,846.12) 1,647.5
Internal sales revenue Information Technology 97.3 91.2 296.1 285.2
1) Including sales revenue generated by ISE (ISE subgroup including synergy effects) in the amount of €66.1 million
2) Including sales revenue generated by ISE (ISE subgroup including synergy effects) in the amount of €179.0 million
Net interest income from banking business
Quarter ended Nine months ended 30 Sep. 2008 30 Sep. 2007 30 Sep. 2008 30 Sep. 2007
€m €m €m €m
Gross interest income 119.8 130.9 372.7 336.8
Interest expense – 64.1 – 71.7 – 193.5 – 169.5
Total 55.7 59.2 179.2 167.3
Earnings before interest, tax and goodwill impairment (EBITA)
Quarter ended Nine months ended 30 Sep. 2008 30 Sep. 2007 30 Sep. 2008 30 Sep. 2007
€m €m €m €m
Xetra 56.7 77.8 180.5 209.7
Eurex 153.0 126.4 471.8 350.2
Clearstream 118.9 116.3 371.5 312.0
Market Data & Analytics 30.5 23.5 84.3 61.9
Information Technology 31.9 29.7 87.1 78.5
Corporate Services – 7.6 – 3.7 – 10.7 – 19.2
Reconciliation 1.6 – 1.7 1.4 – 2.7
Total 385.01) 368.3 1,185.92) 990.4
1) Including EBITA generated by ISE (ISE subgroup including integration costs and synergy effects) in the amount of €26.1 million
2) Including EBITA generated by ISE (ISE subgroup including integration costs and synergy effects) in the amount of €79.3 million

Notes 23
Earnings before tax (EBT) Quarter ended Nine months ended
30 Sep. 2008 30 Sep. 2007 30 Sep. 2008 30 Sep. 2007
€m €m €m €m
Xetra 56.7 77.8 180.7 209.7
Eurex 160.5 129.1 488.1 358.6
Clearstream 118.9 116.3 371.5 312.0
Market Data & Analytics 30.5 23.5 84.5 62.1
Information Technology 31.9 29.7 87.1 78.5
Corporate Services – 43.2 – 4.1 – 56.3 – 18.2
Reconciliation 1.4 – 1.9 1.4 – 3.0
Total 356.7 370.4 1,157.0 999.7
Investments in intangible assets, property, plant and equipment
Quarter ended Nine months ended 30 Sep. 2008 30 Sep. 2007 30 Sep. 2008 30 Sep. 2007
€m €m €m €m
Xetra 3.4 4.3 6.3 7.5
Eurex 2.5 3.4 12.2 11.8
Clearstream 2.1 1.7 7.3 7.2
Market Data & Analytics 0 0.9 0.3 1.7
Information Technology 9.1 9.8 21.1 25.8
Corporate Services 7.0 0.7 15.2 4.4
Reconciliation – 0.5 – 3.7 – 5.0 – 9.0
Total 23.6 17.1 57.4 49.4
Depreciation, amortization and impairment losses (other than goodwill) Quarter ended Nine months ended
30 Sep. 2008 30 Sep. 2007 30 Sep. 2008 30 Sep. 2007
€m €m €m €m
Xetra 1.6 2.6 5.5 7.6
Eurex 14.7 4.2 41.9 13.0
Clearstream 4.8 10.3 20.2 39.9
Market Data & Analytics 0.5 0.6 1.6 2.1
Information Technology 9.7 8.5 27.9 23.7
Corporate Services 4.4 5.6 9.4 17.1
Reconciliation – 2.5 – 2.0 – 7.1 – 6.7
Total 33.21) 29.8 99.42) 96.7
1) Including depreciation, amortization and impairment losses of ISE in the amount of €11.5 million
(of which intangible assets from purchase price allocation: €10.1 million)
2) Including depreciation, amortization and impairment losses of ISE in the amount of €32.3 million
(of which intangible assets from purchase price allocation: €28.5 million)

24 Group Management Report Financial Statements Notes
6. Earnings per share
Under IAS 33, earnings per share are calculated by dividing the net income for the period by the weighted average number of shares outstanding. There were the following potentially dilutive outstanding options or rights to purchase shares as at 30 September 2008:
Calculation of the number of potentially dilutive ordinary shares
Tranche Exercise price1) Adjusted exercise price in accordance
with IAS 33
Average number of outstanding options
Average price for the period2)
Number of potentially dilutive
ordinary shares
€ € 30 Sep. 2008 € 30 Sep. 2008
2004 26.89 26.89 18,788 88.23 26,124
2005 40.20 40.20 38,875 88.23 42,325
2006 64.78 64.78 54,652 88.23 29,052
2007 0 48.32 129,936 88.23 58,775
2008 0 45.74 203,226 88.23 97,870
1) The original exercise prices of €51.84 for Tranche 2004, €77.69 for Tranche 2005 and €127.80 for Tranche 2006 were adjusted
due to the capitalization measures implemented.
2) Volume-weighted average price of Deutsche Börse AG shares on Xetra for the period 1 January to 30 September 2008
As the volume-weighted average share price was higher than the employees’ option-adjusted exercise prices, these options are considered dilutive under IAS 33. Earnings per share were unchanged due to the small number of potentially dilutive ordinary shares. There were no further rights to subscribe for shares that could have potentially diluted earnings per share either as at 30 September 2008 or as at 30 September 2007.
Calculation of earnings per share (basic and diluted)
Quarter ended Nine months ended 30 Sep. 2008 30 Sep. 2007 30 Sep. 2008 30 Sep. 2007
Number of shares outstanding as at beginning of period 192,021,979 194,269,939 191,888,548 195,597,922
Number of shares outstanding as at 30 September 189,043,563 193,951,994 189,043,563 193,951,994
Weighted average number of shares outstanding 190,530,444 194,247,601 191,436,357 194,464,316
Number of potentially dilutive ordinary shares 208,767 117,262 254,146 139,737
Weighted average number of shares used to compute diluted earnings per share 190,739,211 194,364,863 191,690,503 194,604,053
Net income for the period (€m) 257.3 238.2 810.9 641.2
Earnings per share (basic and diluted) (€) 1.35 1.23 4.23 3.30

Notes 25
7. Material transactions with related parties
Breakdown of other transactions with related parties
Amount of the transactions Outstanding balances
Quarter ended Nine months ended
30 Sep. 2008 30 Sep. 2007 30 Sep. 2008 30 Sep. 2007 30 Sep. 2008 30 Sep. 2007
€m €m €m €m €m €m
Associates:
License fees paid by Eurex Frankfurt AG to STOXX Ltd. – 7.1 – 4.2 – 19.1 – 8.7 – 7.1 0
Operation of Eurex software by Deutsche Börse Systems AG for European Energy Exchange AG 1.6 2.0 5.0 6.7 2.2 3.0
Provision of price data by STOXX Ltd. to Deutsche Börse AG – 0.9 – 0.9 – 3.1 – 3.1 – 0.8 0
Operation of the trading system by Deutsche Börse Systems AG for U.S. Futures Exchange LLC 1.4 1.9 4.2 5.4 1.9 1.2
Operation and development of Xontro by Deutsche Börse Systems AG for BrainTrade Gesellschaft für Börsensysteme mbH 4.8 5.9 15.5 18.8 2.0 4.5
Operation of the floor trading system by BrainTrade Gesellschaft für Börsensysteme mbH for Deutsche Börse AG – 2.3 – 4.0 – 6.3 – 10.7 – 1.0 – 1.0
Operation of the floor trading system by BrainTrade Gesellschaft für Börsensysteme mbH for Scoach Europa AG – 0.4 – 0.6 – 1.9 – 3.7 – 0.2 – 0.8
Money market transactions of Clearstream Banking S.A. with European Commodity Clearing AG1) – 1.0 0 – 2.1 0 – 129.92) 02)
Other transactions with associates – – – – 2.9 0.9
Total – 130.0 7.8
Other investors:
Office and administrative services by Eurex Zürich AG for SIX Swiss Exchange AG 8.2 7.5 25.5 16.4 1.7 2.5
Office and administrative services by SIX Swiss Exchange AG for Scoach Schweiz AG 0 – 2.6 – 2.4 – 7.8 0 0
Office and administrative services by SIX Swiss Exchange AG for Eurex Zürich AG – 2.2 – 1.4 – 5.6 – 5.2 – 1.3 – 0.6
Development of Eurex software by Deutsche Börse Systems AG for SIX Swiss Exchange AG 1.4 1.5 4.7 3.4 0.9 0.5
Office and administrative services by SIX Swiss Exchange AG for Eurex Frankfurt AG – 1.2 – 1.8 – 5.2 – 1.4 – 0.4 – 0.7
Transfer of revenue from Eurex fees by Eurex Zürich AG to SIX Swiss Exchange AG n.a.3) n.a.3) n.a.3) n.a.3) – 15.0 – 10.8
Other transactions with other investors – – – – – 1.0 0.4
Total – 15.1 – 8.7
1) European Commodity Clearing AG is a subsidiary of European Energy Exchange AG,
which is classified as an associate and accounted for using the equity method.
2) Contained in “liabilities from banking business”
3) Transfer not recognized in the consolidated income statement

26 Group Management Report Financial Statements Notes
8. Employees
Employees Quarter ended Nine months ended
30 Sep. 2008 30 Sep. 2007 30 Sep. 2008 30 Sep. 2007
Average number of employees during the period 3,349 3,026 3,322 3,002
Employed as at the balance sheet date 3,366 3,036 3,366 3,036
thereof Deutsche Börse Group without ISE 3,122 – 3,122 –
thereof ISE subgroup 244 – 244 –
There was an average of 3,113 full-time equivalent (FTE) employees during the third quarter of 2008 (Q3/2007: 2,826). Frankfurt/Main, 4 November 2008 Deutsche Börse AG The Executive Board
Reto Francioni Andreas Preuß Thomas Eichelmann
Frank Gerstenschläger Michael Kuhn Jeffrey Tessler

Contact Investor Relations Phone +49-(0) 69-2 11-1 16 70 Fax +49-(0) 69-2 11-1 46 08 E-mail [email protected] www.deutsche-boerse.com/ir_e Additional copies of this interim report and the 2007 annual report may be obtained from the publications hotline of Deutsche Börse Group. Phone +49-(0) 69-2 11- 1 15 10 Fax +49-(0) 69- 2 11- 1 15 11 Downloads at www.deutsche-boerse.com Reproduction – in whole or in part – only with the written permission of the publisher Registered trademarks CEF®, DAX®, Eurex®, Euro GC Pooling®, FWB®, TecDAX®, TRICE®, Xetra®, Xetra-Gold® and XTF Exchange Traded Funds® are registered trademarks of Deutsche Börse AG. CFF® is a registered trademark of Clearstream International S.A. Dow Jones STOXX® and Dow Jones EURO STOXX 50® are registered trademarks of STOXX Ltd.

Published byDeutsche Börse AG60485 Frankfurt/MainGermanywww.deutsche-boerse.com
November 2008Order number 1010-2736
DtB_ZB_01-08_01_neu:Layout 1 29.10.2008 15:57 Uhr Seite 4