Quantity versus Quality: The Value Relevance of CSR ...
26
1 Quantity versus Quality: The Value Relevance of CSR Disclosure of Saudi Companies Khaleed Alotaibi PhD Candidate Plymouth University [email protected] Shaqra University, Saudi Arabia [email protected] Khaled Hussainey* Professor of Accounting Plymouth University [email protected] * Correspondence should be addressed to Professor Khaled Hussainey, 405H Cookworthy Building, Plymouth Business School, Plymouth University, Plymouth PL4 8AA, United Kingdom.
Transcript of Quantity versus Quality: The Value Relevance of CSR ...
1
Quantity versus Quality: The Value Relevance of CSR Disclosure of Saudi Companies
Khaleed Alotaibi
PhD Candidate
Plymouth University
Shaqra University, Saudi Arabia
Khaled Hussainey*
Professor of Accounting
Plymouth University
* Correspondence should be addressed to Professor Khaled Hussainey, 405H Cookworthy
Building, Plymouth Business School, Plymouth University, Plymouth PL4 8AA, United
Kingdom.
2
Abstract
We offer a novel contribution by examining the impact of Corporate Social
Responsibility (CSR) disclosure quantity and quality on firm value. We use a sample of 171
non-financial firms listed in the Saudi stock market for the period 2013-2014. We complement
and extend the work of Hasseldine, Salama and Toms (2005) by measuring the quantity and
quality of CSR disclosure and examining their impact on firm value. To measure CSR
disclosure quality, we following Beest el al (2009) and capture all qualitative attributes of
information quality as defined in the conceptual framework of the IASB (2010 a). We use a
CSR disclosure index to measure the quantity of disclosure.
Our analysis shows a positive association between CSR disclosure quality and quantity
and market capitalisation. However, we did not find the same results when we use either
Tobin’s Q or Return on Assets (ROA) as proxies for firm value. This suggests that both CSR
disclosure quantity and quality have the same impact on firm value. However, the significance
of this impact depends on whether the authors use market capitalisation, Tobin’s Q or ROA.
Keywords: Corporate Social Responsibility; Disclosure Quantity versus Quality; Firm Value;
Saudi Arabia
1- INTRODUCTION
3
Corporate Social Responsibility (CSR) disclosure quantity and quality have attracted
major interest in accounting literature since the publication of a remarkable paper by
Hasseldine, Salama and Toms (2005). Using a subjective measure of environmental disclosure
quality, Hasseldine et al (2005:231) offer the first empirical evidence that the “quality of
environmental disclosure rather than mere quantity has a stronger effect on the creation of
environmental reputation amongst executive and investor stakeholder groups. They suggest
that further investigation on the impact of CSR disclosure strategy and stock market value
could be extremely useful in understanding the relevance of CSR disclosure quantity and
quality. Our study aims to examine this important research issue.
In a recent study, Zahller, Arnold and Roberts (2015:155) provide evidence that “when
CSR disclosures are higher quality, investors perceive organizational legitimacy to be higher,
inferring that organizations should emphasize quantifiable, consistent, and comparable
reporting”. This implies that “high-quality voluntary CSR disclosure can help protect
organizational financial market performance following an exogenous shock through the
disclosure’s effect on perceived legitimacy” (Zahller et al, 2015:174). Therefore, we expect
that CSR quality should have a positive impact on firm value.
Zahller, et al (2015:174) consider two characteristics of information quality (the
accuracy and completeness of CSR information) when measuring the quality of CSR disclosure.
They suggest further research to consider “the factors producing high-quality voluntary CSR
disclosures to understand how information characteristics interact with cognitive, affective,
and behavioral user characteristics in affecting organizational performance. Our study is a
response to Hasseldine et al (2005:231) and Zahller, et al (2015). We following Beest el al
(2009) and capture all qualitative characteristics of information quality as defined in the
conceptual framework of the IASB (2010). We use a CSR disclosure index to measure the
quantity of disclosure. We then examine the impact of CSR quantity and quality on firm value
in Saudi Arabia. Saudi Arabia provides a unique country context in which to analyse the impact
of CSR disclosure quantity and quality on firm value because of its emerging economy with
different religious, social and political systems and traditions. Daily life, business, law,
economics and political aspects of the Saudi society are affected by Islamic principles. In
addition, the country improved its corporate governance (CG) code in 2010. This strengthened
CG code requires companies to disclose their CSR activities in their annual reports. Moreover,
the code is affected by Islamic principles that have paved the way for the introduction of Islamic
governance characteristics (Albassam, 2014), and this is bound to affect the CSR disclosure of
Saudi Arabian companies.

4
The impact of CSR disclosure on firm values of Saudi Arabian companies has not been
thoroughly documented, although there are some studies that have investigated CSR in Saudi
Arabia (e.g.Habbash and Ibrahim, 2015; Mandurah et al., 2012). Furthermore, Nalband et al.
(2013) observed CSR perceptions, practices and performance of listed companies in Saudi
Arabia. Our study offers two major contributions. First, we offer a new measure for CSR
disclosure quality for one of the developing countries, Saudi Arabia. Second, we are the first
to examine the impact of the quantity and quality of CSR disclosure on firm values in Saudi
Arabia.
We find a positive relationship between CSR disclosure quality/ quantity and market
capitalisation. However, we did not find the same observation when we use either Tobin’s Q
or Return on Assets (ROA) as proxies for firm value. This suggests that both CSR disclosure
quantity and quality have the same impact on firm value. However, the significance of this
impact depends on whether the authors use market capitalisation, Tobin’s Q or ROA.
The remainder of the paper is organised as follows: Section 2 discusses theories,
Section 3 reviews the literature, Section 4 explains the research design, Section 5 reports the
results and Section 6 concludes the research.
2. THEORIES
There are many theories that explain the relationship between CSR disclosure and the
value of a company. We use the signalling and agency theories and the efficient market
hypotheses to explain the relationship between these variables.
2.1. Signalling and Agency Theories
Prior research shows that a company’s voluntary disclosure impacts its value based on
signalling theory (Sheu et al., 2010). The use of signalling theory explains why companies
disclose CSR information to their stakeholders (Uyar et al., 2012). It is argued that voluntary
disclosures in the annual report send signals to the marketplace that are expected to increase a
company’s net present value and consequently its stock market value (Gordon et al., 2010). In
addition, prior research (i.e. Sheu et al. 2010) shows that disclosure reduces the information
asymmetry between insiders (managers) and outsiders (stakeholders) and hence reduced
agency conflicts between both parties. This leads to an increase in firm value (Sheu et al. 2010).
2.2. Efficient Market Hypotheses (EMH)
According to the Efficient Market Hypothesis, CSR information is expected to be of
increased benefit to investors as this information may lead to positive or negative adjustments
in company security prices, thus affecting the value of a company (Jensen, 1978).

5
3. LITERATURE REVIEW
A limited number of studies examine the impact of disclosure on firm value (Uyar et
al., 2012). However, the results are mixed. For example, Hassan et al. (2009) find that
mandatory disclosure has a negative relationship with firm value while voluntary disclosure
has no impact on firm value. Da-Silva and Alves (2004); Sheu et al. (2010), Gordon et al.
(2010);; Curado et al. (2011) and Uyar and Kiliç (2012) find that voluntary disclosure impacts
firm value. In a recent paper, Elzahar et al. (2015) find a weak positive relationship between
KPIs disclosure and firm value. Uyar and Kiliç (2012) noted that the relationship between
voluntary disclosure and a company’s value depends on the measure of a company’s value (e.g.,
market to book value and market capitalisation).
Limited literature examines the value relevance of CSR disclosure. Cho, Lee, and Pfeiffer
(2013) investigated the relationship between CSR performance and information asymmetry. They
found that CSR performance is inversely related to information asymmetry. The association,
however, can be found only in companies that have less institutional investors, implying that fully
informed investors are bound to act upon information relating to CSR performance. Richardson
et al. (2001) investigated the relationship between social disclosure and cost of equity capital.
They found a positive association between social disclosure and cost of equity capital. Hussainey
and Salama (2010) also provide evidence that higher levels of corporate environmental reporting
scores improve investors’ ability to anticipate future earnings. Ulmann (1985) argued that firms
use social disclosures in order to manage relationships with their stakeholders. He suggested that
social disclosure is a function of three dimensions: stakeholders’ power, strategic posture and
economic performance. Dhaliwal et al. (2011) found that firms that report non-financial social
responsibility information are more likely to raise larger amounts of equity capital in the two years
following the reporting, compared with non-reporting firms. From a signaling perspective,
managers seeking finance assistance may wish to send good signals to the investors and debt
holders. For investors, such communication is credible because managers making fraudulent
signals will be penalized (Hughes, 1986). This suggests that firm value might be lowered due to
investors’ negative expectations with regard to the financial consequences of social and
environmental aspects. Hasseldine et al.(2005) investigate the association between corporate
environmental disclosure and corporate environmental performance measured by the
environmental reputation. They find the quality of environmental disclosure more impact than the
quantity of disclosure on the environmental reputation. Elliot et al. (2014) they find that
association between CSR performance and investors’ estimates of fundamental value that can be
diminished by investors’ explicit valuation of CSR performance.

6
To the best of our knowledge, there is no prior research on the impact of CSR disclosure
quantity and quality on firm value (Habbash, and Ibrahim. 2015; Mondarah, et al. 2012),
particularly in Saudi Arabia. Therefore, this study attempts to investigate this issue. Based on the
above discussion and because of the mixed findings, we hypothesise that:
H1: There is an association between the quantity of CSR disclosure and firm value in Saudi
Arabia.
Agency and signalling theories suggested that disclosure quality should help in
correcting any firm mis-valuation. Both theories argued that disclosure quality should help in
in reducing asymmetric information among the stock market participants, as well as between
managers and investors. Therefore, firm value should be increasing as a result of disclosure
quality through either reducing its cost of capital or increasing the cash flow to its shareholders
or both (Elzahar et al, 2015). Prior research argues that there is little evidence on this research
stream to deduct a cohesive conclusion on the relationship between disclosure quality and firm
value (Hassan et al, 2009). In addition, Beattie et al. (2004: 233) argue that: “Researchers
investigating the determinants and consequences of disclosure quality could be wasting their
effort if the primary variable of interest Disclosure is not being measured with a sufficient
degree of accuracy”. Also, Beyer et al. (2010:311) review prior research different proxies for
disclosure quality and conclude that: “a sensible economic definition of voluntary disclosure/
financial reporting quality and direct derivation of measures from that definition is missing
from the literature. This lack of an underlying economic definition hinders our ability to draw
inferences from this work, and we recommend that future research address this issue”. In the
CSR literature, Hasseldine et al (2005:231) showed that the quality (not the quantity) is more
information for UK companies’ reputation. Zahller, Arnold and Roberts (2015) showed that
investors perceived organizational legitimacy to be higher for companies with higher levels of
CSR disclosure quality. Hence, we expect that CSR disclosure quality should positively affect
firm value. Therefore, we hypothesise that:
H2: There is a positive association between the quality of CSR disclosure and firm value in
Saudi Arabia.
4. RESEARCH DESIGN
4.1. Sample
The current study uses a sample of Annual Reports of Saudi Arabian non-financial
companies listed on the Saudi Stock Exchange over the period of 2013-2014. The period
7
chosen because it is close to the declaration of the Saudi governance code that included social
contributions. In addition, the study is based on the most recent company Annual Reports that
contain CSR disclosure. Moreover, non-financial companies are more likely to be utilised for
their social and environmental impact, which can have a major influence on a company’s
reputation (Brammer and Pavelin, 2008).
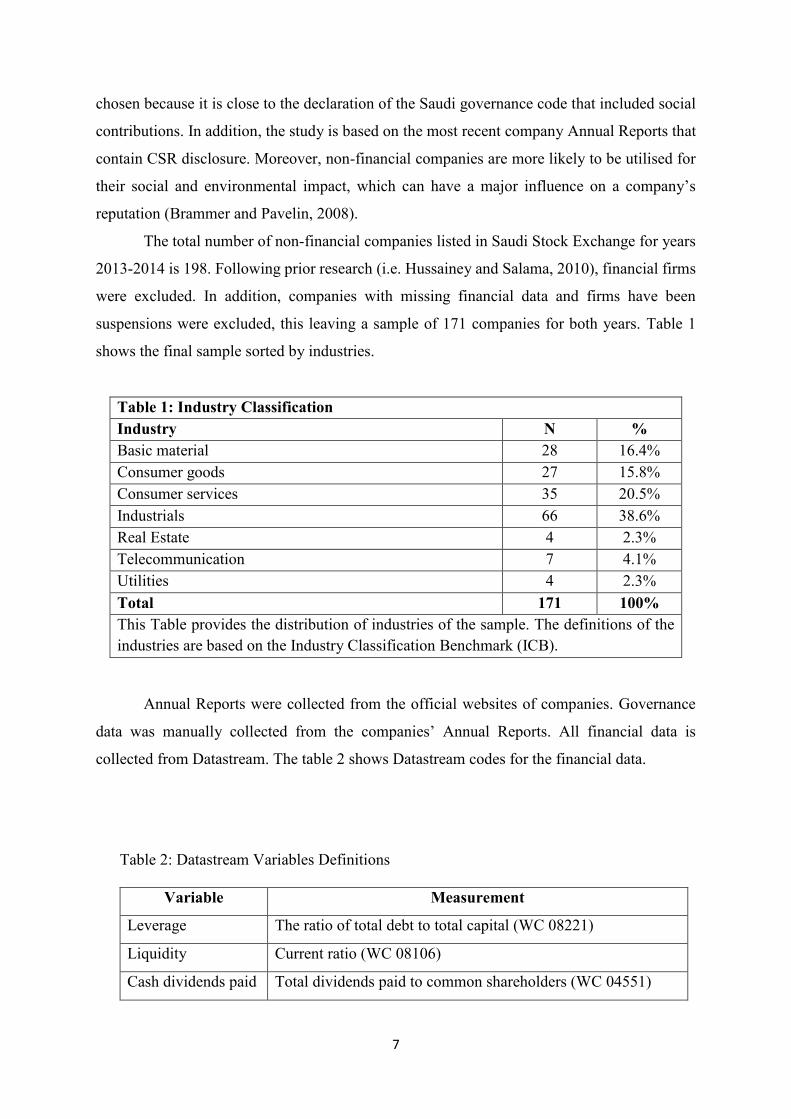
The total number of non-financial companies listed in Saudi Stock Exchange for years
2013-2014 is 198. Following prior research (i.e. Hussainey and Salama, 2010), financial firms
were excluded. In addition, companies with missing financial data and firms have been
suspensions were excluded, this leaving a sample of 171 companies for both years. Table 1
shows the final sample sorted by industries.
Table 1: Industry Classification
Industry N %
Basic material 28 16.4%
Consumer goods 27 15.8%
Consumer services 35 20.5%
Industrials 66 38.6%
Real Estate 4 2.3%
Telecommunication 7 4.1%
Utilities 4 2.3%
Total 171 100%
This Table provides the distribution of industries of the sample. The definitions of the
industries are based on the Industry Classification Benchmark (ICB).
Annual Reports were collected from the official websites of companies. Governance
data was manually collected from the companies’ Annual Reports. All financial data is
collected from Datastream. The table 2 shows Datastream codes for the financial data.
Table 2: Datastream Variables Definitions
Variable Measurement
Leverage The ratio of total debt to total capital (WC 08221)
Liquidity Current ratio (WC 08106)
Cash dividends paid Total dividends paid to common shareholders (WC 04551)
8
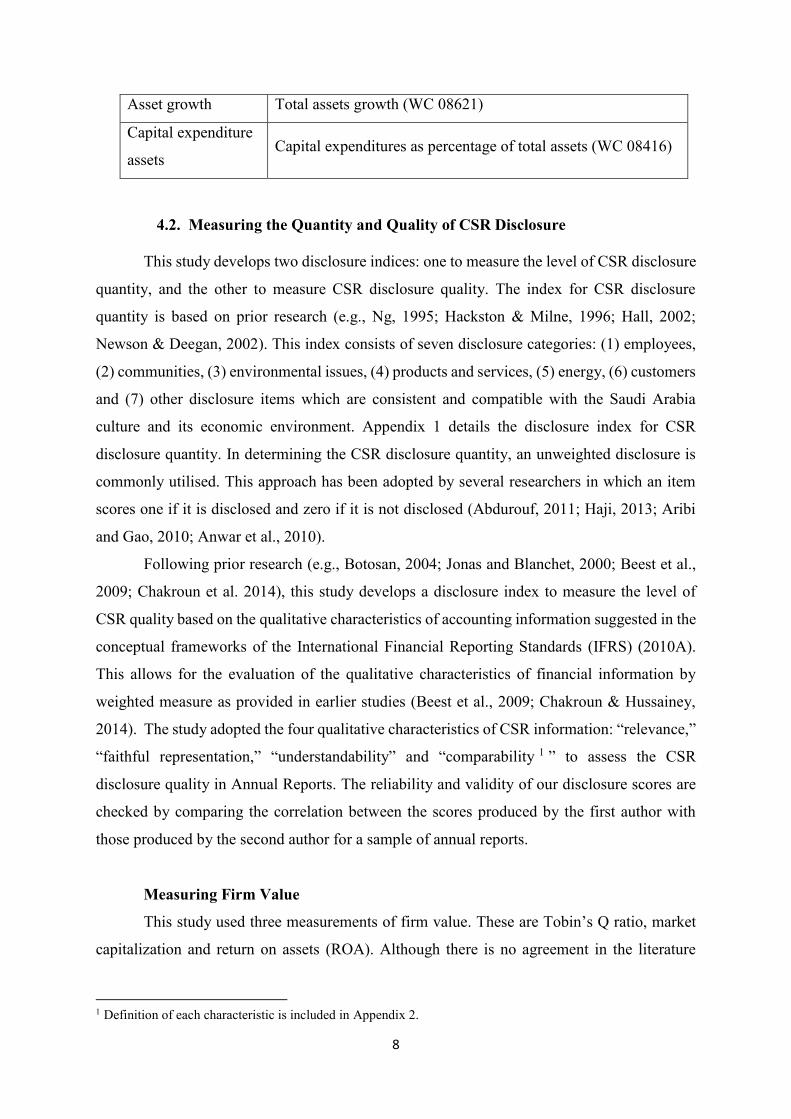
Asset growth Total assets growth (WC 08621)
Capital expenditure
assets Capital expenditures as percentage of total assets (WC 08416)
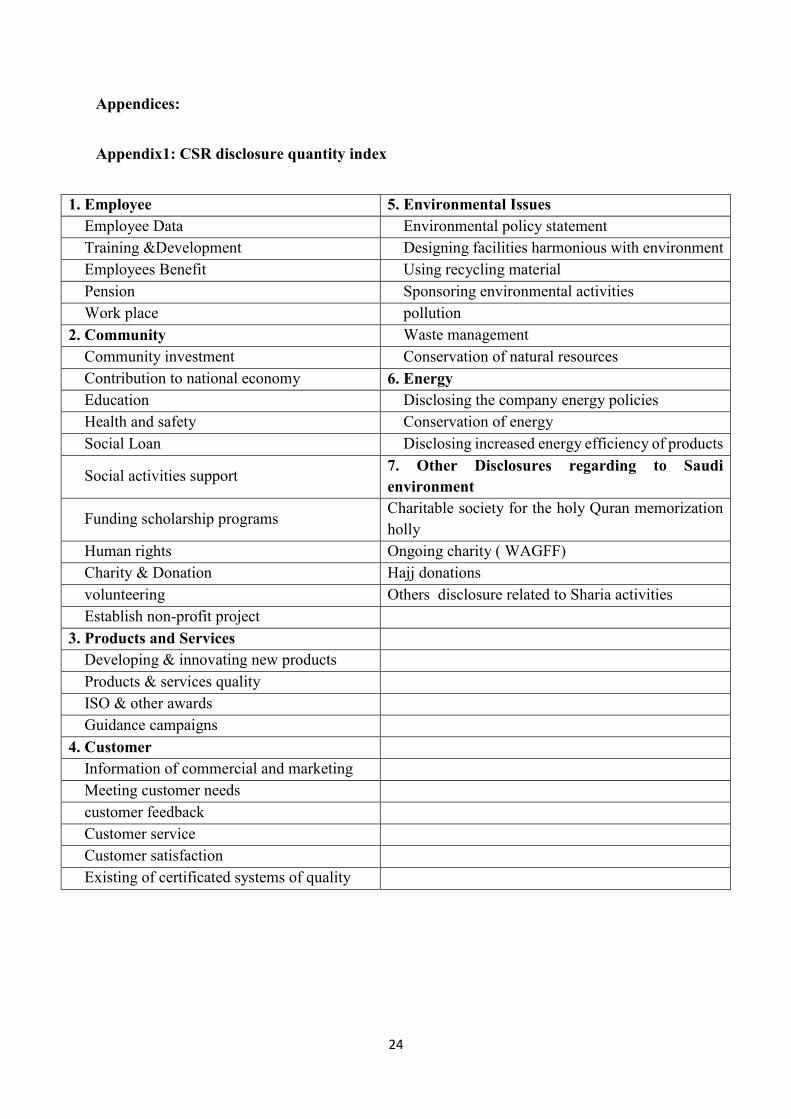
4.2. Measuring the Quantity and Quality of CSR Disclosure
This study develops two disclosure indices: one to measure the level of CSR disclosure
quantity, and the other to measure CSR disclosure quality. The index for CSR disclosure
quantity is based on prior research (e.g., Ng, 1995; Hackston & Milne, 1996; Hall, 2002;
Newson & Deegan, 2002). This index consists of seven disclosure categories: (1) employees,
(2) communities, (3) environmental issues, (4) products and services, (5) energy, (6) customers
and (7) other disclosure items which are consistent and compatible with the Saudi Arabia
culture and its economic environment. Appendix 1 details the disclosure index for CSR
disclosure quantity. In determining the CSR disclosure quantity, an unweighted disclosure is
commonly utilised. This approach has been adopted by several researchers in which an item
scores one if it is disclosed and zero if it is not disclosed (Abdurouf, 2011; Haji, 2013; Aribi
and Gao, 2010; Anwar et al., 2010).
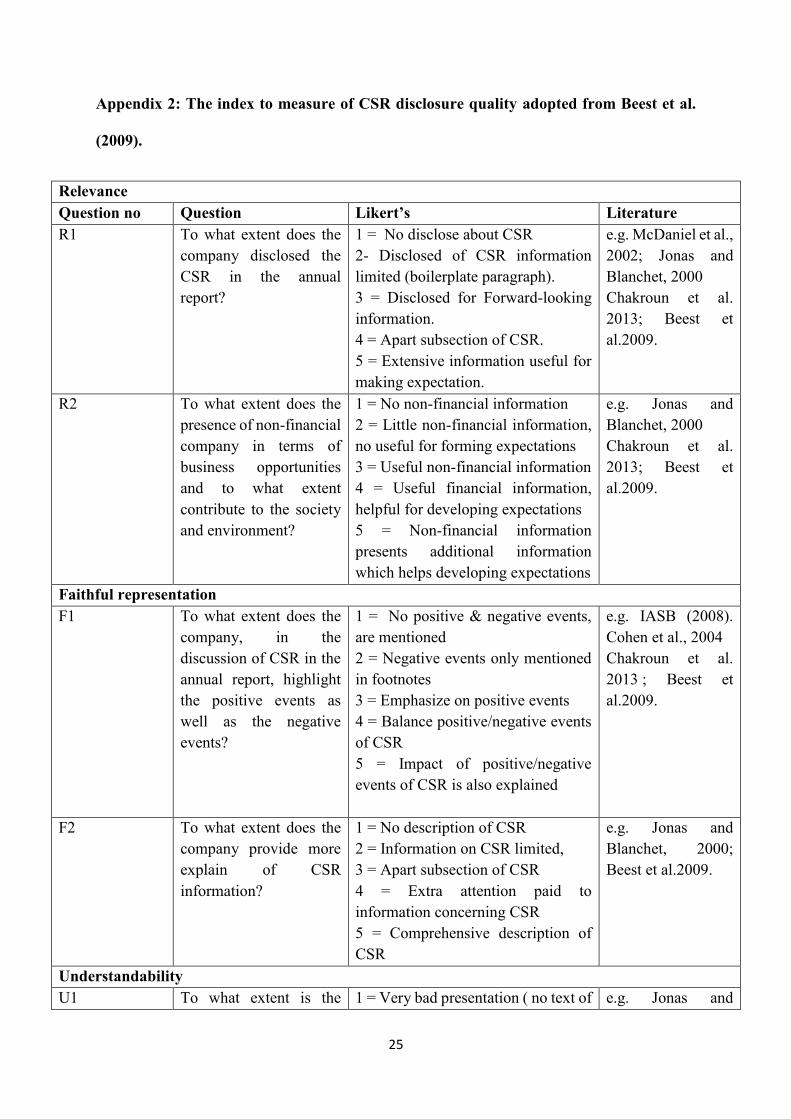
Following prior research (e.g., Botosan, 2004; Jonas and Blanchet, 2000; Beest et al.,
2009; Chakroun et al. 2014), this study develops a disclosure index to measure the level of
CSR quality based on the qualitative characteristics of accounting information suggested in the
conceptual frameworks of the International Financial Reporting Standards (IFRS) (2010A).
This allows for the evaluation of the qualitative characteristics of financial information by
weighted measure as provided in earlier studies (Beest et al., 2009; Chakroun & Hussainey,
2014). The study adopted the four qualitative characteristics of CSR information: “relevance,”
“faithful representation,” “understandability” and “comparability 1 ” to assess the CSR
disclosure quality in Annual Reports. The reliability and validity of our disclosure scores are
checked by comparing the correlation between the scores produced by the first author with
those produced by the second author for a sample of annual reports.
Measuring Firm Value
This study used three measurements of firm value. These are Tobin’s Q ratio, market
capitalization and return on assets (ROA). Although there is no agreement in the literature
1 Definition of each characteristic is included in Appendix 2.
9
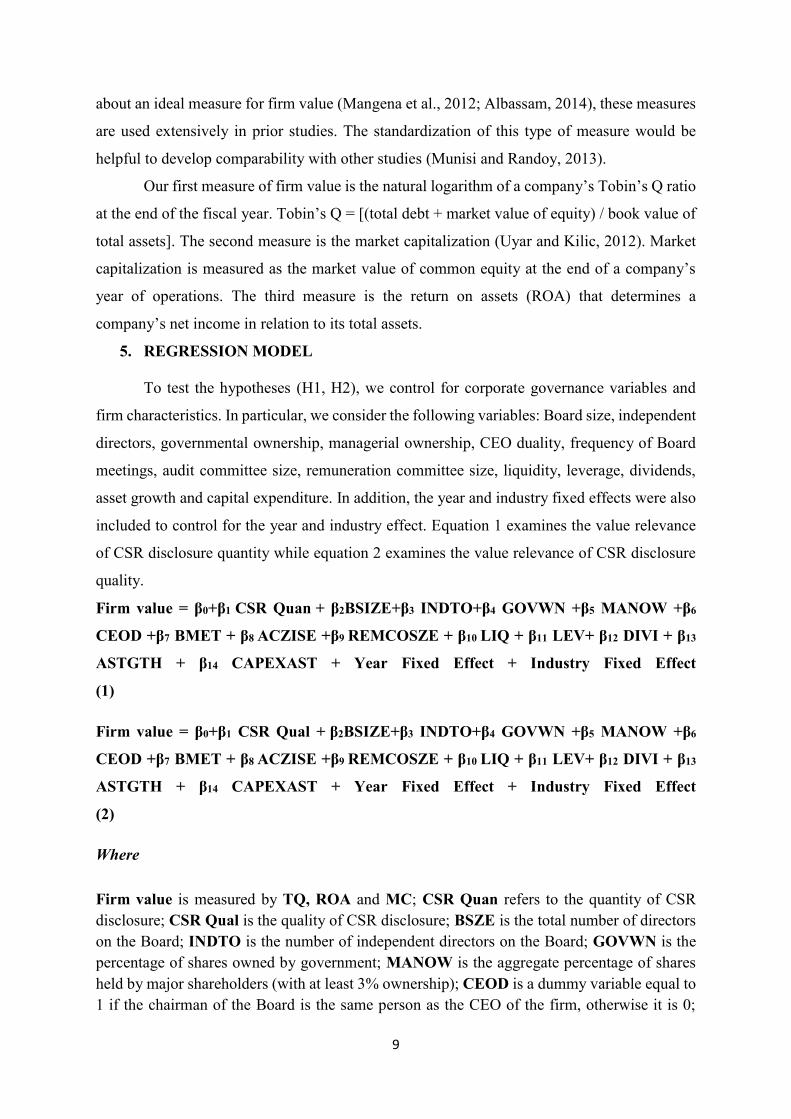
about an ideal measure for firm value (Mangena et al., 2012; Albassam, 2014), these measures
are used extensively in prior studies. The standardization of this type of measure would be
helpful to develop comparability with other studies (Munisi and Randoy, 2013).
Our first measure of firm value is the natural logarithm of a company’s Tobin’s Q ratio
at the end of the fiscal year. Tobin’s Q = [(total debt + market value of equity) / book value of
total assets]. The second measure is the market capitalization (Uyar and Kilic, 2012). Market
capitalization is measured as the market value of common equity at the end of a company’s
year of operations. The third measure is the return on assets (ROA) that determines a
company’s net income in relation to its total assets.
5. REGRESSION MODEL
To test the hypotheses (H1, H2), we control for corporate governance variables and
firm characteristics. In particular, we consider the following variables: Board size, independent
directors, governmental ownership, managerial ownership, CEO duality, frequency of Board
meetings, audit committee size, remuneration committee size, liquidity, leverage, dividends,
asset growth and capital expenditure. In addition, the year and industry fixed effects were also
included to control for the year and industry effect. Equation 1 examines the value relevance
of CSR disclosure quantity while equation 2 examines the value relevance of CSR disclosure
quality.
Firm value = β0+β1 CSR Quan + β2BSIZE+β3 INDTO+β4 GOVWN +β5 MANOW +β6
CEOD +β7 BMET + β8 ACZISE +β9 REMCOSZE + β10 LIQ + β11 LEV+ β12 DIVI + β13
ASTGTH + β14 CAPEXAST + Year Fixed Effect + Industry Fixed Effect
(1)
Firm value = β0+β1 CSR Qual + β2BSIZE+β3 INDTO+β4 GOVWN +β5 MANOW +β6
CEOD +β7 BMET + β8 ACZISE +β9 REMCOSZE + β10 LIQ + β11 LEV+ β12 DIVI + β13
ASTGTH + β14 CAPEXAST + Year Fixed Effect + Industry Fixed Effect
(2)
Where
Firm value is measured by TQ, ROA and MC; CSR Quan refers to the quantity of CSR
disclosure; CSR Qual is the quality of CSR disclosure; BSZE is the total number of directors
on the Board; INDTO is the number of independent directors on the Board; GOVWN is the
percentage of shares owned by government; MANOW is the aggregate percentage of shares
held by major shareholders (with at least 3% ownership); CEOD is a dummy variable equal to
1 if the chairman of the Board is the same person as the CEO of the firm, otherwise it is 0;

10
BMET is the total number of Board meetings during the year; ACSZE is the total number of
directors on the audit committee; REMCOSZE is the number of members of the firm
remuneration committee; LIQ is firm liquidity measured using the current ratio (current assets
/ current liabilities); LEV is firm leverage measured using the ratio of total liabilities to total
assets; DIVI is the total dividends paid to common shareholders; ASTGTH is firm asset
growth ratio; CAPEXAST is capital expenditure assets measured as capital expenditures as a
percentage of total assets.
5.1 Results
5.1.1 Descriptive Statistics
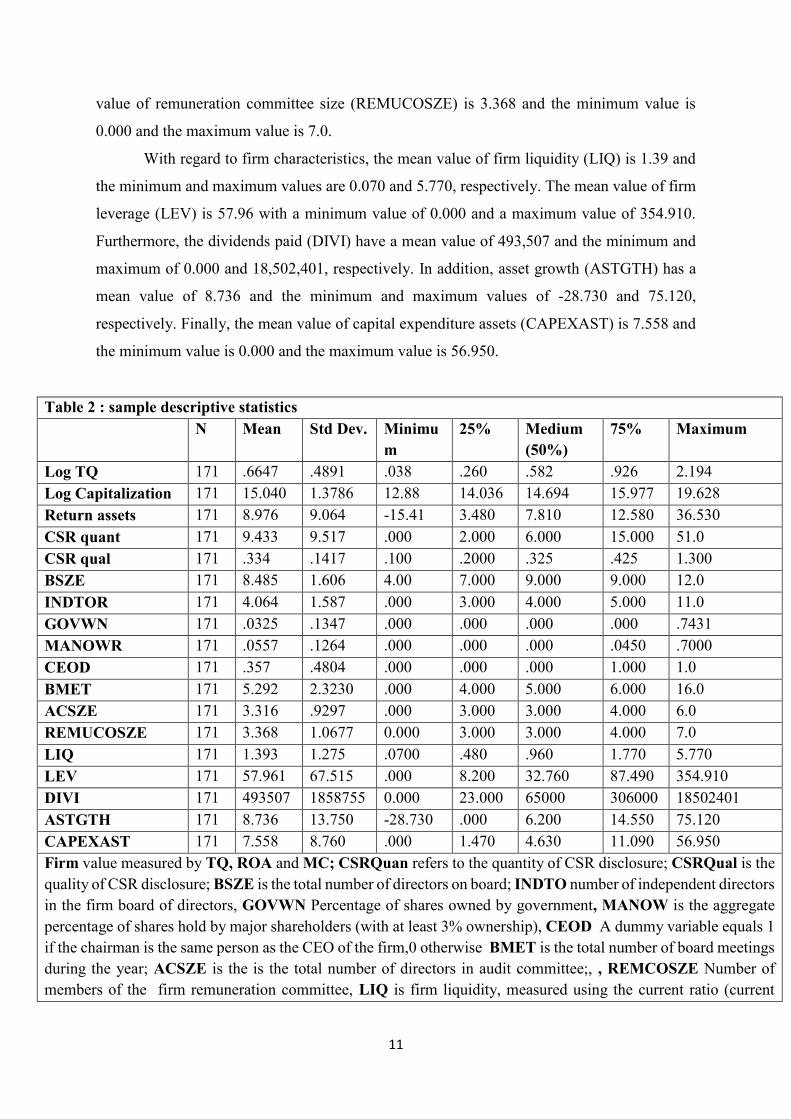
Table 2 shows the descriptive statistics of CSR disclosure quantity and quality on firm
value. The mean value of CSR disclosure quantity and quality is 9.433 and 0.334, respectively,
which reveals that the value of CSR disclosure quantity in Saudi Arabian firms is higher than
the value of CSR disclosure quality. In addition, the minimum and maximum values of CSR
disclosure quantity range from 0.000 to 51.00. However, the minimum and maximum values
of CSR disclosure quality range from 1.00 to 1.3.
Furthermore, this study uses three measurements (TQ, ROA and MC) to examine the
impact of CSR disclosure on value in Saudi Arabia firms. As result, the mean value of LogTQ
is 0.6647 and the minimum and maximum are 0.038 and 2.194, respectively. Moreover, the
mean value of ROA is 8.976, the maximum is 36.530 and the minimum is -15.41. The mean
value of MC is 15.040, whereas the minimum and maximum values are 12.88 and 19.628,
respectively.
In terms of governance mechanisms, the mean value of Board size (BSZE) is 8.485
with a minimum value of 4.0 and maximum value of 12.0. This means that the Board size of
Saudi Arabian firms ranges from 4-12 members. The mean value of the percentage of
independent directors (INDTOR) in the Board is 4.064 with a minimum value of 0.00 and a
maximum value of 11.0. In terms of ownership structure, the mean value of governmental
ownership (GOVWN) is 0.032 and minimum and maximum values are 0.000 and 0.743,
respectively. In addition, the mean value of managerial ownership (MANOWR) is 0.055 and
the minimum is 0.000 and the maximum is 0.700. The mean value of the role duality of CEO
(CEOD) is 0.357 with a minimum value of 0.000 and a maximum value of 1.0. The mean value
of Board meetings (BMET) is 5.292; whereas, the minimum value is 0.000, and the maximum
value is 16.0. The audit committee size (ACSZE) of Saudi Arabian firms has a mean value of
3.316 and its minimum value is 0.000 and its maximum value is 6.0. Furthermore, the mean
11
value of remuneration committee size (REMUCOSZE) is 3.368 and the minimum value is
0.000 and the maximum value is 7.0.
With regard to firm characteristics, the mean value of firm liquidity (LIQ) is 1.39 and
the minimum and maximum values are 0.070 and 5.770, respectively. The mean value of firm
leverage (LEV) is 57.96 with a minimum value of 0.000 and a maximum value of 354.910.
Furthermore, the dividends paid (DIVI) have a mean value of 493,507 and the minimum and
maximum of 0.000 and 18,502,401, respectively. In addition, asset growth (ASTGTH) has a
mean value of 8.736 and the minimum and maximum values of -28.730 and 75.120,
respectively. Finally, the mean value of capital expenditure assets (CAPEXAST) is 7.558 and
the minimum value is 0.000 and the maximum value is 56.950.
Table 2 : sample descriptive statistics
N Mean Std Dev. Minimu
m
25% Medium
(50%)
75% Maximum
Log TQ 171 .6647 .4891 .038 .260 .582 .926 2.194
Log Capitalization 171 15.040 1.3786 12.88 14.036 14.694 15.977 19.628
Return assets 171 8.976 9.064 -15.41 3.480 7.810 12.580 36.530
CSR quant 171 9.433 9.517 .000 2.000 6.000 15.000 51.0
CSR qual 171 .334 .1417 .100 .2000 .325 .425 1.300
BSZE 171 8.485 1.606 4.00 7.000 9.000 9.000 12.0
INDTOR 171 4.064 1.587 .000 3.000 4.000 5.000 11.0
GOVWN 171 .0325 .1347 .000 .000 .000 .000 .7431
MANOWR 171 .0557 .1264 .000 .000 .000 .0450 .7000
CEOD 171 .357 .4804 .000 .000 .000 1.000 1.0
BMET 171 5.292 2.3230 .000 4.000 5.000 6.000 16.0
ACSZE 171 3.316 .9297 .000 3.000 3.000 4.000 6.0
REMUCOSZE 171 3.368 1.0677 0.000 3.000 3.000 4.000 7.0
LIQ 171 1.393 1.275 .0700 .480 .960 1.770 5.770
LEV 171 57.961 67.515 .000 8.200 32.760 87.490 354.910
DIVI 171 493507 1858755 0.000 23.000 65000 306000 18502401
ASTGTH 171 8.736 13.750 -28.730 .000 6.200 14.550 75.120
CAPEXAST 171 7.558 8.760 .000 1.470 4.630 11.090 56.950
Firm value measured by TQ, ROA and MC; CSRQuan refers to the quantity of CSR disclosure; CSRQual is the
quality of CSR disclosure; BSZE is the total number of directors on board; INDTO number of independent directors
in the firm board of directors, GOVWN Percentage of shares owned by government, MANOW is the aggregate
percentage of shares hold by major shareholders (with at least 3% ownership), CEOD A dummy variable equals 1
if the chairman is the same person as the CEO of the firm,0 otherwise BMET is the total number of board meetings
during the year; ACSZE is the is the total number of directors in audit committee;, , REMCOSZE Number of
members of the firm remuneration committee, LIQ is firm liquidity, measured using the current ratio (current

12
assets / current liabilities); LEV is firm leverage, measured using the ratio of total liabilities to total assets, DIVI
Total dividends paid to common shareholders. ASTGTH is firm Assets growth ratio, CAPEXAST is capital
expenditures assets, measured by Capital expenditures as percentage of total assets.
***, **, * indicate significance at .001, .05 & .1 level.
This table provides the descriptive statistics of CSR disclosure quantity and quality, in addition to explanatory
variables.
5.1.2 Correlation Analysis
Gujarati and Porter (2009) show that variables have high correlation if the correlation
is higher than 0.80, and thus conclude that multi-collinearity among variables is acceptable if
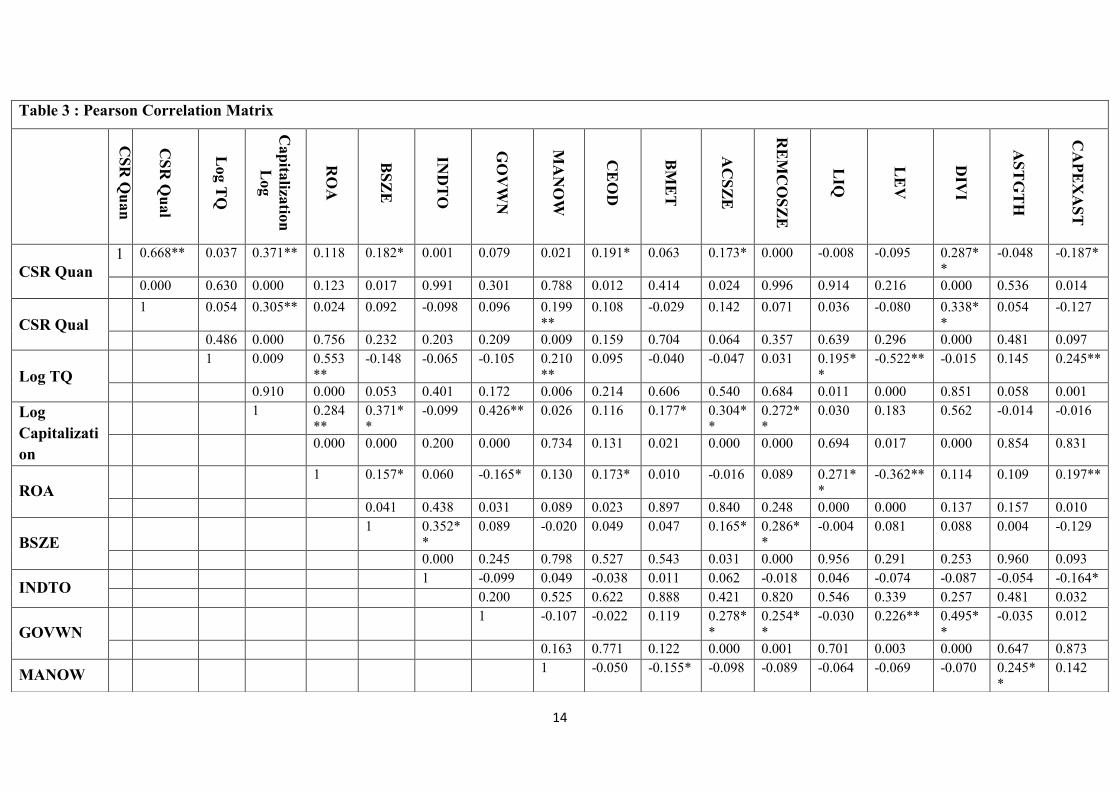
the correlation coefficients are less than 0.80. Table 3 shows the Pearson correlation. It shows
that correlations are relatively low (less than 0.80) among all variables which indicate that there
is no multi-collinearity problem.
An additional check for multi–collinearity was performed by calculating the Variance
Inflation Factor (VIF) after each regression model. Earlier research has stipulated that if the
VIF value is more than 10, then there is certain to be a multi-collinearity problem. The mean
and maximum values of the VIF investigations were formulated with the regression results to
show that there is no need to be concerned with this problem (Field, 2009).
Table 3 shows that CSR disclosure quantity is positively correlated with market
capitalization at 0.371 (5% significance level). However, there is no correlation between CSR
disclosure quantity and the other measurements. It provides evidence that CSR disclosure
quantity is statistically correlated positively with some corporate governance variables such as
BSZE at 0.182 (10% significance level), CEO duality at 0.191 (10% significance level),
ACSZE at 0.173 (10% significance level), and correlated positively and negatively with firm
characteristics, such as dividends paid at 0.287 (5% significance level) and CAPEXAST at -
0.187 (10% significance level).
In addition, the CSR disclosure quality is associated positively with market
capitalization at 0.305 (5% significance level). However, there is no correlation with the two
other measurements. Table 3 shows that it is correlated with one variable of corporate
governance, such as managerial ownership at 0.199 (5% significance level), and with firm
characteristics, such as dividends paid at 0.338 (5% significance level).
Moreover, the Pearson correlation matrix indicates a significant association between
CSR disclosure quantity and quality with some firm characteristic variables. This study finds
13
that there is a positive relationship between CSR disclosure quantity and quality and both are
significantly correlated with dividends paid at 0.287 and 0.338, respectively (5% significance
level).
This result is consistent with prior research, such as Elliott, Jackson, Peecher and White
(2014), who show that CSR disclosure is negatively associated with firm value. According to
Klein et al. (2005), firm value rises with greater corporate governance disclosure, thus we
suppose that voluntary disclosure has a positive impact on the firm value. Previous studies
(Sheu et al., 2010; Gordon et al., 2010) pointed out that voluntary disclosure has an impact on
firm value based on the signalling theory. Consequently, more disclosure signals give a better
governance mechanism and reduce agency conflicts.
14
Table 3 : Pearson Correlation Matrix
CS
R Q
uan
CS
R Q
ual
Log
TQ
Log
Cap
italiza
tion
RO
A
BS
ZE
IND
TO
GO
VW
N
MA
NO
W
CE
OD
BM
ET
AC
SZ
E
RE
MC
OS
ZE
LIQ
LE
V
DIV
I
AS
TG
TH
CA
PE
XA
ST
CSR Quan
1 0.668** 0.037 0.371** 0.118 0.182* 0.001 0.079 0.021 0.191* 0.063 0.173* 0.000 -0.008 -0.095 0.287*
*
-0.048 -0.187*
0.000 0.630 0.000 0.123 0.017 0.991 0.301 0.788 0.012 0.414 0.024 0.996 0.914 0.216 0.000 0.536 0.014
CSR Qual 1 0.054 0.305** 0.024 0.092 -0.098 0.096 0.199
**
0.108 -0.029 0.142 0.071 0.036 -0.080 0.338*
*
0.054 -0.127
0.486 0.000 0.756 0.232 0.203 0.209 0.009 0.159 0.704 0.064 0.357 0.639 0.296 0.000 0.481 0.097
Log TQ 1 0.009 0.553
**
-0.148 -0.065 -0.105 0.210
**
0.095 -0.040 -0.047 0.031 0.195*
*
-0.522** -0.015 0.145 0.245**
0.910 0.000 0.053 0.401 0.172 0.006 0.214 0.606 0.540 0.684 0.011 0.000 0.851 0.058 0.001
Log
Capitalizati
on
1 0.284
**
0.371*
*
-0.099 0.426** 0.026 0.116 0.177* 0.304*
*
0.272*
*
0.030 0.183 0.562 -0.014 -0.016
0.000 0.000 0.200 0.000 0.734 0.131 0.021 0.000 0.000 0.694 0.017 0.000 0.854 0.831
ROA 1 0.157* 0.060 -0.165* 0.130 0.173* 0.010 -0.016 0.089 0.271*
*
-0.362** 0.114 0.109 0.197**
0.041 0.438 0.031 0.089 0.023 0.897 0.840 0.248 0.000 0.000 0.137 0.157 0.010
BSZE 1 0.352*
*
0.089 -0.020 0.049 0.047 0.165* 0.286*
*
-0.004 0.081 0.088 0.004 -0.129
0.000 0.245 0.798 0.527 0.543 0.031 0.000 0.956 0.291 0.253 0.960 0.093
INDTO 1 -0.099 0.049 -0.038 0.011 0.062 -0.018 0.046 -0.074 -0.087 -0.054 -0.164*
0.200 0.525 0.622 0.888 0.421 0.820 0.546 0.339 0.257 0.481 0.032
GOVWN 1 -0.107 -0.022 0.119 0.278*
*
0.254*
*
-0.030 0.226** 0.495*
*
-0.035 0.012
0.163 0.771 0.122 0.000 0.001 0.701 0.003 0.000 0.647 0.873
MANOW 1 -0.050 -0.155* -0.098 -0.089 -0.064 -0.069 -0.070 0.245*
*
0.142

15
0.514 0.043 0.202 0.246 0.408 0.369 0.365 0.001 0.065
CEOD 1 -0.073 0.062 -0.017 -0.033 -0.147 0.177* 0.044 -0.135
0.343 0.418 0.826 0.670 0.055 0.021 0.563 0.077
BMET 1 0.172* 0.189* -0.113 -0.073 0.158* -0.203* 0.033
0.024 0.013 0.143 0.346 0.040 0.008 0.669
ACSZE 1 0.635*
*
0.001 0.121 0.216*
*
-
0.236** -0.133
0.000 0.986 0.116 0.004 0.002 0.082
REMCOSZ
E
1 -0.021 0.090 0.249*
*
-0.166* -0.049
0.786 0.241 0.001 0.030 0.526
LIQ 1 -0.301* 0.122 0.009 -0.143
0.000 0.111 0.906 0.063
LEV 1 -0.060 -0.069 -0.129
0.437 0.373 0.094
DIVI 1 -0.114 -0.042
0.138 0.584
ASTGTH 1 0.339**
0.000
CAPEXAS
T
1
Firm value measured by TQ, ROA and MC; CSR Quan refers to the quantity of CSR disclosure; CSR Qual is the quality of CSR disclosure; BSZE is the total number
of directors on the Board; INDTO is the number of independent directors on the Board of Directors; GOVWN is the percentage of shares owned by government; MANOW
is the aggregate percentage of shares held by major shareholders (with at least 3% ownership); CEOD is a dummy variable equal to 1 if the chairman of the Board is the
same person as the CEO of the firm, otherwise it is 0; BMET is the total number of Board meetings during the year; ACSZE is the total number of directors on the audit
committee; REMCOSZE is the number of members of the firm remuneration committee; LIQ is firm liquidity measured using the current ratio (current assets / current
liabilities); LEV is firm leverage measured using the ratio of total liabilities to total assets; DIVI is the total dividends paid to common shareholders; ASTGTH is firm
asset growth ratio; CAPEXAST is capital expenditure assets measured as capital expenditures as a percentage of total assets.
This table provides the Pearson correlation of CSR disclosure quantity and quality, in addition to explanatory variables.

16
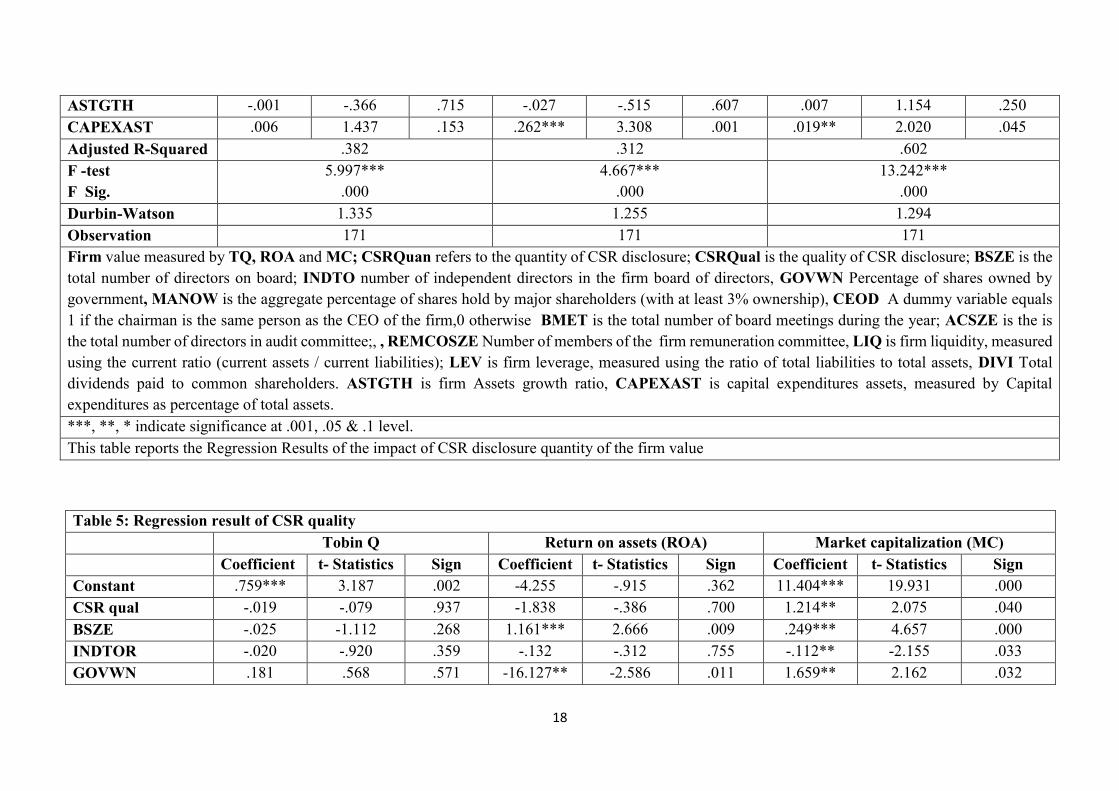
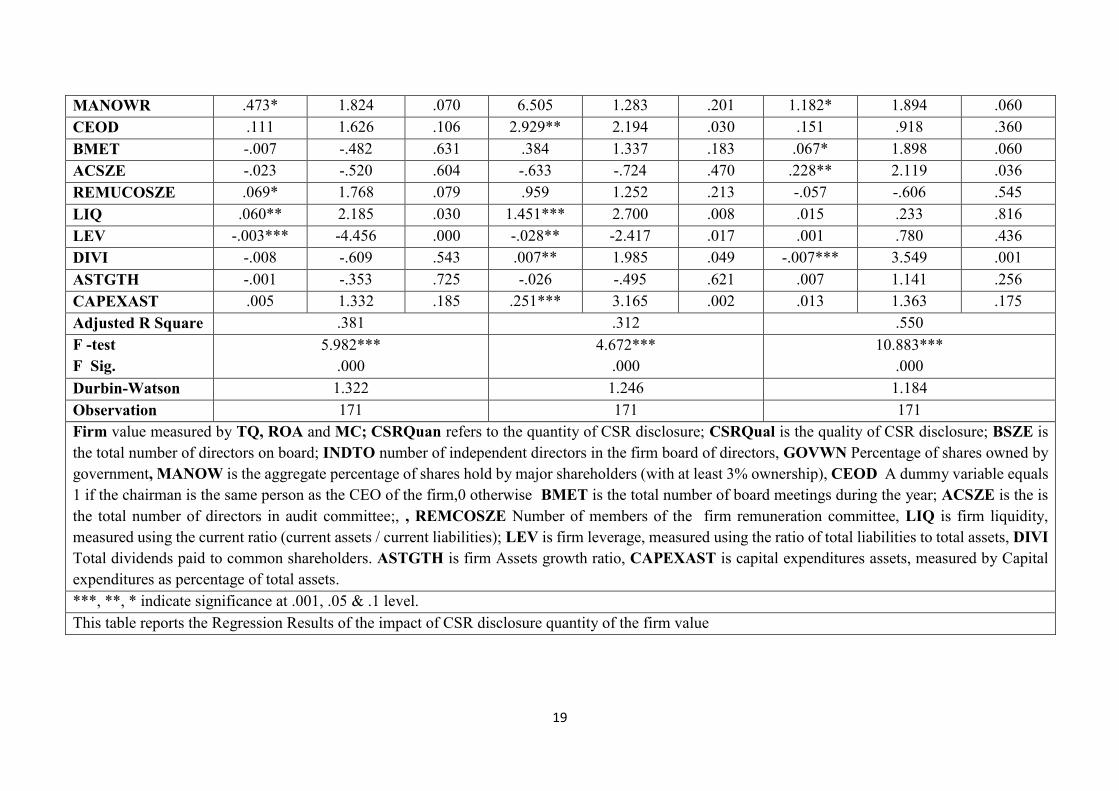
5.3 Regression Results
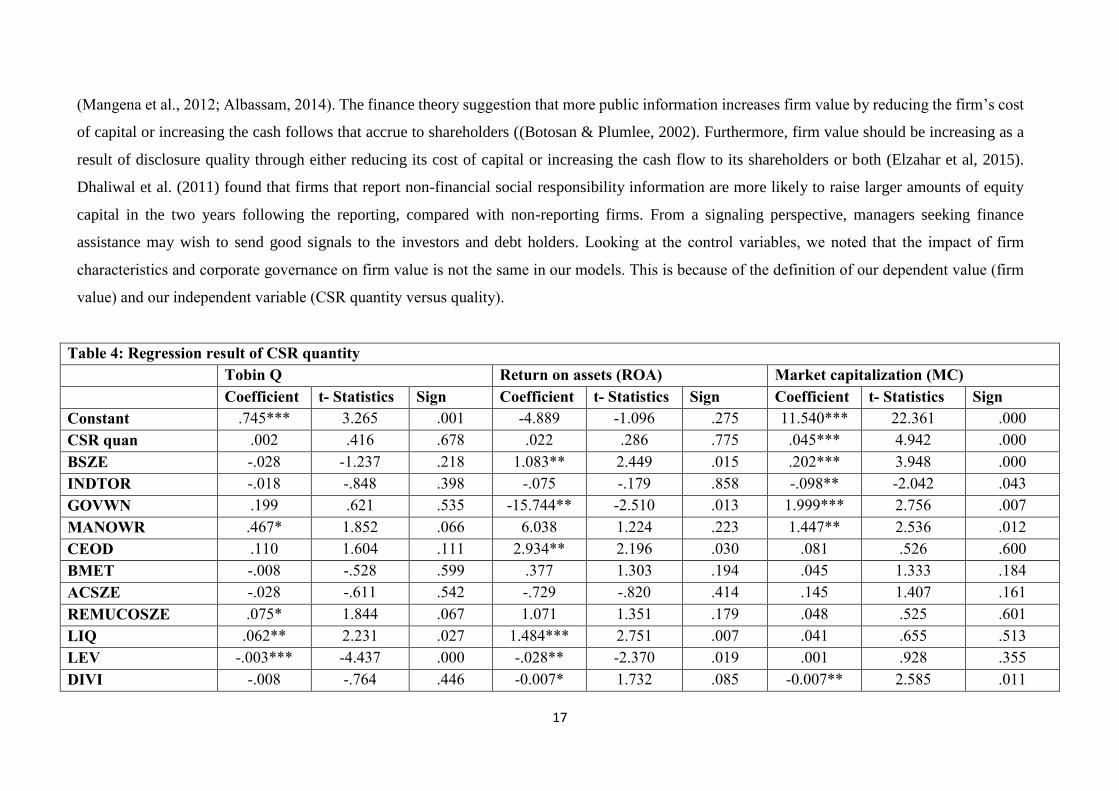
Tables 4 and 5 show the results of OLS regression analyses. Table 4 shows the results of the value relevance of CSR disclosure quantity
(Model 1), while, Table 5 reports the results of the value relevance of CSR disclosure quality (Model 2).
The regression tables show that F-values of Model 1 are 5.997; 4.667 and 13.242 for Tobin’s Q model (TQ), return on assets (ROA) model
and the market capitalisation (MC) model, respectively. F-values of Model 2 are 5.982; 4.672, and 10.883 for TQ; ROA and MC models, respectively.
These values indicate that both Models 1 and 2 are statistically significant. Moreover, the adjusted R-Squared of Model 1 for the three measurements
(TQ, ROA, MC) are 0.382, 312 and 0.602, respectively. Adjusted R-Squared of Model 2 are 0.381, 0.312 and 550, respectively for TQ, ROA and
MC models.
In terms of CSR disclosure, there is a significant positive association between CSR quantity and firm value proxied by market capitalization
(MC) at a 1% level of significance. However, the CSR disclosure quantity is not statistically significant with Tobin’s Q ratio or ROA at any level of
significance. Regarding CSR disclosure quality, there is a significant positive relationship between CSR disclosure and firm value measured by
market capitalization (MC) at a 5% level of significance. On the other hand, there is no statistical significance with Tobin’s Q or ROA at any level of
significance. Our analysis shows a positive association between CSR disclosure quality and quantity and market capitalization. However, we did not
find the same results when we use either Tobin’s Q or Return on Assets (ROA) as proxies for firm value. This suggests that both CSR disclosure
quantity and quality have the same impact on firm value. However, the significance of this impact depends on whether the authors use market
capitalisation, Tobin’s Q or ROA. Therefore, it is not safe to accept H1 and H2.
Prior research (e.g. Hassan et al. 2009) finds that voluntary disclosure has a positive but insignificant association with firm value. On the other
hands, the result shows that the mandatory disclosure has a negative association with firm value and highly significant. Dybvig & Warachka (2015)
argued that Tobin’s Q does not measure firm performance and it provides the two new measures for the firm value which are efficiency measure and
assesses cost discipline. Consequently, this shortage of statistical significance supports the view that there is a conflicts relationship of determining
the relationship between CSR disclosure and firm value. In addition, there is no agreement in the literature about an ideal measure for firm value
17
(Mangena et al., 2012; Albassam, 2014). The finance theory suggestion that more public information increases firm value by reducing the firm’s cost
of capital or increasing the cash follows that accrue to shareholders ((Botosan & Plumlee, 2002). Furthermore, firm value should be increasing as a
result of disclosure quality through either reducing its cost of capital or increasing the cash flow to its shareholders or both (Elzahar et al, 2015).
Dhaliwal et al. (2011) found that firms that report non-financial social responsibility information are more likely to raise larger amounts of equity
capital in the two years following the reporting, compared with non-reporting firms. From a signaling perspective, managers seeking finance
assistance may wish to send good signals to the investors and debt holders. Looking at the control variables, we noted that the impact of firm
characteristics and corporate governance on firm value is not the same in our models. This is because of the definition of our dependent value (firm
value) and our independent variable (CSR quantity versus quality).
Table 4: Regression result of CSR quantity
Tobin Q Return on assets (ROA) Market capitalization (MC)
Coefficient t- Statistics Sign Coefficient t- Statistics Sign Coefficient t- Statistics Sign
Constant .745*** 3.265 .001 -4.889 -1.096 .275 11.540*** 22.361 .000
CSR quan .002 .416 .678 .022 .286 .775 .045*** 4.942 .000
BSZE -.028 -1.237 .218 1.083** 2.449 .015 .202*** 3.948 .000
INDTOR -.018 -.848 .398 -.075 -.179 .858 -.098** -2.042 .043
GOVWN .199 .621 .535 -15.744** -2.510 .013 1.999*** 2.756 .007
MANOWR .467* 1.852 .066 6.038 1.224 .223 1.447** 2.536 .012
CEOD .110 1.604 .111 2.934** 2.196 .030 .081 .526 .600
BMET -.008 -.528 .599 .377 1.303 .194 .045 1.333 .184
ACSZE -.028 -.611 .542 -.729 -.820 .414 .145 1.407 .161
REMUCOSZE .075* 1.844 .067 1.071 1.351 .179 .048 .525 .601
LIQ .062** 2.231 .027 1.484*** 2.751 .007 .041 .655 .513
LEV -.003*** -4.437 .000 -.028** -2.370 .019 .001 .928 .355
DIVI -.008 -.764 .446 -0.007* 1.732 .085 -0.007** 2.585 .011
18
ASTGTH -.001 -.366 .715 -.027 -.515 .607 .007 1.154 .250
CAPEXAST .006 1.437 .153 .262*** 3.308 .001 .019** 2.020 .045
Adjusted R-Squared .382 .312 .602
F -test
F Sig.
5.997***
.000
4.667***
.000
13.242***
.000
Durbin-Watson 1.335 1.255 1.294
Observation 171 171 171
Firm value measured by TQ, ROA and MC; CSRQuan refers to the quantity of CSR disclosure; CSRQual is the quality of CSR disclosure; BSZE is the
total number of directors on board; INDTO number of independent directors in the firm board of directors, GOVWN Percentage of shares owned by
government, MANOW is the aggregate percentage of shares hold by major shareholders (with at least 3% ownership), CEOD A dummy variable equals
1 if the chairman is the same person as the CEO of the firm,0 otherwise BMET is the total number of board meetings during the year; ACSZE is the is
the total number of directors in audit committee;, , REMCOSZE Number of members of the firm remuneration committee, LIQ is firm liquidity, measured
using the current ratio (current assets / current liabilities); LEV is firm leverage, measured using the ratio of total liabilities to total assets, DIVI Total
dividends paid to common shareholders. ASTGTH is firm Assets growth ratio, CAPEXAST is capital expenditures assets, measured by Capital
expenditures as percentage of total assets.
***, **, * indicate significance at .001, .05 & .1 level.
This table reports the Regression Results of the impact of CSR disclosure quantity of the firm value
Table 5: Regression result of CSR quality
Tobin Q Return on assets (ROA) Market capitalization (MC)
Coefficient t- Statistics Sign Coefficient t- Statistics Sign Coefficient t- Statistics Sign
Constant .759*** 3.187 .002 -4.255 -.915 .362 11.404*** 19.931 .000
CSR qual -.019 -.079 .937 -1.838 -.386 .700 1.214** 2.075 .040
BSZE -.025 -1.112 .268 1.161*** 2.666 .009 .249*** 4.657 .000
INDTOR -.020 -.920 .359 -.132 -.312 .755 -.112** -2.155 .033
GOVWN .181 .568 .571 -16.127** -2.586 .011 1.659** 2.162 .032
19
MANOWR .473* 1.824 .070 6.505 1.283 .201 1.182* 1.894 .060
CEOD .111 1.626 .106 2.929** 2.194 .030 .151 .918 .360
BMET -.007 -.482 .631 .384 1.337 .183 .067* 1.898 .060
ACSZE -.023 -.520 .604 -.633 -.724 .470 .228** 2.119 .036
REMUCOSZE .069* 1.768 .079 .959 1.252 .213 -.057 -.606 .545
LIQ .060** 2.185 .030 1.451*** 2.700 .008 .015 .233 .816
LEV -.003*** -4.456 .000 -.028** -2.417 .017 .001 .780 .436
DIVI -.008 -.609 .543 .007** 1.985 .049 -.007*** 3.549 .001
ASTGTH -.001 -.353 .725 -.026 -.495 .621 .007 1.141 .256
CAPEXAST .005 1.332 .185 .251*** 3.165 .002 .013 1.363 .175
Adjusted R Square .381 .312 .550
F -test
F Sig.
5.982***
.000
4.672***
.000
10.883***
.000
Durbin-Watson 1.322 1.246 1.184
Observation 171 171 171
Firm value measured by TQ, ROA and MC; CSRQuan refers to the quantity of CSR disclosure; CSRQual is the quality of CSR disclosure; BSZE is
the total number of directors on board; INDTO number of independent directors in the firm board of directors, GOVWN Percentage of shares owned by
government, MANOW is the aggregate percentage of shares hold by major shareholders (with at least 3% ownership), CEOD A dummy variable equals
1 if the chairman is the same person as the CEO of the firm,0 otherwise BMET is the total number of board meetings during the year; ACSZE is the is
the total number of directors in audit committee;, , REMCOSZE Number of members of the firm remuneration committee, LIQ is firm liquidity,
measured using the current ratio (current assets / current liabilities); LEV is firm leverage, measured using the ratio of total liabilities to total assets, DIVI
Total dividends paid to common shareholders. ASTGTH is firm Assets growth ratio, CAPEXAST is capital expenditures assets, measured by Capital
expenditures as percentage of total assets.
***, **, * indicate significance at .001, .05 & .1 level.
This table reports the Regression Results of the impact of CSR disclosure quantity of the firm value
20
6- CONCLUSION
This study aims to examine the impact of quantity and quality of CSR disclosure on the
value of a firm. It uses a sample of Saudi Arabian, non-financial listed firms over the period of
2013-2014. It uses three measurements of firm value (Tobin’s Q, ROA and MC). The study
finds that both CSR disclosure quantity and quality are significantly associated with the firm
value measured by MC. However, both CSR disclosure quantity and quality are not
significantly associated with TQ and ROA as proxies of firm value.
This study offers important implications for the users of Annual Reports in Saudi
Arabia and for companies as well. This study finds evidence that the disclosure of CSR could
affect the value of firms. It is provides important implications for managers of Saudi firms by
encourage and pay more attention to the CSR activities in the firm’s operations and highlights
the importance of this type of disclosure to their firms.
The study has some limitations that could be considered as avenues for future research.
First, it focuses only on three measurements of firm value which are Tobin’s Q, return on assets
and market capitalisation. It would be interesting to use other measures for firm value, such as
scale efficiency measures, as suggested by Dybvig & Warachka (2015). Second, this study
focuses on the CSR disclosure of non-financial firms only. It would be interesting to examine
the association between CSR disclosure and firm value for financial companies. We finally
suggest that further research could examine the economic consequences of CSR disclosure
quantity versus quality by looking at the impact of disclosure on analysts’ forecasts; share price
anticipation of earnings and the cost of capital.
21
REFERENCES
Abdur Rouf, M.D & Al Harun, M. (2011). Ownership structure and voluntary disclosure in
annual reports of bangladesh. Pakistan Journal of Commerce and Social Sciences, 5(1), 129-
139.
Ahmed Haji, A. (2013). Corporate social responsibility disclosures over time: evidence from
Malaysia. Managerial auditing journal, 28(7), 647-676.
Albassam, W. (2014). Corporate governance, voluntary disclosure and financial performance:
an empirical analysis of Saudi listed firms using mixed-methods of research design. PhD Thesis.
University of Glasgow.
Anwar, S., Romansyah, D., Pramono, S. and Watanabe, K. (2010), “Treating return of
mudharabah time deposit as investment instrument”, Humanomics, Vol. 26 No. 4, pp. 296-309.
Aribi, Z. A., & Gao, S. (2010). Corporate social responsibility disclosure: A comparison
between Islamic and conventional financial institutions. Journal of Financial Reporting and
Accounting, 8(2), 72-91.
Beattie, V., McInnes, B., & Fearnley, S. (2004). A methodology for analysing and evaluating
narratives in annual reports: a comprehensive descriptive profile and metrics for disclosure
quality attributes. Accounting Forum 28, 205-236.
Beest, F. Braam, G. & Boelens, S. (2009). Quality of Financial Reporting: measuring
qualitative characteristics. Working paper, Radboud University Nijmegen.
Beyer, A., Cohen, D. A., Lys, T. Z., & Walther, B. R. (2010). The financial reporting
environment: Review of the recent literature. Journal of Accounting and Economics, 50(2),
296-343.
Botosan, C. A., & Plumlee, M. A. (2002). A re-examination of disclosure level and the
expected cost of equity capital. Journal of Accounting Research, 40(1), 21−40.
Botosan, C.A. 2004. “Discussion of A Framework for the Analysis of Firm Risk
Communication”. The International Journal of Accounting 39 (3): 289 – 295.
Brammer, S., & Pavelin, S. (2008). Factors influencing the quality of corporate environmental
disclosure. Business Strategy and the Environment, 17(2), 120-136.
Chakroun, R. and Hussainey, K. (2014). Disclosure quality in Tunisian annual
reports, Corporate Ownership and Control,11(4):58-80.
Cho, S. Y., Lee, C., & Pfeiffer, R. J. (2013). Corporate social responsibility performance and
information asymmetry. Journal of Accounting and Public Policy, 32(1), 71-83.
Cleary, S. (1999). The Relationship between Firm Investment and Financial Status. Journal of
Finance, 54(2), pp. 673-692.
Cohen, J., Krishnamoorthy, G., & Wright, A. (2004). The Corporate Governance Mosaic
and Financial Reporting Quality. Journal of Accounting Literature. 23. 87-152.
Curado, C., Henriques, L., & Bontis, N. (2011). Intellectual capital disclosure payback.
Management Decision, 49(7), 1080-1098.
Dhaliwal, D., Hogan, C., Trezevant, R., & Wilkins, M. (2011). Internal control disclosures,
monitoring, and the cost of debt. The Accounting Review, 86(4), 1131-1156.
Dybvigy, P., & Warachka, M. (2015). Tobin's Q does not measure firm performance: theory,
empirics, and alternatives. Working paper, Available:
http://papers.ssrn.com/sol3/papers.cfm?abstract_id=1562444.
Elliott, W., Jackson, K., Peecher, M., & White, B. (2014). The unintended effect of corporate
social responsibility performance on investors’ estimates of fundamental value. The
Accounting Review, 89(1), 275–302.
22
Elzahar, H., Hussainey, K., Mazzi, F., & Tsalavoutas, I. (2015). Economic consequences of
key performance indicators' disclosure quality. International Review of Financial Analysis,
39, 96-112.
Field, A., (2009). Discovering statistics using SPSS, London: Sage.
Gordon, L., Loeb, M., & Sohail, T. (2010). “Market value of voluntary disclosures concerning
information security”, MIS Quarterly, 34 (3), 567-94.
Gujarati D. N. and Porter D. C. (2009). Basic Econometrics (5th edition) New York. McGraw-
Hill.
Habbash, M. & Ibrahim, A. (2015) determinants of CSR disclosure from Saudi non-financial
listed firm. Journal of general administration, 75, (4). (Arabic).
Hackston, D., & Milne, M. J. (1996). Some determinants of social and environmental
disclosures in New Zealand companies. Accounting, Auditing & Accountability Journal, 9(1),
77-108.
Hall, J. A. (2002). An exploratory investigation into the corporate social disclosure of selected
New Zealand companies.
Hassan, O. A., Romilly, P., Giorgioni, G., & Power, D. (2009). The value relevance of
disclosure: Evidence from the emerging capital market of Egypt. The International Journal of
Accounting, 44(1), 79-102.
Hasseldine, J., Salama, A., & Toms, J. (2005). Quantity versus quality: the impact of
environmental disclosures on the reputations of UK Plcs. The British Accounting Review,
37(2), 231-248.
Hughes, P. J. (1986). Signalling by direct disclosure under asymmetric information. Journal
of Accounting and Economics, 8(2), 119-142.
Hussainey, K, & Salama A. (2010). The importance of corporate environmental reputation to
investors. Journal of Applied Accounting Research, 11(3), 229-241.
IASB (2008). Exposure Draft on an improved Conceptual Framework for Financial
Reporting: The Objective of Financial Reporting and Qualitative Characteristics of Decision-
useful Financial Reporting Information. London.
IASB (2010a). The conceptual framework for financial reporting.
IFRS (2010a). Practice statement, MC, A framework for presentation. International Financial
Reporting Standard, London: UK.
Jensen, M. C. (1978). Some anomalous evidence regarding market efficiency. Journal of
financial economics, 6(2), 95-101.
Jonas, G. J., & Blanchet, J. (2000). Assessing quality of financial reporting. Accounting
Horizons, 14(3), 353-363.
Jonas, G., & Blanchet, J. (2000). Assessing Quality of Financial Reporting. Accounting
Horizons, 14,( 3), 353-363.
Klein S., Astrachan J., & Smyrnios K. (2005). scale of family influence: construction,
validation, and further implication for theory. Entrep Theory Pract; 29, 38-321.
Mandurah, S. Khatib, J., & Al-Sabaan, S. (2012) 'Corporate Social Responsibility among
Saudi Arabian Firms: an Empirical Investigation', The Journal of Applied Business Research,
28 (5), 234-246.
Mangena, M., Tauringana, V., & Chamisa, E. (2012). Corporate boards, ownership structure
and firm performance in an environment of severe political and economic crisis. British Journal
of Management, 23(S1), S23-S41.
McDaniel, L., Martin, R. & Maines, L. (2002). Evaluating Financial Reporting Quality: the
Effects of Financial Expertise vs. Financial Literacy. The Accounting Review, 77, 139-167.
Mendes-Da-Silva, W., & Alves, L. (2004). Internet and Voluntary Disclosure: Firm Value
Effect Evidence. Paper presented at the Annual Information Technology Congress.
23
Munisi, G., & Randøy, T. (2013). Corporate governance and company performance across
Sub-Saharan African countries. Journal of Economics and Business, 70, 92-110.
Nalband, A, & Al-Amri, M. (2013). 'Corporate social responsibility perception, practices and
performance of listed companies of Kingdom of Saudi Arabia', International Business Journal,
23 (3), 284-295.
Newson, M., & Deegan, C. (2002). Global expectations and their association with corporate
social disclosure practices in Australia, Singapore, and South Korea. The International Journal
of Accounting, 37(2), 183-213.
Ng, L.W. (1985), “Social responsibility disclosures of selected New Zealand companies for
1981, 1982 and 1983”, Occasional Paper No 54, Massey University, Palmerston North.
Richardson, A. J., & Welker, M. (2001). Social disclosure, financial disclosure and the cost
of equity capital. Accounting, Organizations and Society, 26(7), 597-616.
Sheu, H. J., Chung, H., & Liu, C. L. (2010). Comprehensive disclosure of compensation and
firm value: The case of policy reforms in an emerging market. Journal of Business Finance &
Accounting, 37(9‐10), 1115-1144.
Ulmann, A. (1985). Data in search of a theory: a critical examination of the relationship
among social performance, social disclosure and economic performance. Academy of
management review, 10(3), 540-577.
Uyar, A., & Kiliç, M. (2012). Value relevance of voluntary disclosure: evidence from
Turkish firms. Journal of Intellectual Capital, 13(3), 363-376.
Zahller, K., Arnold, V., & Roberts, R. W. (2015). Using CSR Disclosure Quality to Develop
Social Resilience to Exogenous Shocks: A Test of Investor Perceptions. Behavioral Research
in Accounting.
24
Appendices:
Appendix1: CSR disclosure quantity index
1. Employee 5. Environmental Issues
Employee Data Environmental policy statement
Training &Development Designing facilities harmonious with environment
Employees Benefit Using recycling material
Pension Sponsoring environmental activities
Work place pollution
2. Community Waste management
Community investment Conservation of natural resources
Contribution to national economy 6. Energy
Education Disclosing the company energy policies
Health and safety Conservation of energy
Social Loan Disclosing increased energy efficiency of products
Social activities support 7. Other Disclosures regarding to Saudi
environment
Funding scholarship programs Charitable society for the holy Quran memorization
holly
Human rights Ongoing charity ( WAGFF)
Charity & Donation Hajj donations
volunteering Others disclosure related to Sharia activities
Establish non-profit project
3. Products and Services
Developing & innovating new products
Products & services quality
ISO & other awards
Guidance campaigns
4. Customer
Information of commercial and marketing
Meeting customer needs
customer feedback
Customer service
Customer satisfaction
Existing of certificated systems of quality
25
Appendix 2: The index to measure of CSR disclosure quality adopted from Beest et al.
(2009).
Relevance
Question no Question Likert’s Literature
R1 To what extent does the
company disclosed the
CSR in the annual
report?
1 = No disclose about CSR
2- Disclosed of CSR information
limited (boilerplate paragraph).
3 = Disclosed for Forward-looking
information.
4 = Apart subsection of CSR.
5 = Extensive information useful for
making expectation.
e.g. McDaniel et al.,
2002; Jonas and
Blanchet, 2000
Chakroun et al.
2013; Beest et
al.2009.
R2 To what extent does the
presence of non-financial
company in terms of
business opportunities
and to what extent
contribute to the society
and environment?
1 = No non-financial information
2 = Little non-financial information,
no useful for forming expectations
3 = Useful non-financial information
4 = Useful financial information,
helpful for developing expectations
5 = Non-financial information
presents additional information
which helps developing expectations
e.g. Jonas and
Blanchet, 2000
Chakroun et al.
2013; Beest et
al.2009.
Faithful representation
F1 To what extent does the
company, in the
discussion of CSR in the
annual report, highlight
the positive events as
well as the negative
events?
1 = No positive & negative events,
are mentioned
2 = Negative events only mentioned
in footnotes
3 = Emphasize on positive events
4 = Balance positive/negative events
of CSR
5 = Impact of positive/negative
events of CSR is also explained
e.g. IASB (2008).
Cohen et al., 2004
Chakroun et al.
2013 ; Beest et
al.2009.
F2 To what extent does the
company provide more
explain of CSR
information?
1 = No description of CSR
2 = Information on CSR limited,
3 = Apart subsection of CSR
4 = Extra attention paid to
information concerning CSR
5 = Comprehensive description of
CSR
e.g. Jonas and
Blanchet, 2000;
Beest et al.2009.
Understandability
U1 To what extent is the 1 = Very bad presentation ( no text of e.g. Jonas and
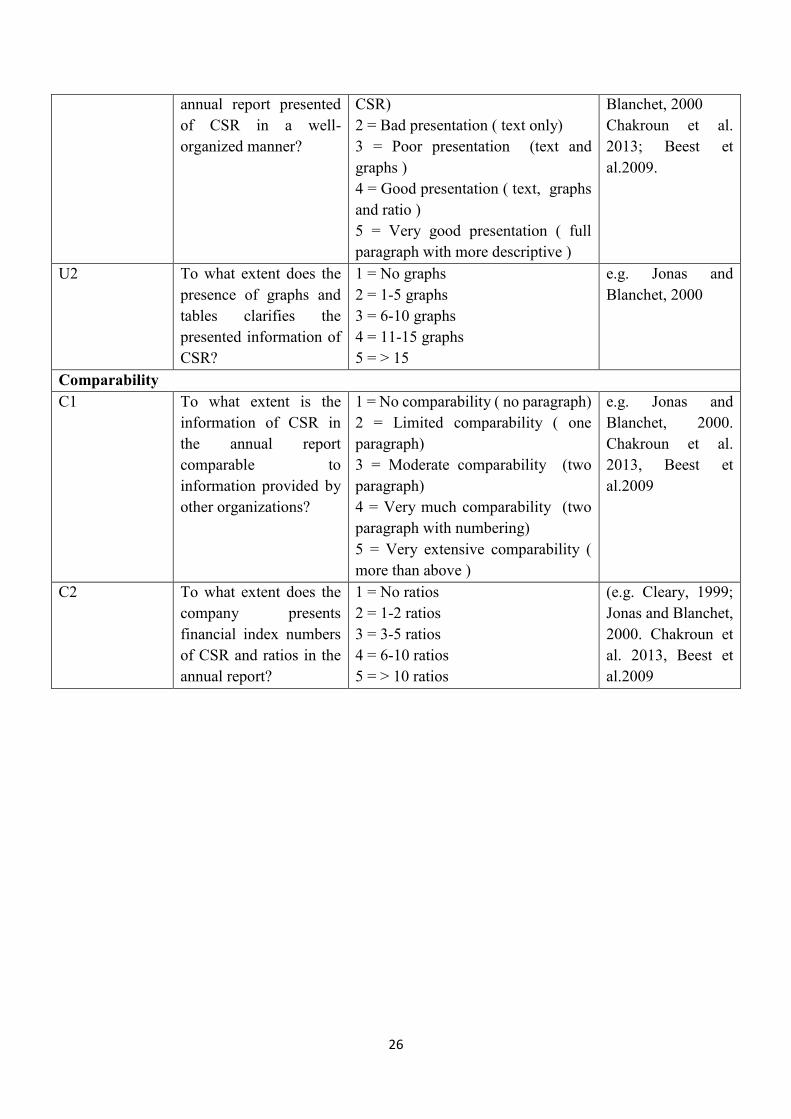
26
annual report presented
of CSR in a well-
organized manner?
CSR)
2 = Bad presentation ( text only)
3 = Poor presentation (text and
graphs )
4 = Good presentation ( text, graphs
and ratio )
5 = Very good presentation ( full
paragraph with more descriptive )
Blanchet, 2000
Chakroun et al.
2013; Beest et
al.2009.
U2 To what extent does the
presence of graphs and
tables clarifies the
presented information of
CSR?
1 = No graphs
2 = 1-5 graphs
3 = 6-10 graphs
4 = 11-15 graphs
5 = > 15
e.g. Jonas and
Blanchet, 2000
Comparability
C1 To what extent is the
information of CSR in
the annual report
comparable to
information provided by
other organizations?
1 = No comparability ( no paragraph)
2 = Limited comparability ( one
paragraph)
3 = Moderate comparability (two
paragraph)
4 = Very much comparability (two
paragraph with numbering)
5 = Very extensive comparability (
more than above )
e.g. Jonas and
Blanchet, 2000.
Chakroun et al.
2013, Beest et
al.2009
C2 To what extent does the
company presents
financial index numbers
of CSR and ratios in the
annual report?
1 = No ratios
2 = 1-2 ratios
3 = 3-5 ratios
4 = 6-10 ratios
5 = > 10 ratios
(e.g. Cleary, 1999;
Jonas and Blanchet,
2000. Chakroun et
al. 2013, Beest et
al.2009