Quantitative Risk Management - ICRATicrat.org/icrat/seminarContent/2016/keynotes/ICRAT M.Muller...
138
Quantitative Risk Management Cpt. Manfred Mueller Head of Flight Safety Research Lufthansa AG Lecturer on Risk Management, Univ. Bremen
Transcript of Quantitative Risk Management - ICRATicrat.org/icrat/seminarContent/2016/keynotes/ICRAT M.Muller...

25.07.2016Seite 1
Bitte diesen Text mit dem Präsentationstitel überschreibenDeutsche Lufthansa AG
Quantitative Risk Management
Cpt. Manfred MuellerHead of Flight Safety Research Lufthansa AG Lecturer on Risk Management, Univ. Bremen

SAMSYS - Safety Performance Index (SPI)Quantitative risk assessment and their protective measures in aviation
2
Institute of Strategic Management
Institute of Flight System DynamicsInstitute of ErgonomicsInstitute of Mathematics
Institute for Production an Logistics GmbH affiliated institute at the University of Bremen
Software Development
Section Operation / SafetyProject Leader
Institute of Aeronautics and AstronauticsChair of Flight Guidance & Air Transportation
More than 25 University Experts

Is flying an „ultra-safe“ system ?

40 years ago driving to the airport was themost dangerous part of an Airline-flight

Hull Loss per Million Sectors (1958-2011)
0
2
4
6
8
10
12
14
1 6 11 16 21 26 31 36 41 46 511960 1980 2000
…last 40 years in Germany:Increase in car-safety ~40 timesIncrease in flight safety ~4 times

25.07.2016Seite 6
Bitte diesen Text mit dem Präsentationstitel überschreibenDeutsche Lufthansa AG
Pfatal car ride: 7,2 x 10e-8 (1 in ~15 Million)
Pfatal flight: 0,3 x 10e-6 (1 in ~3 Million)
Risk of driving to the airport in Germany versus an average IATA-Flight (2014)
driving to the airport is now 5timessafer than an Ø Airline-Flight

>400 cars

25.07.2016Seite 8
Bitte diesen Text mit dem Präsentationstitel überschreibenDeutsche Lufthansa AG
The number of all Airline-flights worldwide per year equals thenumber of car-trips in Germany within 4 hours
6 years of worldwide Airline flights => 1 day car traffic in Germany:
~5 fatalities in cars per day, (without country roads ~2 fatalities daily)
Why don‘t we see the problems ?

Pilot Manager
Ship owner
Passenger

Operational topics
Economicalpressure

after deregulation…

one per month
every 90 hours

How dangerous are various jobs?
Number of fatal accidents per 100.000 workers per year
University of Oxford
fisherman 123seaman 68railroad worker 31scaffold builder 30roofer 25lumberjack 20docker 19miner 15truck driver 15canal worker 14farm hand 12railroadman 11roadworker 10
window cleaner 10garbageman 9farmer 8construction worker
8
crane driver 8chemical worker 8Fireman 7policeman 7metalworker 6painter 6soldier 6electrician 5

Continental CEO Jeff Smisek
(cost saving: worked one year without getting salary)
2010 „Manager of the year“
2004 bis 2009 „Most Admired Global Airline“
„Highest Ranked Network Airline“
increasing economical pressure

Continental Airlines
Safety is our top priority: Fligths can stop for extra fuel en route if necessary!
Continental Airlines fuel emergencies
(less than 30 minutes of fuel!) at Newark Airport
2005: 19 2006: 422007: 96

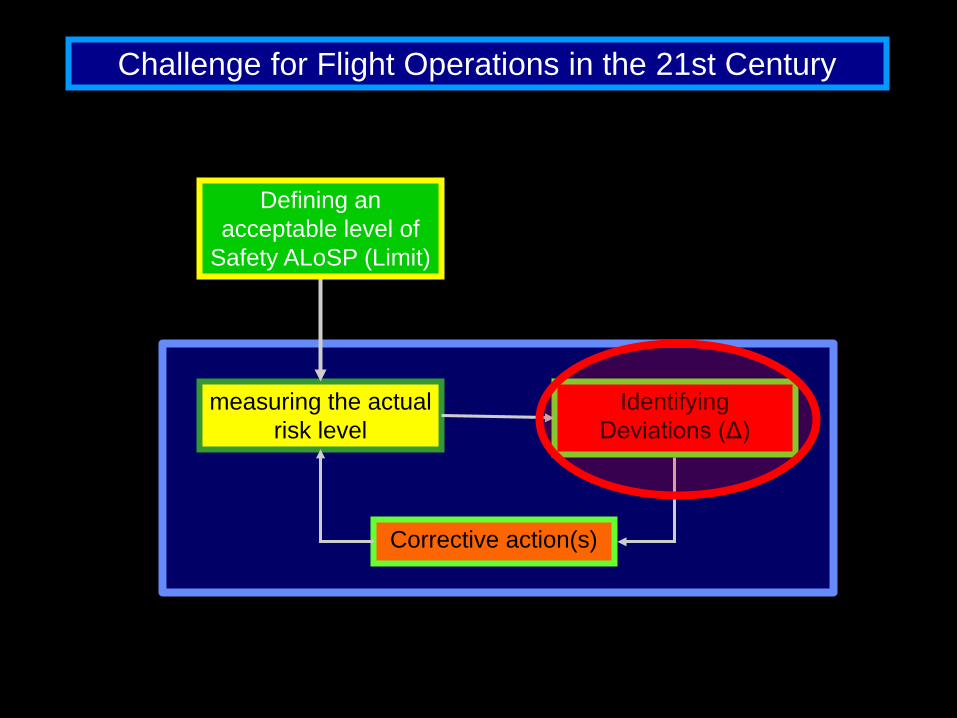
Challenge for Flight Operations in the 21st Century
measuring the actualrisk level
Identifying Deviations (Δ)
Corrective action(s)
Defining an acceptable level of
Safety ALoSP (Limit)
25.07.2016Seite 17
Bitte diesen Text mit dem Präsentationstitel überschreibenDeutsche Lufthansa AG
ALoSP (Acceptable Level of Safety Performance)
How safe should it be?
What should be the safety targetfor an Airline flight?
25.07.2016Seite 18
Bitte diesen Text mit dem Präsentationstitel überschreibenDeutsche Lufthansa AG
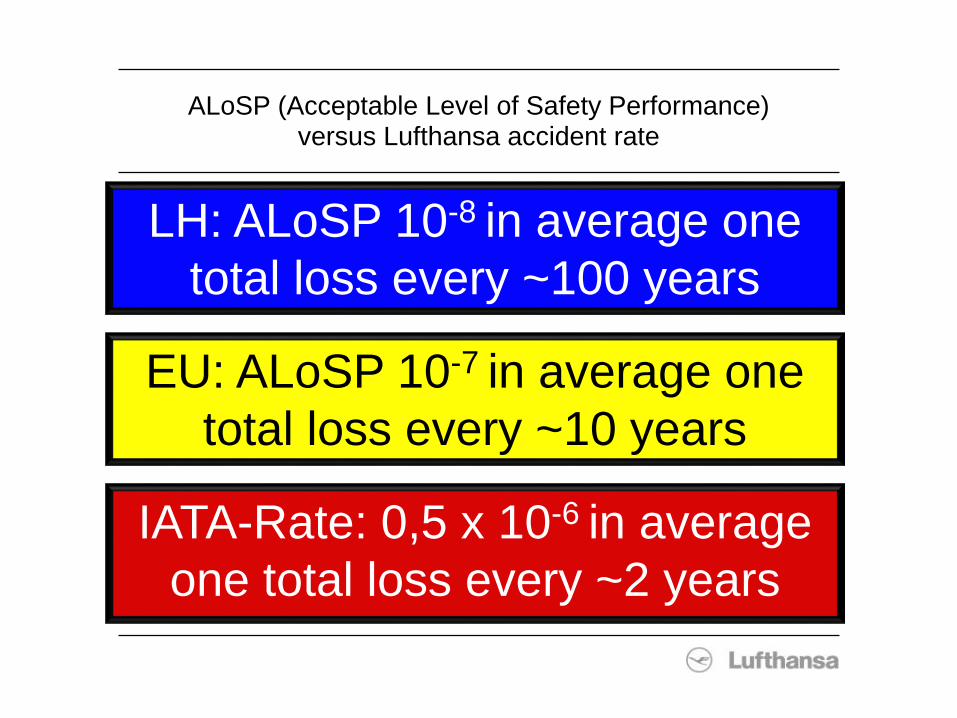
ALoSP (Acceptable Level of Safety Performance)versus Lufthansa accident rate
LH: ALoSP 10-8 in average onetotal loss every ~100 years
EU: ALoSP 10-7 in average onetotal loss every ~10 years
IATA-Rate: 0,5 x 10⁻⁶ in average one total loss every ~2 years

Challenge for Flight Operations in the 21st Century
measuring the actualrisk level
Identifying Deviations (Δ)
Corrective action(s)
Defining an acceptable level of
Safety ALoSP (Limit)

How dangerous are various jobs?
Number of fatal accidents per 100.000 workers per year
University of Oxford
fisherman 123seaman 68railroad worker 31scaffold builder 30roofer 25lumberjack 20docker 19airline pilot 15miner 15truck driver 15canal worker 14farm hand 12railroadman 11roadworker 10
window cleaner 10garbageman 9farmer 8construction worker
8
crane driver 8chemical worker 8Fireman 7policeman 7metalworker 6painter 6soldier 6electrician 5

How dangerous are various jobs?
Number of fatal accidents per 100.000 workers per year
University of Oxford
fisherman 123cargo pilot 90seaman 68railroad worker 31scaffold builder 30roofer 25lumberjack 20docker 19miner 15truck driver 15canal worker 14farm hand 12railroadman 11roadworker 10
window cleaner 10garbageman 9farmer 8construction worker
8
crane driver 8chemical worker 8Fireman 7policeman 7metalworker 6painter 6soldier 6electrician 5

1. Fishermen 116,02. Logging workers 91,93. Airplane pilots 70,64. Farmers and ranchers 41,45. Mining machine operators 38,76. Roofers 32,47. Sanitation workers 29,88. Truck drivers and delivery workers 21,89. Industrial machine workers 20,3
10. Police officers 18,0
TOP 10 MOST DANGEROUS US-JOBS IN 2010(with fatal work injury rate)
Why is this accepted by theauthorities ?
25.07.2016Seite 24
Bitte diesen Text mit dem Präsentationstitel überschreibenDeutsche Lufthansa AG
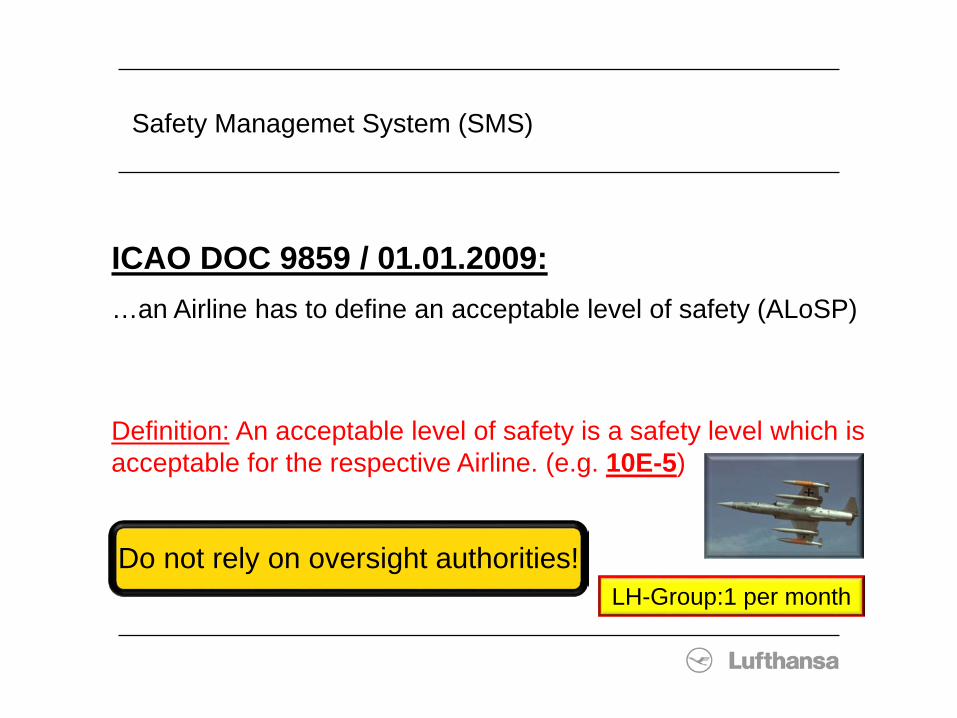
Safety Managemet System (SMS)
ICAO DOC 9859 / 01.01.2009:…an Airline has to define an acceptable level of safety (ALoSP)
Definition: An acceptable level of safety is a safety level which isacceptable for the respective Airline. (e.g. 10E-5)
Do not rely on oversight authorities!LH-Group:1 per month
25.07.2016Seite 25
Bitte diesen Text mit dem Präsentationstitel überschreibenDeutsche Lufthansa AG
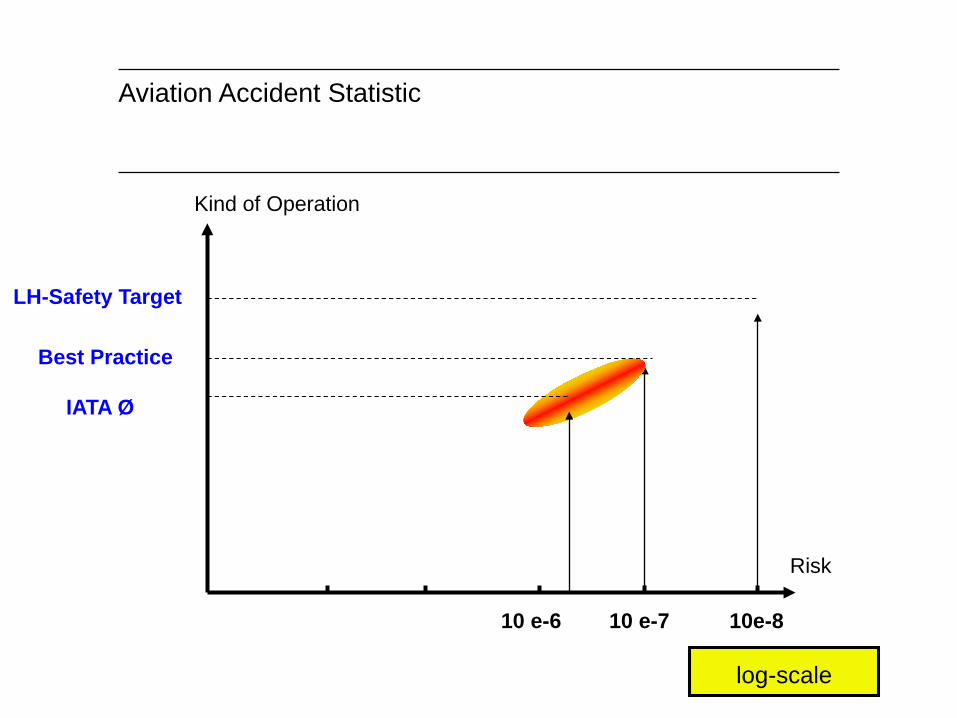
Aviation Accident Statistic
LH-Safety Target
Risk
Kind of Operation
IATA Ø
Best Practice
10 e-3 10 e-4 10 e-5 10 e-6 10 e-7 10e-8
log-scale

25.07.2016Seite 26
Bitte diesen Text mit dem Präsentationstitel überschreibenDeutsche Lufthansa AG
Glider flying competition
IATA Ø
Best Practice
Business
10 e-3 10 e-4 10 e-5 10 e-6 10 e-7 10e-8
Aviation Accident Statistic
LH-Safety Target
Risk
Kind of Operation
log-scale
25.07.2016Seite 27
Bitte diesen Text mit dem Präsentationstitel überschreibenDeutsche Lufthansa AG
Theoretical backgroud
STRUCTURE defines RISK
Prof. Dr. Franz Porzsolt, Univ. Ulm

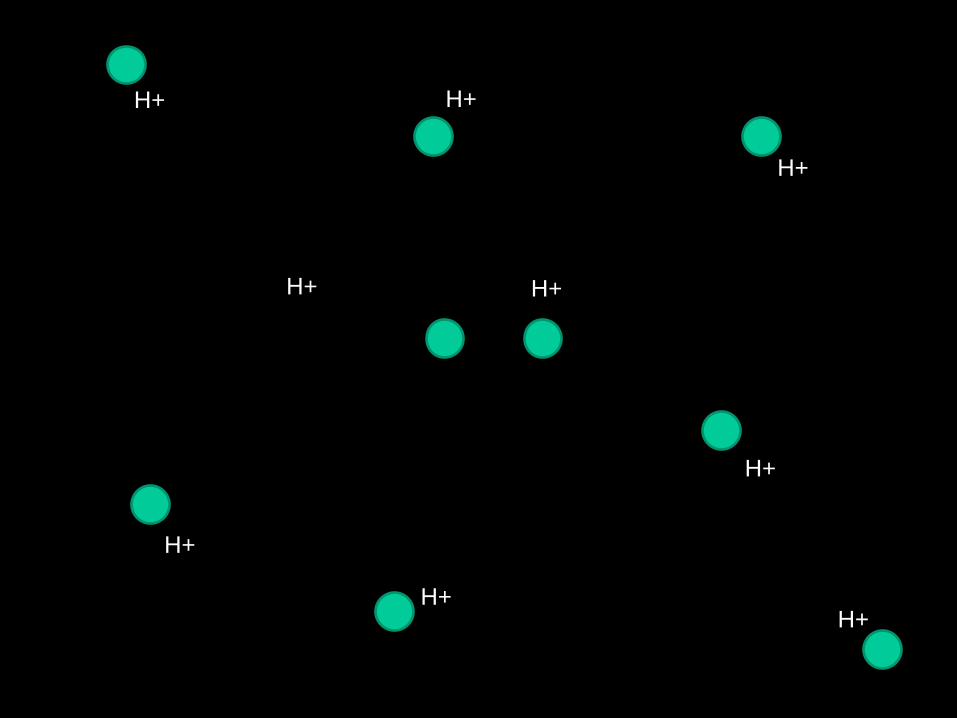
Status B
Status A TP


H+ H+
H+ H+
H+
H+
H+H+
angle deviation < 0,000001°
H+
H+ H+
H+ H+
H+
H+
H+H+
H+

He++
H+ H+
H+
H+
H+H+
H+

25.07.2016Seite 33
Bitte diesen Text mit dem Präsentationstitel überschreibenDeutsche Lufthansa AG
Transition Probability (PT)
=> He++
Sunlight for5 x 107 years
H+ + H+
hydrogen nucleus
PT = 10-8
Transition Probability

Downhill Skiingapprox. 8 Mio. skiers in Germany
approx. 80 Mio. skiing days per winter
Skiing Accidents80.000 severe injuries per winter
personal risk 10-3 per skiing day
approx. 4 victims daily per skiing area
Quantitative Study
TP

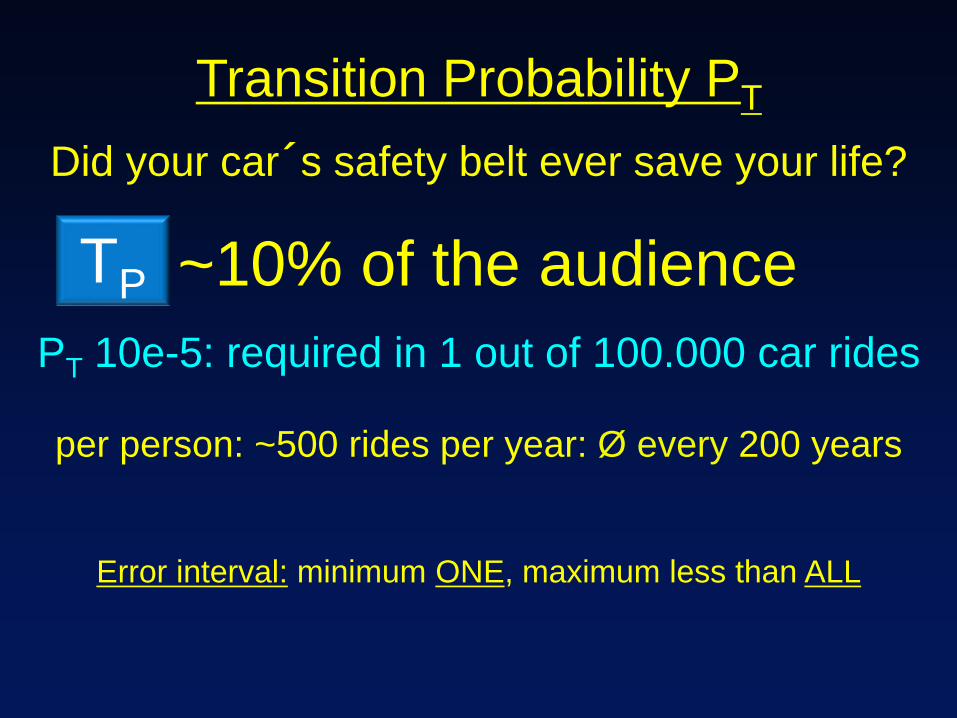
Transition Probability PT
Did your car´s safety belt ever save your life?
~10% of the audiencePT 10e-5: required in 1 out of 100.000 car rides
per person: ~500 rides per year: Ø every 200 years
Error interval: minimum ONE, maximum less than ALL
TP
Technische Universität Berlin
Enis Aksu FRA CF
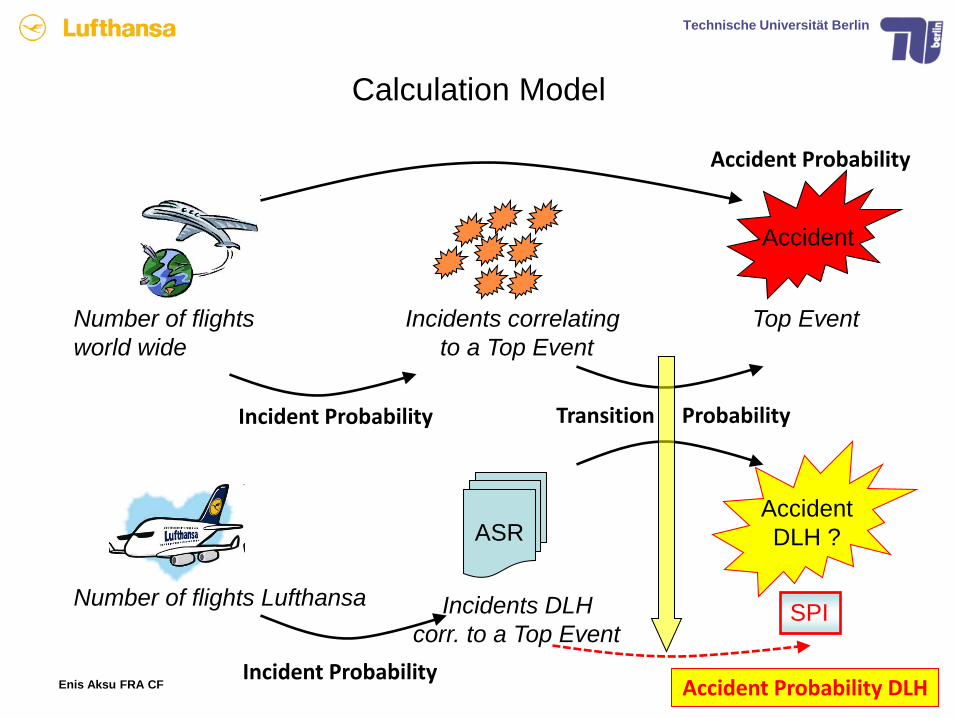
Calculation Model
Accident
Incidents correlatingto a Top Event
ASRAccidentDLH ?
Incidents DLHcorr. to a Top Event
Number of flightsworld wide
Number of flights Lufthansa
Top Event
Accident Probability
Incident ProbabilityAccident Probability DLH
SPI
Incident Probability Transition Probability
Technische Universität Berlin
Enis Aksu FRA CF 38
Exte
rnal
Sou
rce
Airli
ne (L
ufth
ansa
)Flights in Airline
FA
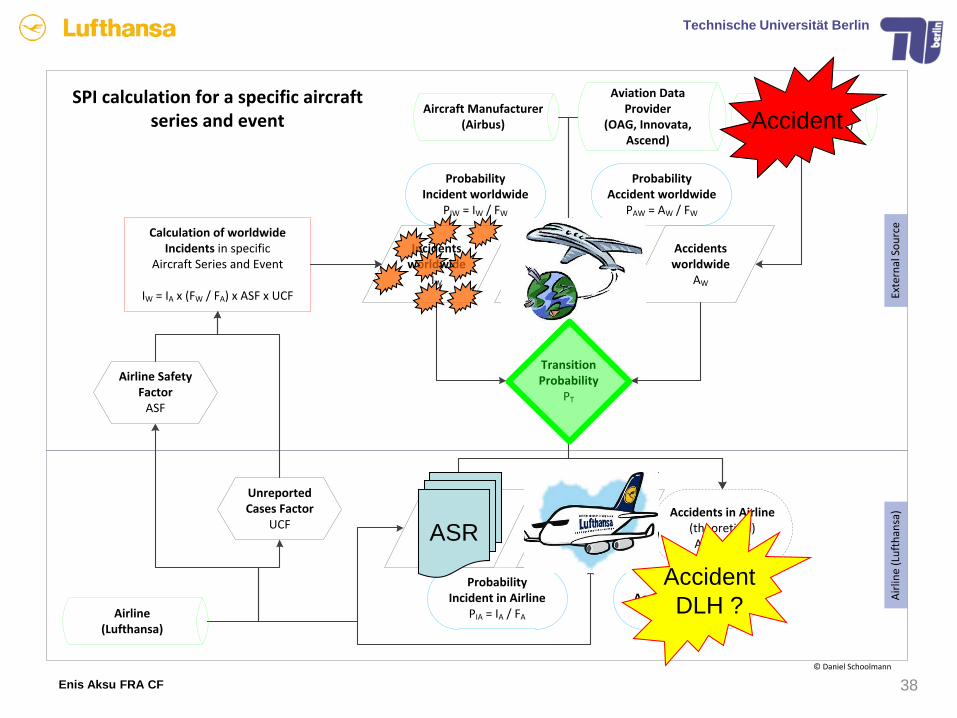
SPI calculation for a specific aircraft series and event
Flights worldwide
FW
Airline Safety Factor
ASF
Incidents in Airline
IA
Incidents worldwide
IW
Calculation of worldwide Incidents in specific
Aircraft Series and Event
IW = IA x (FW / FA) x ASF x UCF
Accidents worldwide
AW
Transition Probability
PT
ProbabilityAccident in Airline
PAA = AA / FA
Accidents in Airline(theoretical)AA = IA x PT
ProbabilityIncident worldwide
PIW = IW / FW
ProbabilityAccident worldwide
PAW = AW / FW
ProbabilityIncident in Airline
PIA = IA / FA
Unreported Cases Factor
UCF
© Daniel Schoolmann
Accident Database(ECCAIRS, ASN etc.)
Aviation Data Provider
(OAG, Innovata, Ascend)
Aircraft Manufacturer (Airbus)
Airline(Lufthansa)
Accident
ASR
AccidentDLH ?

Technische Universität Berlin
Enis Aksu FRA CF
Incidents correlating to a Top EventMid Air Collision with TCAS
MAC
TCAS-OWN PILOT
AIRPROX (NO TCAS)
TCAS-ATC, OTHER PILOT
Top Event
Standard EventsASR Datenbank
TCAS FALSE WARNINGS
TCAS NUISANCE OWN
TCAS NUISANCE OTHER
AIRPROXACAS ALERT
LOSS OF SEPARATION
NEAR MIDAIR-COLLISIONS
IATA, ANSP‘s, etc.

Technische Universität Berlin
Enis Aksu FRA CF
Number of TCAS / AIRPROX Eventsall Lufthansa Fleets
3 28
3 7 11 8 6 5
11199
80
94
80
10797
61 62
20 18 1910 12
17 147 8
0
20
40
60
80
100
120
2002 2003 2004 2005 2006 2007 2008 2009 2010
TCAS-OWN PILOTTCAS-ATC,OTHER PILOTAIRPROX (NO TCAS)
Technische Universität Berlin
Enis Aksu FRA CF
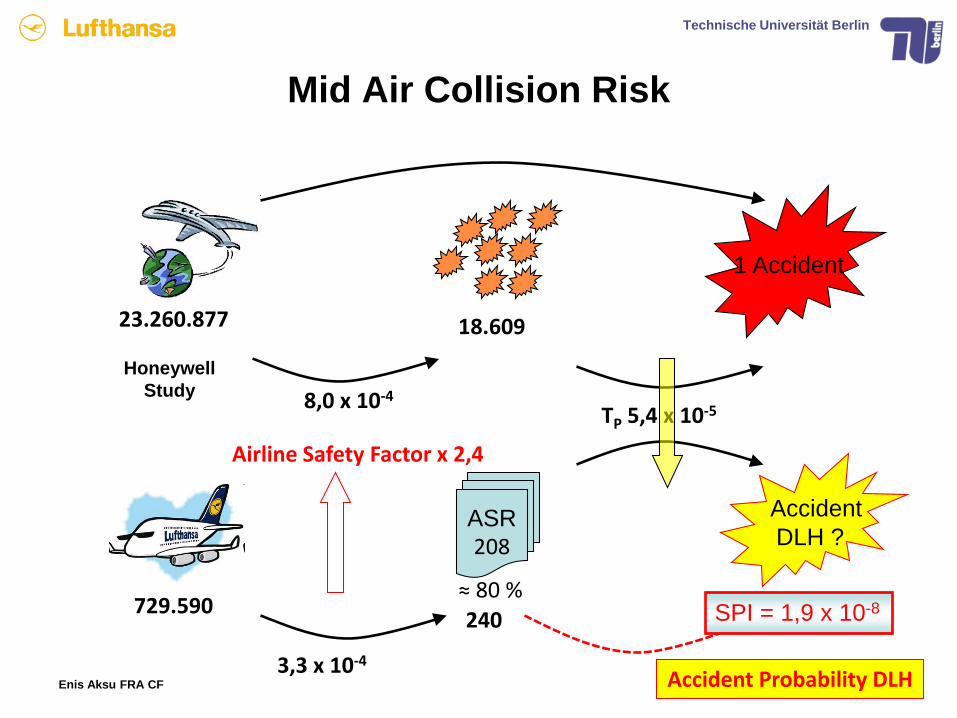
Mid Air Collision Risk
1 Accident
18.609
ASR208
Accident DLH ?
240
23.260.877
729.590
TP 5,4 x 10⁻⁵
3,3 x 10⁻⁴Accident Probability DLH
Airline Safety Factor x 2,4
SPI = 1,9 x 10⁻⁸≈ 80 %
HoneywellStudy 8,0 x 10⁻⁴

Evidence Based Risk Management
Every Flight is confronted with a numberof various threats.
The summ of all different threats has tobe <10-8.
The probability of a single threat has tobe significantly lower than10-8.
How can we calculate the Total Risk?
Technische Universität München
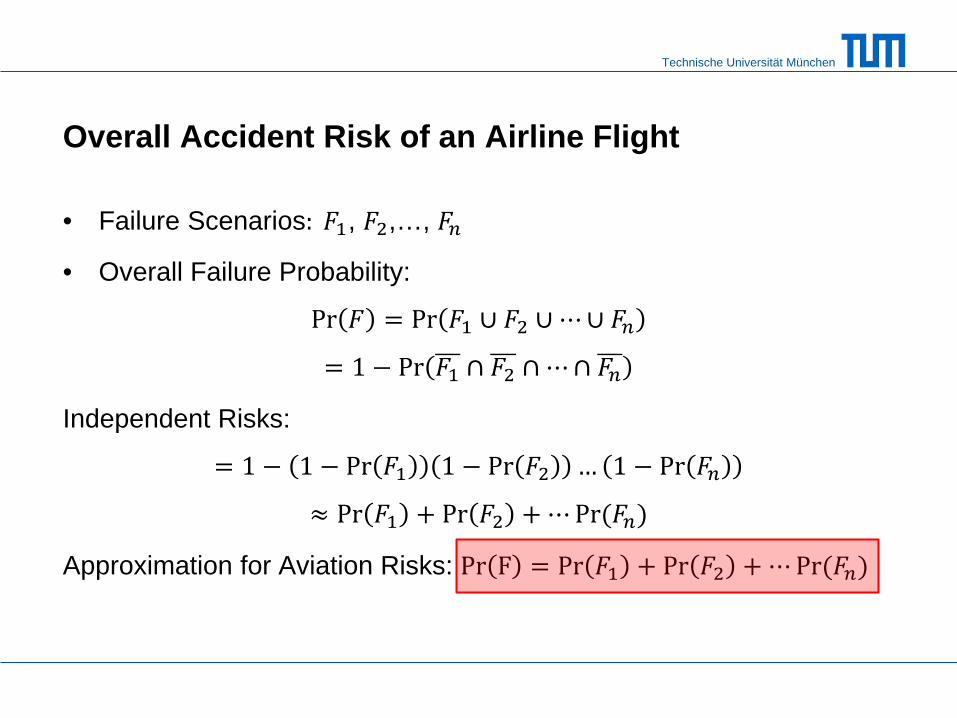
Overall Accident Risk of an Airline Flight
• Failure Scenarios: 𝐹𝐹1, 𝐹𝐹2,…, 𝐹𝐹𝑛𝑛
• Overall Failure Probability:
Pr 𝐹𝐹 = Pr 𝐹𝐹1 ∪ 𝐹𝐹2 ∪ ⋯∪ 𝐹𝐹𝑛𝑛= 1 − Pr 𝐹𝐹1 ∩ 𝐹𝐹2 ∩ ⋯∩ 𝐹𝐹𝑛𝑛
Independent Risks:
= 1 − 1 − Pr 𝐹𝐹1 1 − Pr 𝐹𝐹2 … 1 − Pr 𝐹𝐹𝑛𝑛≈ Pr 𝐹𝐹1 + Pr 𝐹𝐹2 + ⋯Pr(𝐹𝐹𝑛𝑛)
Approximation for Aviation Risks: Pr F = Pr 𝐹𝐹1 + Pr 𝐹𝐹2 + ⋯Pr(𝐹𝐹𝑛𝑛)

03.11.2011 SaMSys
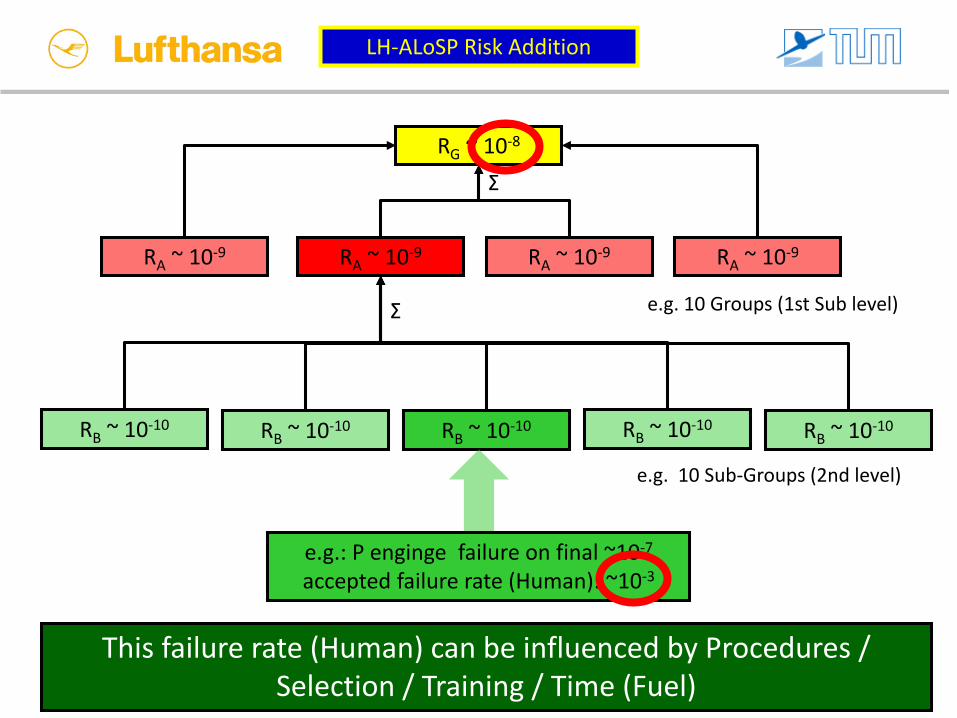
RG ~ 10-8
RA ~ 10-9 RA ~ 10-9 RA ~ 10-9 RA ~ 10-9
RB ~ 10-10 RB ~ 10-10 RB ~ 10-10 RB ~ 10-10 RB ~ 10-10
Σ
Σ
e.g. 10 Groups (1st Sub level)
e.g. 10 Sub-Groups (2nd level)
LH-ALoSP Risk Addition
Overall risk = Sum of all single risk factors (~100)
Prof. Dr. Daniel Straub Institute for Risk Analysis Technical University Munich
03.11.2011 SaMSys
RG ~ 10-8
RA ~ 10-9 RA ~ 10-9 RA ~ 10-9 RA ~ 10-9
RB ~ 10-10 RB ~ 10-10 RB ~ 10-10 RB ~ 10-10 RB ~ 10-10
Σ
Σ
e.g. 10 Groups (1st Sub level)
e.g. 10 Sub-Groups (2nd level)
LH-ALoSP Risk Addition
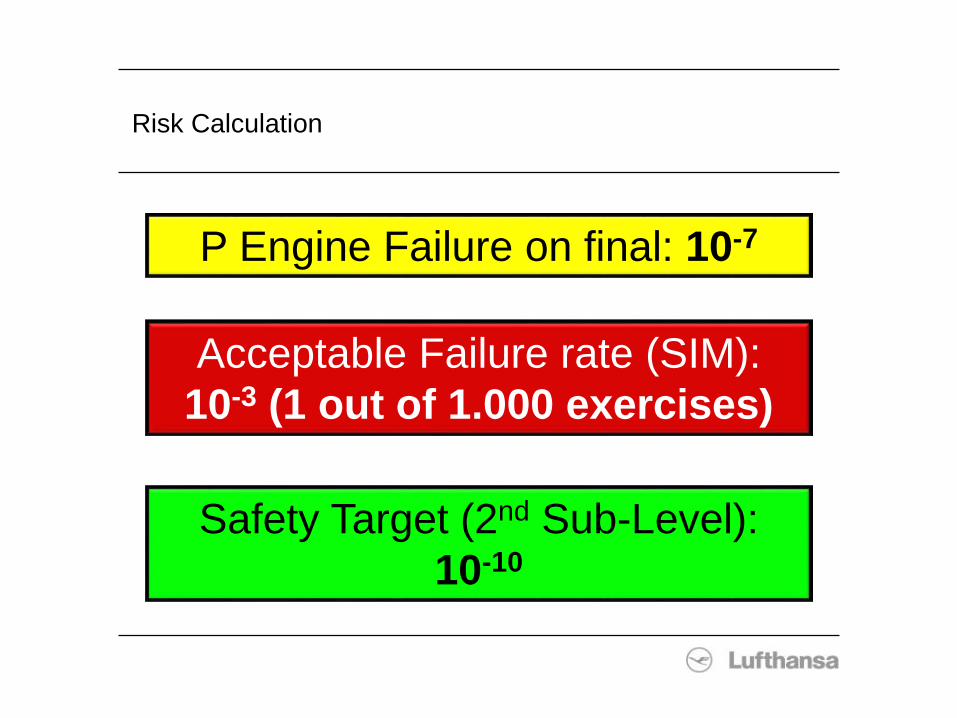
e.g.: P enginge failure on final ~10-7
accepted failure rate (Human): ~10-3
This failure rate (Human) can be influenced by Procedures / Selection / Training / Time (Fuel)
25.07.2016Seite 46
Bitte diesen Text mit dem Präsentationstitel überschreibenDeutsche Lufthansa AG
Risk Calculation
P Engine Failure on final: 10-7
Safety Target (2nd Sub-Level): 10-10
Acceptable Failure rate (SIM): 10-3 (1 out of 1.000 exercises)
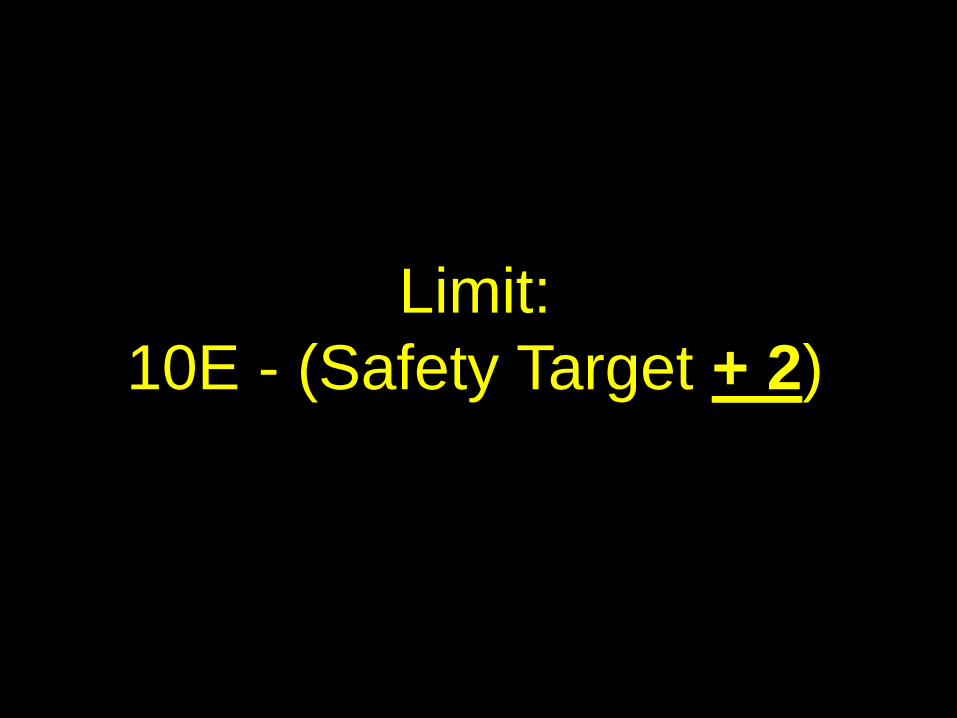
Limit:10E - (Safety Target + 2)

25.07.2016Seite 48
Bitte diesen Text mit dem Präsentationstitel überschreibenDeutsche Lufthansa AG
SaMSys
10e-8
10e-10
10e-9


10e-9
10e-10
10e-8

10e-9
10e-10
10e-8

Date Airline Fatalities
21.08.1994 Royal Air MarocFlight 630
44
19.12.1997 Silk Air Flight 185
104
31.10.1999 Egypt Air Flight 990
217
29.11.2013 LAM MocambiqueFlight 470
33
24.03.2015 German WingsFlight 9525
150
Accident-Category: Suicide by Airline-Pilot
PT Flight / Pilot Suicide: ~0,8 x 10E-8


25.07.2016Seite 55
Bitte diesen Text mit dem Präsentationstitel überschreibenDeutsche Lufthansa AG
Approach during a thunderstorm
Traffic flow is not interrupted: ALoSP: 10E-5 (ICAO)
If 20% (+/-10%) of the flights continue to land: IATA-average (80% do not land)
EASA-ALoSP: ~2 (+/-1)% land (99% do NOT land)
LH-ALoSP: ~0,2 (+/- 0,1)% land (99,9% do NOT land)
TP :~10E-5
Challenge for Flight Operations in the 21st Century
measuring the actualrisk level
Identifying Deviations (Δ)
Corrective action(s)
Defining an acceptable level of
Safety ALoSP (Limit)

Technische Universität MünchenLehrstuhl für Ergonomie
Simulatorstudie zu manuellen Flugfertigkeiten
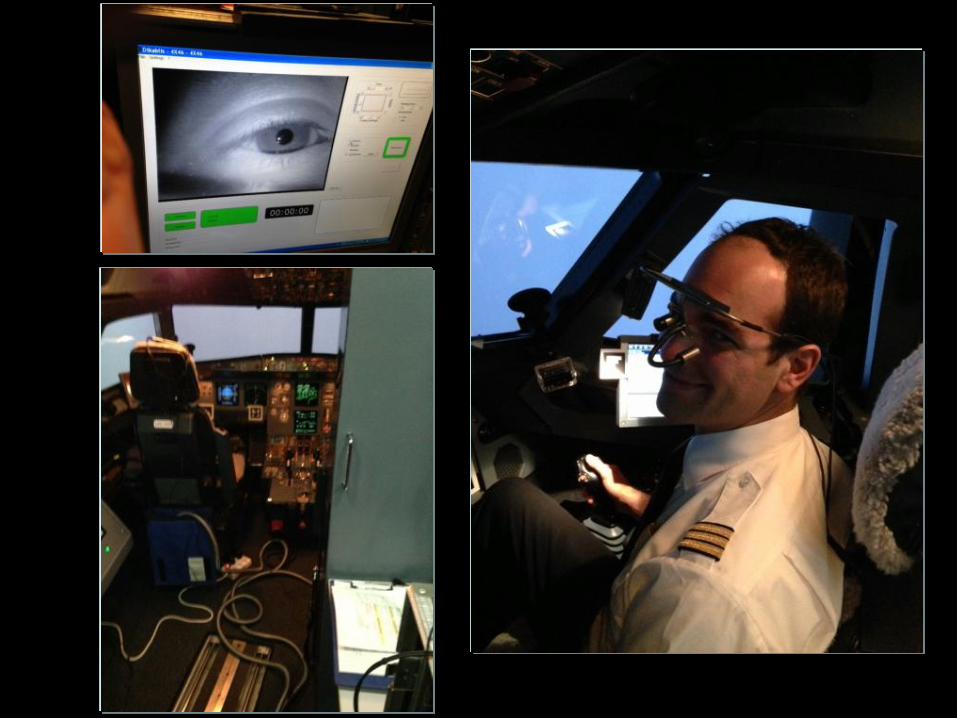


Flight data recordingtraffic scenario
Eye-tracking andcommunication recording
simulator controlperformance analysis
Technische Universität MünchenLehrstuhl für Ergonomie
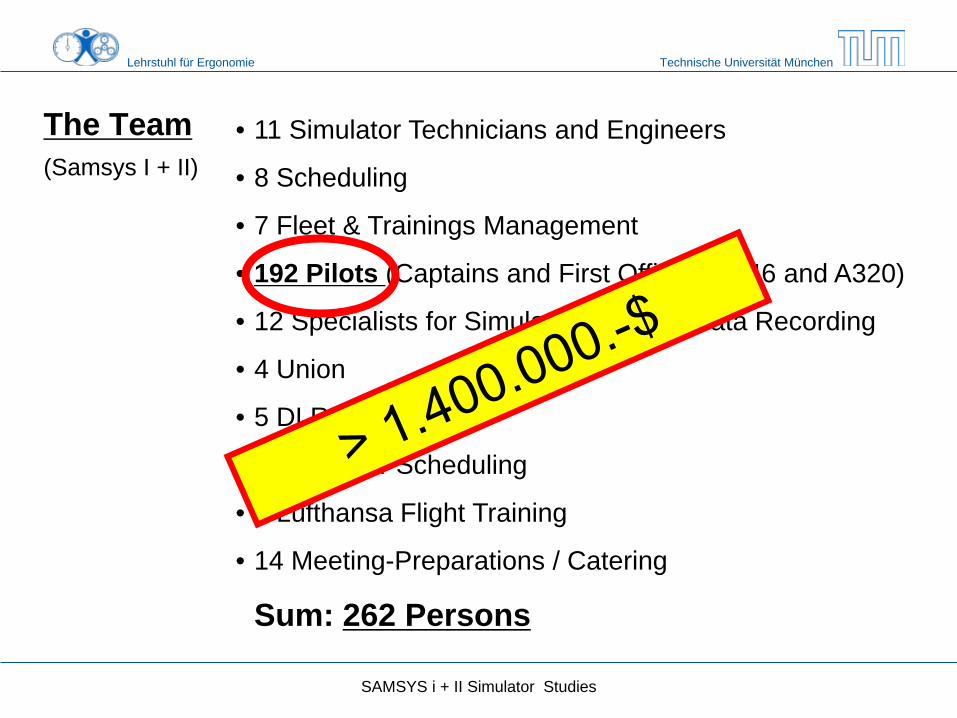
The Team(Samsys I + II)
• 11 Simulator Technicians and Engineers
• 8 Scheduling
• 7 Fleet & Trainings Management
• 192 Pilots (Captains and First Officers A346 and A320)
• 12 Specialists for Simulator Ops and Data Recording
• 4 Union
• 5 DLR-Specialists
• 5 Simulator Scheduling
• 6 Lufthansa Flight Training
• 14 Meeting-Preparations / Catering
Sum: 262 Persons
SAMSYS i + II Simulator Studies

Technische Universität MünchenLehrstuhl für Ergonomie
Simulatorstudie zu manuallen Flugfertigkeiten
Randomised Study
NO volunteers
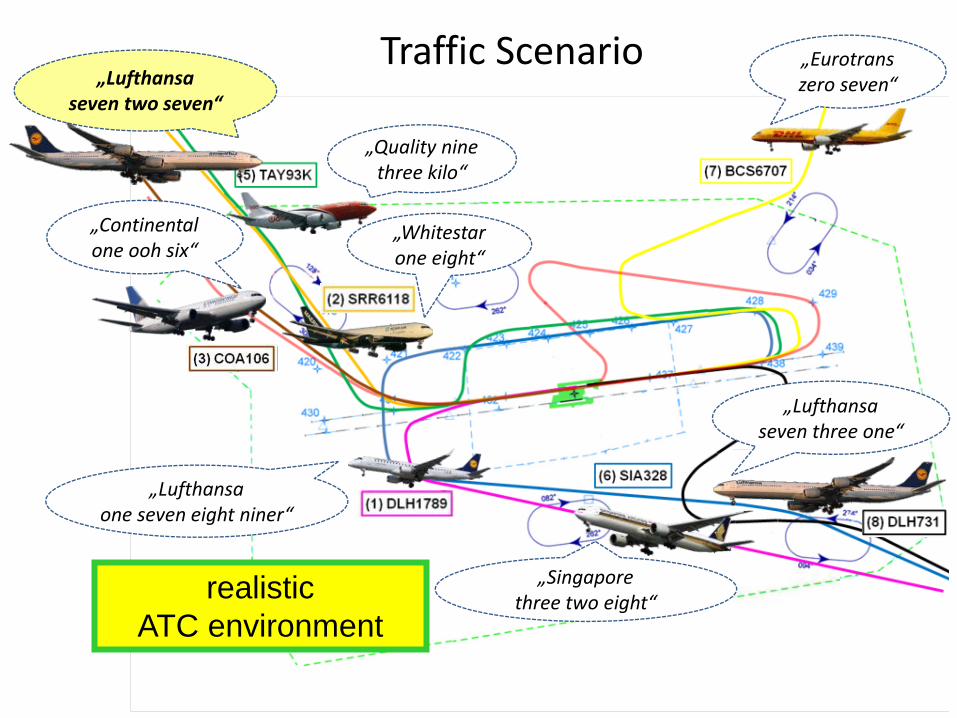
„Quality ninethree kilo“
„Continental one ooh six“
„Whitestarone eight“
„Lufthansa one seven eight niner“
„Singaporethree two eight“
„Eurotrans zero seven“
„Lufthansa seven three one“
„Lufthansa seven two seven“
Traffic Scenario
realisticATC environment

Kategorie Fehler MTBF
Task Related Probability Of Errors MTBFsProf. Bubb TU-Munich
Simple and regularely performed tasks at a low stress level.
1 . 10-3
Complex tasks in unusual situations at a high stress level and / or time pressure.
Complex, regularely performed tasks in a well known working environment at a low stress level.
1 ∙ 10-1
1 ∙ 10-2
~30 min
~5 min
~30 sec
Category Error probability MTBF

Flight Safety Research looked at the following aspects
Basic Piloting Skills
Raw data approaches
Landing technique
Go-around handling
Pilot Selection concept Validation
Side stick handling
Handling of non-standard / complexAbnormals in a realistic environment
CRM / Team Interaction
Fuel Status

25.07.2016Seite 66
Bitte diesen Text mit dem Präsentationstitel überschreibenDeutsche Lufthansa AG
Flight Safety Research
Basic Piloting Skills

Technische Universität MünchenLehrstuhl für Ergonomie
Simulatorstudie zu manuallen Flugfertigkeiten
2. manual Flying
Capt Jacques Drappier, Airbus vice-president training, 17. September 2009:
“We need to refocus on basic handling…”
“…long-haul pilots typically log 800-900 flying hours a year, although this could include less than 3h of stick time, the majority of which is accumulated on final approach and flare.”
“We put people into our training today who have forgotten how to fly, basically,”
But (same presentation):
Airbus expects pilot type conversion training to take five days between the A380 and the A350, compared with 10 days from the A330/A340 family to the A350 and 11 days from the A320.
actually < 2h / year
Technische Universität MünchenLehrstuhl für Ergonomie
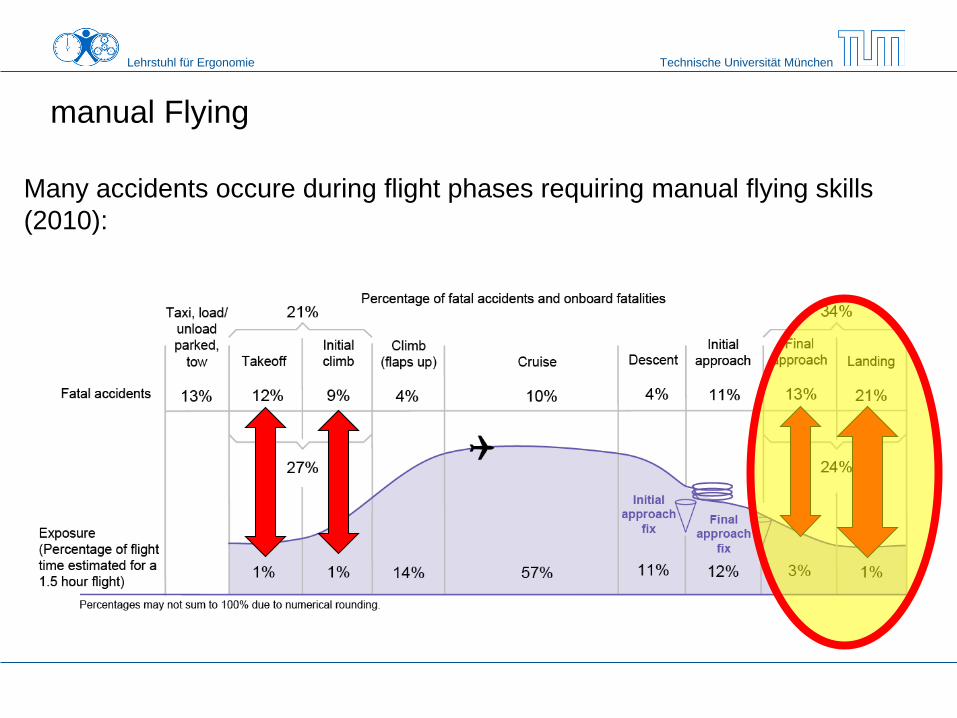
Simulatorstudie zu manuallen Flugfertigkeiten
Many accidents occure during flight phases requiring manual flying skills (2010):
manual Flying


Technische Universität Berlin
-2.5 -2 -1.5 -1 -0.5 0 0.5 1 1.5 2
x 105
-5
0
5
10
15
20x 10
4
X [ft]
Y [f
t]
Topansicht
EDDM 26R
MIQ
DM431
DM429
GUDEGMAGAT
WLD
BURAM
XERUM
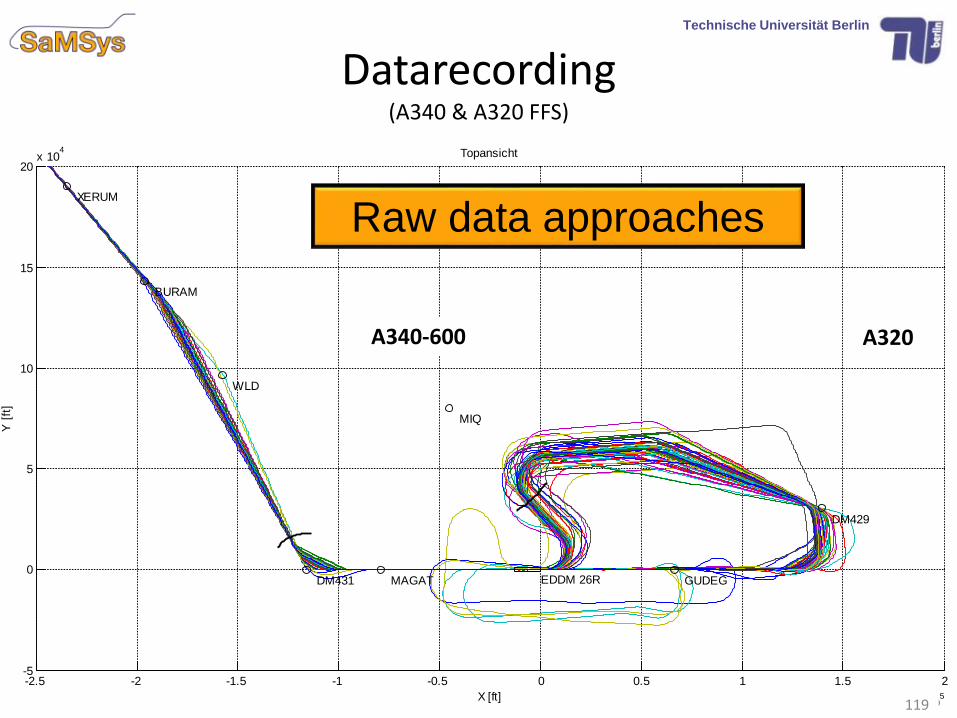
A320A340-600
71
Datarecording(A340 & A320 FFS)
Raw data approaches

-2.0 -1.5 -1.0 -0.5 0.0 0.5 1.0 1.5 2.0Ablage LOC in Dots
Maximale Abweichungen vom Localizer (LOC) zwischen 3000ft und 1000ft AGL
CPTs
F/Os
Maximum Localizer (LOC) Deviation between 3.000ft and 1.000ft AGL
-2.0
-1.5
-1.0
-0.5
0.0
0.5
1.0
1.5
2.0
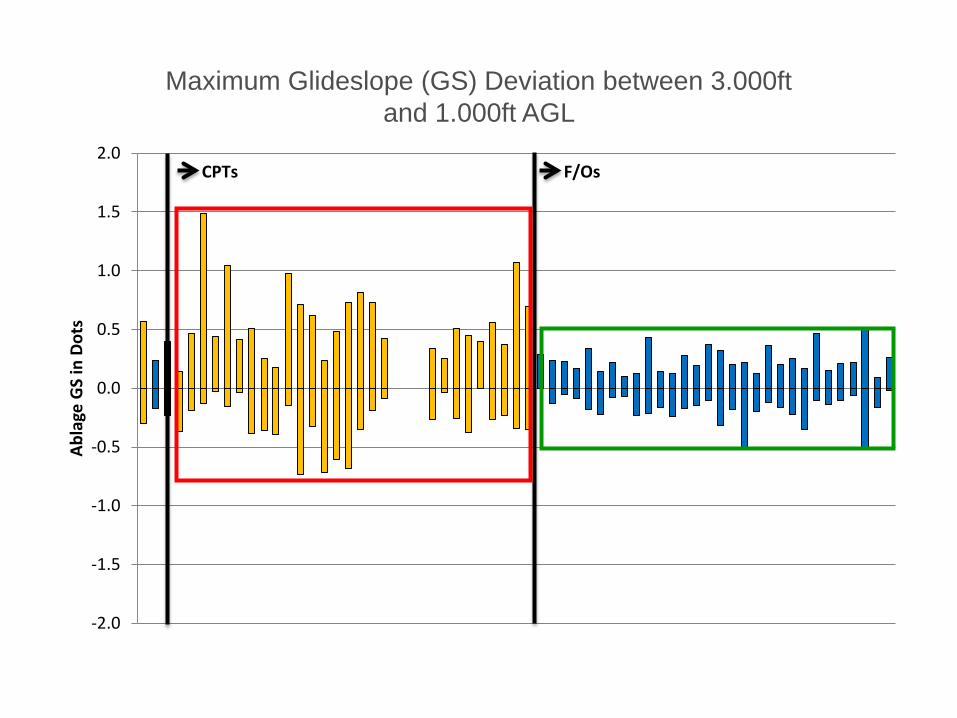
Abla
ge G
S in
Dot
sMaximale Abweichungen vom Glideslope (GS) zwischen 3000ft und
1000ft AGL
CPTs F/Os
Maximum Glideslope (GS) Deviation between 3.000ft and 1.000ft AGL

Technische Universität MünchenLehrstuhl für Ergonomie
74recurrent training and basic flying skills
Manual Flying Skills

Technische Universität MünchenLehrstuhl für Ergonomie
75
FO A320 > CPT A320 > FO A340 > CPT A340recurrent training and basic flying skills
Manual Flying Skills
Risk > 10E-8

Technische Universität MünchenLehrstuhl für Ergonomie
Simulatorstudie zu manuellen Flugfertigkeiten
9
8
7
6
5
4
3
2
1
54% (8)
47% (5)
39% (4) 55%
53%
42% 47%
41% (6)
37% (6)
56%
Simulator Study: manual flying skillsRisk: >10-6 <10-7
Stanine Psychomotoric
Correlation SIM-Study DLR-Test (CP A346)
6 5 4 3 2 1grade
DLRGerman
Air and Space Center

Technische Universität MünchenLehrstuhl für Ergonomie
Simulatorstudie zu manuellen Flugfertigkeiten
9
8
7
6
5
4
3
2
1
54% (8)
47% (5)
39% (4) 55%
53%
42% 47%
41% (6)
37% (6)
33% (ne)
(4) 33%
(ne)(ne)31% (ne)
56%
Simulator Study: manual flying skillsRisk: >10-6 <10-7
Stanine Psychomotoric
Correlation SIM-Study DLR-Test (CP A346)
6 5 4 3 2 1
Correlation r = -0,87
grade
DLRGerman
Air and Space Center

Technische Universität MünchenLehrstuhl für Ergonomie
Simulatorstudie zu manuellen Flugfertigkeiten
9
8
7
6
5
4
3
2
1
54% (8)
47% (5)
39% (4) 55%
53%
42% 47%
41% (6)
37% (6)
33% (ne)
(4) 33%
(ne)(ne)31% (ne)
56%
Simulator Study: manual flying skillsRisk: >10-6 <10-7
Stanine Psychomotoric
Correlation SIM-Study DLR-Test (CP A346)
6 5 4 3 2 1grade
DLRGerman
Air and Space Center
Training ! 35% (6)
Training ! (5)
50%Training !


8 88
<5


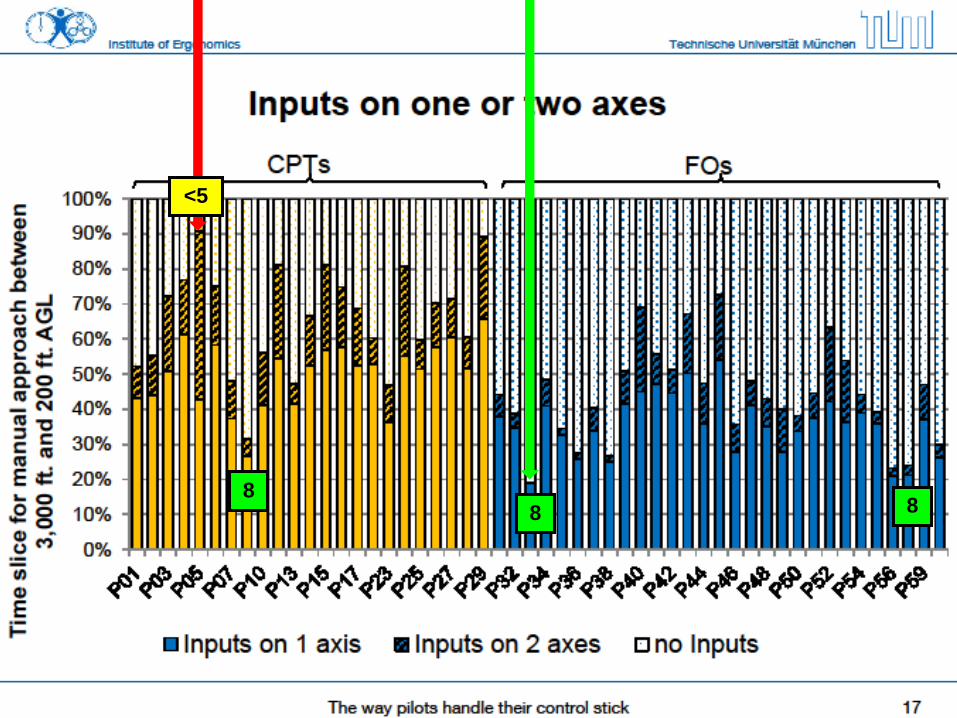
Speed-ChecksSpeed/vert.Speed-Checks unter 100ft
19.0%9.5%
64.0% 60.0%
0%
10%
20%
30%
40%
50%
60%
70%
80%
90%
100%
Speed überprüft zwischen 100ft und TD vert. Speed überprüft zwischen 100ft und TD
Ante
il de
r Pilo
ten
CPT FO
F/O A320
CPT A346
F/O A320
CPT A346
Speed / Vertical Speed Checks below 100ft RA
Speed checked below 100ft and TD V/S checked below 100ft and TD
25.07.2016Seite 87
Bitte diesen Text mit dem Präsentationstitel überschreibenDeutsche Lufthansa AG
SaMSys Simulator Experiments
Measuring…
Economical Flight Performance
FMS Mode Awareness / Automation
Handling unclear situations (Warsawa)
Redundancy and team-interaction
Go-Around-decision and -performance
Basic Flying Skills (AI and Boeing)
Predictability of pilot performance (DLR-test)

Simulation of Flight Operation
89
Simulation of Flight Operation
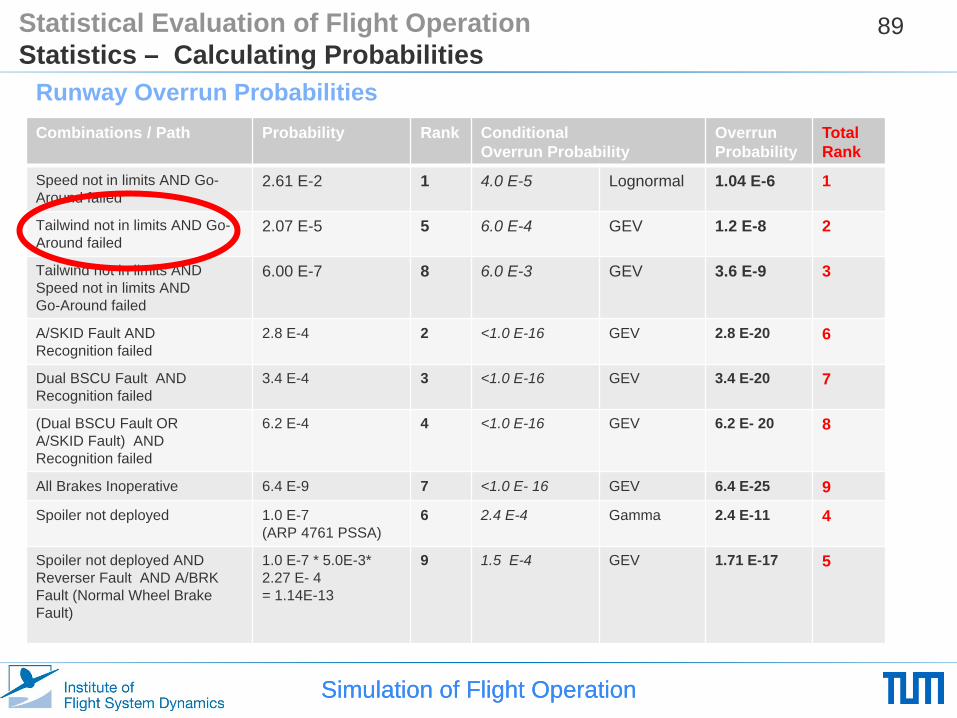
Runway Overrun ProbabilitiesCombinations / Path Probability Rank Conditional
Overrun ProbabilityOverrun Probability
TotalRank
Speed not in limits AND Go-Around failed
2.61 E-2 1 4.0 E-5 Lognormal 1.04 E-6 1
Tailwind not in limits AND Go-Around failed
2.07 E-5 5 6.0 E-4 GEV 1.2 E-8 2
Tailwind not in limits AND Speed not in limits ANDGo-Around failed
6.00 E-7 8 6.0 E-3 GEV 3.6 E-9 3
A/SKID Fault AND Recognition failed
2.8 E-4 2 <1.0 E-16 GEV 2.8 E-20 6
Dual BSCU Fault AND Recognition failed
3.4 E-4 3 <1.0 E-16 GEV 3.4 E-20 7
(Dual BSCU Fault ORA/SKID Fault) ANDRecognition failed
6.2 E-4 4 <1.0 E-16 GEV 6.2 E- 20 8
All Brakes Inoperative 6.4 E-9 7 <1.0 E- 16 GEV 6.4 E-25 9Spoiler not deployed 1.0 E-7
(ARP 4761 PSSA)6 2.4 E-4 Gamma 2.4 E-11 4
Spoiler not deployed ANDReverser Fault AND A/BRK Fault (Normal Wheel Brake Fault)
1.0 E-7 * 5.0E-3*2.27 E- 4 = 1.14E-13
9 1.5 E-4 GEV 1.71 E-17 5
Statistical Evaluation of Flight OperationStatistics – Calculating Probabilities

Simulator Study: Manual Pilot Skills
Test Scenario 2
• The tower reported wind is within limits. However the actual surface wind is beyond the limit (18Kts instead of max. 10Kts)
• A Go-Around should be performed!
• In 70ft a Go-Around is triggered by the PM
• Runway change after the Go-Around.

Masterarbeit Alexander Schmidt -91-
Technische Universität Berlin
85,2%
14,8%
93,3%
6,7%
0
10
20
30
40
50
60
70
80
90
100
Ja Nein
rela
tive
Häu
figke
it [%
]
A340A320
(%) of Pilots observing the TW during approach above 1000ft AGL
Decision Making Analysis
yes no
Masterarbeit Alexander Schmidt
Technische Universität Berlin
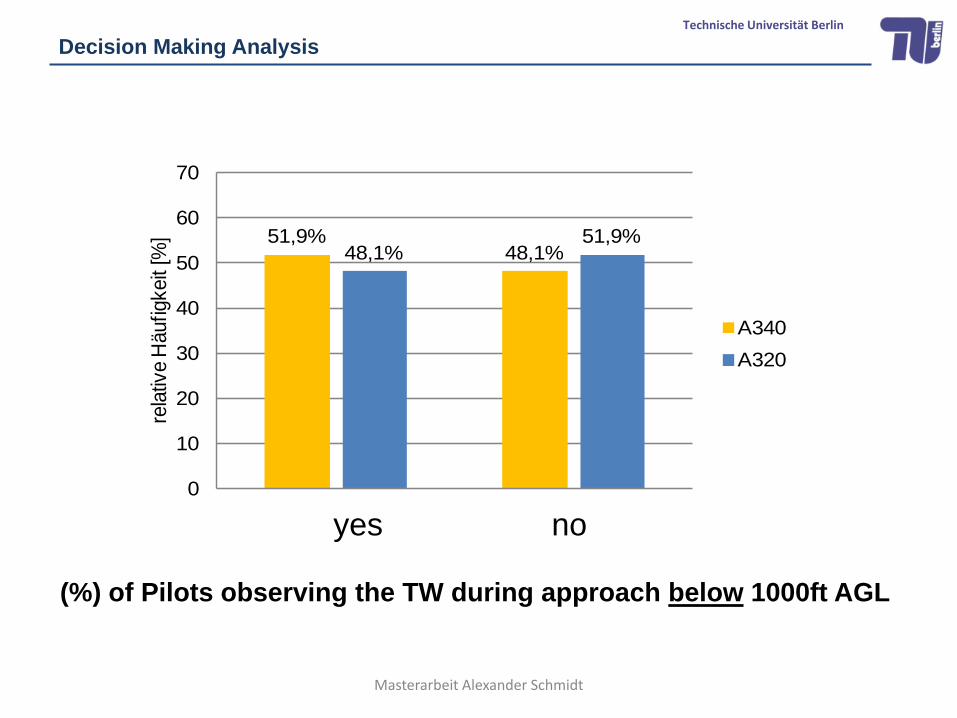
Beachten die VPen den RW im Anflug unter 1000ft AGL?
51,9%48,1%48,1%
51,9%
0
10
20
30
40
50
60
70
Ja Nein
relat
ive H
äufig
keit [
%]
A340A320
(%) of Pilots observing the TW during approach below 1000ft AGL
yes no
Decision Making Analysis

Masterarbeit Alexander Schmidt
Technische Universität Berlin
59,3%
40,7%
70,4%
29,6%
0
10
20
30
40
50
60
70
80
Ja Nein
rela
tive
Häu
figke
it [%
]
A340A320
VP wäre ohne Windhinweis des PM gelandet
Decision Making Analysis
yes no
(%) of Pilots who would have landed without the PM callout

Technische Universität Berlin
39% of all pilots discussed the tailwind situation during the approach briefing.
89% of all pilots talked about the strong tailwind during approach above 1000ft AGL.
50% of all pilots checked the wind indication during final approach below 1000ft AGL.
64% of all pilots would have landed without the wind information given by the PM (TW of 18 Kts).
14% of all pilots decided to land, knowing the tail wind was 18Kts.
44% of all A340 pilots performed the Go-Around only after the PM gave the command in ~70ft AGL.
Go-Around Anslysis(MSc of Alexander Schmidt)
94

Calculations:R ~10E-8
Is this result acceptable ?…according:
ICAOIATA
EASALH

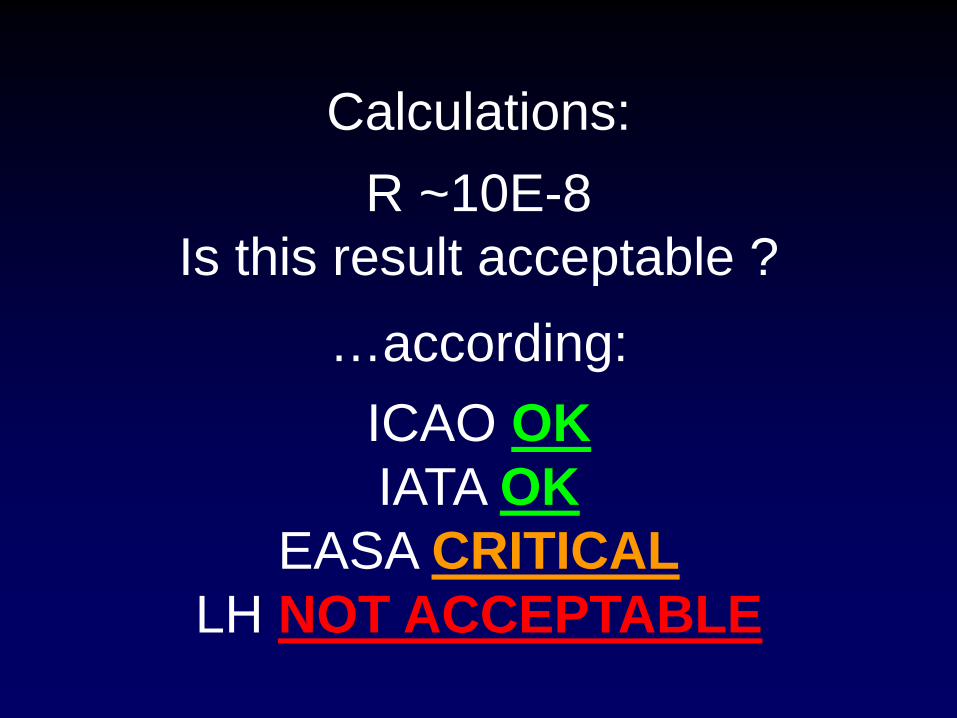
Calculations:R ~10E-8
Is this result acceptable ?…according:
ICAO OKIATA OK
EASA CRITICALLH NOT ACCEPTABLE
25.07.2016Seite 97
Bitte diesen Text mit dem Präsentationstitel überschreibenDeutsche Lufthansa AG
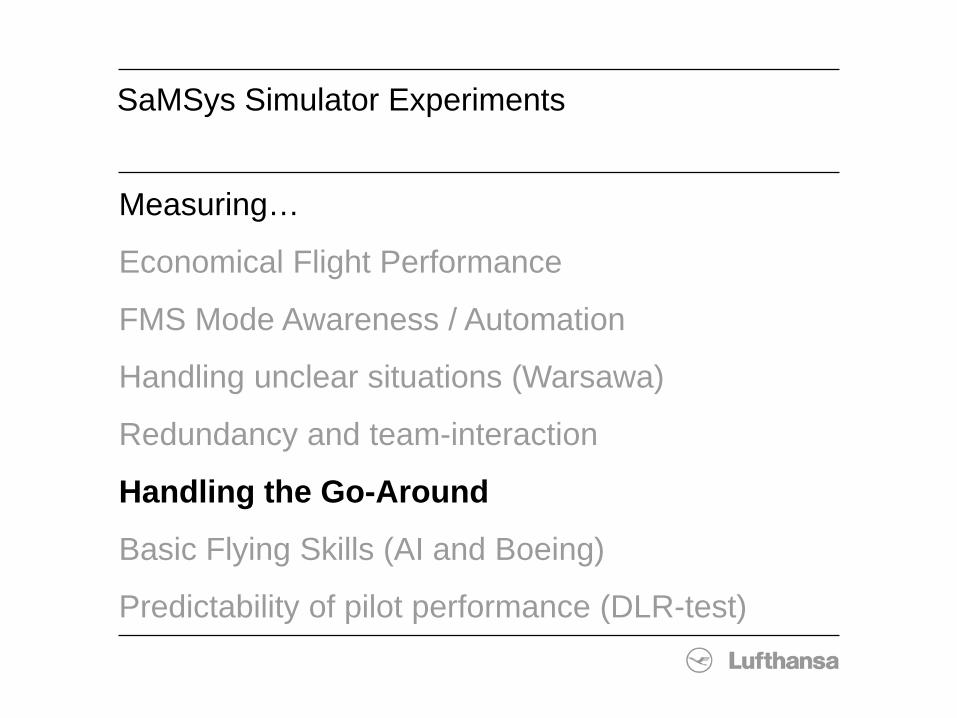
SaMSys Simulator Experiments
Measuring…
Economical Flight Performance
FMS Mode Awareness / Automation
Handling unclear situations (Warsawa)
Redundancy and team-interaction
Handling the Go-Around
Basic Flying Skills (AI and Boeing)
Predictability of pilot performance (DLR-test)

Technische Universität Berlin
Go-Around Analysis(MSc of Alexander Schmidt)
a) 1 A340-600 captain (3,7%) performs the Go-Around correctly.10 A320-F/O (33%) perform the Go-Around correctly.
b) In general more than one SOP-violation per Go-Around Average: A340-600 Cpt.: 2, A320 F/O: 1,3.
c) Common SOP violations:• „Missed Appr. Proc.“ not correct („NAV-Mode“ not activated).• Flaps not operated according SOP.• Thrust Reduction to late and/or MCT is selected instead of CLB thrust.• Vertical speed is not reduced during the last 1000ft before reaching
Go-Aroud Altitude.
98

Go Around CampaignFRA CF, Annina Müller23. Februar 2010Page 99
Fligth Recorder Data Analysis
Only 5% of all Go-Arounds are flown correctly.
In average 2,7 SOP-violations can be observed per Go-Around.
Analysis of 150 Go-Arounds showed 415 SOP-violations.
Maximum number of violations per Go-Around: 10.
Go Around CampaignFRA CF, Annina Müller23. Februar 2010Page 100 100
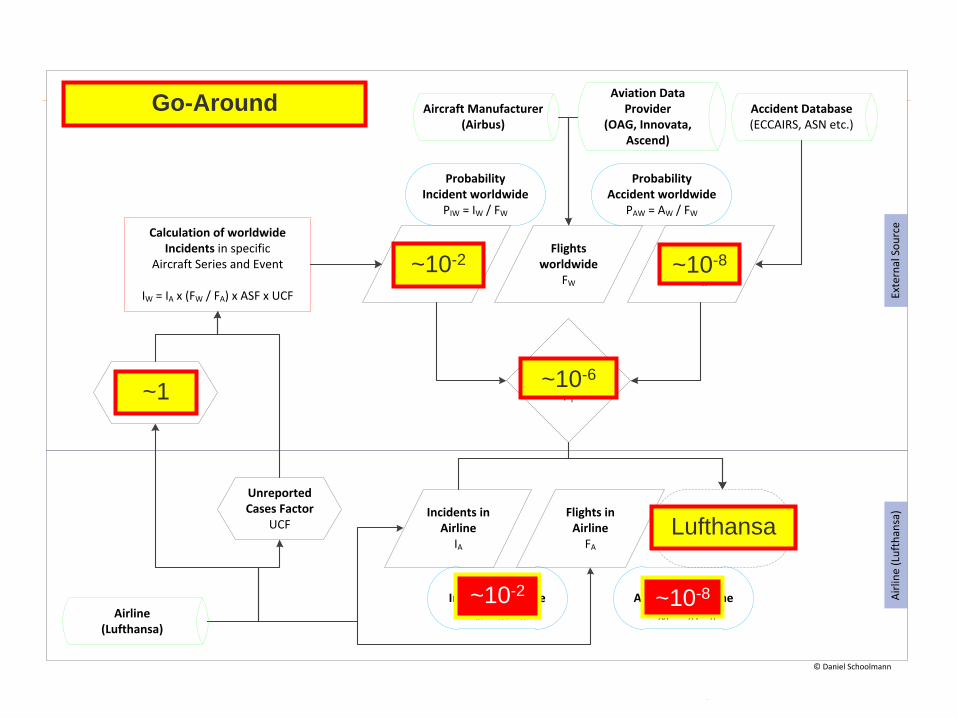
Exte
rnal
Sou
rce
Airli
ne (L
ufth
ansa
)Flights in Airline
FA
SPI calculation for a specific aircraft series and event
Flights worldwide
FW
Airline Safety Factor
ASF
Incidents in Airline
IA
Incidents worldwide
IW
Calculation of worldwide Incidents in specific
Aircraft Series and Event
IW = IA x (FW / FA) x ASF x UCF
Accidents worldwide
AW
Transition Probability
PT
ProbabilityAccident in Airline
PAA = AA / FA
Accidents in Airline(theoretical)AA = IA x PT
ProbabilityIncident worldwide
PIW = IW / FW
ProbabilityAccident worldwide
PAW = AW / FW
ProbabilityIncident in Airline
PIA = IA / FA
Unreported Cases Factor
UCF
© Daniel Schoolmann
Accident Database(ECCAIRS, ASN etc.)
Aviation Data Provider
(OAG, Innovata, Ascend)
Aircraft Manufacturer (Airbus)
Airline(Lufthansa)
Go-Around
~1 ~10-6
~10-2 ~10-8
~10-2 ~10-8
Lufthansa

Calculations:R ~10E-8
Is this result acceptable ?…according:
ICAOIATA
EASALH
Calculations:R ~10E-8
Is this result acceptable ?…according:
ICAO OKIATA OK
EASA CRITICALLH NOT ACCEPTABLE

…2014: B767 Go Around:
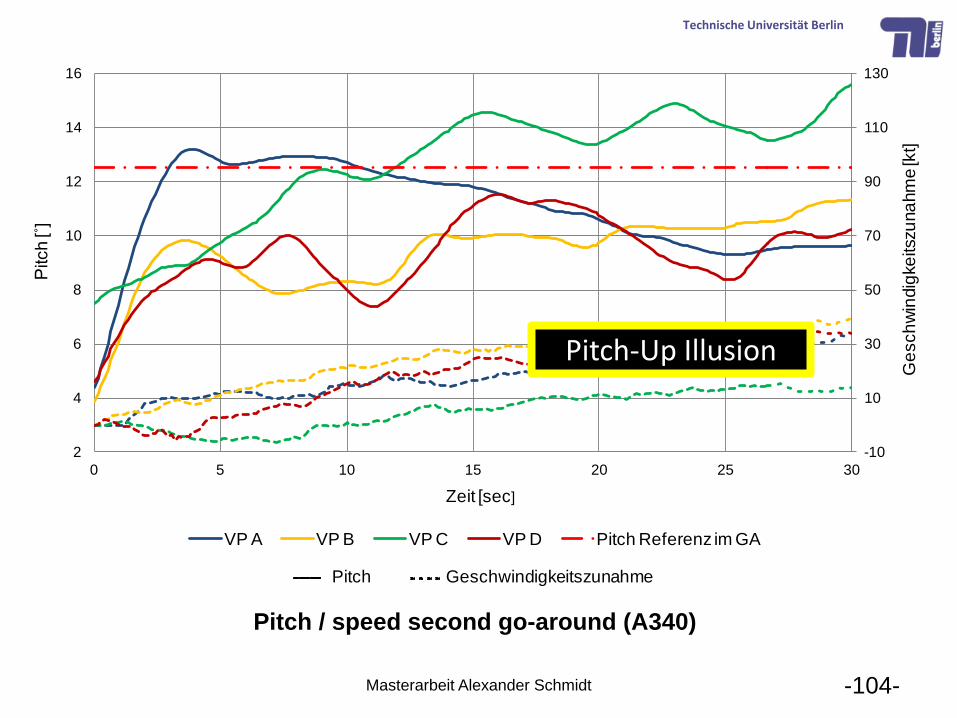
-104-
Technische Universität Berlin
Masterarbeit Alexander Schmidt
Pitch / speed second go-around (A340)
-10
10
30
50
70
90
110
130
2
4
6
8
10
12
14
16
0 5 10 15 20 25 30
Ges
chw
indi
gkei
tszu
nahm
e [k
t]
Pitc
h [˚]
Zeit [sec]
VP A VP B VP C VP D Pitch Referenz im GA
Pitch Geschwindigkeitszunahme
Pitch-Up Illusion

Exceeding max. flap speed causing flaps locked
Flight to the Alternate
Landing with less than < 5 min. remaining flight time

25.07.2016Seite 106
Bitte diesen Text mit dem Präsentationstitel überschreibenDeutsche Lufthansa AG
Flight Safety Research
Handling of non-standard / complex Abnormals in a realistic
environment
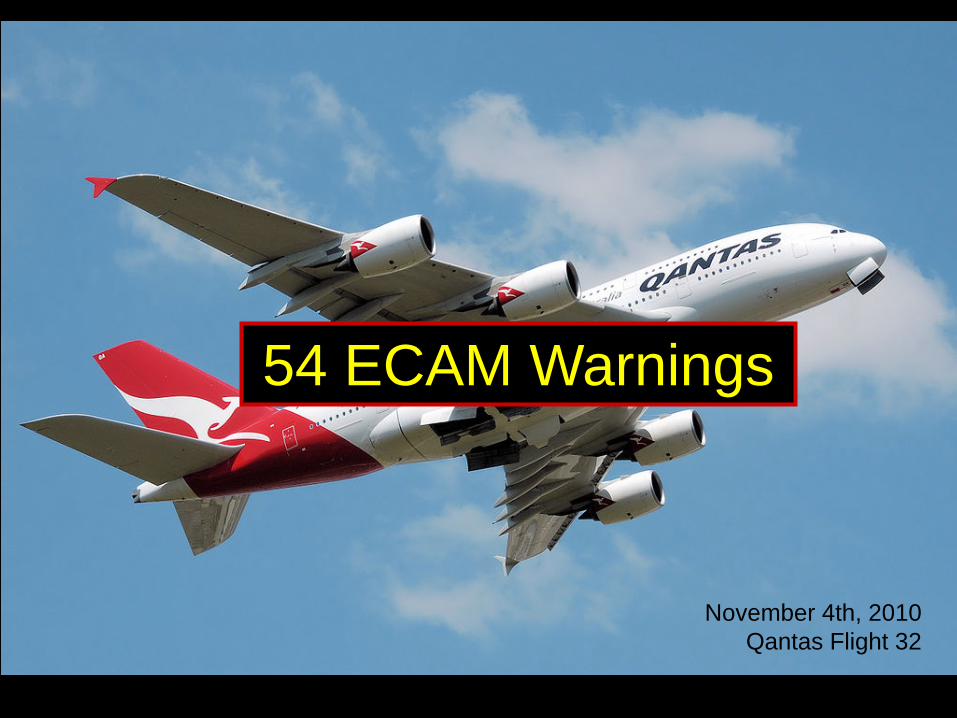
November 4th, 2010 Qantas Flight 32
54 ECAM Warnings


Multiple Failures
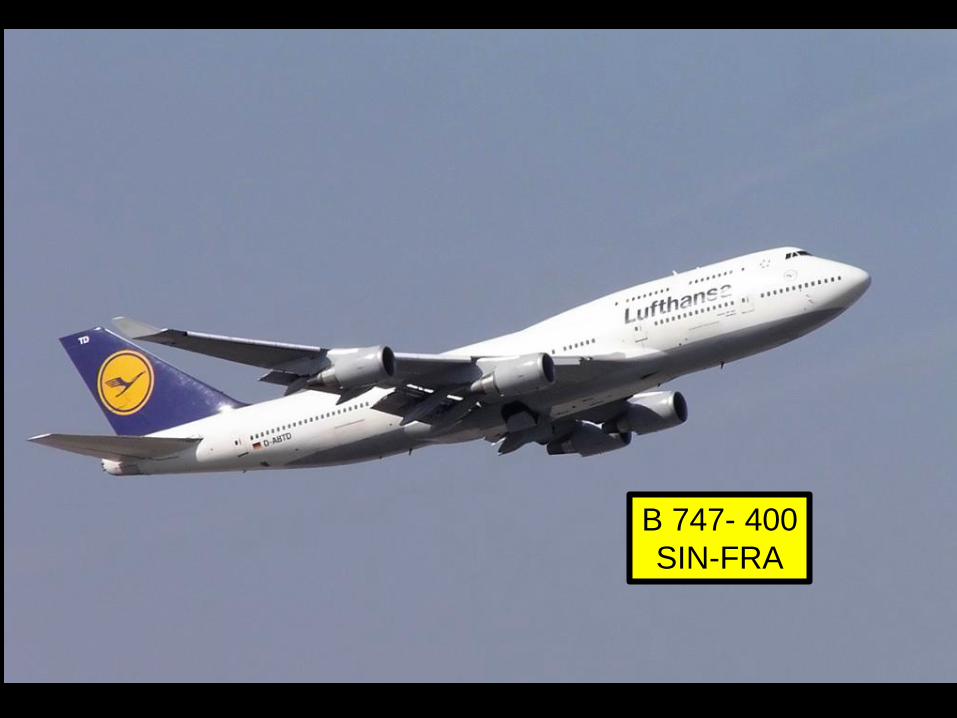
B 747- 400SIN-FRA

DET FIRE/OVHT 1
HYD OVHT SYS 1
BLEED 1 OVHT
BLEED HP ENG 1
BLD 1 OVHT/PRV
ENG 1 OVHT LP A
ENG 1 OVHT LP B
ENG 1 FIRE LP A
ENG 1 FIRE LP B
OVHT ENG 1 NAC
FUEL SPAR VLV 1
ENG 1 VIB
.....
EICAS Caution and Advisory Messages:

4 Pilots in the Cockpit

Time versus Decision-Making
SAMSYS II Versuchsreihe | E. Schubert | Institut für Luft- und Raumfahrt | Fachgebiet Flugführung und LuftverkehrSeite 114
Start of the scanario:Airports: New York orNice 1h remaining fuel
Event:Hydraulic fluid loss (>10-5) => landing gear problemNOSEGEAR UNLOCKEDGo Around
Consequence:remaining flight time ~40min.
(~80% fuel flow increse)
During the second ApproachSLATS LOCKED
Malfunction Probability: ~1 in 10 Million (10E-7)

IATA OPS-Conference | Kuala LumpurApril 1st, 2014FRA CF/J, SaMSys
Simulator Study – Set up No. 2 (A340-600)
JFK Carnarsie-VOR Appr.:Arrival Fuel >7,500 kg ~1h+
Nose Landing Gear unlocked Slats locked
abort the approach,determine landing conf.
calculate LDR
GREEN HYD lost go around,
gravity gear extension
A320

A320

„Quality ninethree kilo“
„Continental one ooh six“
„Whitestarone eight“
„Lufthansa one seven eight niner“
„Singaporethree two eight“
„Eurotrans zero seven“
„Lufthansa seven three one“
„Lufthansa seven two seven“
Traffic Scenario
realisticATC environment
Technische Universität Berlin
-2.5 -2 -1.5 -1 -0.5 0 0.5 1 1.5 2
x 105
-5
0
5
10
15
20x 10
4
X [ft]
Y [f
t]
Topansicht
EDDM 26R
MIQ
DM431
DM429
GUDEGMAGAT
WLD
BURAM
XERUM
A320A340-600
119
Datarecording(A340 & A320 FFS)
Raw data approaches

30x A340 Crews – Flight Tracks KJFK
Simulator Study II A346
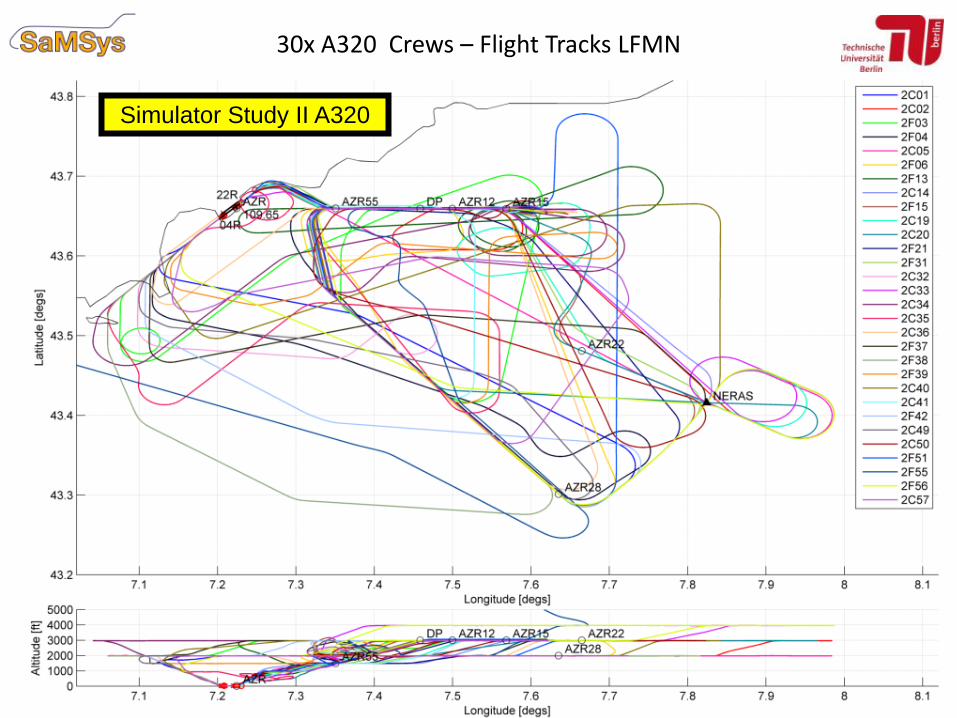
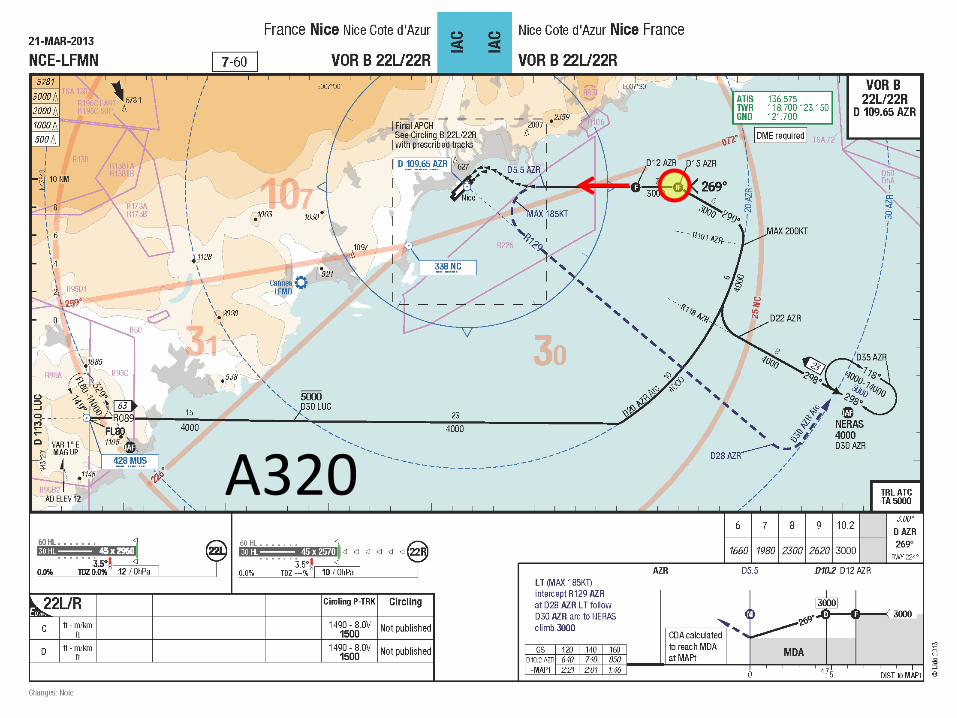
30x A320 Crews – Flight Tracks LFMN
Simulator Study II A320
25.07.2016Seite 122
Bitte diesen Text mit dem Präsentationstitel überschreibenDeutsche Lufthansa AG
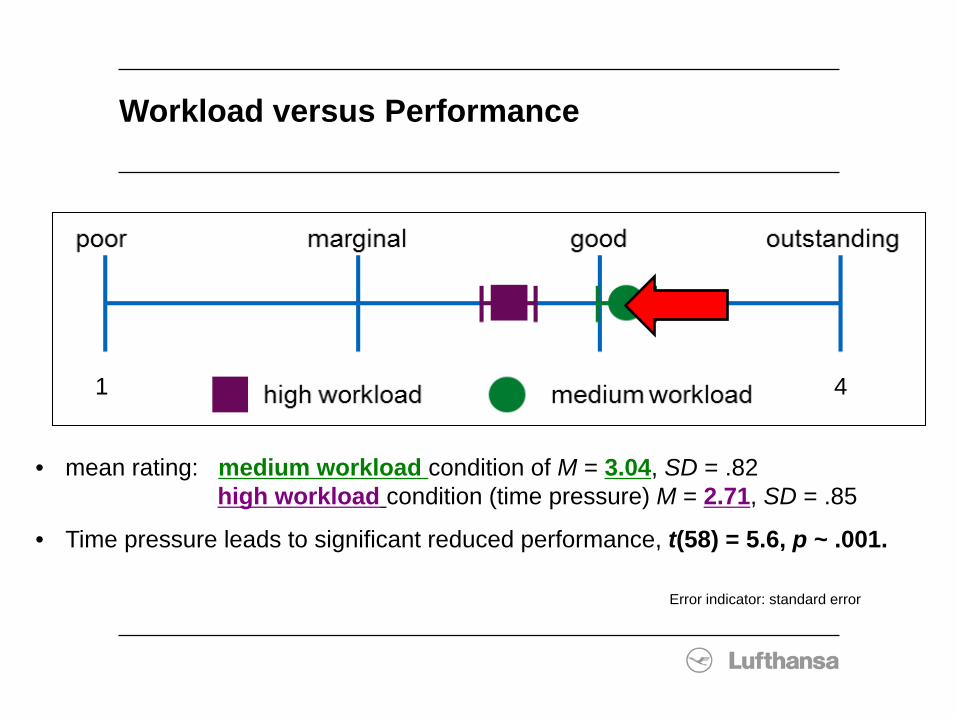
Workload versus Performance
• mean rating: medium workload condition of M = 3.04, SD = .82 high workload condition (time pressure) M = 2.71, SD = .85
• Time pressure leads to significant reduced performance, t(58) = 5.6, p ~ .001.
Error indicator: standard error
41

25.07.2016Seite 123
Bitte diesen Text mit dem Präsentationstitel überschreibenDeutsche Lufthansa AG
Performance under Stress
workload
performance
ΣPM
PF

During G/A:Inefficient and disturbing callout: “SPEED“
Supporting callout: “INCREASE PITCH + SET CLB THR“
25.07.2016Seite 125
Bitte diesen Text mit dem Präsentationstitel überschreibenDeutsche Lufthansa AG
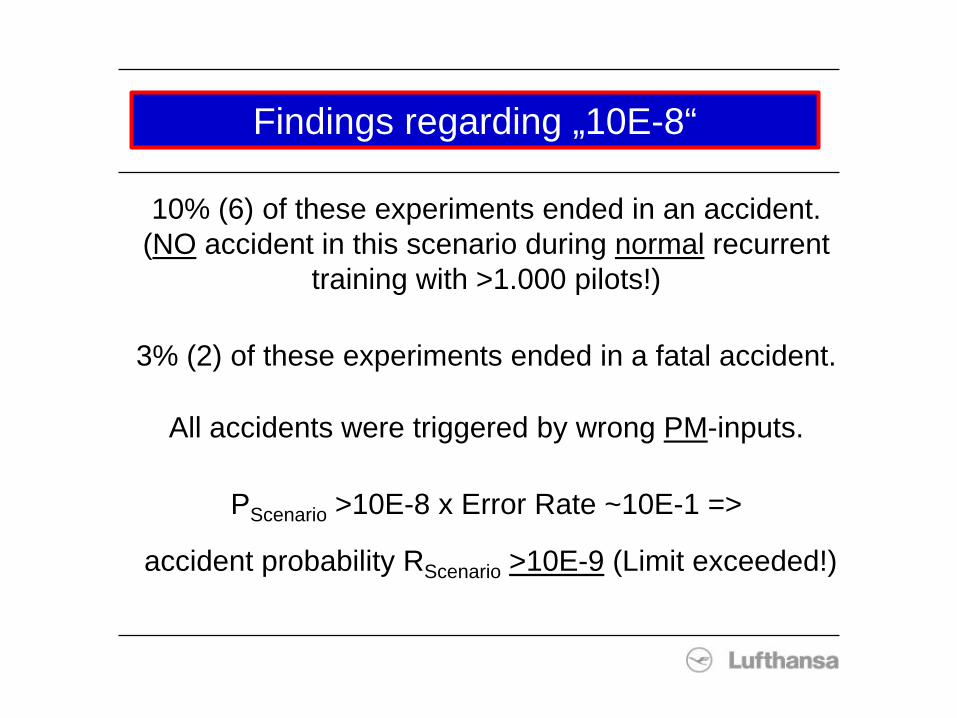
Findings regarding „10E-8“
10% (6) of these experiments ended in an accident. (NO accident in this scenario during normal recurrent
training with >1.000 pilots!)
3% (2) of these experiments ended in a fatal accident.
All accidents were triggered by wrong PM-inputs.
PScenario >10E-8 x Error Rate ~10E-1 =>
accident probability RScenario >10E-9 (Limit exceeded!)

Calculations:R >10E-9
Is this result acceptable ?…according:
ICAOIATA
EASALH
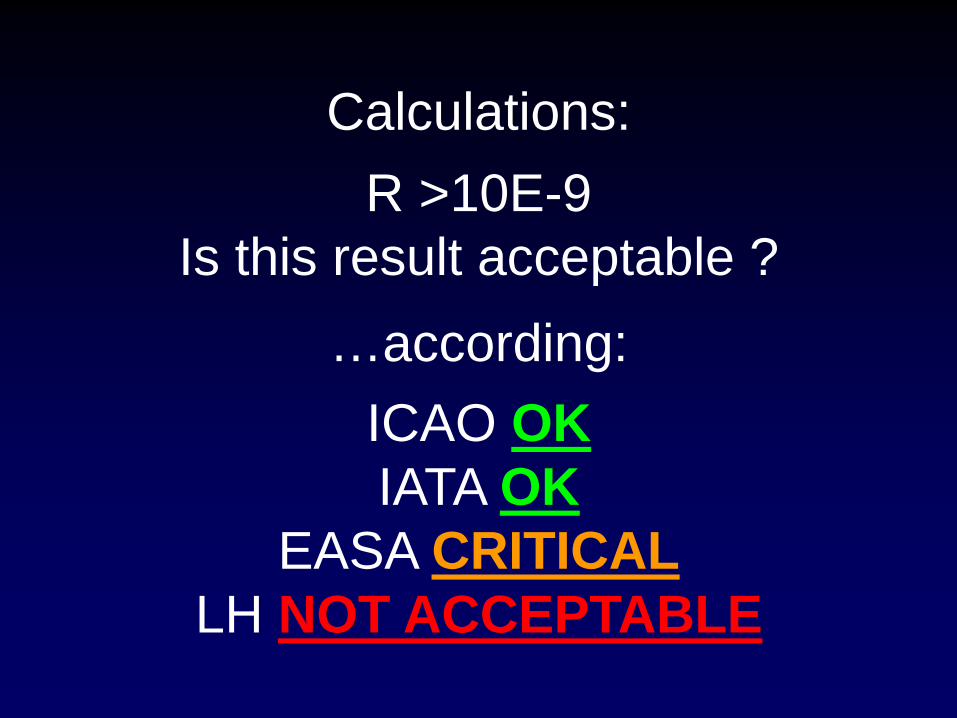
Calculations:R >10E-9
Is this result acceptable ?…according:
ICAO OKIATA OK
EASA CRITICALLH NOT ACCEPTABLE

Challenge for Flight Operations in the 21st Century
measuring the actualrisk level
Identifying Deviations (Δ)
Corrective action(s)
Defining an acceptable level of
Safety ALoSP (Limit)

25.07.2016Seite 129
Bitte diesen Text mit dem Präsentationstitel überschreibenDeutsche Lufthansa AG
Ground Ops
Technic Flight Ops
Training Selection
Threats Threats Threats
Crew
Errors
Risk

25.07.2016Seite 130
Bitte diesen Text mit dem Präsentationstitel überschreibenDeutsche Lufthansa AG
Findings regarding „10E-8“
Standard Airbus (or Boeing) Type-Rating Courses arenot sufficient for an ALoSP of „10E-8“.
Manual / Basic Flying Skills have to be improved: Sidestick Handling Raw Data Flying A346-Landing Technique X-Wind Handling Go Around Handling
Complex abnormals are not handledsufficiently well under time pressure.
PMs showed deficiencies in supporting / controlling the PF.
25.07.2016Seite 131
Bitte diesen Text mit dem Präsentationstitel überschreibenDeutsche Lufthansa AG
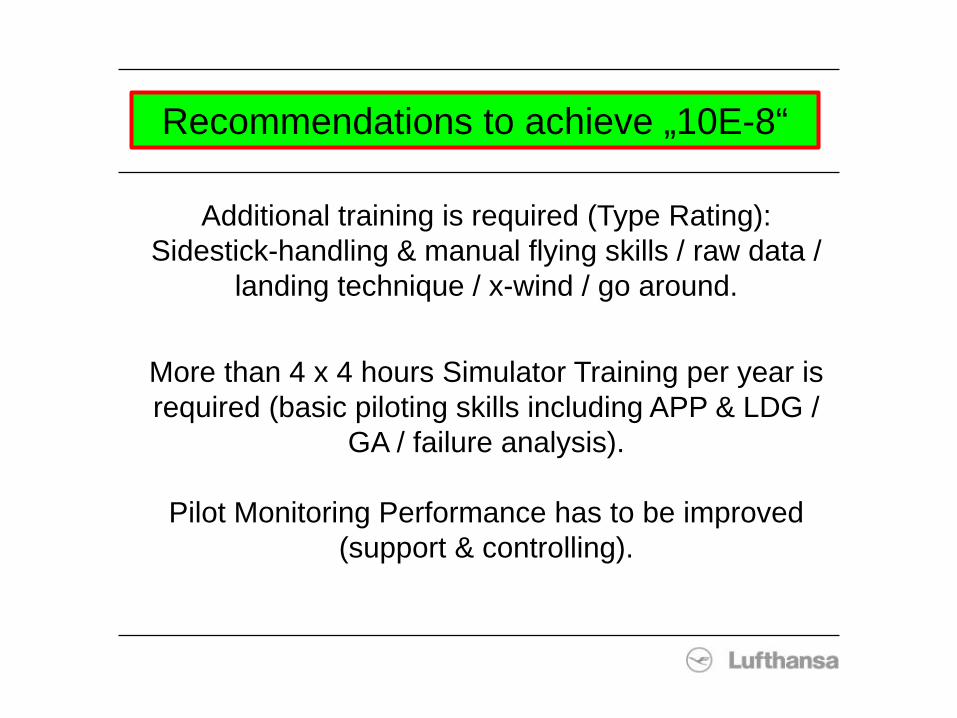
Recommendations to achieve „10E-8“
Additional training is required (Type Rating):Sidestick-handling & manual flying skills / raw data /
landing technique / x-wind / go around.
More than 4 x 4 hours Simulator Training per year isrequired (basic piloting skills including APP & LDG /
GA / failure analysis).
Pilot Monitoring Performance has to be improved(support & controlling).

25.07.2016Seite 132
Bitte diesen Text mit dem Präsentationstitel überschreibenDeutsche Lufthansa AG
Recommendations to achieve „10E-8“
Ambigious / complex malfuctions have to be trained in the simulator under realistic conditions (ATC).
Fallback Strategies for complex malfuctionsare required.
A procedure TIME CRITICAL LANDING is required.
Minimum fuel at landing 45 minutes.
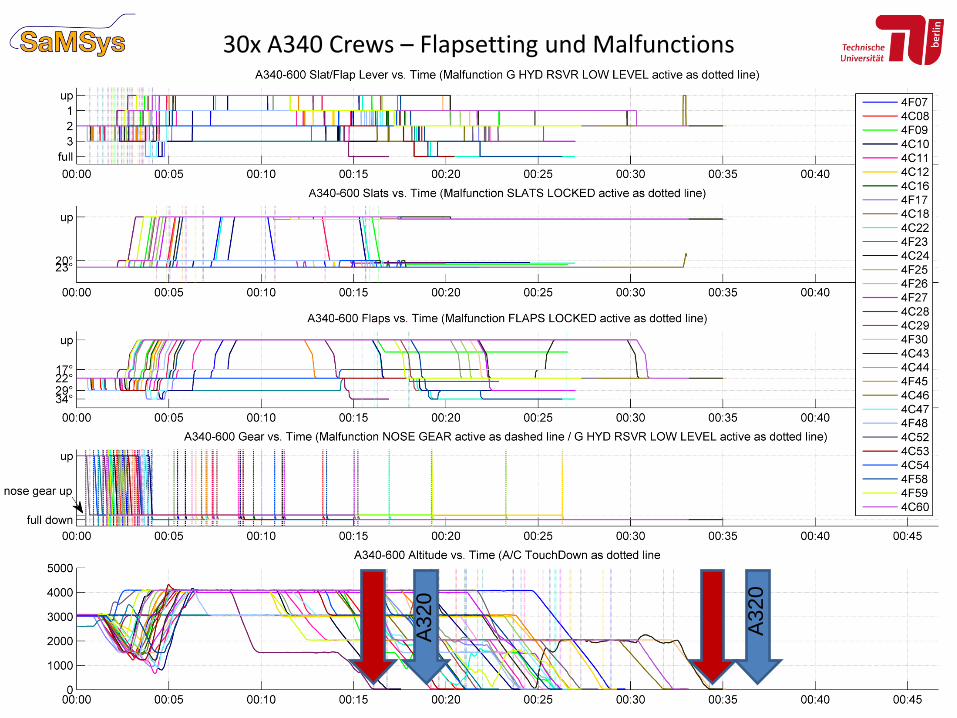
30x A340 Crews – Flapsetting und Malfunctions
133
A320
A320

25.07.2016Seite 134
Bitte diesen Text mit dem Präsentationstitel überschreibenDeutsche Lufthansa AG
SAMSYS II Remaining Fuel A346 (600kg for Final APP, additional fuel calculation with 180kg/min)
Run VPId Min[kg] Time[min]7 4C10 4410 26
33 4C29 2649 143 4C08 2380 14
54 4C53 2161 1313 4C16 1986 1256 4C54 1918 1217 4C18 1809 1259 4F58 1738 1121 4F23 1719 1123 4C24 1460 105 4F09 1445 10
39 4C44 1408 1049 4F48 1383 109 4C11 1380 10
15 4F17 1224 925 4F25 1189 731 4C28 1172 727 4F26 1131 761 4F59 1111 729 4F27 1037 746 4C47 930 641 4F45 747 519 4C22 711 51 4F07 677 5
11 4C12 612 352 4C52 528 343 4C46 320 264 4C60 169 135 4F30 130 137 4C43 0 0
Run VPId Min[kg] Time[min]7 4C10 2810 17
33 4C29 1049 73 4C08 680 5
54 4C53 561 413 4C16 386 356 4C54 318 217 4C18 209 159 4F58 138 121 4F23 119 123 4C24 0 05 4F09 0 0
39 4C44 0 049 4F48 0 09 4C11 0 0
15 4F17 0 025 4F25 0 031 4C28 0 027 4F26 0 061 4F59 0 029 4F27 0 046 4C47 0 041 4F45 0 019 4C22 0 01 4F07 0 0
11 4C12 0 052 4C52 0 043 4C46 0 064 4C60 0 035 4F30 0 037 4C43 0 0
Est. Fuel at T/D KJFK:
45min.
Est. Fuel at T/D KJFK:30min.
Additional Pattern
possible
Additional Pattern
possible

25.07.2016Seite 135
Bitte diesen Text mit dem Präsentationstitel überschreibenDeutsche Lufthansa AG
Recommendations to achieve „10E-8“
Prerequisite for the additonal training is a positive, relaxed and friendly learning atmosphere.
Mistakes and errors have to be expected, they are„normal“ and an important fundament for performance
improvement.
A simulator session with complex and demandingcontent cannot be failed!
…required for an ALoSP beyond „10E-7“

…there are still „low hanging fruits“:

25.07.2016Seite 137
Bitte diesen Text mit dem Präsentationstitel überschreibenDeutsche Lufthansa AG
Evidence Based Risk Management
Diagnostically conclusive Pilot selectionshould be mandatory
Improved initial training and type ratingIncreased and realistic recurrent training
Min. 45 minutes fuel at Landing