Quantitative Risk Assessment - HySafehysafe.org/science/eAcademy/docs/3rdesshs/... · Quantitative...
113
7/30/2008 Quantitative Risk Assessment Jeffrey LaChance Sandia National Laboratories Presented at the Third European Summer School Hydrogen Safety University of Ulster 28 July 2008
Transcript of Quantitative Risk Assessment - HySafehysafe.org/science/eAcademy/docs/3rdesshs/... · Quantitative...

7/30/2008
Quantitative Risk Assessment
Jeffrey LaChanceSandia National Laboratories
Presented at the Third European Summer School
Hydrogen SafetyUniversity of Ulster
28 July 2008

7/30/2008
Sandia’s Efforts in Hydrogen Safety
• Work performed under U.S. DOE Hydrogen, Fuel Cells & Infrastructure Technologies Program, Multi-Year Research, Development and Demonstration Plan– Hydrogen Safety, Codes & Standard R&D
• Sandia National Laboratories is developing the scientific basis for assessing credible safety scenarios and providing the technical data for use in the development of codes and standards– Includes experimentation and modeling to
understand behavior of hydrogen for different release scenarios
– Use of Quantitative Risk Assessment (QRA) methods to help establish requirements in codes and standards
7/30/2008
Outline
• Risk Concepts• Basics of QRA• Data Analysis• Risk and Harm Criteria• Application of QRA to Codes and
Standards
7/30/2008
Hydrogen Safety
• The expanded use of hydrogen will include new challenges (e.g., very high pressures) that will require design features and operational requirements to manage the risk to acceptable levels
• Quantitative risk assessment (QRA) provides a means to demonstrate hydrogen safety
7/30/2008
Safety and Risk• Definition:• Safety is freedom from unacceptable risk (ISO/IEC Guide
51:1999)• This effectively means that:• Risk is the technical (quantitative) measure of safety as safety
cannot be calculated while risk can• Society accepts the fact that there is neither absolute safety
nor zero risk• Society, de facto, establishes acceptable levels of risk or risk
acceptance criteria• Definition:• Risk criteria – terms of reference by which the significance of
risk is assessed (ISO/IEC Guide 73:2002)• Conclusion :• Safety depends on acceptable level of risk, i.e. ‘terms of
reference’ that are subject to public perception or political / regulatory decisions
7/30/2008
Risk
Risk = Frequency X Consequence from all accidents
• Requires definition of important consequences• Requires definition of acceptable risk levels • Requires comprehensive evaluation of all
possible accidents• Requires data analysis for quantification of QRA
models • Accounts for parameter and modeling
uncertainty present in analysis
7/30/2008
Risk Management
• Definition from ISO/IEC Guide 73: 2002:– “coordinated activities to direct and control an
organization with regard to risk. Risk management generally includes risk assessment, risk treatment, risk acceptance and risk communication”
• Involves several steps:– Risk analysis – identification of hazards– Establish controls for each hazard– Risk assessment
7/30/2008
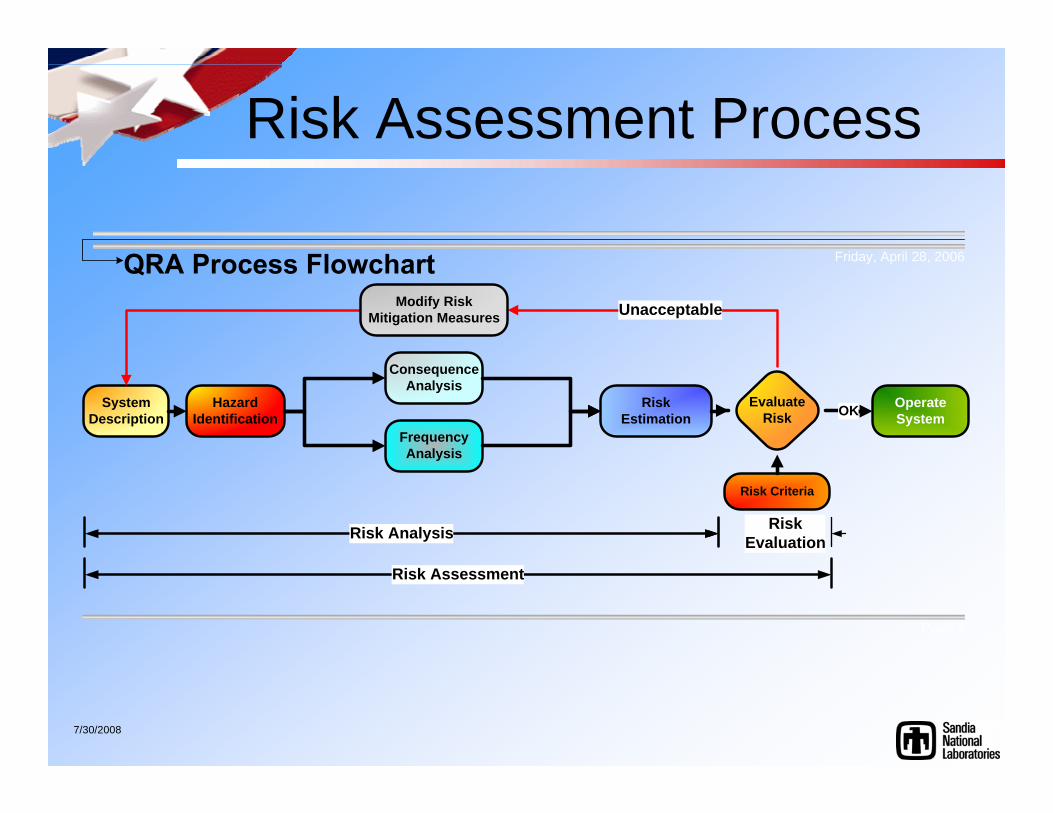
Risk Assessment Process
System Description
Hazard Identification
Consequence Analysis
Frequency Analysis
Risk Estimation
Operate System
EvaluateRisk OK
UnacceptableModify Risk Mitigation Measures
Risk Criteria
Risk Analysis RiskEvaluation
Friday, April 28, 2006
Page 4
Risk Assessment
7/30/2008
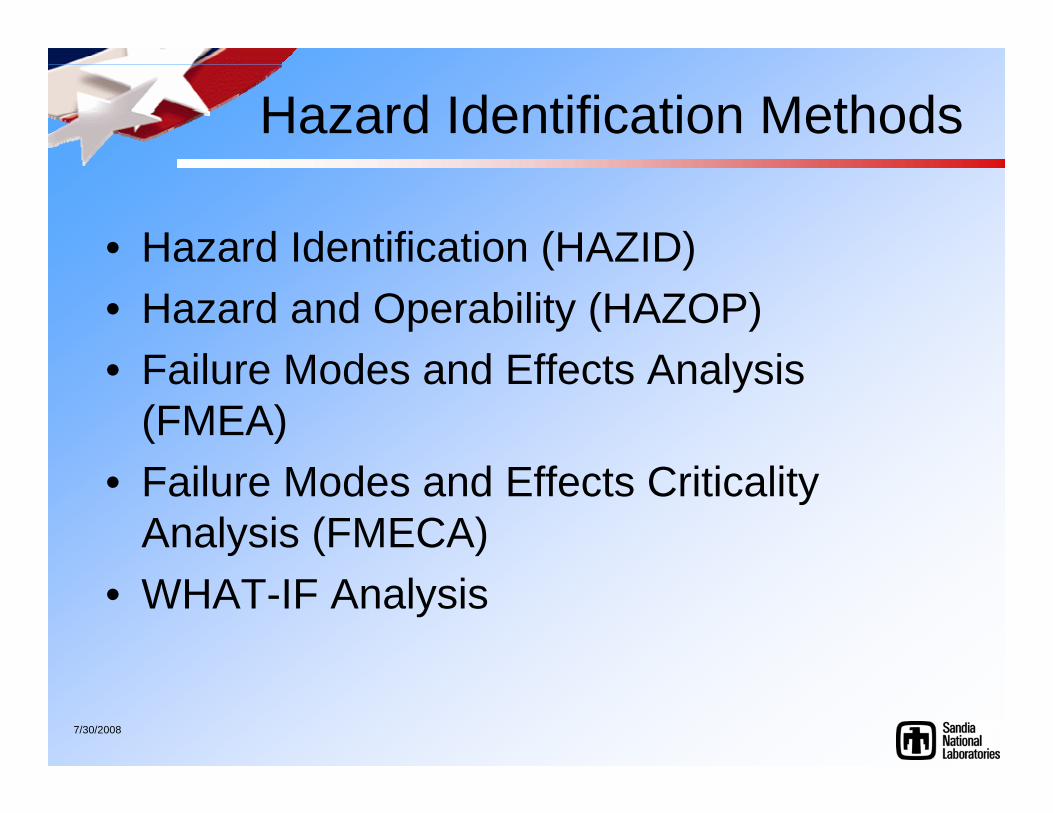
Hazard Identification Methods
• Hazard Identification (HAZID)• Hazard and Operability (HAZOP)• Failure Modes and Effects Analysis
(FMEA)• Failure Modes and Effects Criticality
Analysis (FMECA)• WHAT-IF Analysis
7/30/2008
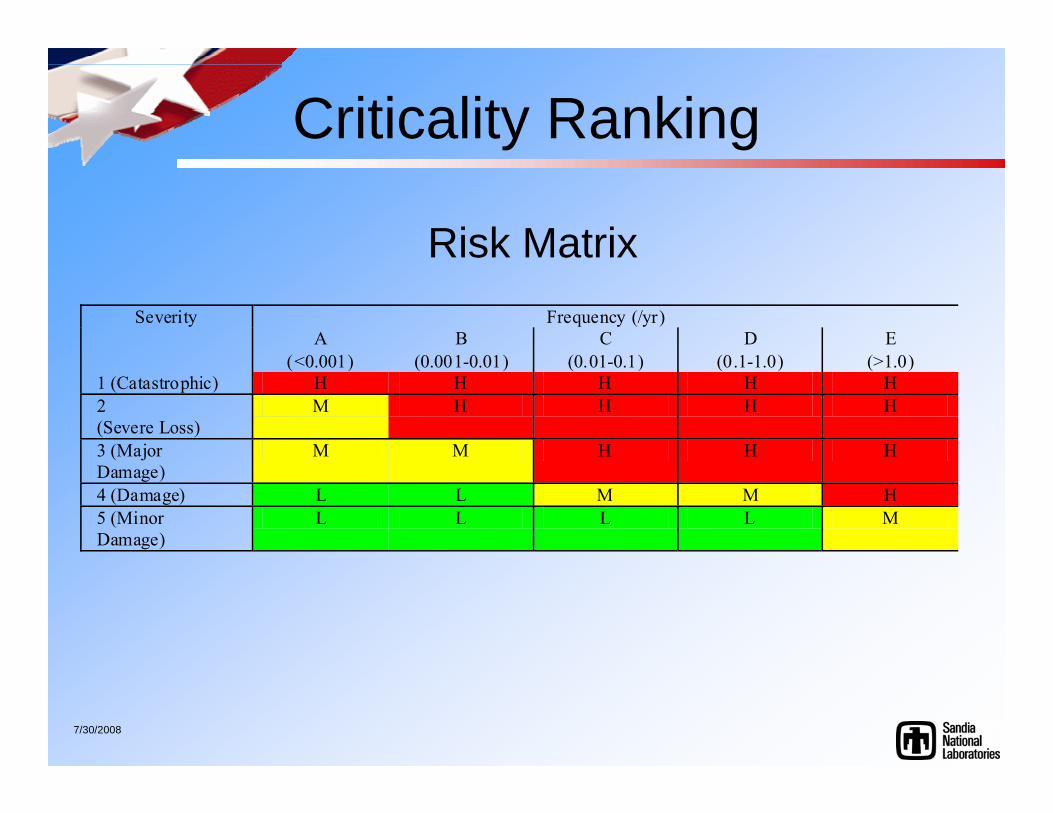
Criticality Ranking
Frequency (/yr) Severity A
(<0.001) B
(0.001-0.01) C
(0.01-0.1) D
(0.1-1.0) E
(>1.0) 1 (Catastrophic) H H H H H 2 (Severe Loss)
M H H H H
3 (Major Damage)
M M H H H
4 (Damage) L L M M H 5 (Minor Damage)
L L L L M
Risk Matrix
7/30/2008
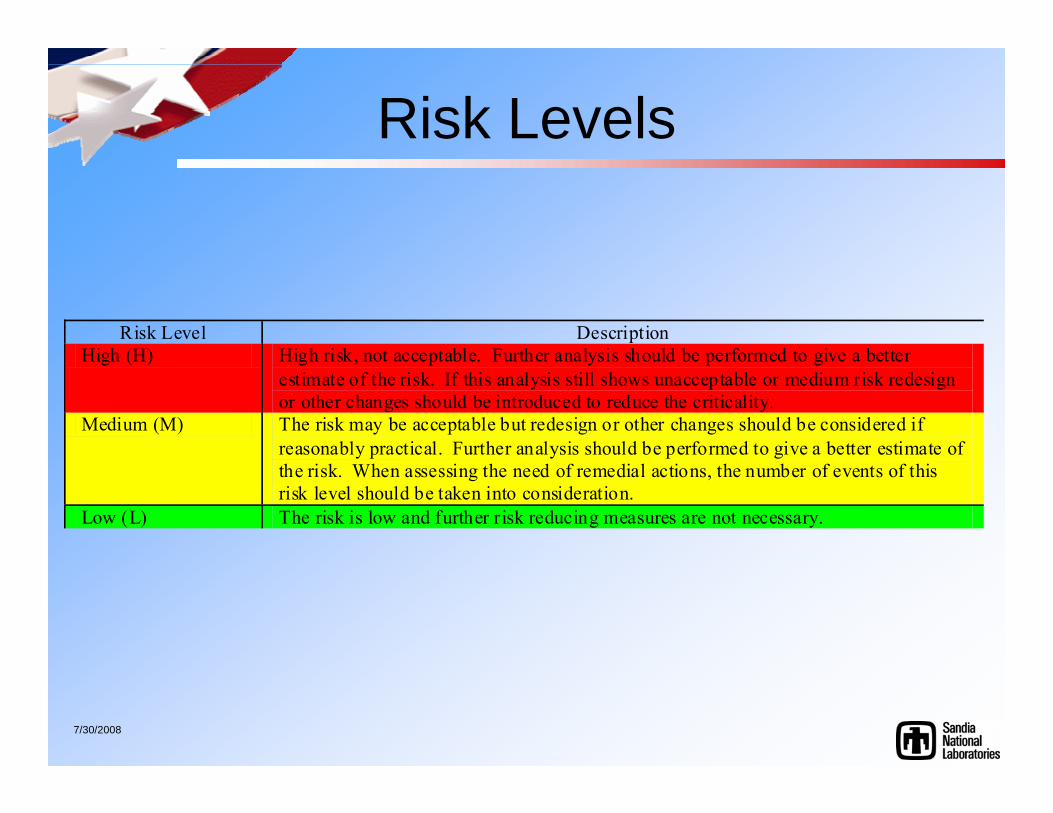
Risk Levels
Risk Level Description High (H) High risk, not acceptable. Further analysis should be performed to give a better
estimate of the risk. If this analysis still shows unacceptable or medium risk redesign or other changes should be introduced to reduce the criticality.
Medium (M) The risk may be acceptable but redesign or other changes should be considered if reasonably practical. Further analysis should be performed to give a better estimate of the risk. When assessing the need of remedial actions, the number of events of this risk level should be taken into consideration.
Low (L) The risk is low and further risk reducing measures are not necessary.
7/30/2008
Quantitative Risk Assessment
• QRA models the progression of accidents, and combines the frequencies and consequence of those accidents to estimate risk
• The results of a QRA can provide:– Verification that facility meets an accepted risk criteria– Identification of important accidents, components,
operations contributing to risk– Identification and evaluation of risk reduction and
control measures– Identification of risk management requirements (e.g.,
maintenance intervals)• Can be used to generate risk-informed code and
standard requirements
7/30/2008
QRA Methodology
• Initiating Event (IE) Identification –hazard analysis• Event Tree Analysis (ETA) – accident sequence
progression• Fault Tree Analysis (FTA) – mitigation system failure
modes• Data Analysis – failure data for models• Human Reliability Analysis (HRA) – quantification of
human error probabilities• Consequence Evaluation – consequence of accident
scenarios• Quantification – evaluation of risk• Uncertainty Assessment – evaluation of uncertainties
and assumptions
7/30/2008
Initiating Events
• For hydrogen systems, usually consist of hydrogen leakage or rupture events– Full spectrum of leak sizes needs to be analyzed (
e.g., small, medium, large leak)– Can include events that result in system breach (e.g.,
transient that leads to overpressurization)• Accidents that lead to hydrogen explosions
(e.g.,air ingress into hydrogen compressor)• Others – any event that can lead to harm (e.g.,
chemical release from electrolyzer)
7/30/2008
Event Tree Analysis
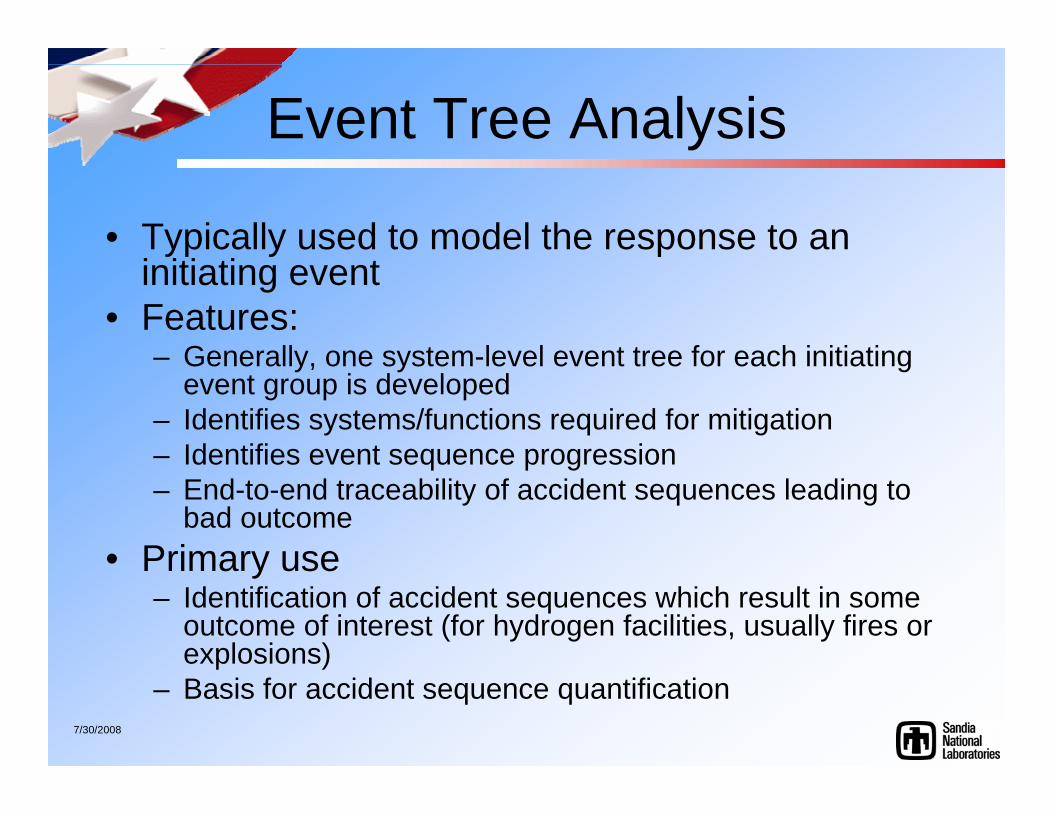
• Typically used to model the response to an initiating event
• Features:– Generally, one system-level event tree for each initiating
event group is developed– Identifies systems/functions required for mitigation– Identifies event sequence progression – End-to-end traceability of accident sequences leading to
bad outcome• Primary use
– Identification of accident sequences which result in some outcome of interest (for hydrogen facilities, usually fires or explosions)
– Basis for accident sequence quantification
7/30/2008
Required Knowledge
• Knowledge of accident initiators• Deterministic behavior during accidents• Knowledge of mitigating systems (frontline
and support) operation• Know the dependencies between systems• Identify any limitations on component
operations• Knowledge of procedures (system,
abnormal, and emergency)
7/30/2008
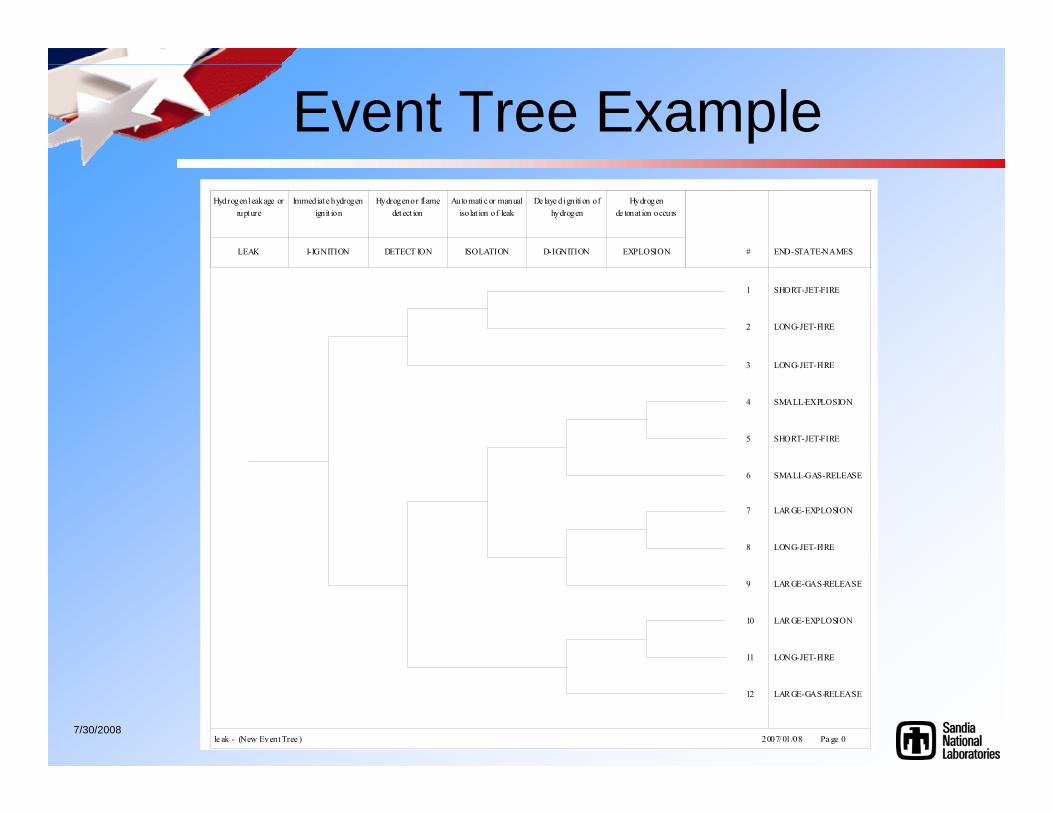
Event Tree Example
EXPLOSION
Hydrogende tonat ion occurs
D-IGNITION
De laye d igniti on ofhydrogen
ISOLATION
Automati c or manualisolat ion of leak
DETECT ION
Hydrogen or fl amedet ect ion
I-IGNITION
Immediat e hydrogenignit ion
LEAK
Hydrogen leakage orrupture
# END-STATE-NAMES
1 SHORT-JET-FIRE
2 LONG-JET-FIRE
3 LONG-JET-FIRE
4 SMALL-EXPLOSION
5 SHORT-JET-FIRE
6 SMALL-GAS-RELEASE
7 LAR GE-EXPLOSION
8 LONG-JET-FIRE
9 LAR GE-GAS-RELEASE
10 LAR GE-EXPLOSION
11 LONG-JET-FIRE
12 LAR GE-GAS-RELEASE
le ak - (New Event Tree ) 2007/01/08 Pa ge 0
7/30/2008
Fault Tree Analysis
• Deductive analysis (event trees are inductive)• Starts with undesired event definition• Used to estimate system unreliability (can also
be used to identify accident initiators)• Explicitly models multiple failures• Identify ways in which a system can fail• Models can be used to find:
– System “weaknesses”– System unreliability (failure probability)– Interrelationships between fault events
7/30/2008
FTA (cont.)
• Fault trees are graphic model of the various parallel and sequential combination of faults that will result in the occurrence of an undesired (top) event.
• Fault tree development moves from the top event to the basic faults which can cause it.
• Fault tree consists of gates which serve to permit or inhibit the passage of faults logic up the tree.
• Different types of gates are used to show the relationship of the input events to the higher output event.
• Fault tree analysis requires thorough knowledge of how the system operates and is maintained.
7/30/2008
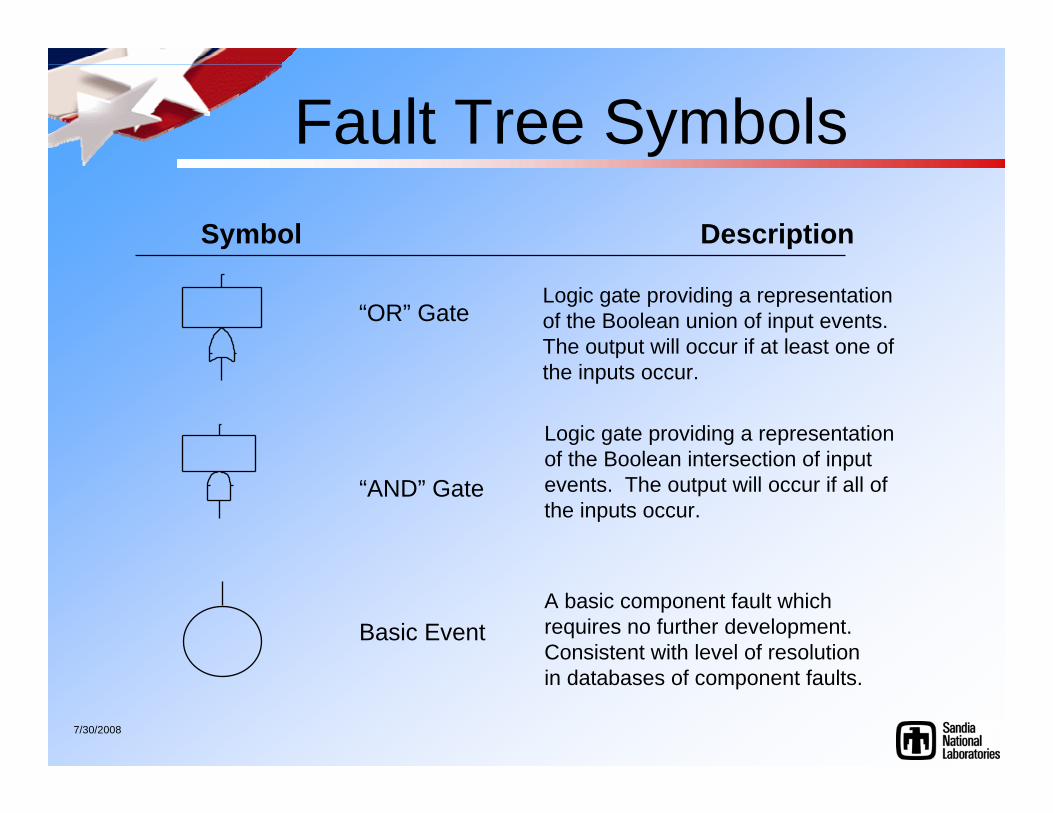
Fault Tree SymbolsSymbol Description
“OR” GateLogic gate providing a representation of the Boolean union of input events. The output will occur if at least one of the inputs occur.
“AND” Gate
Logic gate providing a representation of the Boolean intersection of input events. The output will occur if all of the inputs occur.
Basic EventA basic component fault which requires no further development.Consistent with level of resolutionin databases of component faults.
7/30/2008
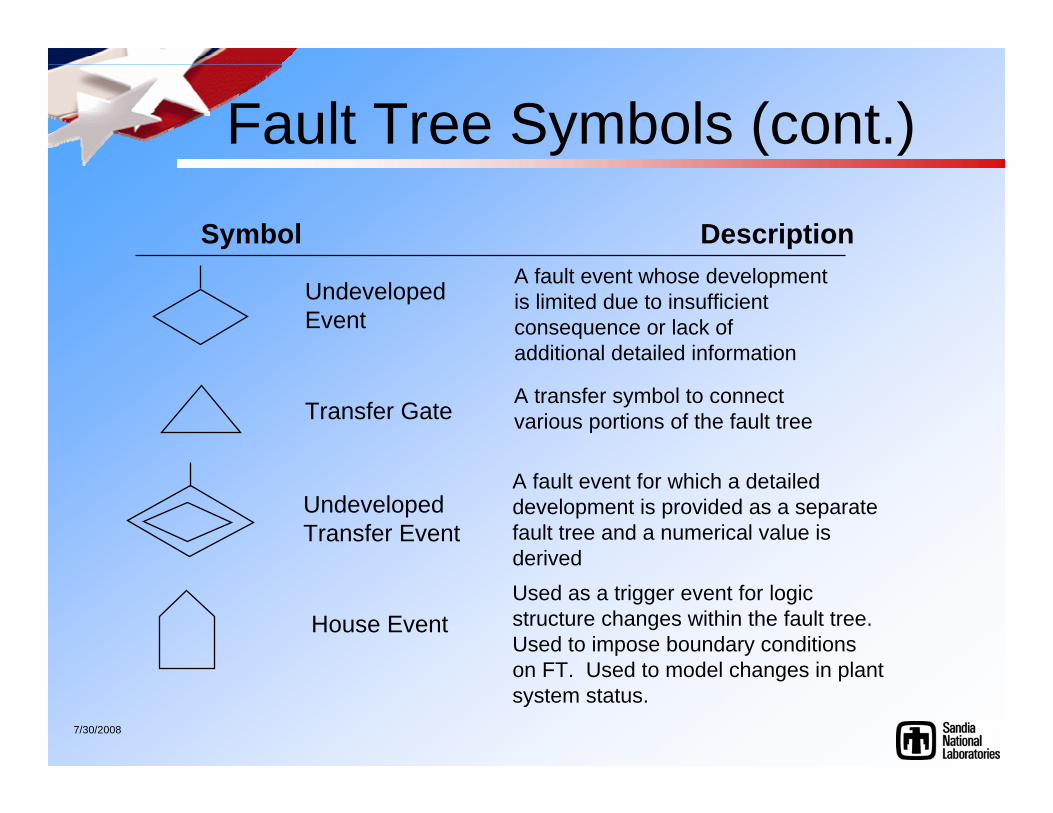
Fault Tree Symbols (cont.)
Symbol Description
UndevelopedTransfer Event
House Event
A fault event for which a detaileddevelopment is provided as a separate fault tree and a numerical value is derivedUsed as a trigger event for logicstructure changes within the fault tree.Used to impose boundary conditionson FT. Used to model changes in plantsystem status.
Transfer GateA transfer symbol to connect various portions of the fault tree
UndevelopedEvent
A fault event whose developmentis limited due to insufficientconsequence or lack of additional detailed information
7/30/2008
Typical Component Failure Modes
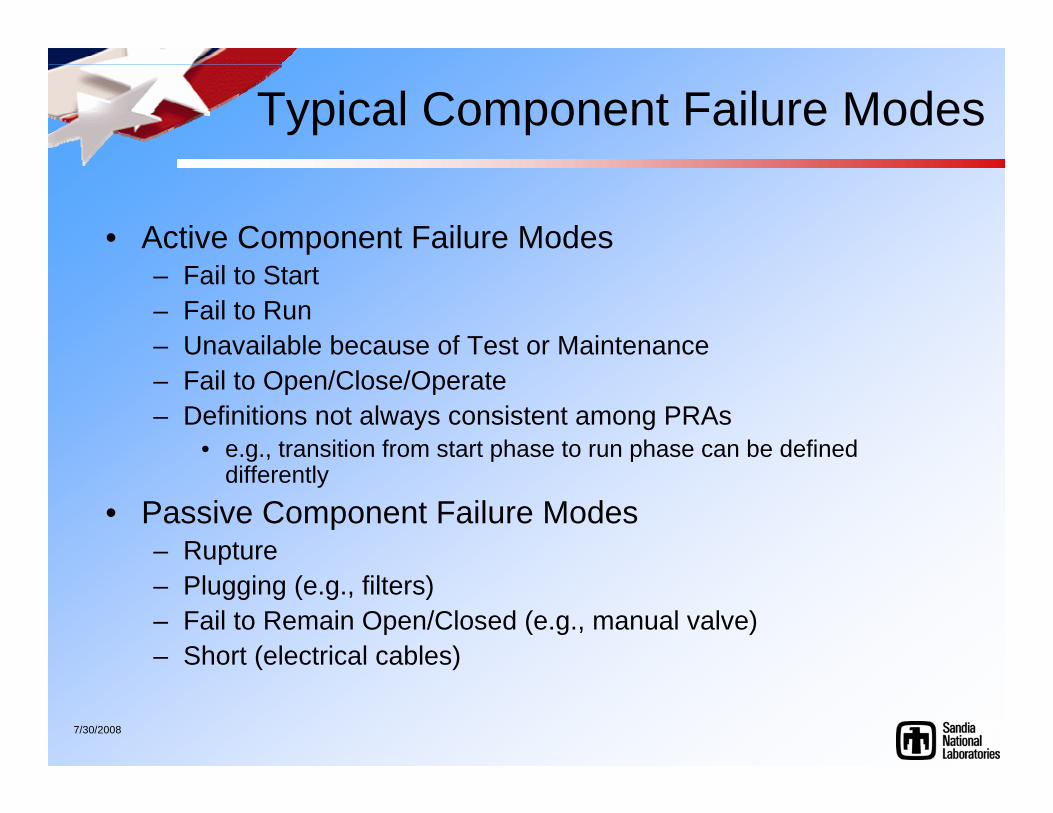
• Active Component Failure Modes– Fail to Start– Fail to Run– Unavailable because of Test or Maintenance– Fail to Open/Close/Operate– Definitions not always consistent among PRAs
• e.g., transition from start phase to run phase can be defined differently
• Passive Component Failure Modes – Rupture– Plugging (e.g., filters)– Fail to Remain Open/Closed (e.g., manual valve)– Short (electrical cables)
7/30/2008
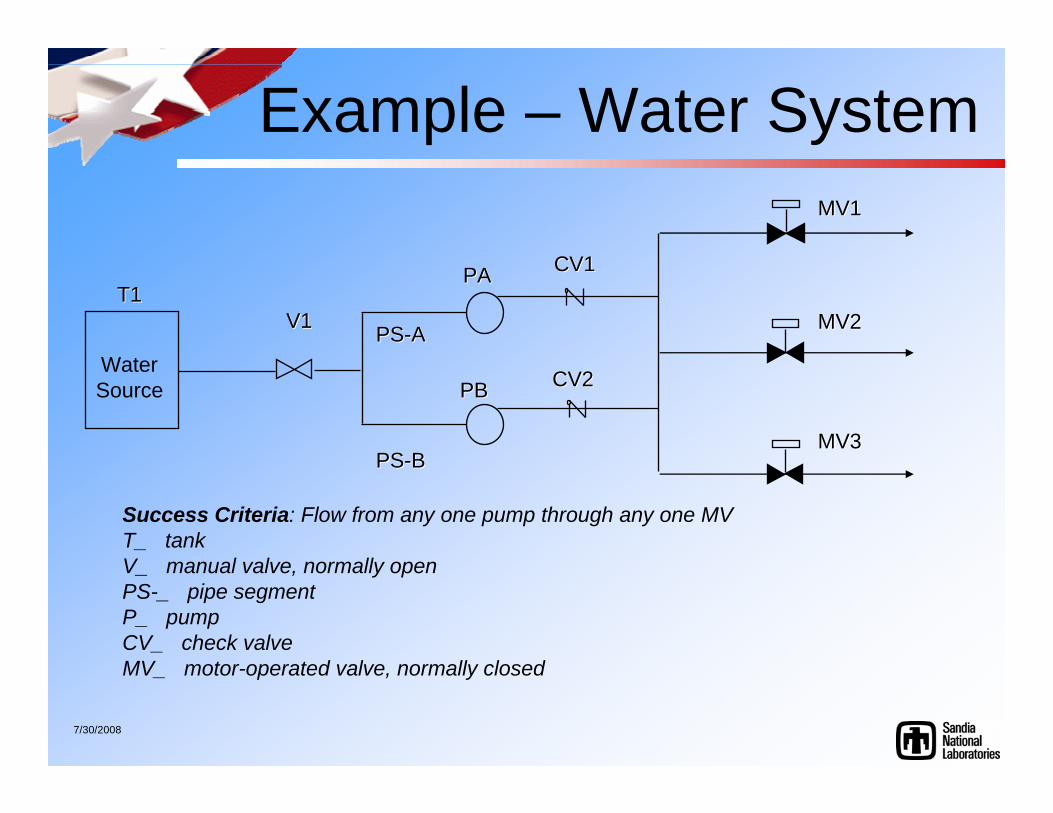
Example – Water SystemMV1MV1
T1T1
WaterSource
V1V1
PAPA
PBPB
PSPS--AA
PSPS--BB
CV1CV1
CV2CV2
MV2MV2
MV3MV3
Success Criteria: Flow from any one pump through any one MVT_ tankV_ manual valve, normally openPS-_ pipe segmentP_ pumpCV_ check valveMV_ motor-operated valve, normally closed
7/30/2008
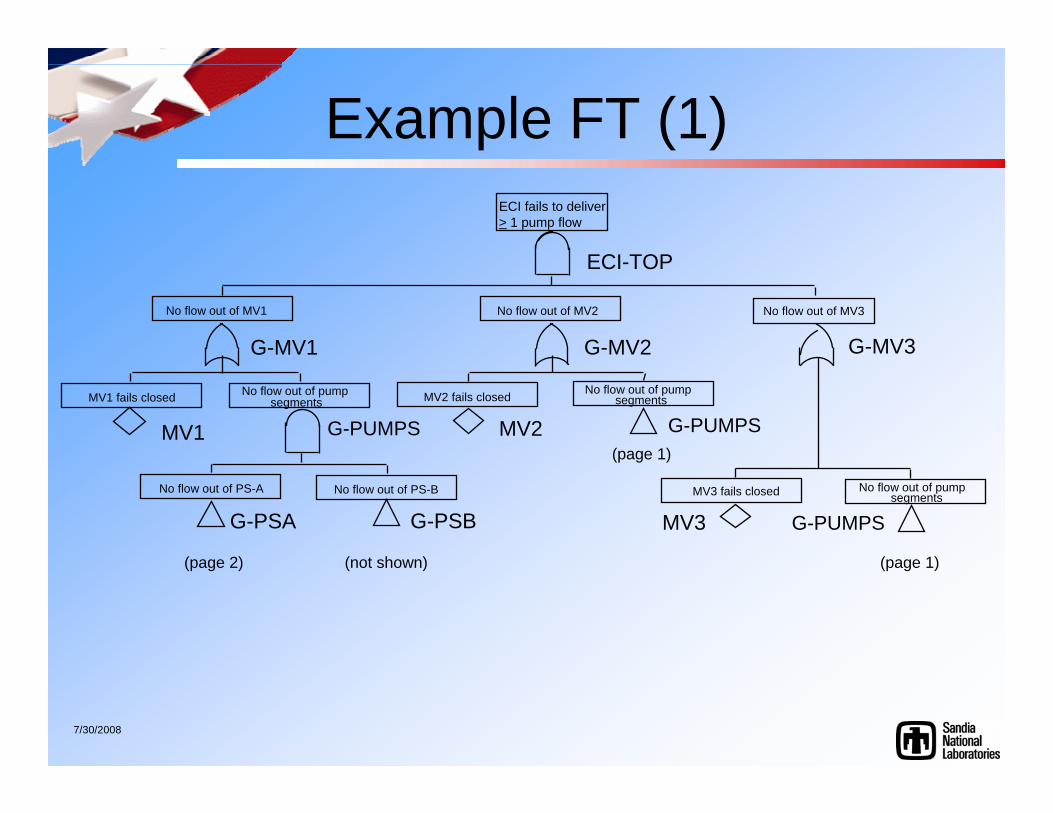
Example FT (1)
No flow out of MV2No flow out of MV1 No flow out of MV3
No flow out of PS-B
No flow out of pumpMV1 fails closed
No flow out of PS-A
MV2 fails closed segments
No flow out of pumpsegmentsMV3 fails closed
ECI fails to deliver> 1 pump flow
ECI-TOP
G-MV1
MV2
G-MV3
segmentsNo flow out of pump
MV1
MV3
G-PUMPS
G-PSBG-PSA
G-PUMPS
G-PUMPS
(not shown)(page 2) (page 1)
(page 1)
G-MV2
7/30/2008
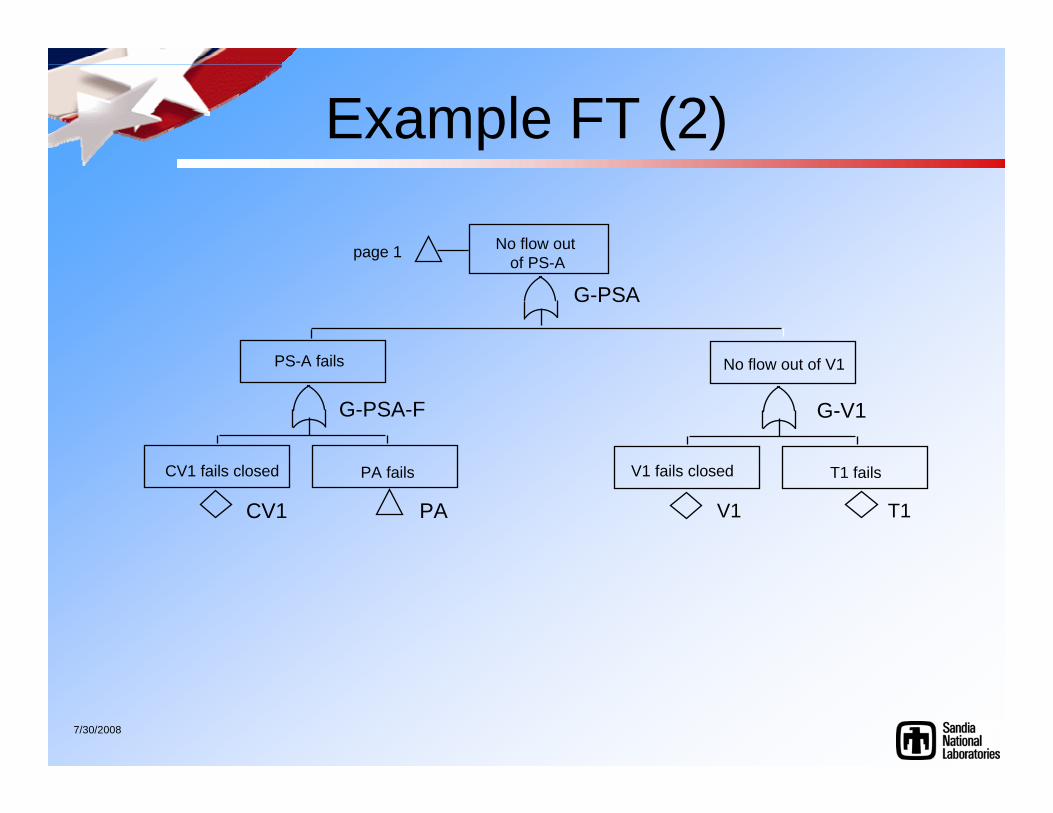
Example FT (2)
No flow out of PS-A
No flow out of V1
V1 fails closed
G-V1
T1 fails
CV1 PA T1
page 1
G-PSA
PS-A fails
CV1 fails closed
G-PSA-F
PA fails
V1
7/30/2008
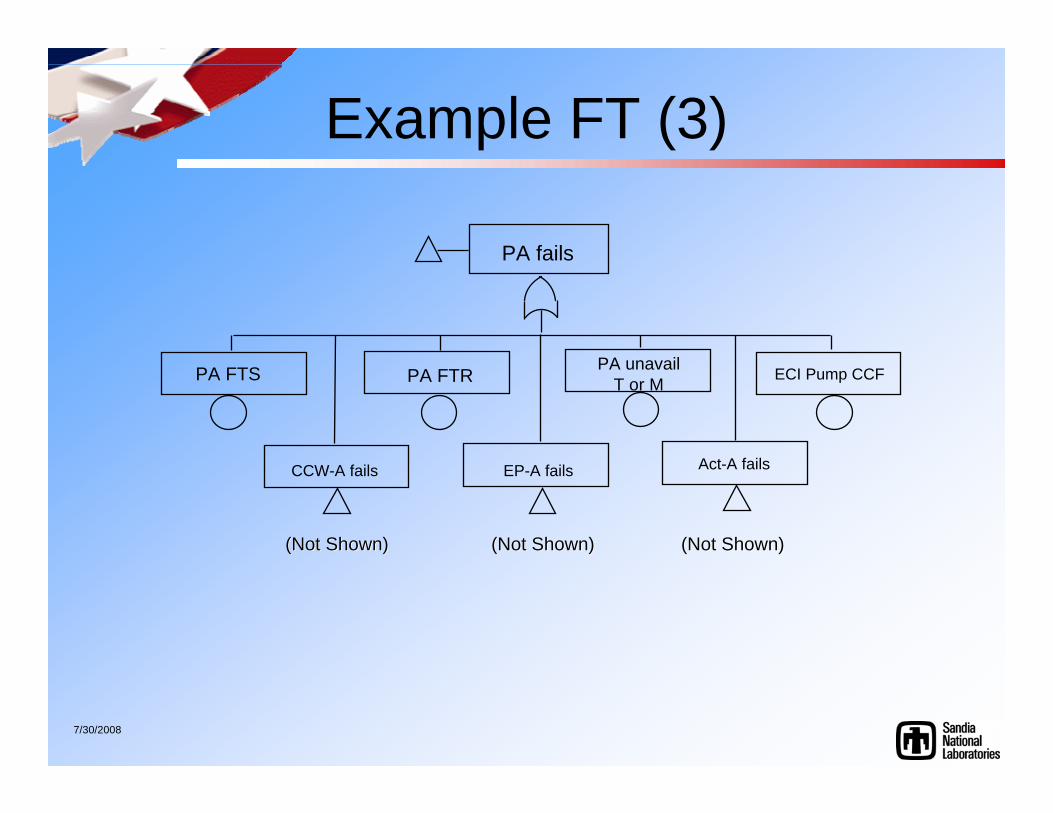
Example FT (3)
PA fails
ECI Pump CCF
Act-A fails
PA FTR
CCW-A fails EP-A fails
PA unavailT or MPA FTS
(Not Shown)(Not Shown) (Not Shown)(Not Shown)(Not Shown)(Not Shown)
7/30/2008
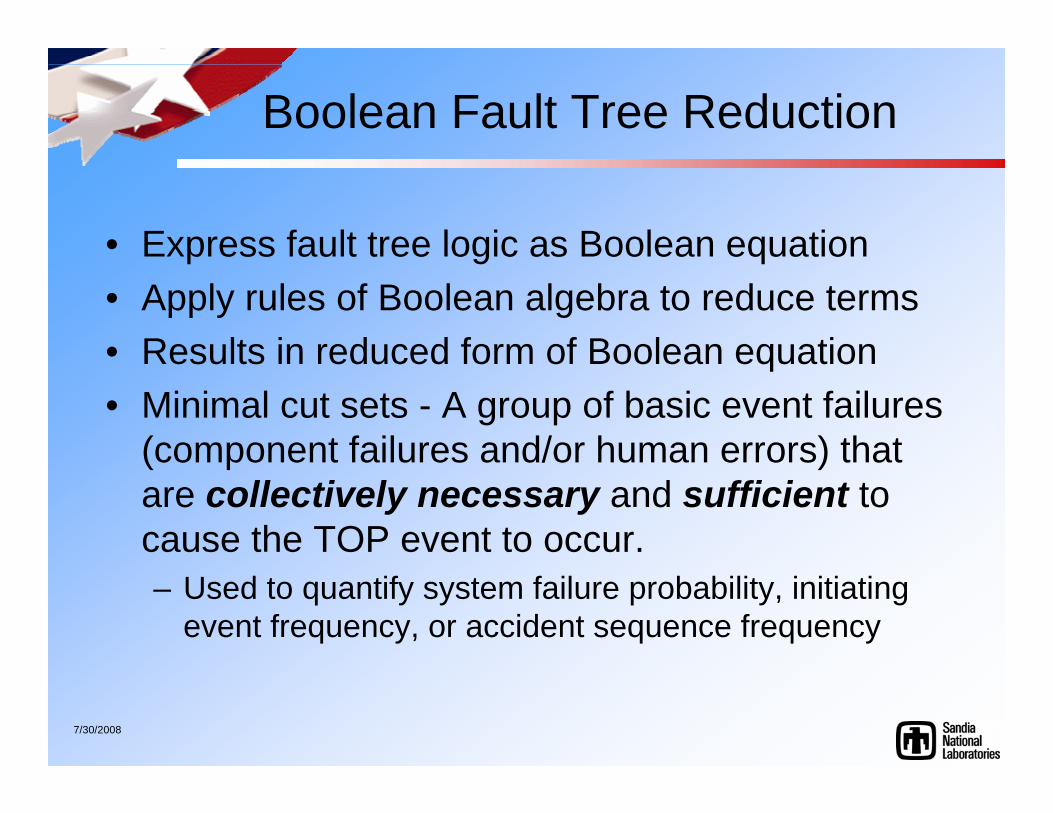
Boolean Fault Tree Reduction
• Express fault tree logic as Boolean equation• Apply rules of Boolean algebra to reduce terms• Results in reduced form of Boolean equation• Minimal cut sets - A group of basic event failures
(component failures and/or human errors) that are collectively necessary and sufficient to cause the TOP event to occur.– Used to quantify system failure probability, initiating
event frequency, or accident sequence frequency
7/30/2008
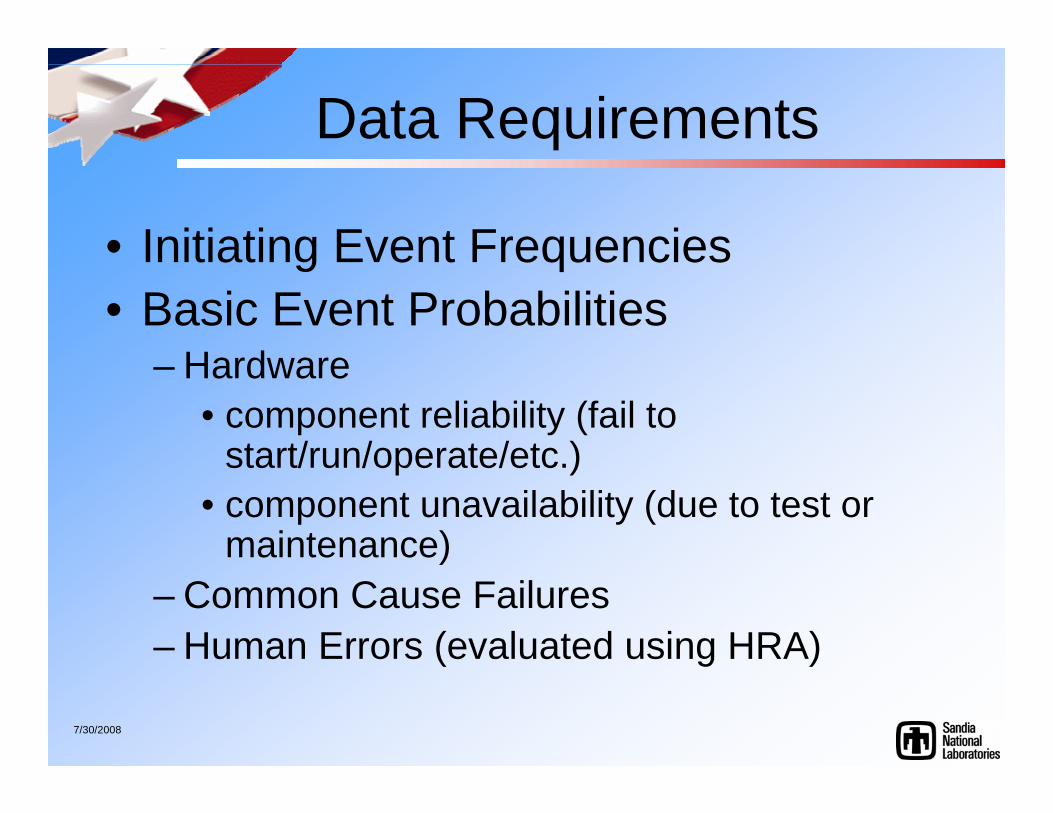
Data Requirements
• Initiating Event Frequencies• Basic Event Probabilities
– Hardware• component reliability (fail to
start/run/operate/etc.)• component unavailability (due to test or
maintenance)– Common Cause Failures– Human Errors (evaluated using HRA)
7/30/2008
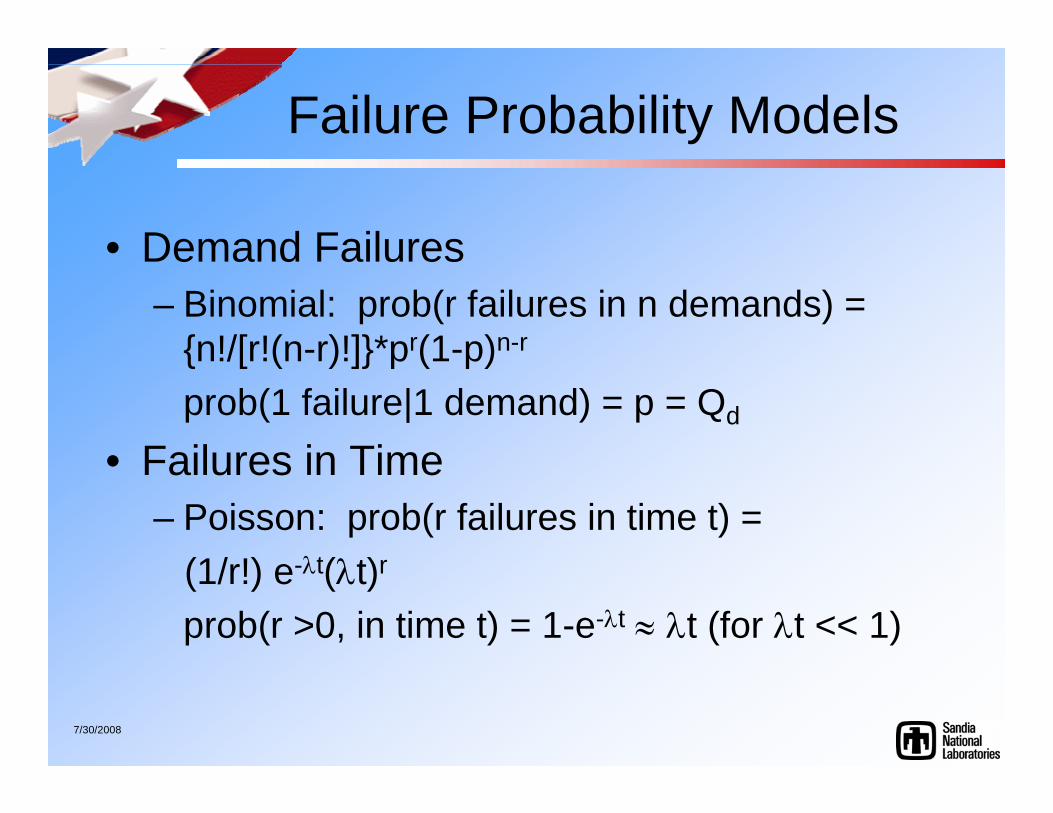
Failure Probability Models
• Demand Failures– Binomial: prob(r failures in n demands) =
{n!/[r!(n-r)!]}*pr(1-p)n-r
prob(1 failure|1 demand) = p = Qd
• Failures in Time– Poisson: prob(r failures in time t) =
(1/r!) e-λt(λt)r
prob(r >0, in time t) = 1-e-λt ≈ λt (for λt << 1)
7/30/2008
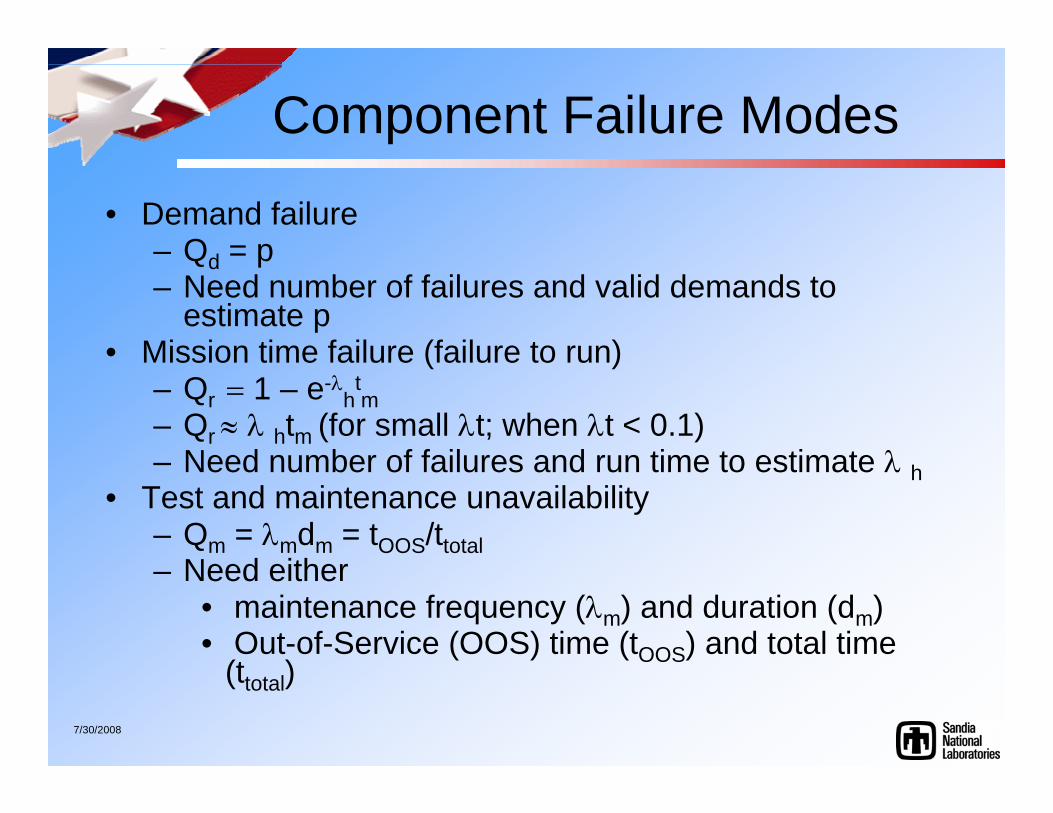
Component Failure Modes
• Demand failure– Qd = p– Need number of failures and valid demands to
estimate p• Mission time failure (failure to run)
– Qr = 1 – e-λhtm
– Qr ≈ λ htm (for small λt; when λt < 0.1)– Need number of failures and run time to estimate λ h
• Test and maintenance unavailability– Qm = λmdm = tOOS/ttotal– Need either
• maintenance frequency (λm) and duration (dm)• Out-of-Service (OOS) time (tOOS) and total time
(ttotal)
7/30/2008
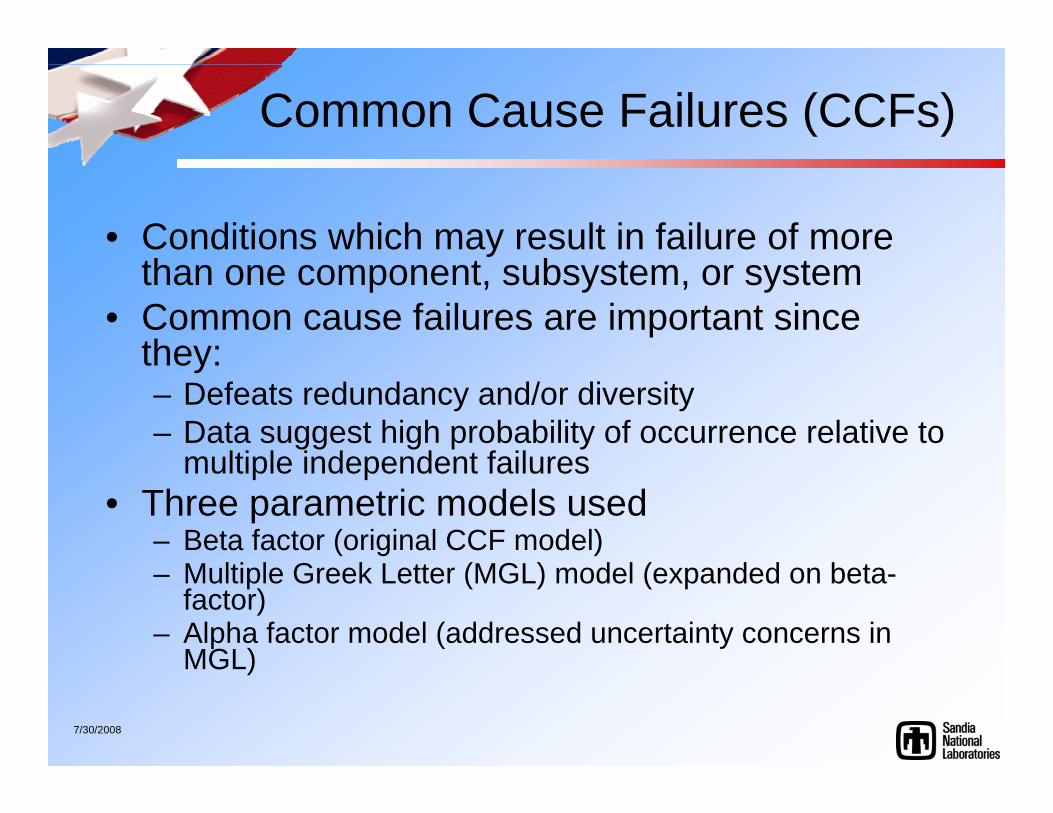
Common Cause Failures (CCFs)
• Conditions which may result in failure of more than one component, subsystem, or system
• Common cause failures are important since they:– Defeats redundancy and/or diversity– Data suggest high probability of occurrence relative to
multiple independent failures• Three parametric models used
– Beta factor (original CCF model)– Multiple Greek Letter (MGL) model (expanded on beta-
factor)– Alpha factor model (addressed uncertainty concerns in
MGL)
7/30/2008
Common Cause Failure Mechanisms
• Environment– Dust/dirt– Temperature– Corrosive environment
• Design deficiency• Manufacturing error• Test or Maintenance error• Operational error
7/30/2008
Human Reliability Analysis
• Starts with the basic premise that the humans are, in effect, part of the system (i.e., “human-machine systems”).
• Identifies and quantifies the ways in which human actions contribute to the initiation, propagation, or termination of accident sequences.
• HRA has gathered information from the behavioral sciences to provide a mechanism for estimating human failure probabilities
7/30/2008
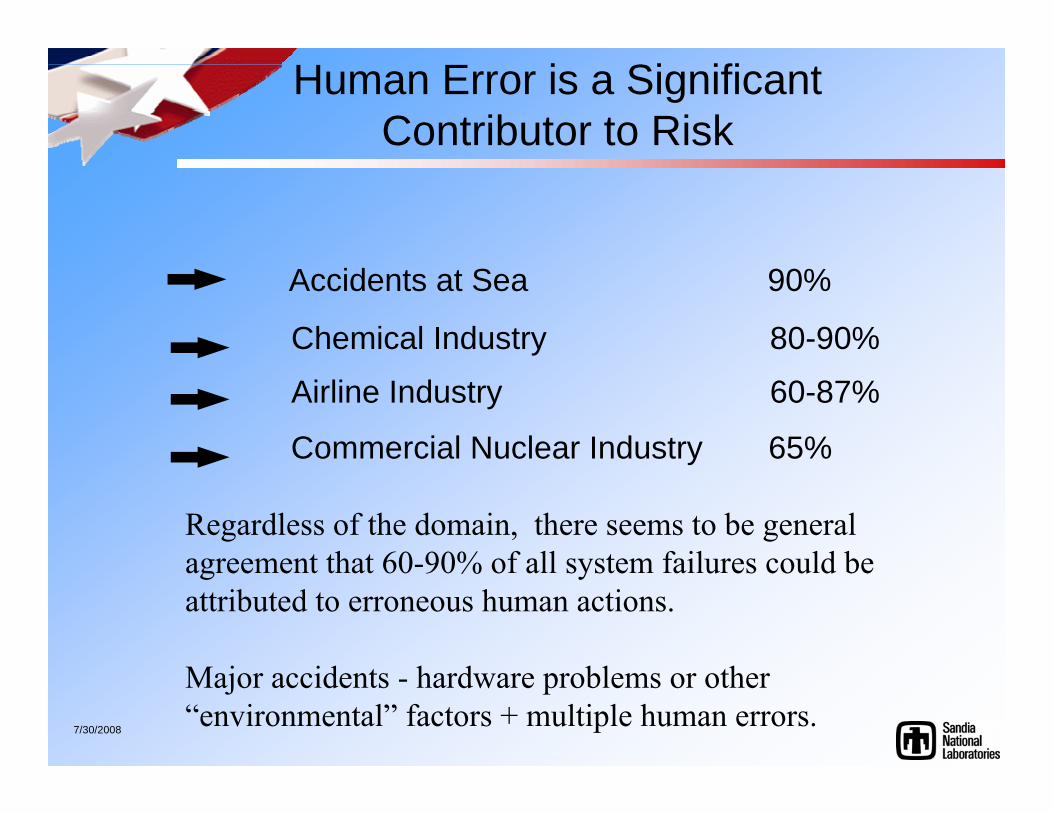
Human Error is a Significant Contributor to Risk
Accidents at Sea 90%
Chemical Industry 80-90%
Airline Industry 60-87%
Commercial Nuclear Industry 65%
Regardless of the domain, there seems to be general agreement that 60-90% of all system failures could be attributed to erroneous human actions.
Major accidents - hardware problems or other “environmental” factors + multiple human errors.
7/30/2008
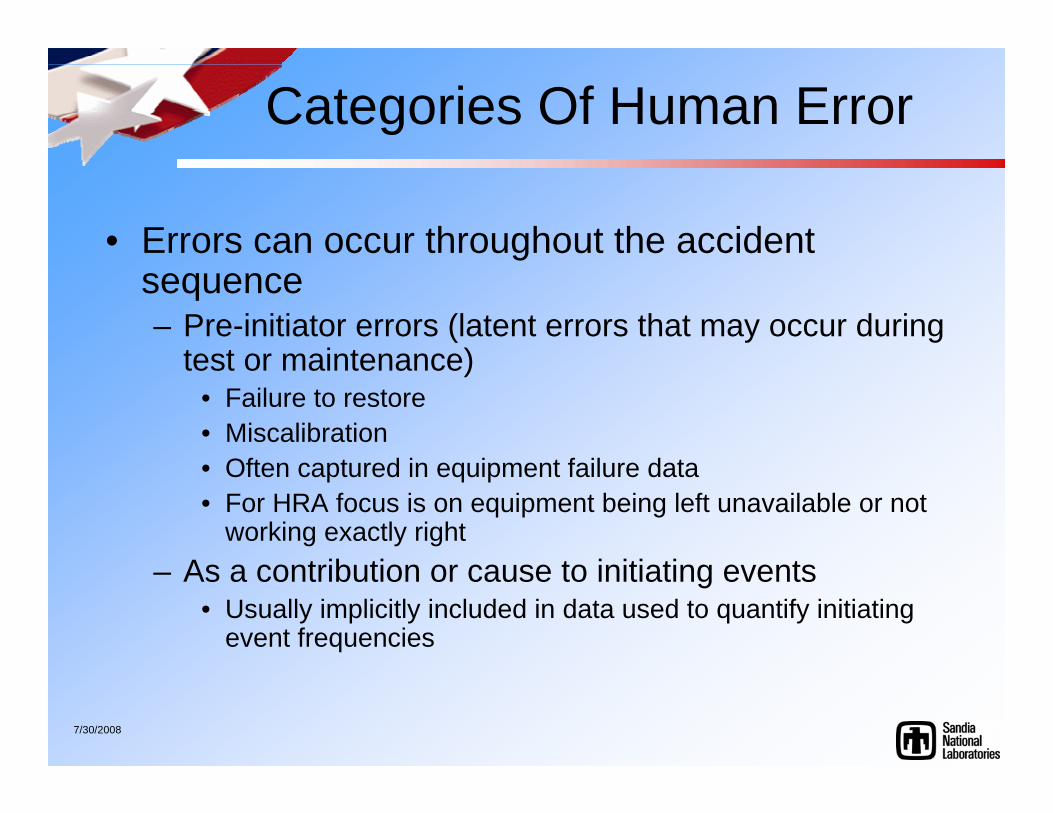
Categories Of Human Error
• Errors can occur throughout the accident sequence– Pre-initiator errors (latent errors that may occur during
test or maintenance)• Failure to restore• Miscalibration• Often captured in equipment failure data• For HRA focus is on equipment being left unavailable or not
working exactly right– As a contribution or cause to initiating events
• Usually implicitly included in data used to quantify initiating event frequencies
7/30/2008
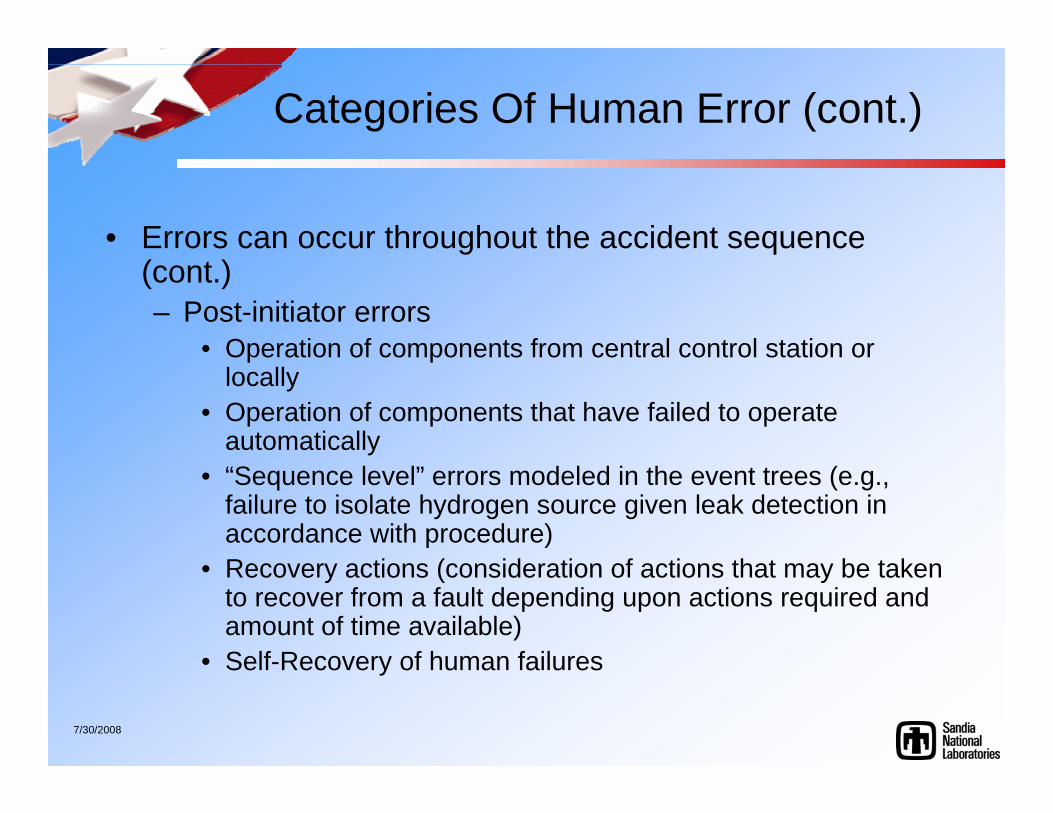
Categories Of Human Error (cont.)
• Errors can occur throughout the accident sequence (cont.)– Post-initiator errors
• Operation of components from central control station or locally
• Operation of components that have failed to operate automatically
• “Sequence level” errors modeled in the event trees (e.g., failure to isolate hydrogen source given leak detection in accordance with procedure)
• Recovery actions (consideration of actions that may be taken to recover from a fault depending upon actions required and amount of time available)
• Self-Recovery of human failures
7/30/2008
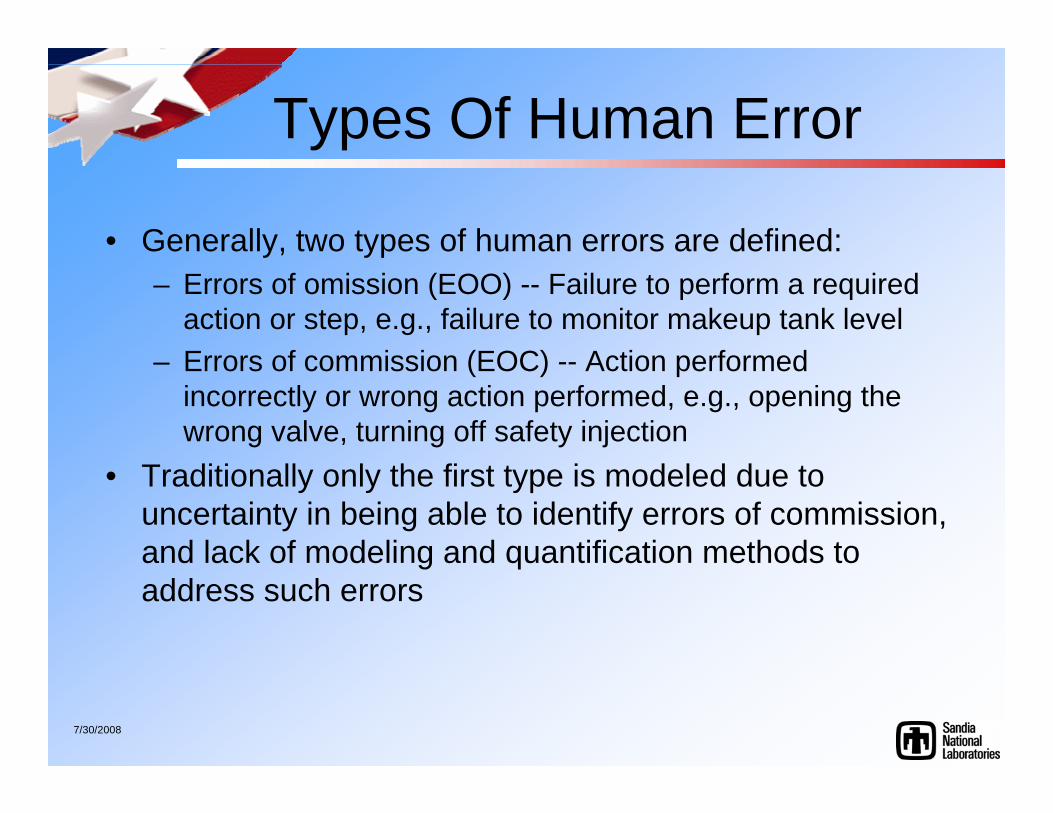
Types Of Human Error
• Generally, two types of human errors are defined:– Errors of omission (EOO) -- Failure to perform a required
action or step, e.g., failure to monitor makeup tank level– Errors of commission (EOC) -- Action performed
incorrectly or wrong action performed, e.g., opening the wrong valve, turning off safety injection
• Traditionally only the first type is modeled due to uncertainty in being able to identify errors of commission, and lack of modeling and quantification methods to address such errors
7/30/2008
Consequence Evaluation
• Required to determine consequences of accident scenarios– Explosion overpressure– Radiation and convective heat flux– Cryogenic effects– Asphyxiation
7/30/2008
Evaluation Process
• Characterising the source of the release of material or energy associated with the hazard being analysed
• Measuring (through experiments) or estimating (using models and correlations) the transport of the material and/or the propagation of the energy in the environment to a target of interest
• Identifying the effects of the propagation of the energy or material on the target of interest
• Quantifying the health, safety, environmental, or economic impacts on the target of interest
7/30/2008
Consequence Modeling
• Computational Fluid Dynamic (CFD) models– CFD models are complex and require expert users– Accuracy of CFD simulation dependent upon number
of factors including time step size, mesh size, choice of physical models, and boundary conditions
• Simple engineering models – Quick and easy to use– Because they are based on correlation, they have
limited applicability
7/30/2008
Accident Sequence Quantification
• Link fault tree models on a sequence level using event trees (i.e., generate sequence logic)
• Generate minimal cut sets (Boolean reduction) for each sequence
• Quantify sequence minimal cut sets with data• Eliminate inappropriate cut sets, add operator
recovery actions, and requantify• Determine dominant accident sequences• Perform sensitivity, importance, and uncertainty
analysis
7/30/2008
Importance Measures
• Provide a quantitative perspective on risk and sensitivity of risk to changes in input values
• Three are encountered most commonly:– Fussell-Vesely (F-V) - Measures overall contribution
of cut sets containing a particular event to risk– Risk Reduction (RR) - Measures amount by which the
risk would decrease if event’s failure probability were set to 0 (never fails)
– Risk Increase (RI) or Risk Achievement (RA) -Measures amount by which the risk would increase if event’s failure probability were set to 1 (e.g., component taken out of service)
7/30/2008
Uncertainty Assessment
Uncertainty arises from many sources• Inability to specify initial and boundary conditions
precisely– Cannot specify result with deterministic model– Instead, use probabilistic models (e.g., tossing a coin)
• Sparse data on initiating events, component failures, and human errors
• Lack of understanding of phenomena (e.g., auto-ignition conditions)
• Modeling assumptions (e.g., leak size)• Modeling limitations (e.g., inability to model human
errors of commission)• Incompleteness (e.g., failure to identify system failure
mode)
7/30/2008
Types of Uncertainty
• Distinction between aleatory and epistemic uncertainty:– “Aleatory” from the Latin Alea (dice), of or
relating to random or stochastic phenomena. Also called “random uncertainty or variability.”
– “Epistemic” of, relating to, or involving knowledge; cognitive. [From Greek episteme, knowledge]. Also called “state-of-knowledge uncertainty.”
7/30/2008
Aleatory Uncertainty
• Variability in or lack of precise knowledge about underlying conditions makes events unpredictable. Such events are modeled as being probabilistic in nature. In QRAs, these include initiating events, component failures, and human errors.
• Examples:– modeling initiating events as a Poisson process,
similar to the decay of radioactive atoms– modeling different sizes of leaks– modeling different sequence of events and outcomes
7/30/2008
Types of Epistemic Uncertainty
• Parameter uncertainty• Modeling uncertainty
– System success criteria– Accident progression phenomenology– Health effects models
• Completeness– Complex errors of commission– Design and construction errors– Unexpected failure modes and system interactions– All modes of operation not modeled
7/30/2008
Addressing Epistemic Uncertainties
• Parameter uncertainty addressed by Monte Carlo simulation
• Modeling uncertainty usually addressed through sensitivity studies– Research ongoing to examine more formal
approaches• Completeness addressed through comparison
with other studies and peer review– Some issues (e.g., design errors) are simply
acknowledged as limitations– Defense-in-depth in facility design can be used to
address unknowns
7/30/2008
Data Analysis
7/30/2008
Lack of Hydrogen-Specific Failure Data
• QRAs require component leak frequencies as a function of leak size and pressure– Data is not always available as a function of these
parameters• There is little hydrogen-specific data that is
available for use in QRA• So what data do you use?• Traditionally, representative values are selected
from available sources from other industries• Problems with this approach:
– Data is not necessarily reflective of hydrogen components and environments
– Parameter uncertainty distribution is not characterized
7/30/2008
Possible Solutions• Use traditional statistical approaches to data
analysis• Use Bayesian approaches to generate data
– Used to combine multiple sources of generic data• Can give equal weight to all sources• Can exclude some sources (e.g., nuclear data) or specific
data (e.g., outliers)• Can give variable weight to sources
– Update results (prior distribution) with hydrogen-specific data (posterior distribution)
• Hierarchical Bayesian approach used in our work allows one to attach different “layers” of significance to all the data that are used in the modeling process
7/30/2008
Traditional Statistics
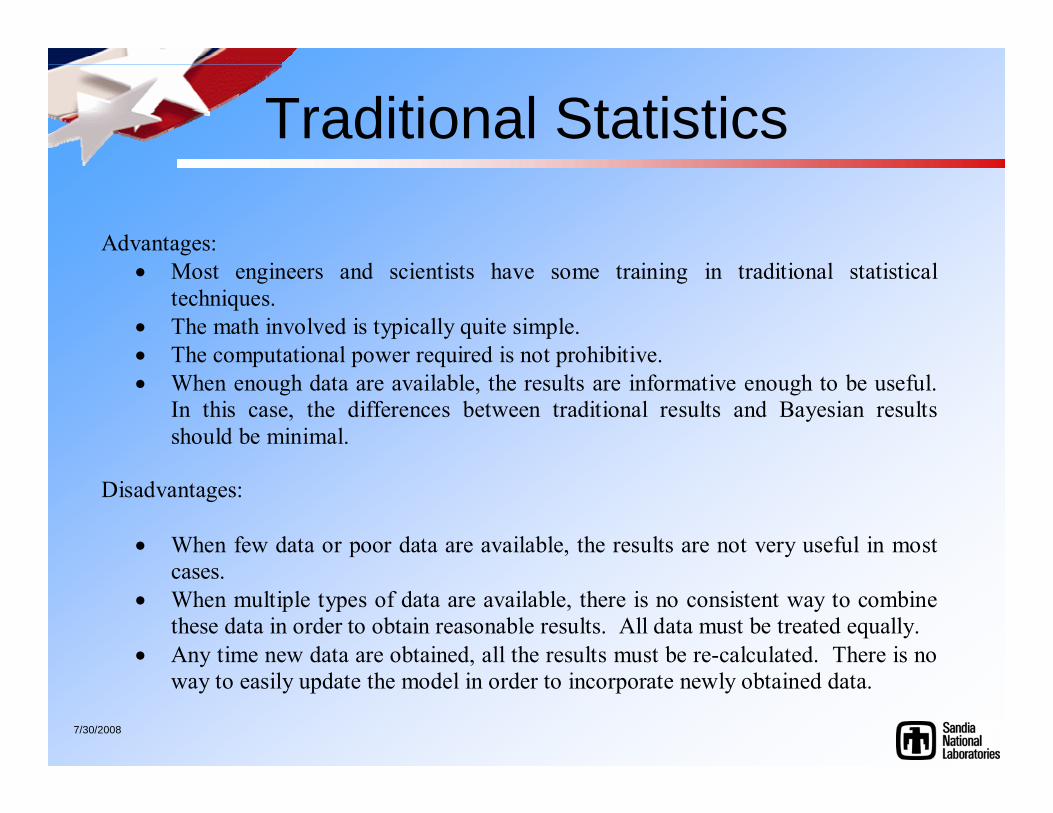
Advantages: • Most engineers and scientists have some training in traditional statistical
techniques. • The math involved is typically quite simple. • The computational power required is not prohibitive. • When enough data are available, the results are informative enough to be useful.
In this case, the differences between traditional results and Bayesian resultsshould be minimal.
Disadvantages:
• When few data or poor data are available, the results are not very useful in mostcases.
• When multiple types of data are available, there is no consistent way to combine these data in order to obtain reasonable results. All data must be treated equally.
• Any time new data are obtained, all the results must be re-calculated. There is no way to easily update the model in order to incorporate newly obtained data.
7/30/2008
Traditional Statistical Equations for Accident Initiators
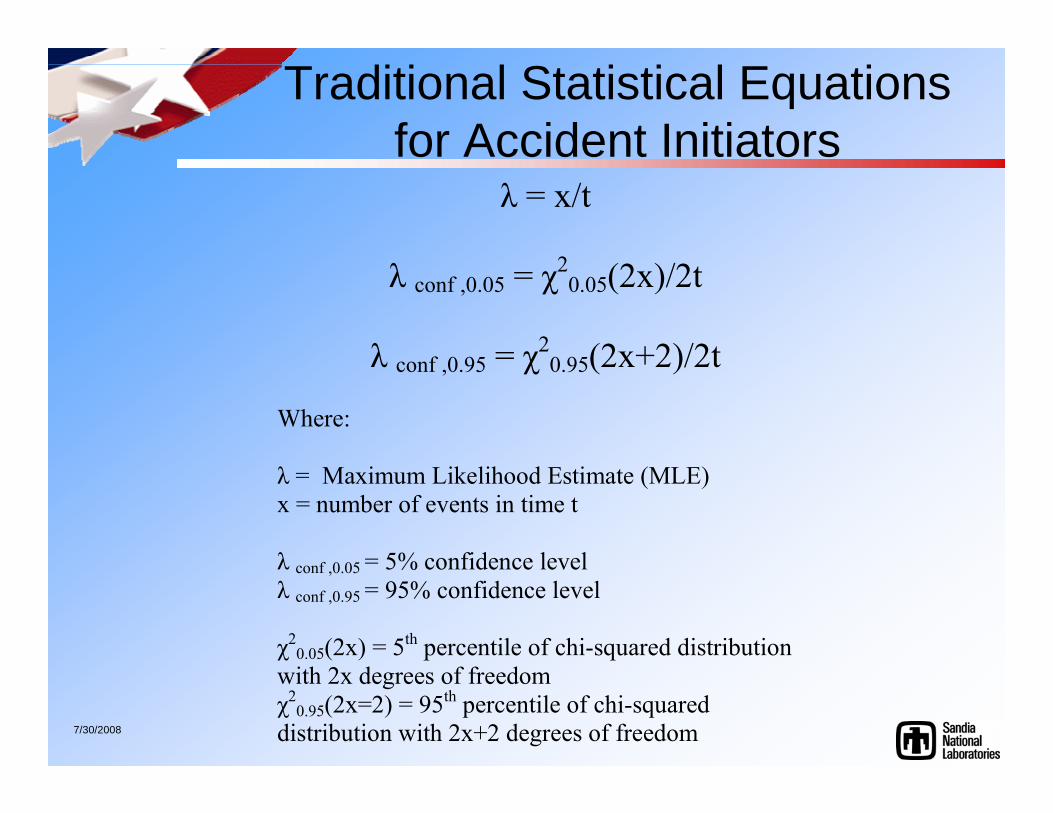
λ = x/t
λ conf ,0.05 = χ20.05(2x)/2t
λ conf ,0.95 = χ2
0.95(2x+2)/2t
Where: λ = Maximum Likelihood Estimate (MLE) x = number of events in time t λ conf ,0.05 = 5% confidence level λ conf ,0.95 = 95% confidence level χ2
0.05(2x) = 5th percentile of chi-squared distribution with 2x degrees of freedom χ2
0.95(2x=2) = 95th percentile of chi-squared distribution with 2x+2 degrees of freedom
7/30/2008
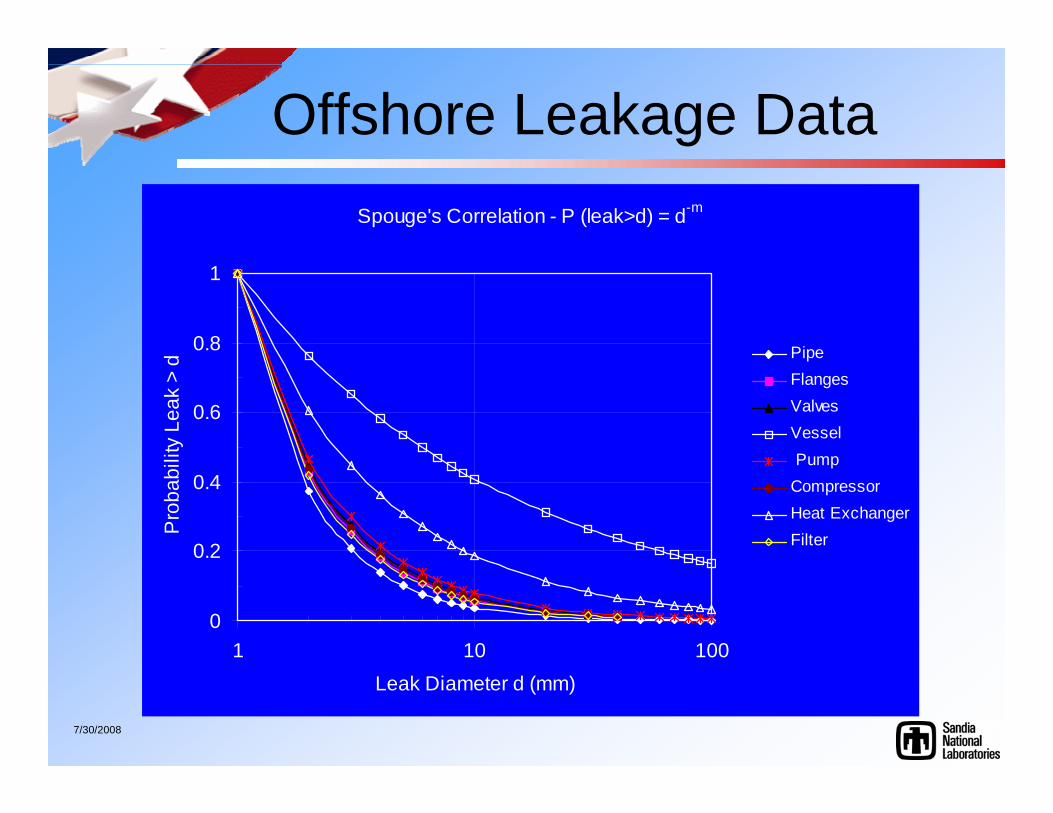
Component Leakage Data
• Generic leakage data is available from multiple sources covering different industries– Some data is provided as a function of leak size (i.e.,
small leaks, large leaks, and ruptures)• Actual data from offshore oil industry substantiates that leak
frequency is a power function of leak size– Data is not generally differentiated based on
operating pressure• Some limited hydrogen-specific data was
obtained for this analysis– More hydrogen data is needed
7/30/2008
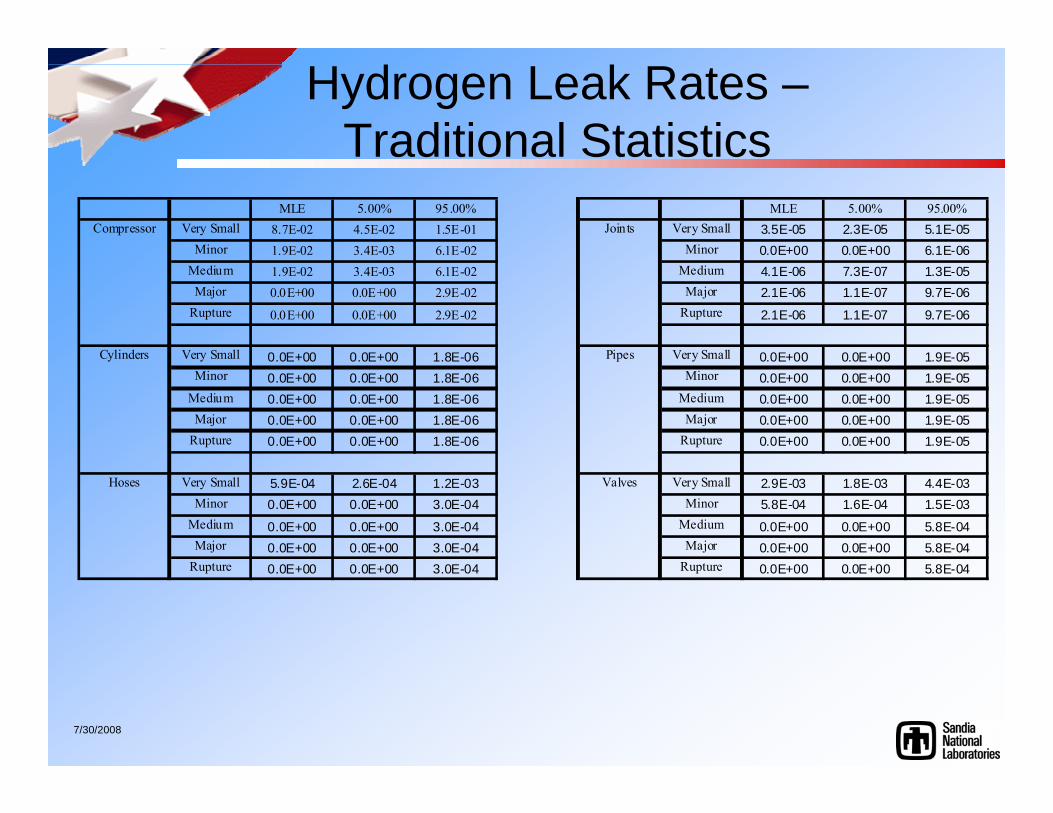
Hydrogen Leak Size Definitions
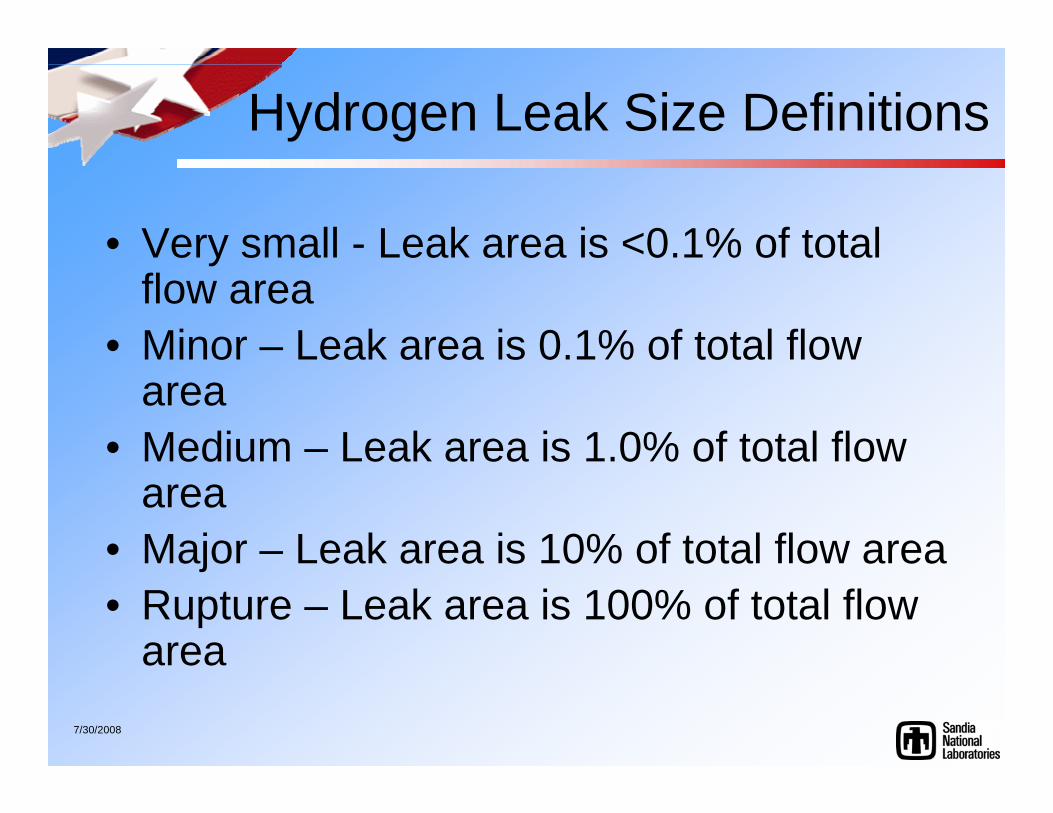
• Very small - Leak area is <0.1% of total flow area
• Minor – Leak area is 0.1% of total flow area
• Medium – Leak area is 1.0% of total flow area
• Major – Leak area is 10% of total flow area• Rupture – Leak area is 100% of total flow
area
7/30/2008
Hydrogen Leak Rates –Traditional Statistics
MLE 5.00% 95.00% MLE 5.00% 95.00%Very Small 8.7E-02 4.5E-02 1.5E-01 Very Small 3.5E-05 2.3E-05 5.1E-05
Minor 1.9E-02 3.4E-03 6.1E-02 Minor 0.0E+00 0.0E+00 6.1E-06Medium 1.9E-02 3.4E-03 6.1E-02 Medium 4.1E-06 7.3E-07 1.3E-05Major 0.0E+00 0.0E+00 2.9E-02 Major 2.1E-06 1.1E-07 9.7E-06
Rupture 0.0E+00 0.0E+00 2.9E-02 Rupture 2.1E-06 1.1E-07 9.7E-06
Very Small 0.0E+00 0.0E+00 1.8E-06 Very Small 0.0E+00 0.0E+00 1.9E-05Minor 0.0E+00 0.0E+00 1.8E-06 Minor 0.0E+00 0.0E+00 1.9E-05
Medium 0.0E+00 0.0E+00 1.8E-06 Medium 0.0E+00 0.0E+00 1.9E-05Major 0.0E+00 0.0E+00 1.8E-06 Major 0.0E+00 0.0E+00 1.9E-05
Rupture 0.0E+00 0.0E+00 1.8E-06 Rupture 0.0E+00 0.0E+00 1.9E-05
Very Small 5.9E-04 2.6E-04 1.2E-03 Very Small 2.9E-03 1.8E-03 4.4E-03Minor 0.0E+00 0.0E+00 3.0E-04 Minor 5.8E-04 1.6E-04 1.5E-03
Medium 0.0E+00 0.0E+00 3.0E-04 Medium 0.0E+00 0.0E+00 5.8E-04Major 0.0E+00 0.0E+00 3.0E-04 Major 0.0E+00 0.0E+00 5.8E-04
Rupture 0.0E+00 0.0E+00 3.0E-04 Rupture 0.0E+00 0.0E+00 5.8E-04
Pipes
ValvesHoses
Compressor
Cylinders
Joints
7/30/2008
Bayesian Methods Employed to Generate Uncertainty Distributions
• Two motivations for using Bayesian techniques– Generate probability distributions (classical methods
generally only produce uncertainty intervals, not pdf’s)– Compensate for sparse data (e.g., no failures)
• In effect, Bayesian techniques combine an initial estimate (prior) with plant-specific data (likelihood function) to produce a final estimate (posterior)
• However, Bayesian techniques rely on (and incorporate) subjective judgment– different options for choice of prior distribution (i.e.,
the starting point in a Bayesian calculation)
7/30/2008
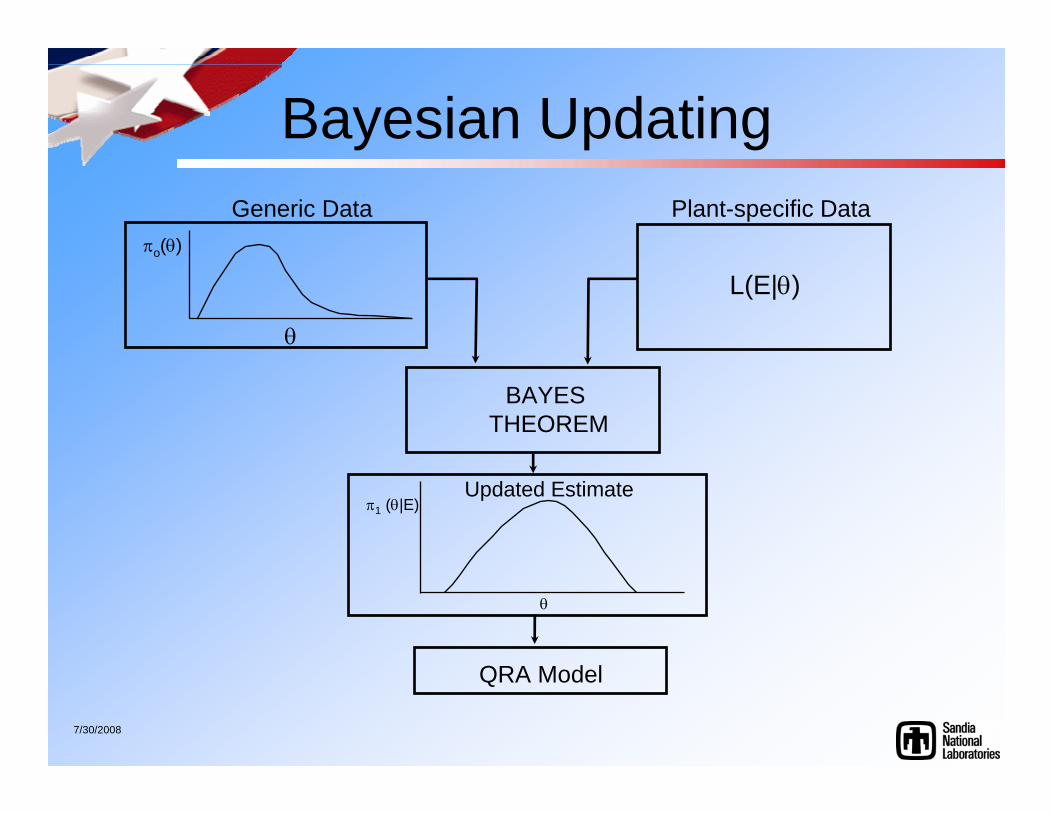
Bayesian Updating
θ
L(E|θ)
BAYES THEOREM
Updated Estimate
QRA Model
Plant-specific DataGeneric Dataπo(θ)
π1 (θ|E)
θ
7/30/2008
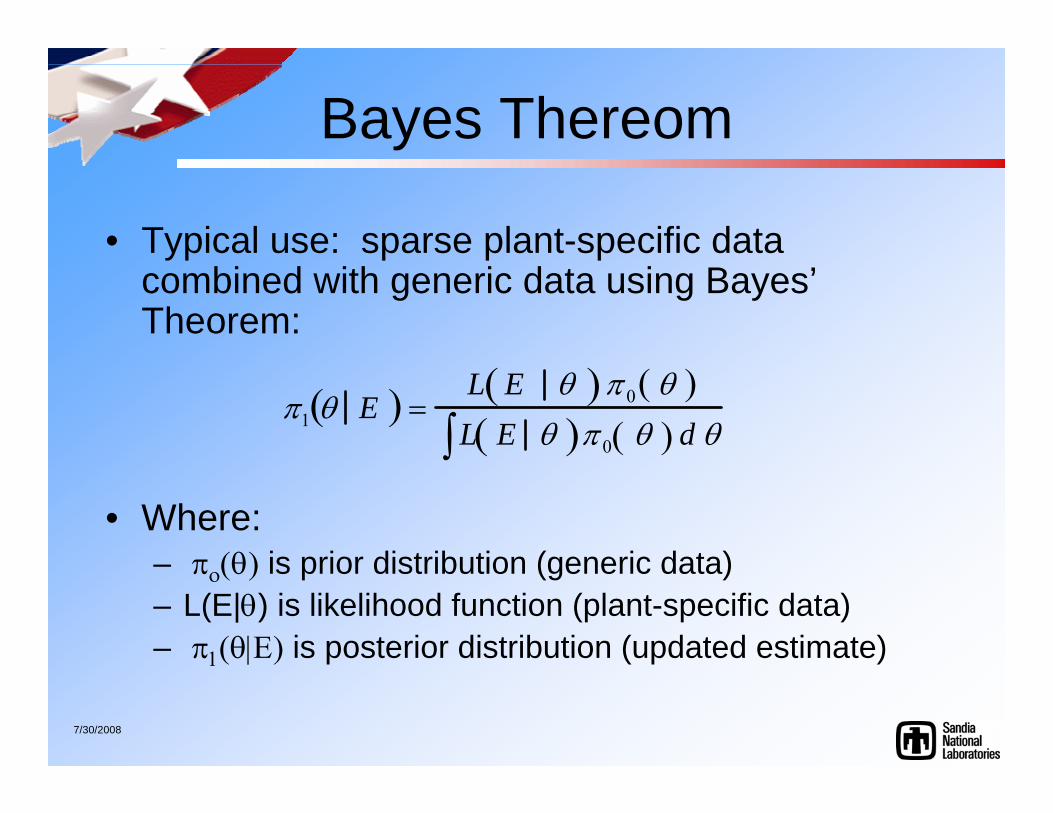
Bayes Thereom
• Typical use: sparse plant-specific data combined with generic data using Bayes’Theorem:
• Where:– πο(θ) is prior distribution (generic data)– L(E|θ) is likelihood function (plant-specific data)– π1(θ|Ε) is posterior distribution (updated estimate)
π1 θ E ( ) = L E θ ( ) π 0 θ ( )L E θ ( )∫ π 0 θ ( ) d θ
7/30/2008
Offshore Leakage DataSpouge's Correlation - P (leak>d) = d-m
0
0.2
0.4
0.6
0.8
1
1 10 100Leak Diameter d (mm)
Pro
babi
lity
Leak
> d Pipe
FlangesValvesVessel PumpCompressorHeat ExchangerFilter
7/30/2008
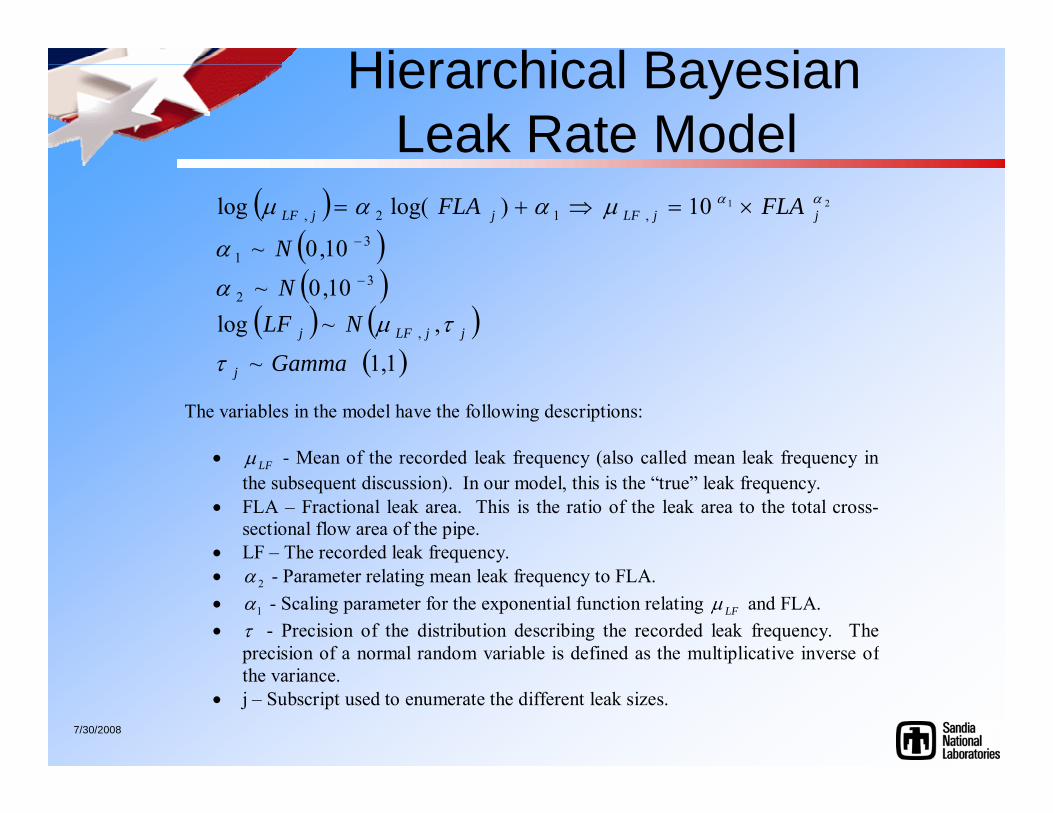
Hierarchical Bayesian Leak Rate Model
( )( )( )
( ) ( )( )1,1~
,~log10,0~
10,0~
10)log(log
,
32
31
,12,21
Gamma
NLFN
N
FLAFLA
j
jjLFj
jjLFjjLF
τ
τμα
α
μααμ αα
−
−
×=⇒+=
The variables in the model have the following descriptions:
• LFμ - Mean of the recorded leak frequency (also called mean leak frequency inthe subsequent discussion). In our model, this is the “true” leak frequency.
• FLA – Fractional leak area. This is the ratio of the leak area to the total cross-sectional flow area of the pipe.
• LF – The recorded leak frequency. • 2α - Parameter relating mean leak frequency to FLA. • 1α - Scaling parameter for the exponential function relating LFμ and FLA. • τ - Precision of the distribution describing the recorded leak frequency. The
precision of a normal random variable is defined as the multiplicative inverse ofthe variance.
• j – Subscript used to enumerate the different leak sizes.
7/30/2008
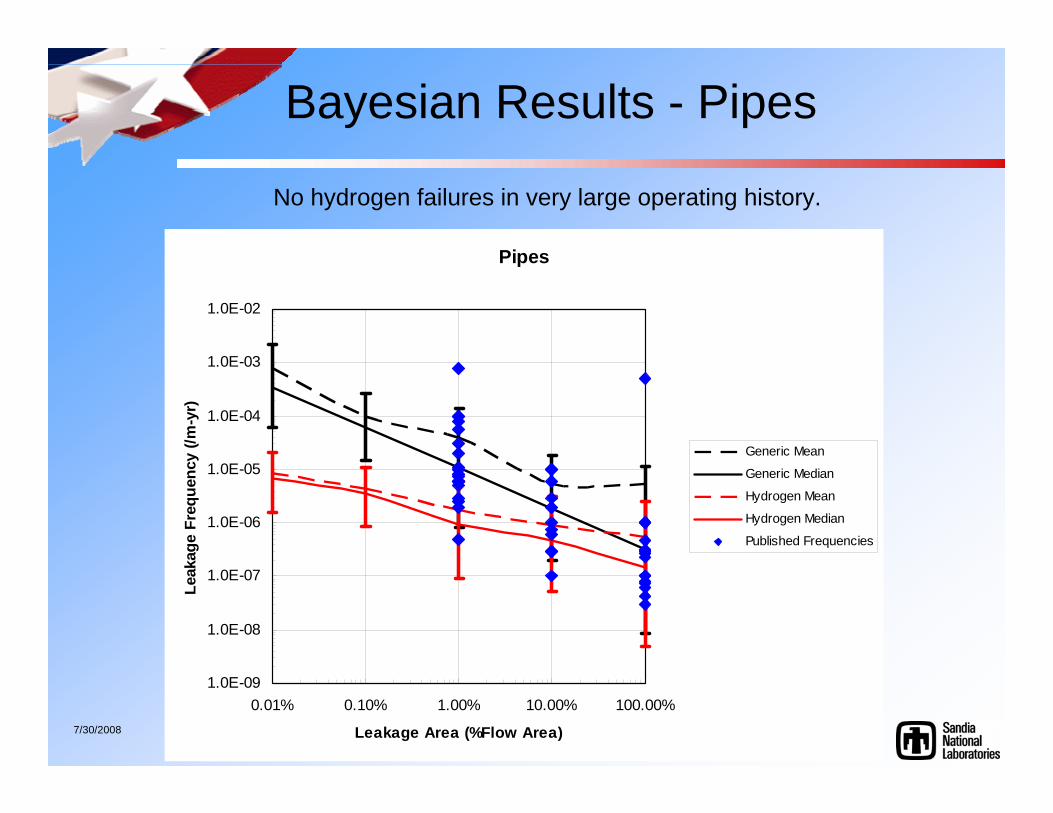
Bayesian Results - Pipes
Pipes
1.0E-09
1.0E-08
1.0E-07
1.0E-06
1.0E-05
1.0E-04
1.0E-03
1.0E-02
0.01% 0.10% 1.00% 10.00% 100.00%
Leakage Area (%Flow Area)
Leak
age
Freq
uenc
y (/m
-yr)
Generic Mean
Generic Median
Hydrogen Mean
Hydrogen Median
Published Frequencies
No hydrogen failures in very large operating history.

7/30/2008
Pipe Leak ResultsMinor Leak (0.1%A)
Generic prior - red
Hydrogen posterior- blue
7/30/2008
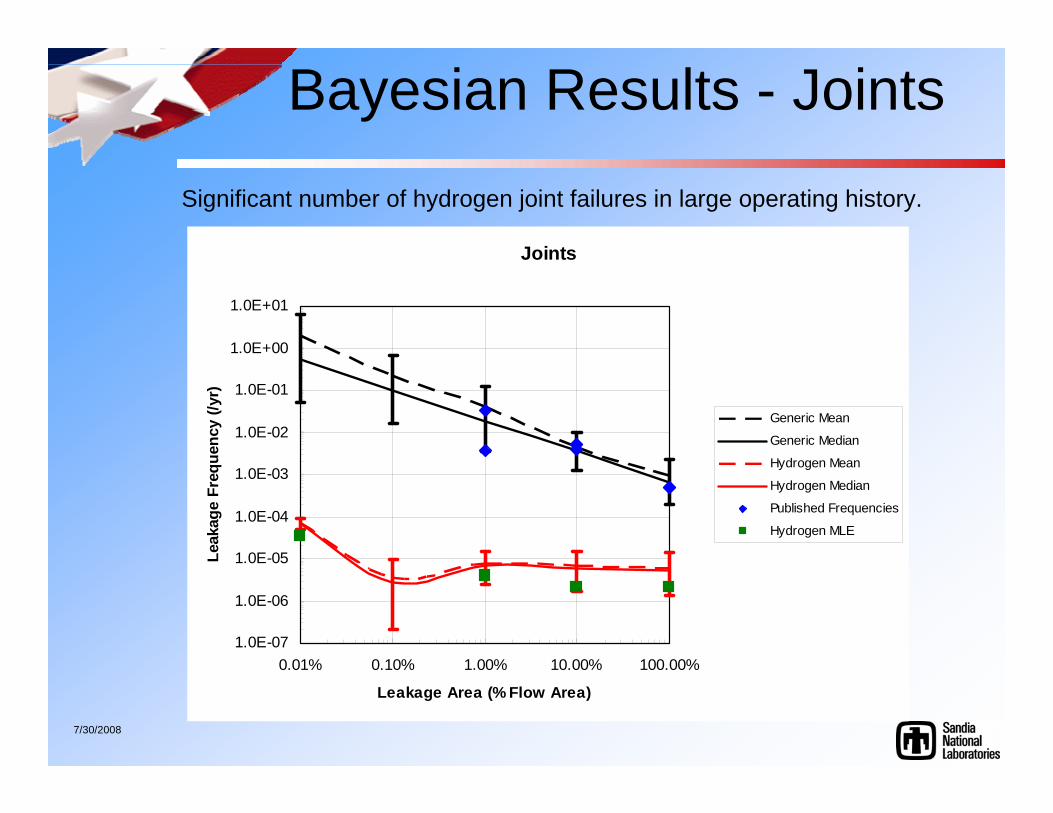
Bayesian Results - Joints
Joints
1.0E-07
1.0E-06
1.0E-05
1.0E-04
1.0E-03
1.0E-02
1.0E-01
1.0E+00
1.0E+01
0.01% 0.10% 1.00% 10.00% 100.00%
Leakage Area (% Flow Area)
Lea
kage
Fre
quen
cy (/
yr)
Generic Mean
Generic Median
Hydrogen Mean
Hydrogen Median
Published Frequencies
Hydrogen MLE
Significant number of hydrogen joint failures in large operating history.
7/30/2008
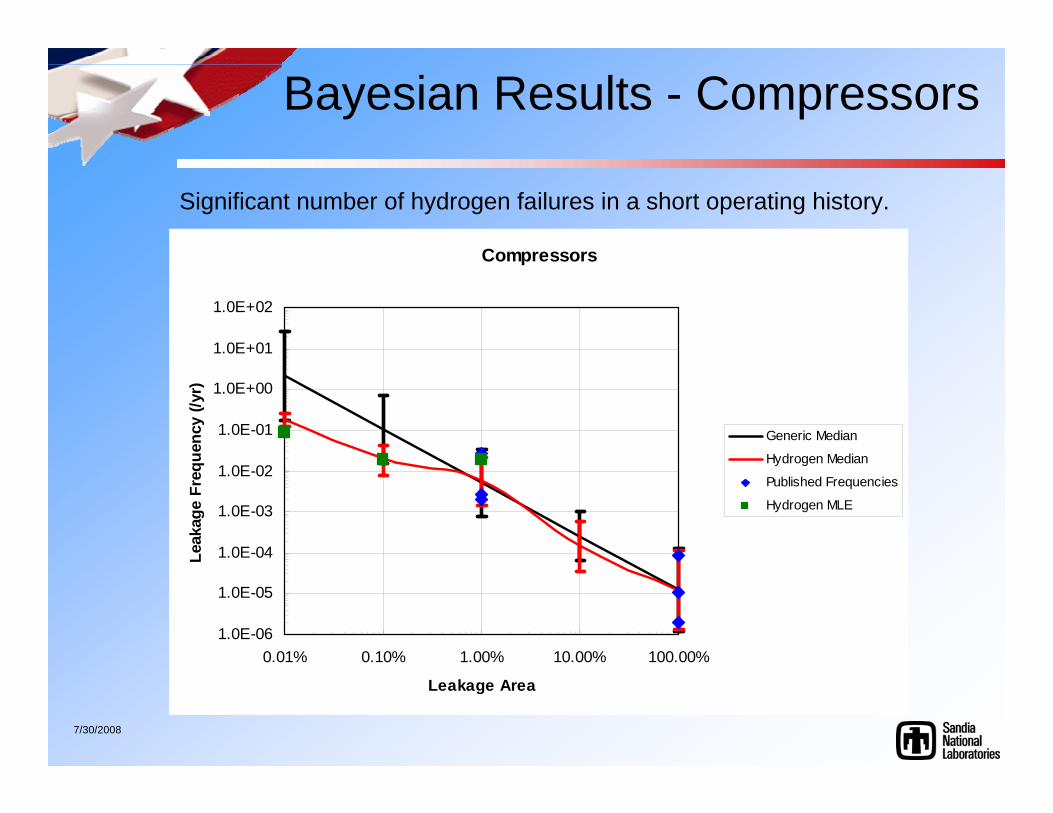
Bayesian Results - Compressors
Compressors
1.0E-06
1.0E-05
1.0E-04
1.0E-03
1.0E-02
1.0E-01
1.0E+00
1.0E+01
1.0E+02
0.01% 0.10% 1.00% 10.00% 100.00%
Leakage Area
Leak
age
Freq
uenc
y (/y
r)
Generic Median
Hydrogen Median
Published Frequencies
Hydrogen MLE
Significant number of hydrogen failures in a short operating history.
7/30/2008
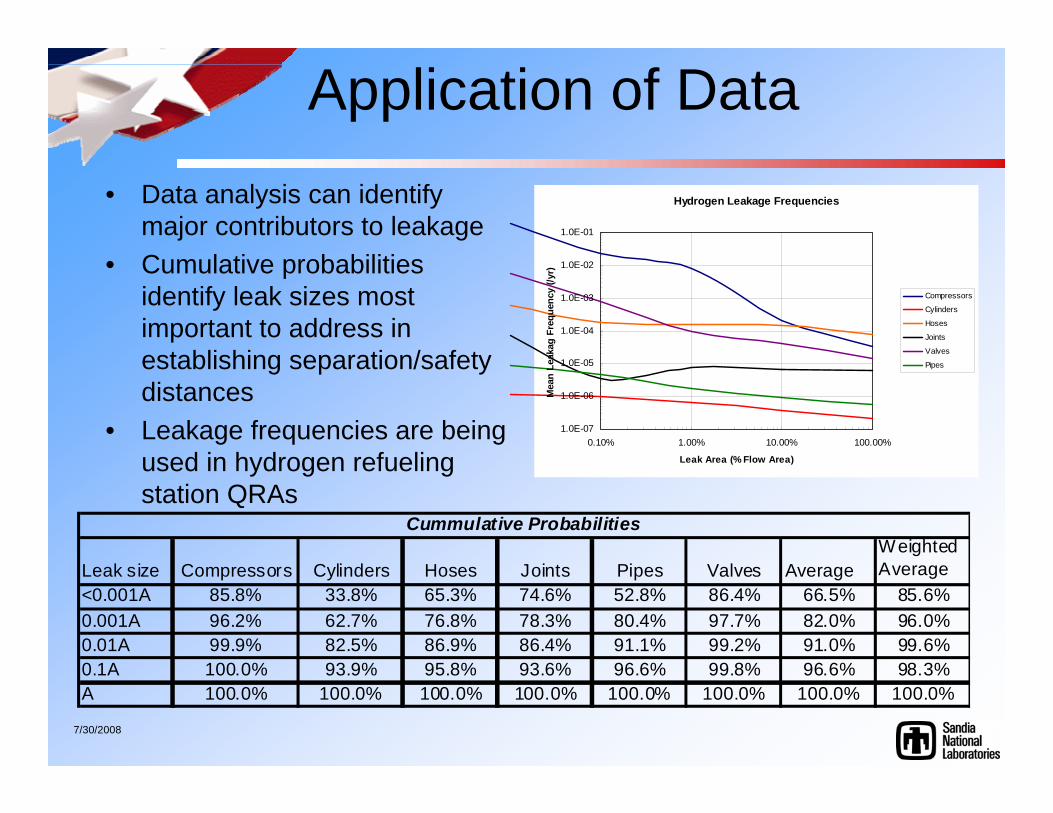
Application of Data• Data analysis can identify
major contributors to leakage• Cumulative probabilities
identify leak sizes most important to address in establishing separation/safety distances
• Leakage frequencies are being used in hydrogen refueling station QRAs
Hydrogen Leakage Frequencies
1.0E-07
1.0E-06
1.0E-05
1.0E-04
1.0E-03
1.0E-02
1.0E-01
0.10% 1.00% 10.00% 100.00%
Leak Area (% Flow Area)
Mea
n Le
akag
Fre
quen
cy (/
yr)
Compressors
Cylinders
Hoses
Joints
Valves
Pipes
Leak size Compressors Cylinders Hoses Joints Pipes Valves AverageWeighted Average
<0.001A 85.8% 33.8% 65.3% 74.6% 52.8% 86.4% 66.5% 85.6%0.001A 96.2% 62.7% 76.8% 78.3% 80.4% 97.7% 82.0% 96.0%0.01A 99.9% 82.5% 86.9% 86.4% 91.1% 99.2% 91.0% 99.6%0.1A 100.0% 93.9% 95.8% 93.6% 96.6% 99.8% 96.6% 98.3%A 100.0% 100.0% 100.0% 100.0% 100.0% 100.0% 100.0% 100.0%
Cummulative Probabilities
7/30/2008
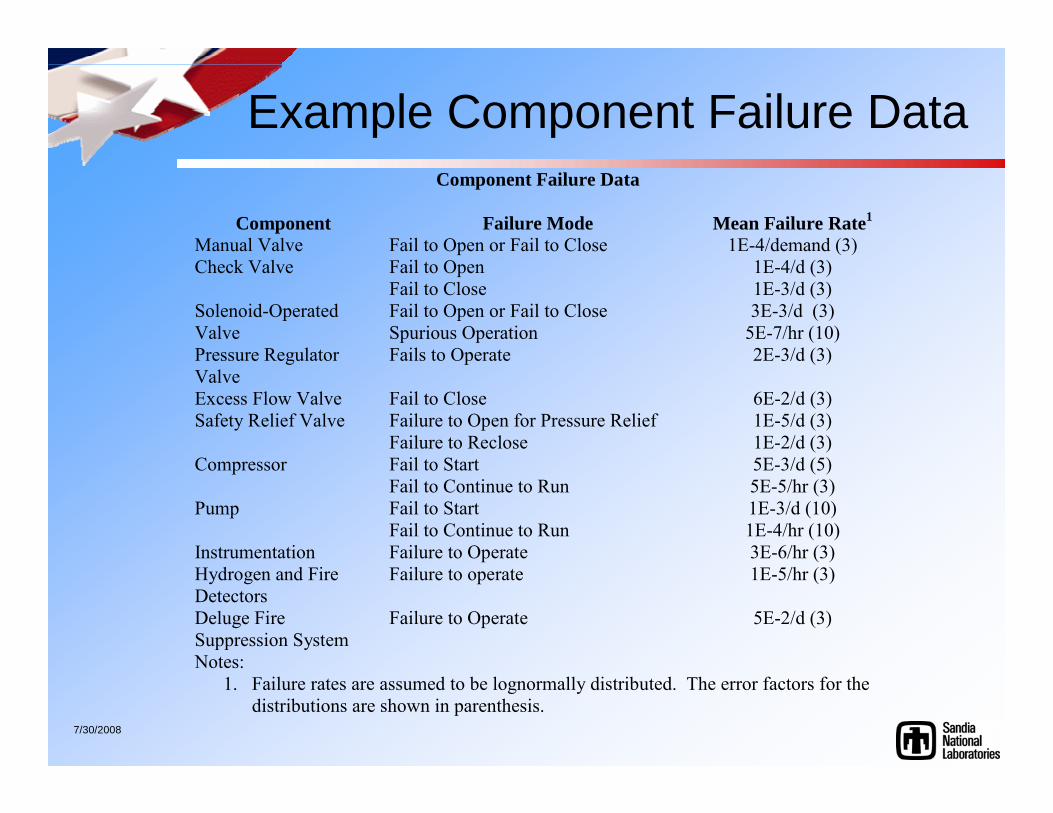
Example Component Failure Data
Component Failure Data
Component Failure Mode Mean Failure Rate1 Manual Valve Fail to Open or Fail to Close 1E-4/demand (3)
Fail to Open 1E-4/d (3) Check Valve Fail to Close 1E-3/d (3) Fail to Open or Fail to Close 3E-3/d (3) Solenoid-Operated
Valve Spurious Operation 5E-7/hr (10) Pressure Regulator Valve
Fails to Operate 2E-3/d (3)
Excess Flow Valve Fail to Close 6E-2/d (3) Failure to Open for Pressure Relief 1E-5/d (3) Safety Relief Valve Failure to Reclose 1E-2/d (3) Fail to Start 5E-3/d (5) Compressor Fail to Continue to Run 5E-5/hr (3) Fail to Start 1E-3/d (10) Pump Fail to Continue to Run 1E-4/hr (10)
Instrumentation Failure to Operate 3E-6/hr (3) Hydrogen and Fire Detectors
Failure to operate 1E-5/hr (3)
Deluge Fire Suppression System
Failure to Operate 5E-2/d (3)
Notes: 1. Failure rates are assumed to be lognormally distributed. The error factors for the
distributions are shown in parenthesis.
7/30/2008
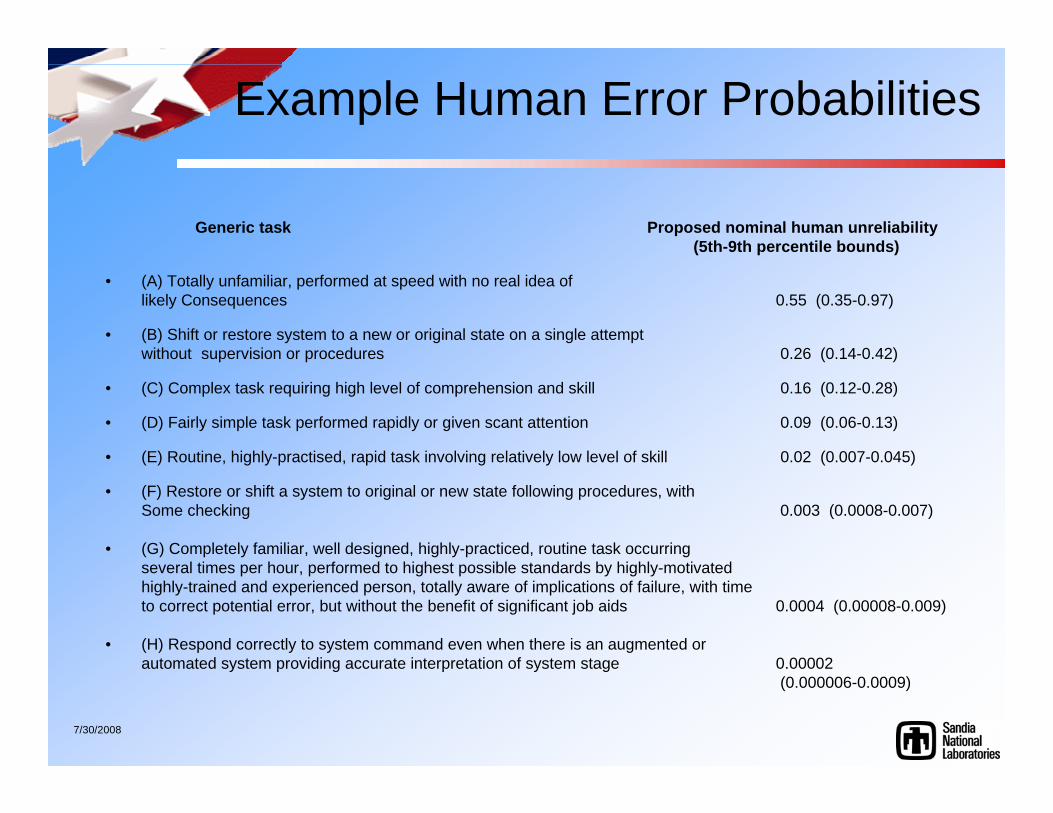
Example Human Error Probabilities
Generic task Proposed nominal human unreliability (5th-9th percentile bounds)
• (A) Totally unfamiliar, performed at speed with no real idea of likely Consequences 0.55 (0.35-0.97)
• (B) Shift or restore system to a new or original state on a single attemptwithout supervision or procedures 0.26 (0.14-0.42)
• (C) Complex task requiring high level of comprehension and skill 0.16 (0.12-0.28)
• (D) Fairly simple task performed rapidly or given scant attention 0.09 (0.06-0.13)
• (E) Routine, highly-practised, rapid task involving relatively low level of skill 0.02 (0.007-0.045)
• (F) Restore or shift a system to original or new state following procedures, with Some checking 0.003 (0.0008-0.007)
• (G) Completely familiar, well designed, highly-practiced, routine task occurring several times per hour, performed to highest possible standards by highly-motivatedhighly-trained and experienced person, totally aware of implications of failure, with time to correct potential error, but without the benefit of significant job aids 0.0004 (0.00008-0.009)
• (H) Respond correctly to system command even when there is an augmented orautomated system providing accurate interpretation of system stage 0.00002
(0.000006-0.0009)
7/30/2008
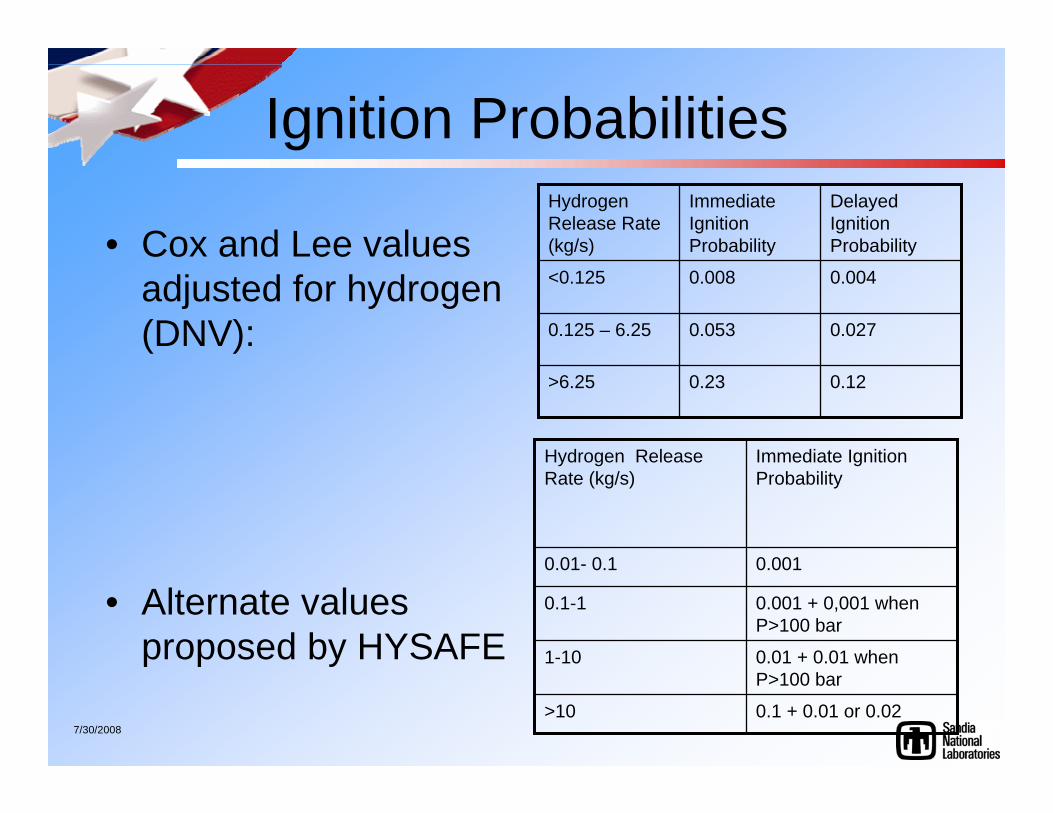
Ignition Probabilities
• Cox and Lee values adjusted for hydrogen (DNV):
• Alternate values proposed by HYSAFE
0.120.23>6.25
0.0270.0530.125 – 6.25
0.0040.008<0.125
Delayed Ignition Probability
Immediate Ignition Probability
Hydrogen Release Rate (kg/s)
0.1 + 0.01 or 0.02>10
0.01 + 0.01 when P>100 bar
1-10
0.001 + 0,001 when P>100 bar
0.1-1
0.0010.01- 0.1
Immediate Ignition Probability
Hydrogen Release Rate (kg/s)
7/30/2008
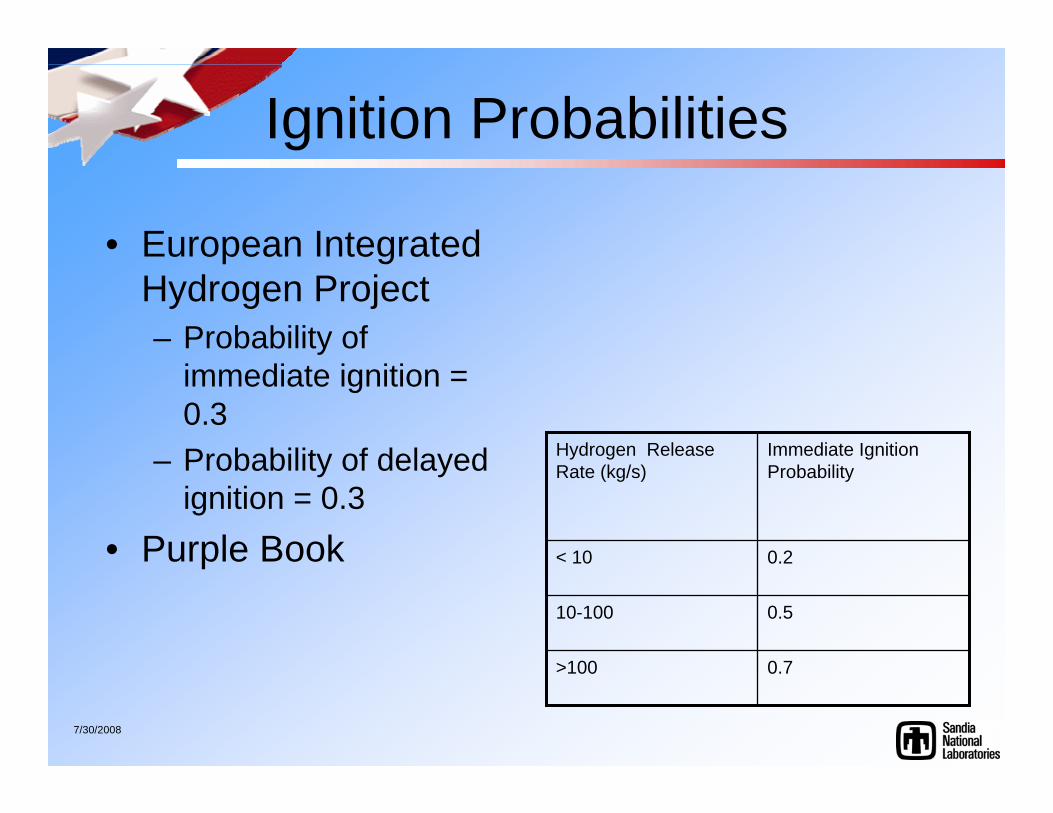
Ignition Probabilities
• European Integrated Hydrogen Project– Probability of
immediate ignition = 0.3
– Probability of delayed ignition = 0.3
• Purple Book
0.7>100
0.510-100
0.2< 10
Immediate Ignition Probability
Hydrogen Release Rate (kg/s)
7/30/2008
Data Summary• Component leak frequencies, component failure
probabilities, and hydrogen ignition probabilities are required for QRA
• Little hydrogen-specific data is currently available for traditional statistical analysis
• Bayesian methods can utilize this limited data to obtain the parameters required for QRA
• Additional hydrogen data will result in more realistic parameters
• Data generated in this effort is being used to risk-inform separation distances
7/30/2008
Reference
• C.L. Atwood, J.L. LaChance, H.F. Martz, D.J. Anderson, M. Englehardt, D. Whitehead, T. Wheeler, “Handbook of Parameter Estimation for Probabilistic Risk Assessment,” NUREG/CR-6823, U.S. Nuclear Regulatory Commission, Washington, D.C. (2003).
7/30/2008
Risk Acceptance and Harm Criteria
7/30/2008
Goal of Activity• Discuss risk and safety concepts• Develop uniform risk acceptance criteria
– Types of risk measures – Risk targets– Survey currently used risk criteria– Provide guidance on selection of uniform risk
acceptance criteria• Develop uniform harm criteria for use in
hydrogen QRA– Define criteria for all types of hydrogen accidents– Survey of currently used measures– Provide guidance on selection of uniform harm criteria
• Develop link to risk-informed codes and standards
7/30/2008
Risk Measures
• Human injury or fatality– Individual risk – probability that an average
unprotected person, permanently located at a certain location, is killed or injured due to an accident
– Societal risk – probability that multiple people within an area are killed or injured due to an accident (typically represented on an FN curve)
• Others– Economic loss – typically expressed in terms of loss
value (lost income and replacement cost)– Environmental damage – can be expressed in terms
of time required to recover damage to ecosystem
7/30/2008
Risk Exposed Persons
• Public – people located outside the facility boundary– People living and working near the facility– People visiting or traveling near the facility
• Customers – people using the facility– Limited exposure period
• Facility operators – personnel involved in operation, inspection, and maintenance of the facility– Generally assumed these people accept higher risk
levels than for customers and outside public
7/30/2008
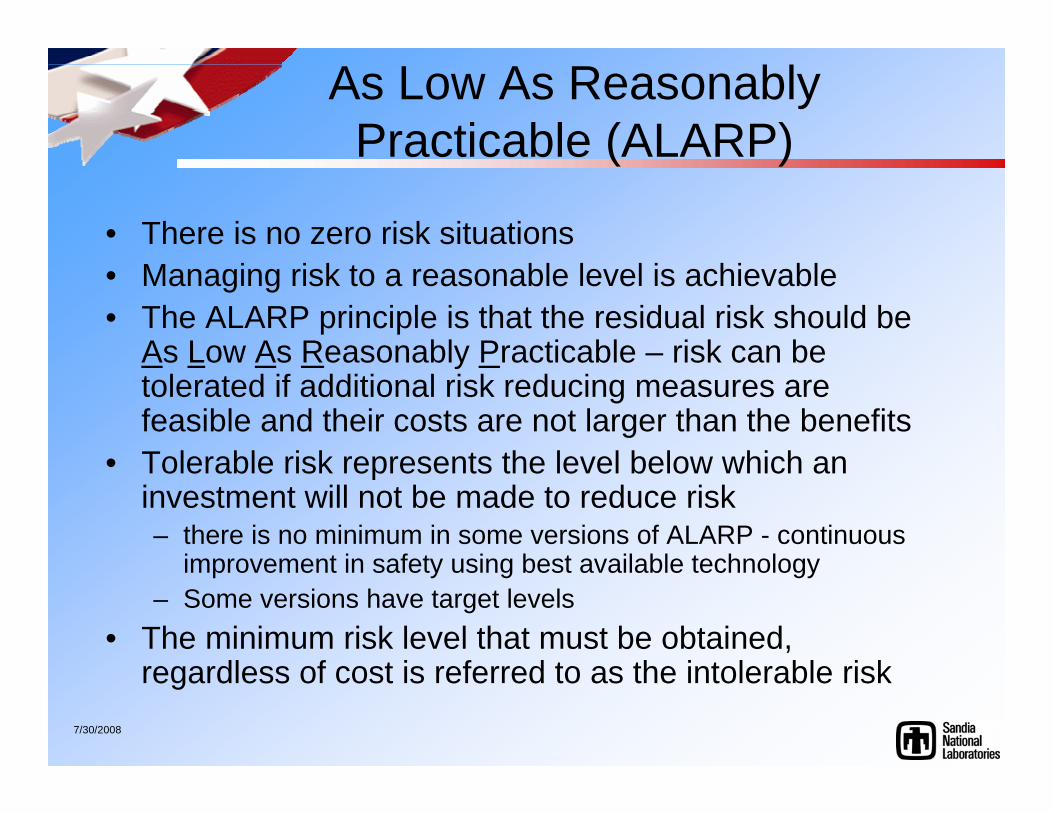
As Low As Reasonably Practicable (ALARP)
• There is no zero risk situations• Managing risk to a reasonable level is achievable• The ALARP principle is that the residual risk should be
As Low As Reasonably Practicable – risk can be tolerated if additional risk reducing measures are feasible and their costs are not larger than the benefits
• Tolerable risk represents the level below which an investment will not be made to reduce risk – there is no minimum in some versions of ALARP - continuous
improvement in safety using best available technology– Some versions have target levels
• The minimum risk level that must be obtained, regardless of cost is referred to as the intolerable risk
7/30/2008
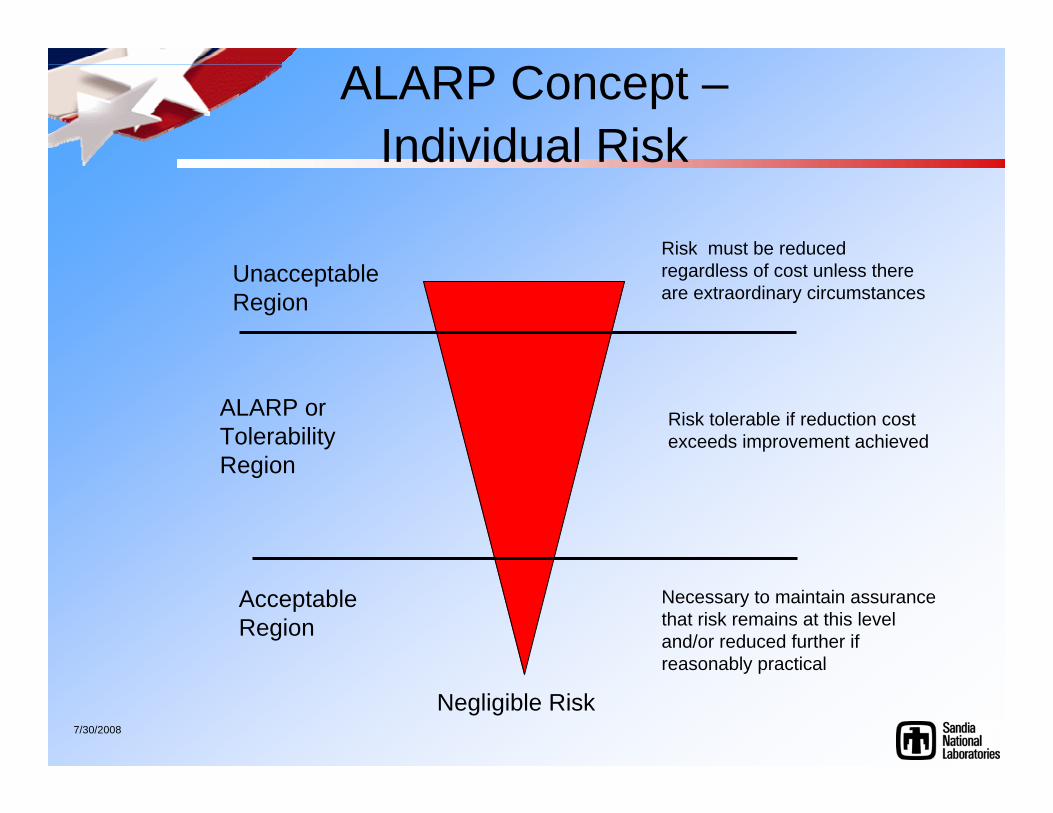
ALARP Concept –Individual Risk
ALARP or Tolerability Region
Unacceptable Region
Acceptable Region
Risk must be reduced regardless of cost unless there are extraordinary circumstances
Necessary to maintain assurance that risk remains at this level and/or reduced further if reasonably practical
Negligible Risk
Risk tolerable if reduction cost exceeds improvement achieved
7/30/2008
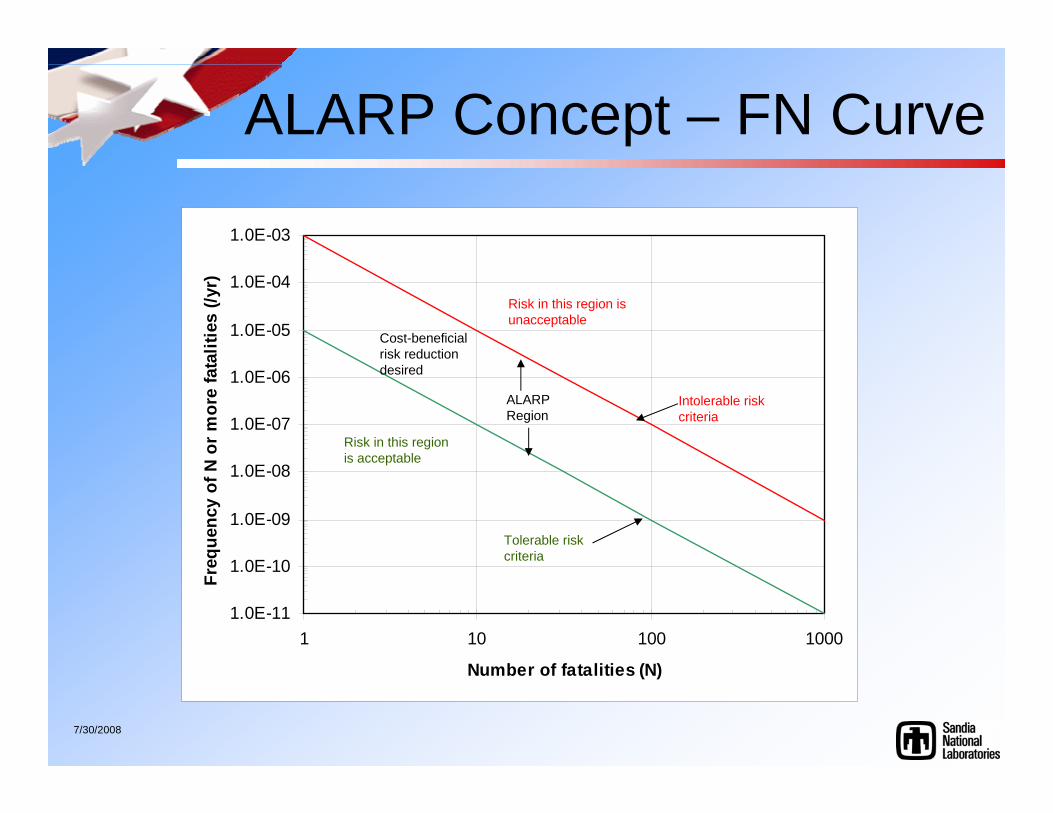
ALARP Concept – FN Curve
1.0E-11
1.0E-10
1.0E-09
1.0E-08
1.0E-07
1.0E-06
1.0E-05
1.0E-04
1.0E-03
1 10 100 1000
Number of fatalities (N)
Freq
uenc
y of
N o
r mor
e fa
talit
ies
(/yr)
ALARP Region
Intolerable risk criteria
Risk in this region is unacceptable
Risk in this region is acceptable
Cost-beneficial risk reduction desired
Tolerable risk criteria
7/30/2008
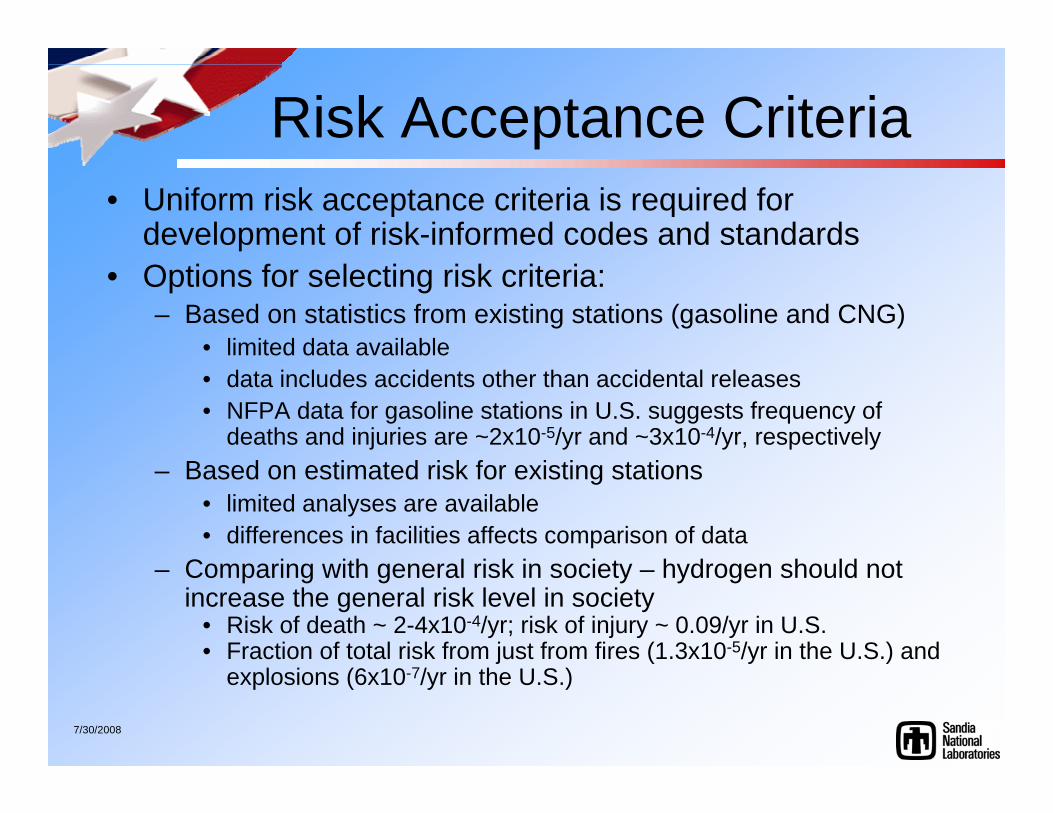
Risk Acceptance Criteria• Uniform risk acceptance criteria is required for
development of risk-informed codes and standards• Options for selecting risk criteria:
– Based on statistics from existing stations (gasoline and CNG) • limited data available• data includes accidents other than accidental releases• NFPA data for gasoline stations in U.S. suggests frequency of
deaths and injuries are ~2x10⁻⁵/yr and ~3x10⁻⁴/yr, respectively– Based on estimated risk for existing stations
• limited analyses are available • differences in facilities affects comparison of data
– Comparing with general risk in society – hydrogen should not increase the general risk level in society
• Risk of death ~ 2-4x10⁻⁴/yr; risk of injury ~ 0.09/yr in U.S.• Fraction of total risk from just from fires (1.3x10⁻⁵/yr in the U.S.) and
explosions (6x10⁻⁷/yr in the U.S.)
7/30/2008
Survey of Individual Risk Criteria for Public
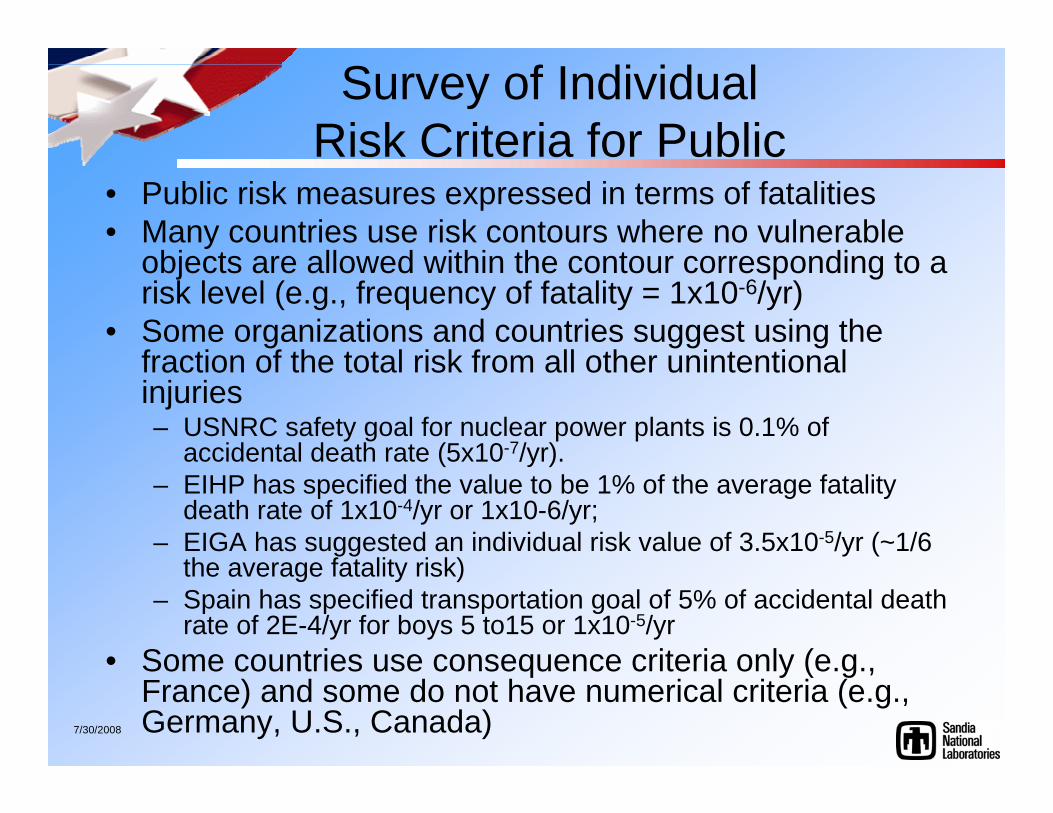
• Public risk measures expressed in terms of fatalities• Many countries use risk contours where no vulnerable
objects are allowed within the contour corresponding to a risk level (e.g., frequency of fatality = 1x10⁻⁶/yr)
• Some organizations and countries suggest using the fraction of the total risk from all other unintentional injuries – USNRC safety goal for nuclear power plants is 0.1% of
accidental death rate (5x10⁻⁷/yr).– EIHP has specified the value to be 1% of the average fatality
death rate of 1x10⁻⁴/yr or 1x10⁻⁶/yr;– EIGA has suggested an individual risk value of 3.5x10⁻⁵/yr (~1/6
the average fatality risk) – Spain has specified transportation goal of 5% of accidental death
rate of 2E-4/yr for boys 5 to15 or 1x10⁻⁵/yr• Some countries use consequence criteria only (e.g.,
France) and some do not have numerical criteria (e.g., Germany, U.S., Canada)
7/30/2008
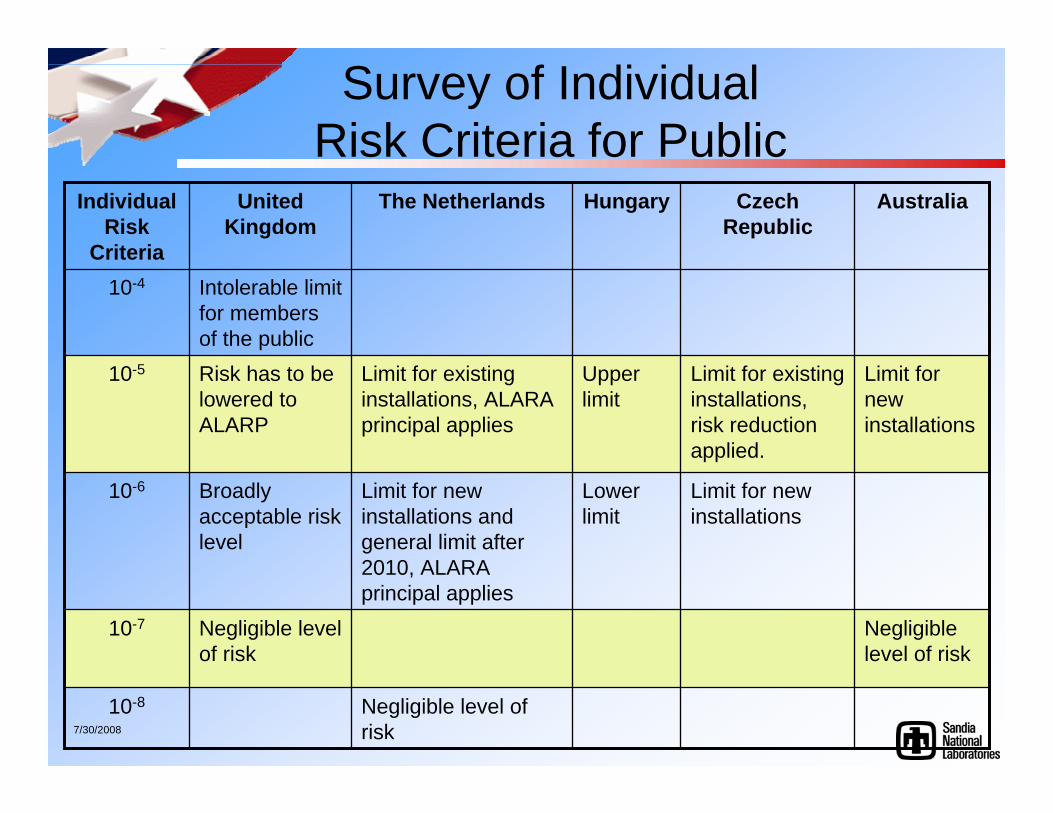
Survey of Individual Risk Criteria for Public
Negligible level of risk
10-8
Negligible level of risk
Negligible level of risk
10-7
Limit for new installations
Lower limit
Limit for new installations and general limit after 2010, ALARA principal applies
Broadly acceptable risk level
10-6
Limit for new installations
Limit for existing installations, risk reduction applied.
Upper limit
Limit for existing installations, ALARA principal applies
Risk has to be lowered to ALARP
10-5
Intolerable limit for members of the public
10-4
AustraliaCzech Republic
HungaryThe NetherlandsUnited Kingdom
Individual Risk
Criteria
7/30/2008
Survey of Individual Risk Criteria for Others
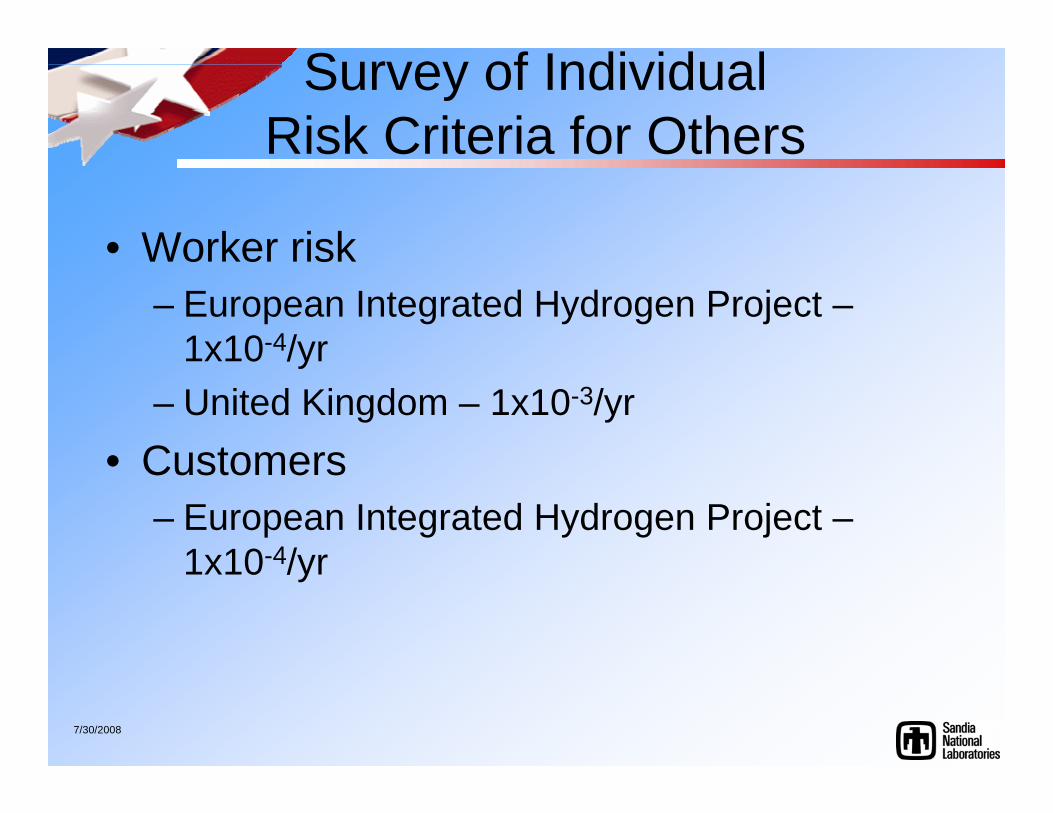
• Worker risk– European Integrated Hydrogen Project –
1x10⁻⁴/yr– United Kingdom – 1x10⁻³/yr
• Customers– European Integrated Hydrogen Project –
1x10⁻⁴/yr
7/30/2008
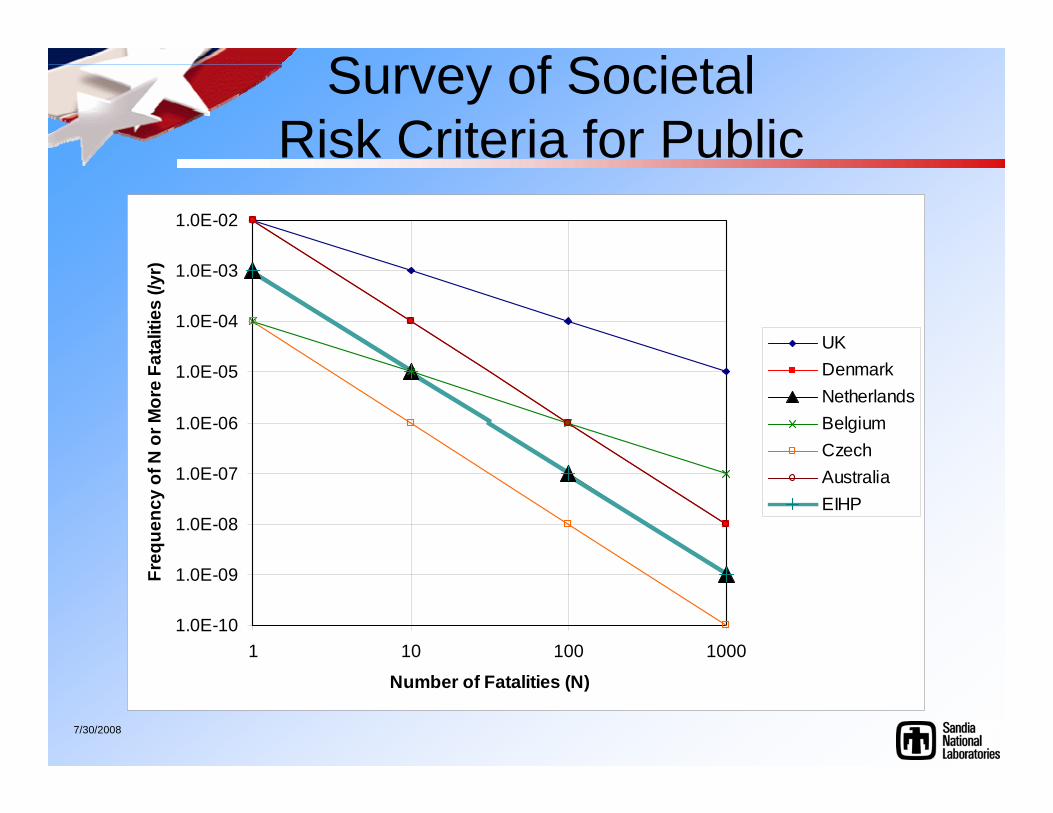
Survey of Societal Risk Criteria for Public
1.0E-10
1.0E-09
1.0E-08
1.0E-07
1.0E-06
1.0E-05
1.0E-04
1.0E-03
1.0E-02
1 10 100 1000
Number of Fatalities (N)
Freq
uenc
y of
N o
r Mor
e Fa
talit
ies
(/yr)
UKDenmarkNetherlandsBelgiumCzech AustraliaEIHP
7/30/2008
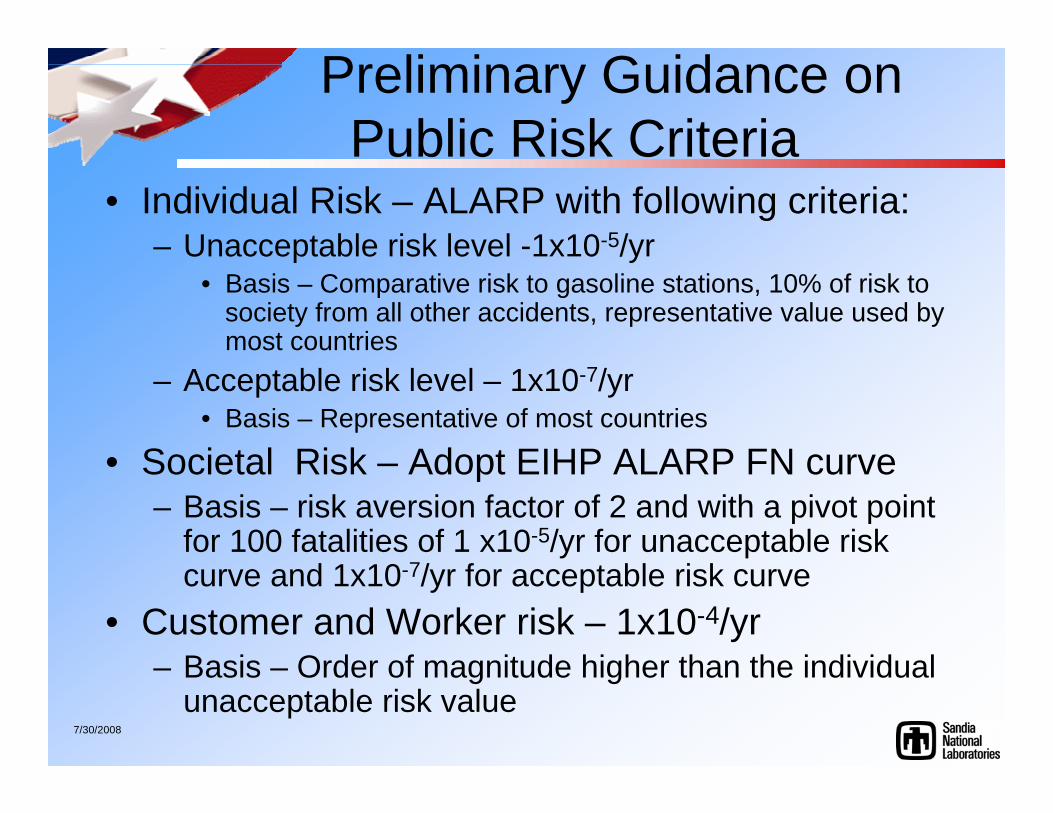
Preliminary Guidance on Public Risk Criteria
• Individual Risk – ALARP with following criteria:– Unacceptable risk level -1x10⁻⁵/yr
• Basis – Comparative risk to gasoline stations, 10% of risk to society from all other accidents, representative value used by most countries
– Acceptable risk level – 1x10⁻⁷/yr• Basis – Representative of most countries
• Societal Risk – Adopt EIHP ALARP FN curve– Basis – risk aversion factor of 2 and with a pivot point
for 100 fatalities of 1 x10⁻⁵/yr for unacceptable risk curve and 1x10⁻⁷/yr for acceptable risk curve
• Customer and Worker risk – 1x10⁻⁴/yr– Basis – Order of magnitude higher than the individual
unacceptable risk value
7/30/2008
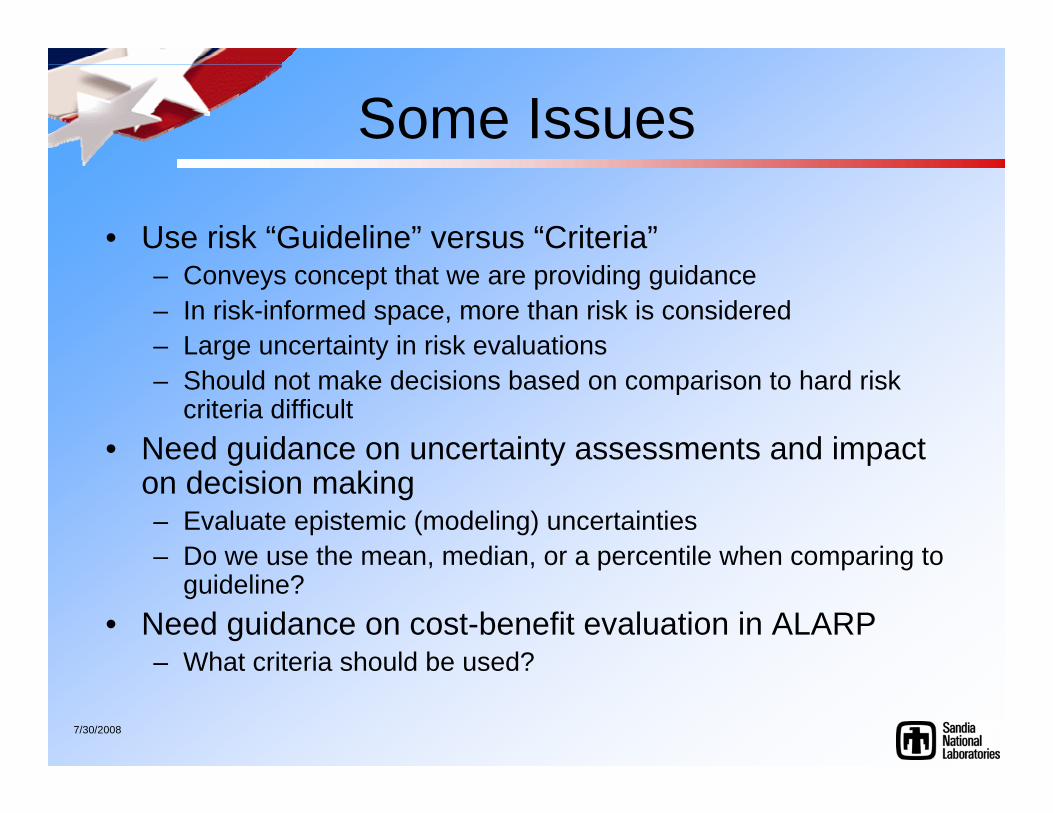
Some Issues
• Use risk “Guideline” versus “Criteria”– Conveys concept that we are providing guidance– In risk-informed space, more than risk is considered – Large uncertainty in risk evaluations– Should not make decisions based on comparison to hard risk
criteria difficult• Need guidance on uncertainty assessments and impact
on decision making– Evaluate epistemic (modeling) uncertainties– Do we use the mean, median, or a percentile when comparing to
guideline?• Need guidance on cost-benefit evaluation in ALARP
– What criteria should be used?
7/30/2008
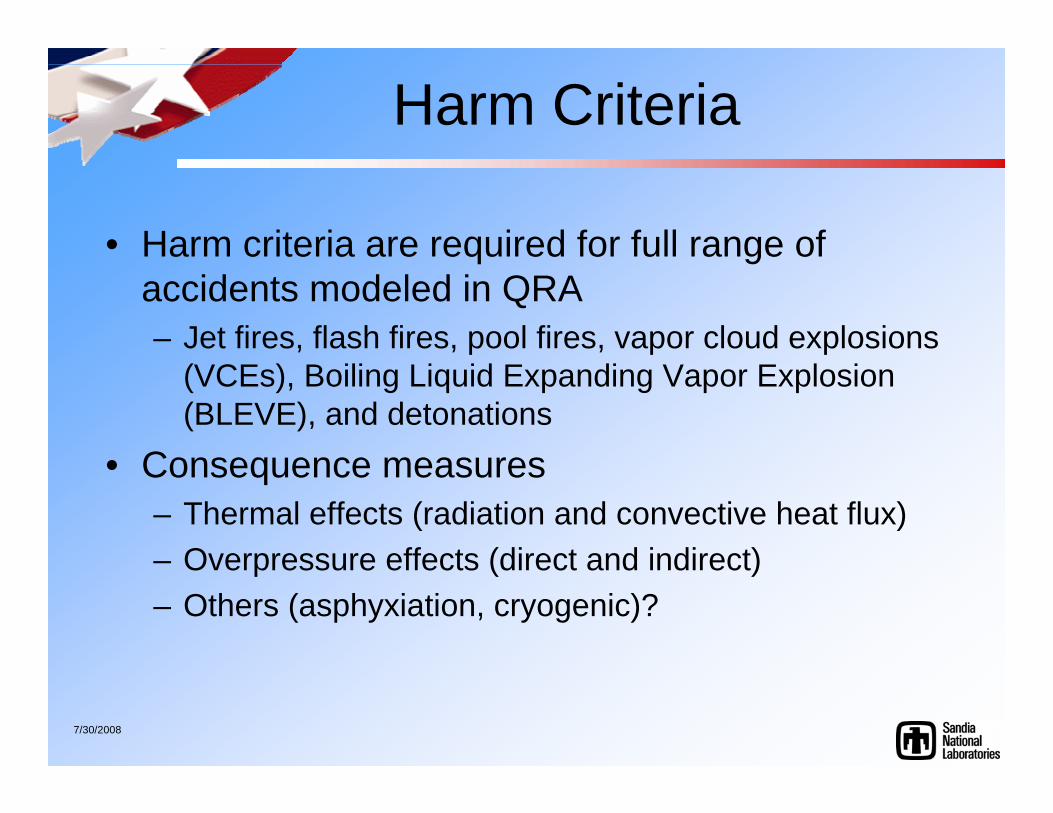
Harm Criteria
• Harm criteria are required for full range of accidents modeled in QRA– Jet fires, flash fires, pool fires, vapor cloud explosions
(VCEs), Boiling Liquid Expanding Vapor Explosion (BLEVE), and detonations
• Consequence measures– Thermal effects (radiation and convective heat flux)– Overpressure effects (direct and indirect)– Others (asphyxiation, cryogenic)?
7/30/2008
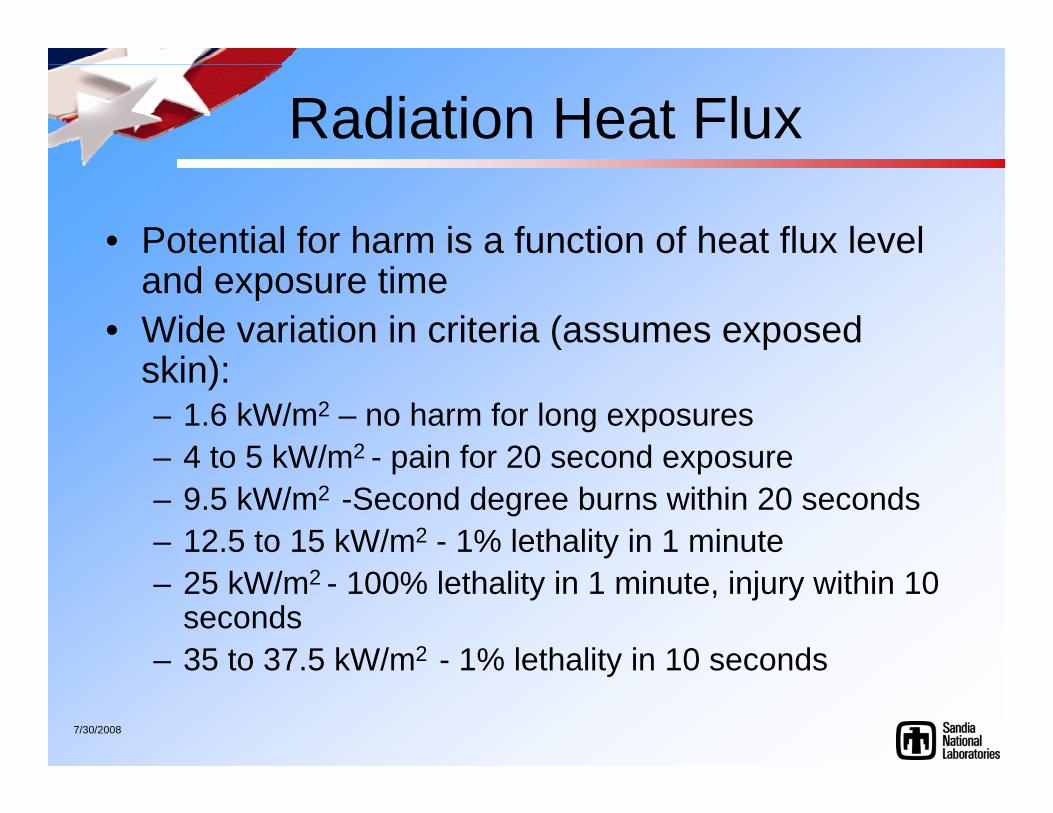
Radiation Heat Flux
• Potential for harm is a function of heat flux level and exposure time
• Wide variation in criteria (assumes exposed skin):– 1.6 kW/m2 – no harm for long exposures– 4 to 5 kW/m2 - pain for 20 second exposure– 9.5 kW/m2 -Second degree burns within 20 seconds– 12.5 to 15 kW/m2 - 1% lethality in 1 minute – 25 kW/m2 - 100% lethality in 1 minute, injury within 10
seconds– 35 to 37.5 kW/m2 - 1% lethality in 10 seconds
7/30/2008
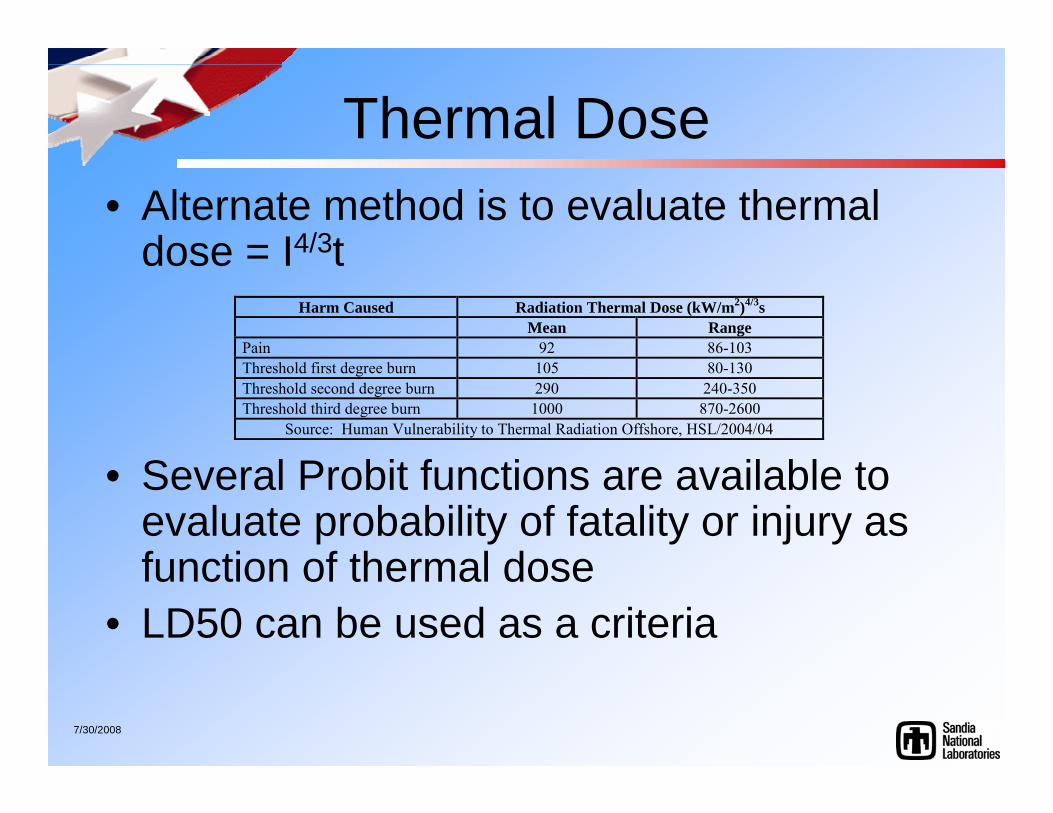
Thermal Dose• Alternate method is to evaluate thermal
dose = I4/3t
• Several Probit functions are available to evaluate probability of fatality or injury as function of thermal dose
• LD50 can be used as a criteria
Harm Caused Radiation Thermal Dose (kW/m2)4/3s Mean Range
Pain 92 86-103 Threshold first degree burn 105 80-130 Threshold second degree burn 290 240-350 Threshold third degree burn 1000 870-2600
Source: Human Vulnerability to Thermal Radiation Offshore, HSL/2004/04
7/30/2008
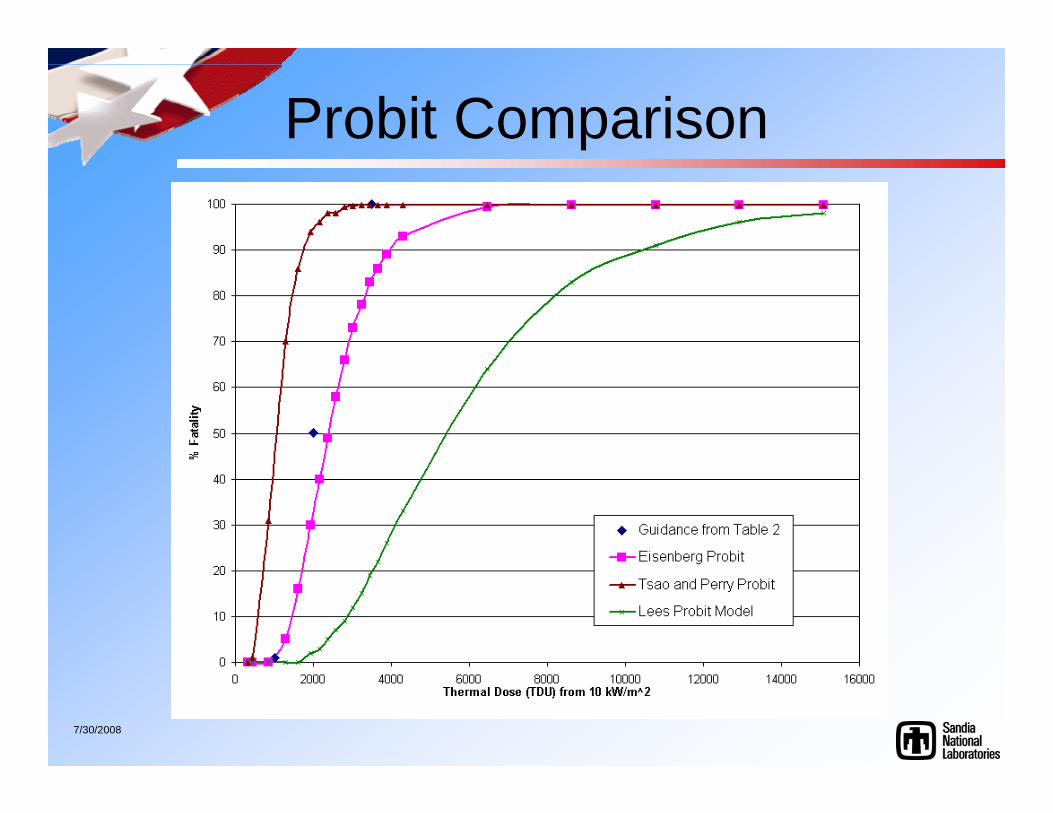
Probit Comparison
7/30/2008
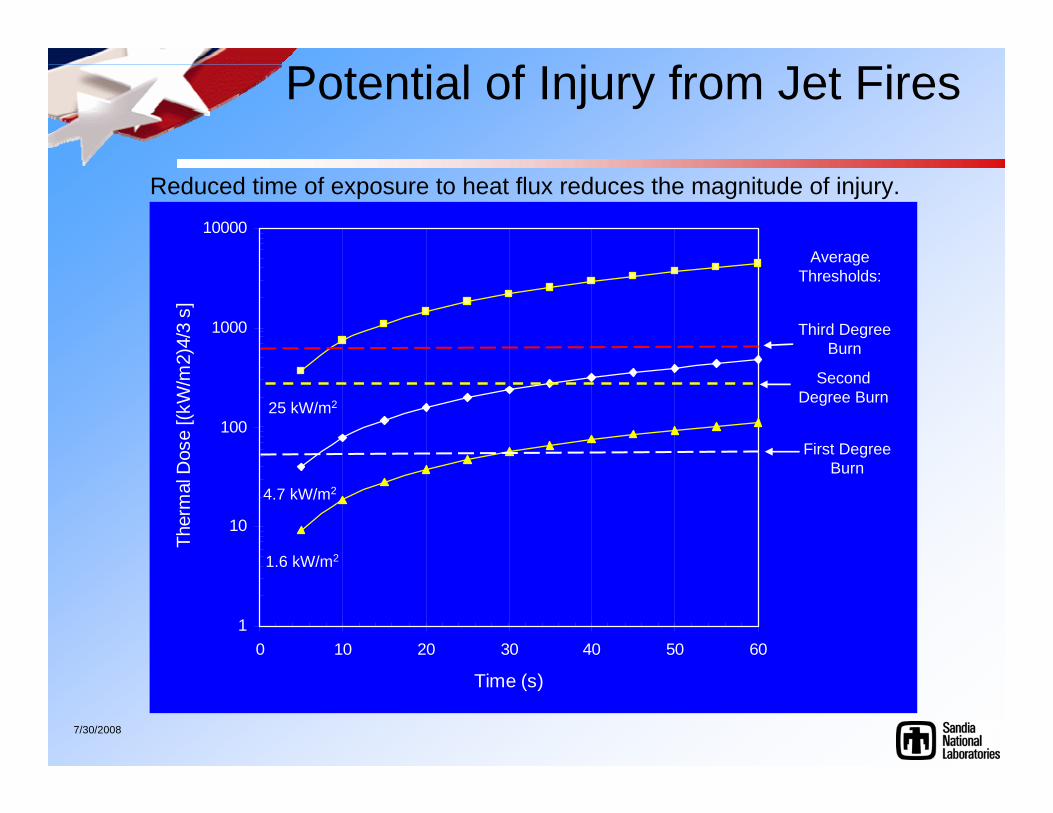
Potential of Injury from Jet Fires
1
10
100
1000
10000
0 10 20 30 40 50 60
Time (s)
Ther
mal
Dos
e [(k
W/m
2)4/
3 s]
1.6 kW/m2
4.7 kW/m2
25 kW/m2
Average Thresholds:
Third Degree Burn
Second Degree Burn
First Degree Burn
Reduced time of exposure to heat flux reduces the magnitude of injury.
7/30/2008
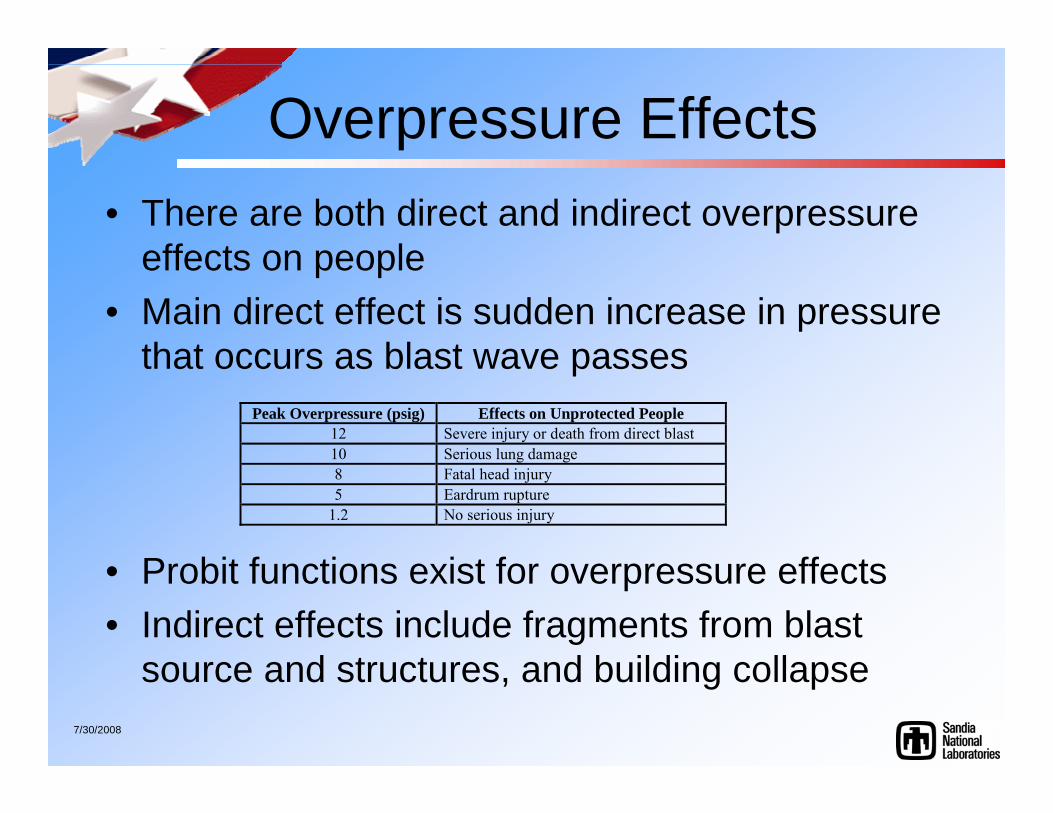
Overpressure Effects• There are both direct and indirect overpressure
effects on people• Main direct effect is sudden increase in pressure
that occurs as blast wave passes
• Probit functions exist for overpressure effects• Indirect effects include fragments from blast
source and structures, and building collapse
Peak Overpressure (psig) Effects on Unprotected People
12 Severe injury or death from direct blast 10 Serious lung damage 8 Fatal head injury 5 Eardrum rupture
1.2 No serious injury
7/30/2008
Application of QRA:Risk-Informed
Separation Distances for Use in NFPA Hydrogen Codes and
Standards
7/30/2008
Risk-Informed Codes and Standards
• Use of a risk-informed process is one way to establish the requirements necessary to ensure public safety– Endorsed by Fire Protection Research Foundation
(“Guidance Document for Incorporating Risk Concepts into NFPA Codes & Standards”)
– Comprehensive QRA used to identify and quantify scenarios leading to hydrogen release and ignition
– Accident prevention and mitigation requirements identified based on QRA
– Results combined with other considerations to establish minimum code and standard requirements needed for an established risk level
7/30/2008
Separation Distances• Specified distances in codes for separating H2
components from the public, structures, other flammable material, and ignition sources – Current distances in NFPA 55 for hydrogen gas are function of
gas volume– Current distances do not reflect high pressures (70 MPa) being
used in refueling stations– Documented basis for current distances not found
• Several options possible to help establish new separation distances– Deterministically determined based on selected break size (e.g.,
20% flow area)– Based only on risk evaluation as suggested by the European
Industrial Gas Association (IGC Doc 75/07/E)– Risk-informed process that combines risk information,
deterministic analyses, and other considerations to make decisions
7/30/2008
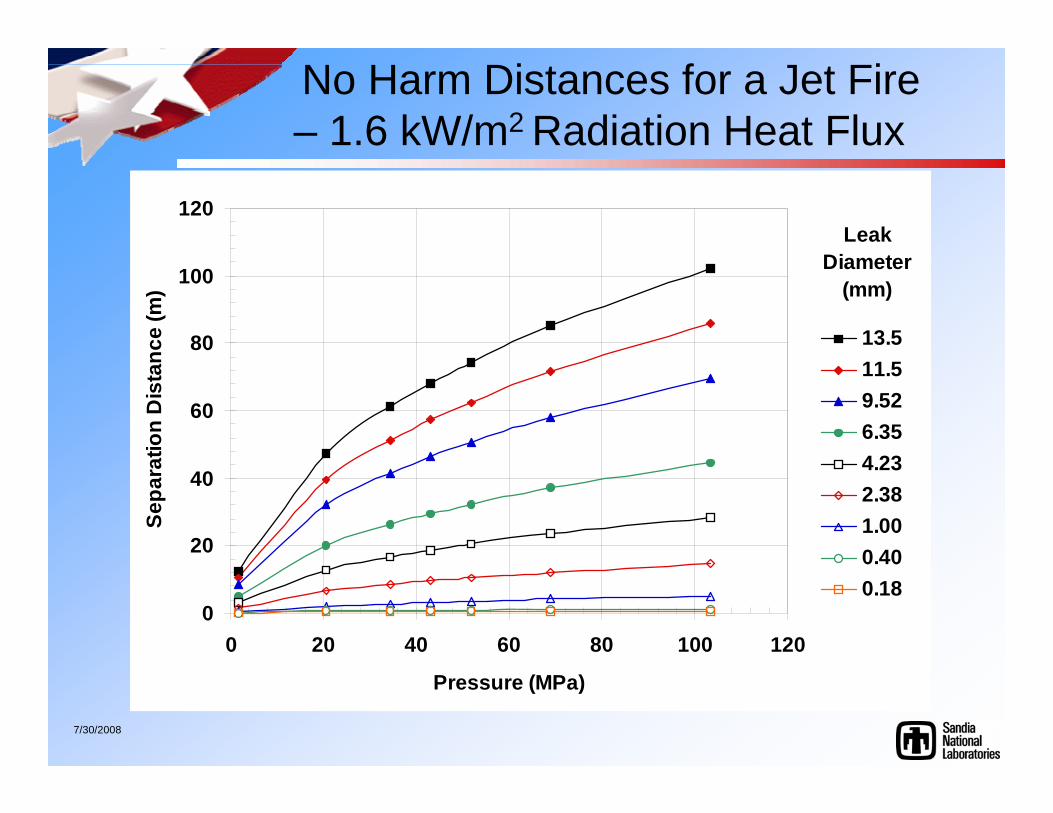
Sandia Hydrogen Leak Model• Used to evaluate safety distances for hydrogen
jets• Model predicts (as function of system volume,
pressure, and leak size):– Radiant heat flux from hydrogen jet flames– Visible flame length for ignited jets– Hydrogen concentrations in jets
• Assumes circular orifice for leak geometry and constant pressure - conservative
• Model validated against Sandia/SRI experimentsReference: Houf and Schefer, “Predicting
Radiative Heat Fluxes and Flammability Envelopes from Unintended Releases of Hydrogen,” IJHE Paper GI-353
7/30/2008
No Harm Distances for a Jet Fire – 1.6 kW/m2 Radiation Heat Flux
0
20
40
60
80
100
120
0 20 40 60 80 100 120
Pressure (MPa)
Sepa
ratio
n D
ista
nce
(m)
13.511.59.526.354.232.381.000.400.18
Leak Diameter
(mm)
7/30/2008
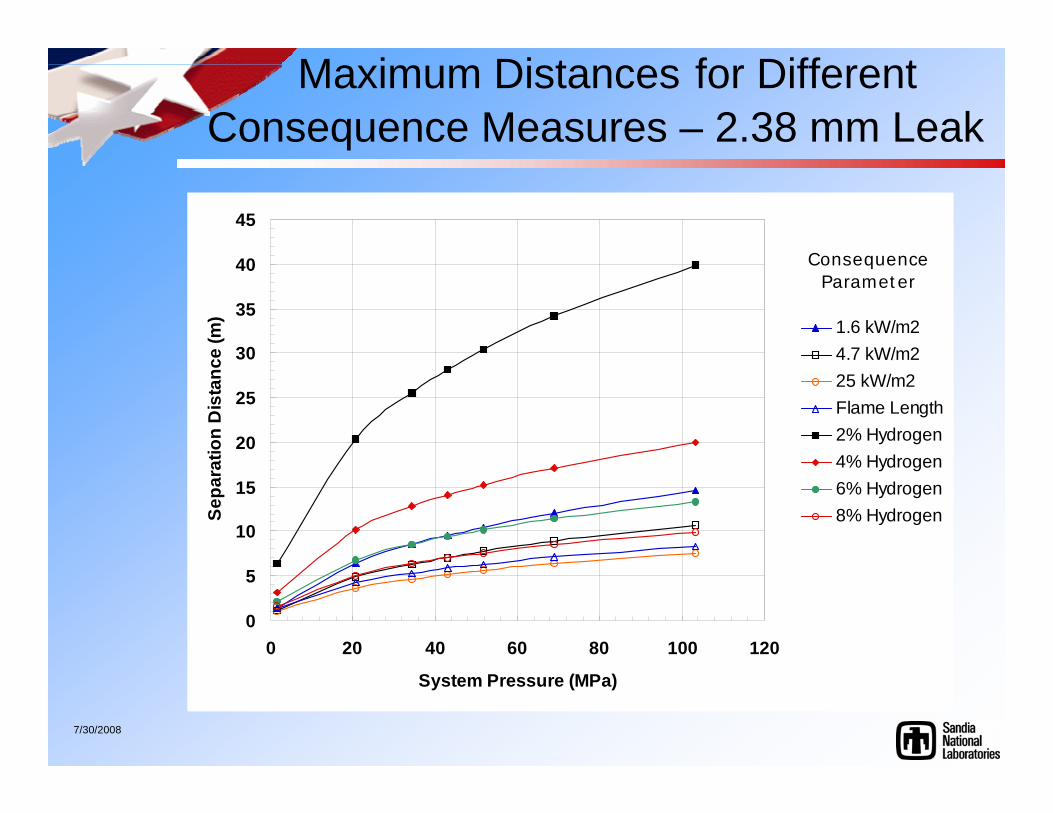
Maximum Distances for Different Consequence Measures – 2.38 mm Leak
0
5
10
15
20
25
30
35
40
45
0 20 40 60 80 100 120
System Pressure (MPa)
Sepa
ratio
n D
ista
nce
(m) 1.6 kW/m2
4.7 kW/m225 kW/m2Flame Length2% Hydrogen4% Hydrogen6% Hydrogen8% Hydrogen
Consequence Parameter
7/30/2008
Basis for Selecting Leak Diameter
• Examined appropriate leakage data to determine leak size distribution– Selected leak size that encompasses a 95%
percent of leaks within a system• Used QRA to determine if risk from leaks
greater than selected leak size is acceptable
7/30/2008
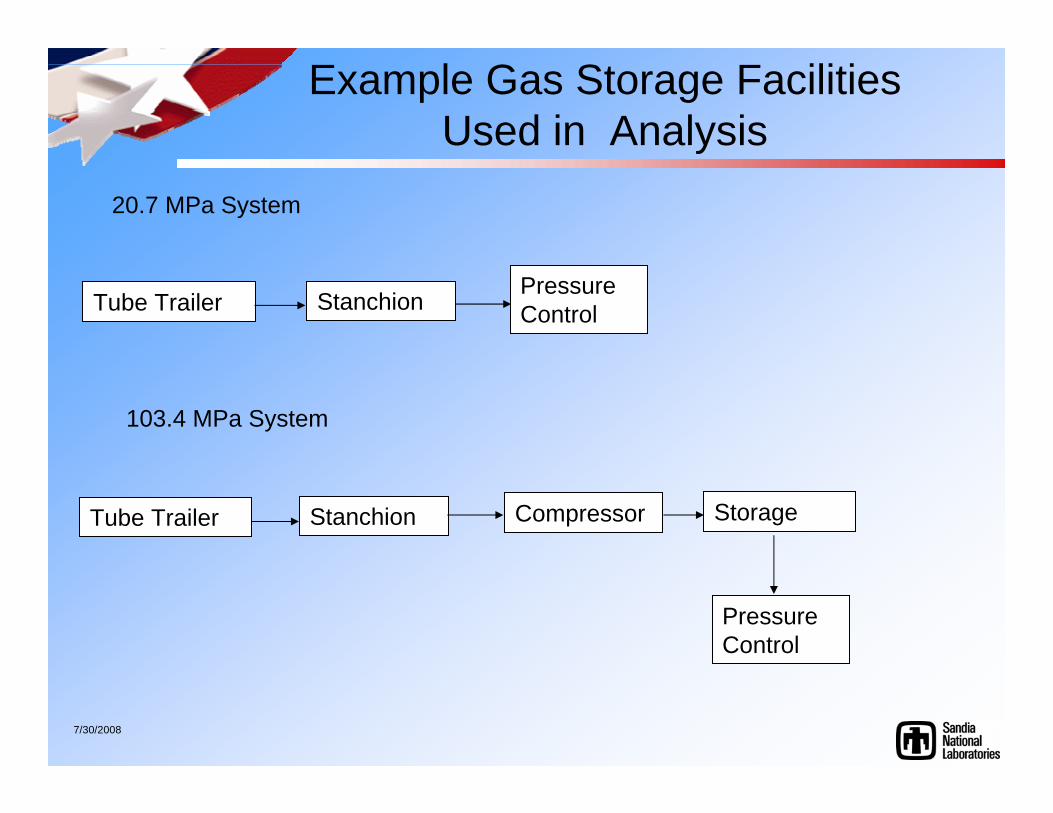
Example Gas Storage Facilities Used in Analysis
Tube Trailer StanchionPressure Control
20.7 MPa System
103.4 MPa System
Tube Trailer Stanchion
Pressure Control
Compressor Storage
7/30/2008
20.7 MPa Gas Storage Facility
7/30/2008
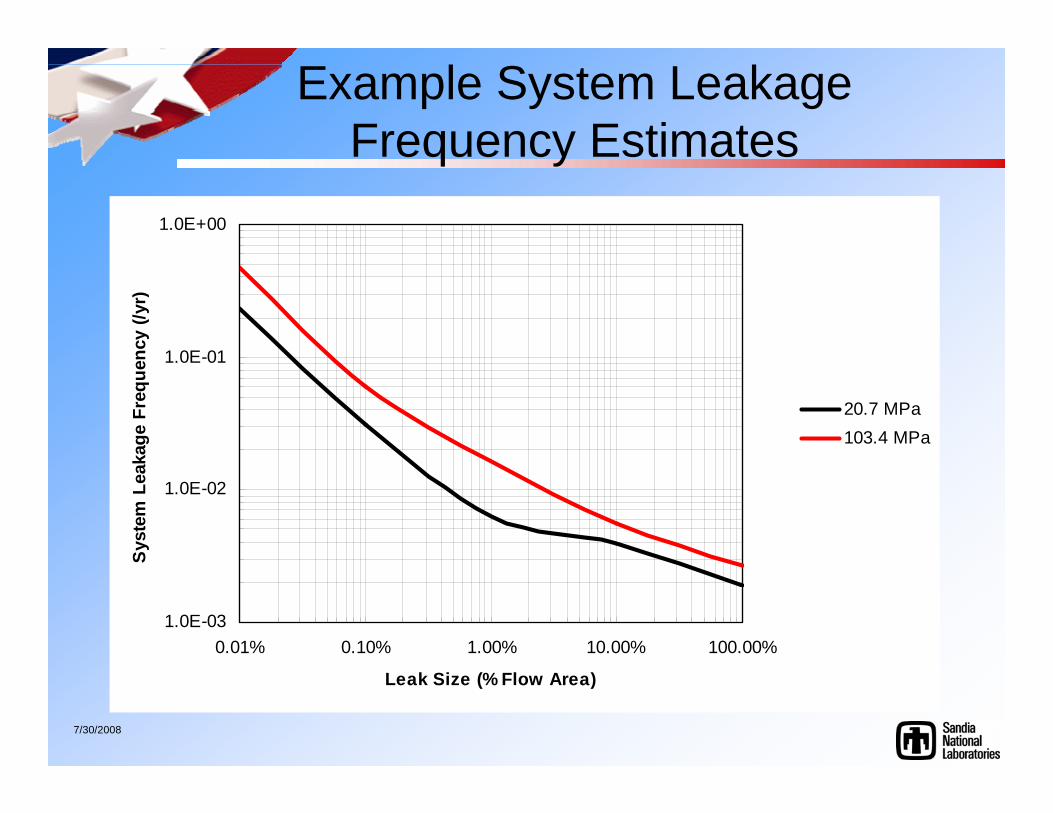
Example System Leakage Frequency Estimates
1.0E-03
1.0E-02
1.0E-01
1.0E+00
0.01% 0.10% 1.00% 10.00% 100.00%
Leak Size (% Flow Area)
Sys
tem
Lea
kage
Fre
quen
cy (/
yr)
20.7 MPa103.4 MPa
7/30/2008
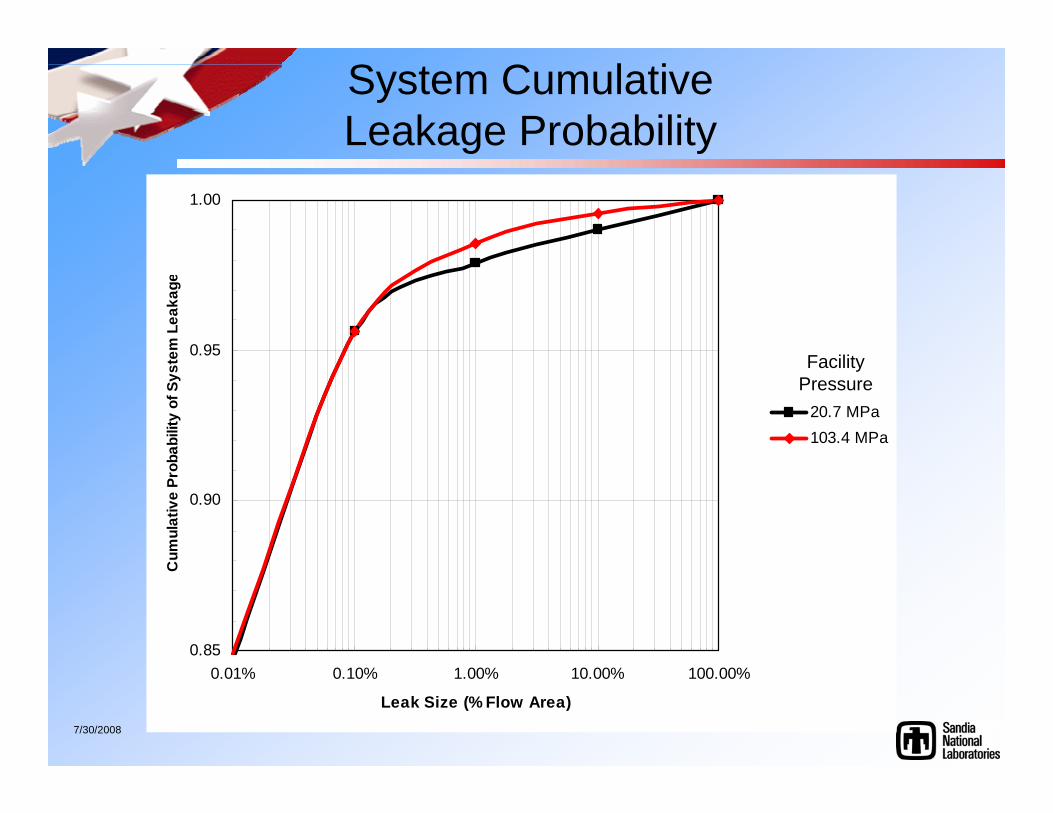
System Cumulative Leakage Probability
0.85
0.90
0.95
1.00
0.01% 0.10% 1.00% 10.00% 100.00%
Leak Size (% Flow Area)
Cum
ulat
ive
Prob
abili
ty o
f Sys
tem
Lea
kage
20.7 MPa103.4 MPa
Facility Pressure
7/30/2008
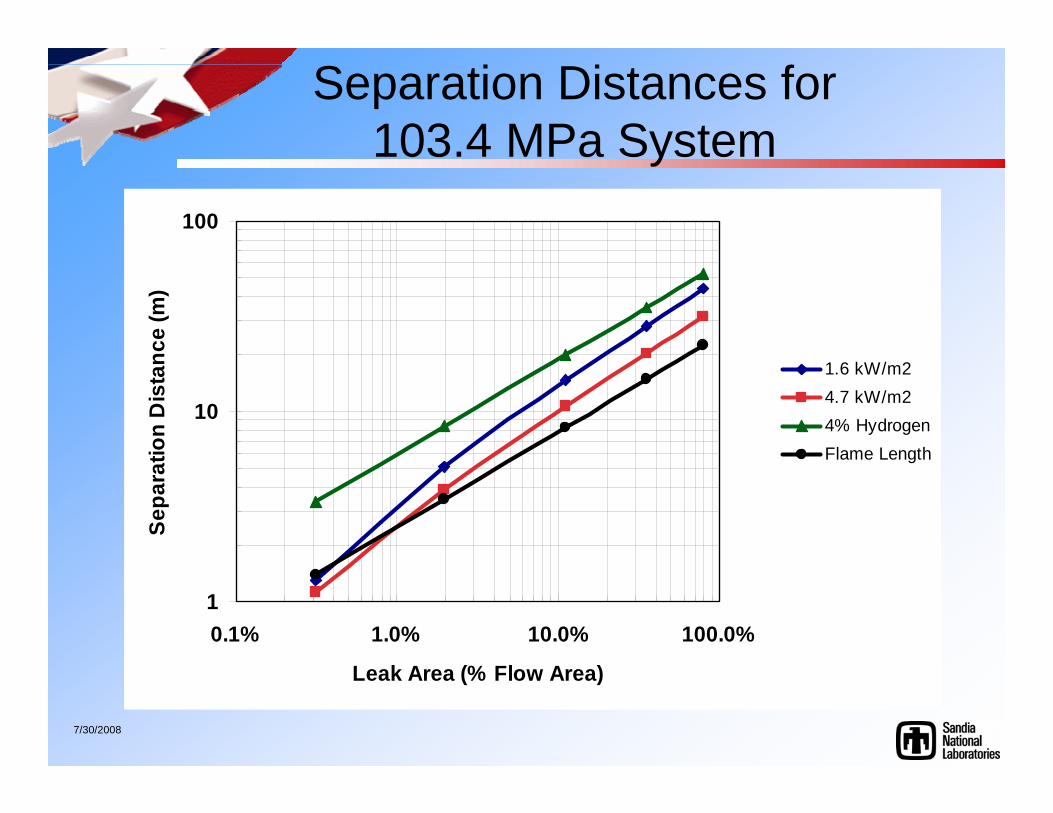
Separation Distances for 103.4 MPa System
1
10
100
0.1% 1.0% 10.0% 100.0%
Leak Area (% Flow Area)
Sepa
ratio
n D
ista
nce
(m)
1.6 kW/m24.7 kW/m24% HydrogenFlame Length
7/30/2008
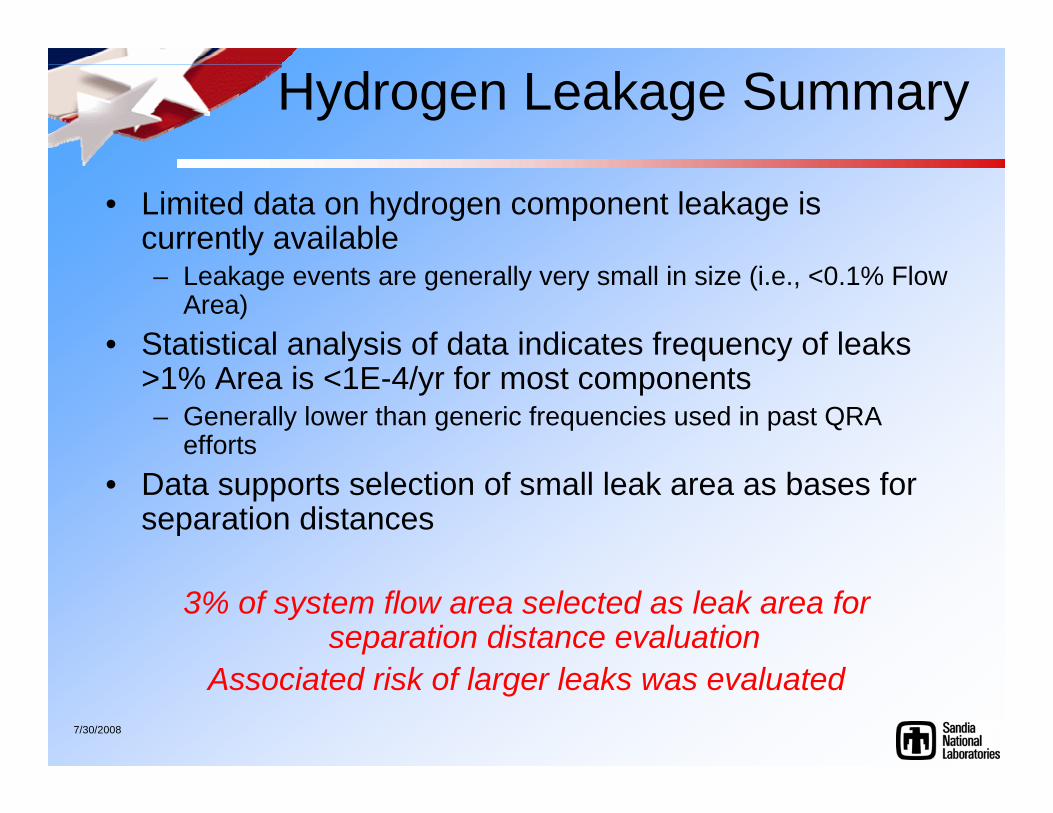
Hydrogen Leakage Summary
• Limited data on hydrogen component leakage is currently available– Leakage events are generally very small in size (i.e., <0.1% Flow
Area)• Statistical analysis of data indicates frequency of leaks
>1% Area is <1E-4/yr for most components – Generally lower than generic frequencies used in past QRA
efforts• Data supports selection of small leak area as bases for
separation distances
3% of system flow area selected as leak area for separation distance evaluation
Associated risk of larger leaks was evaluated
7/30/2008
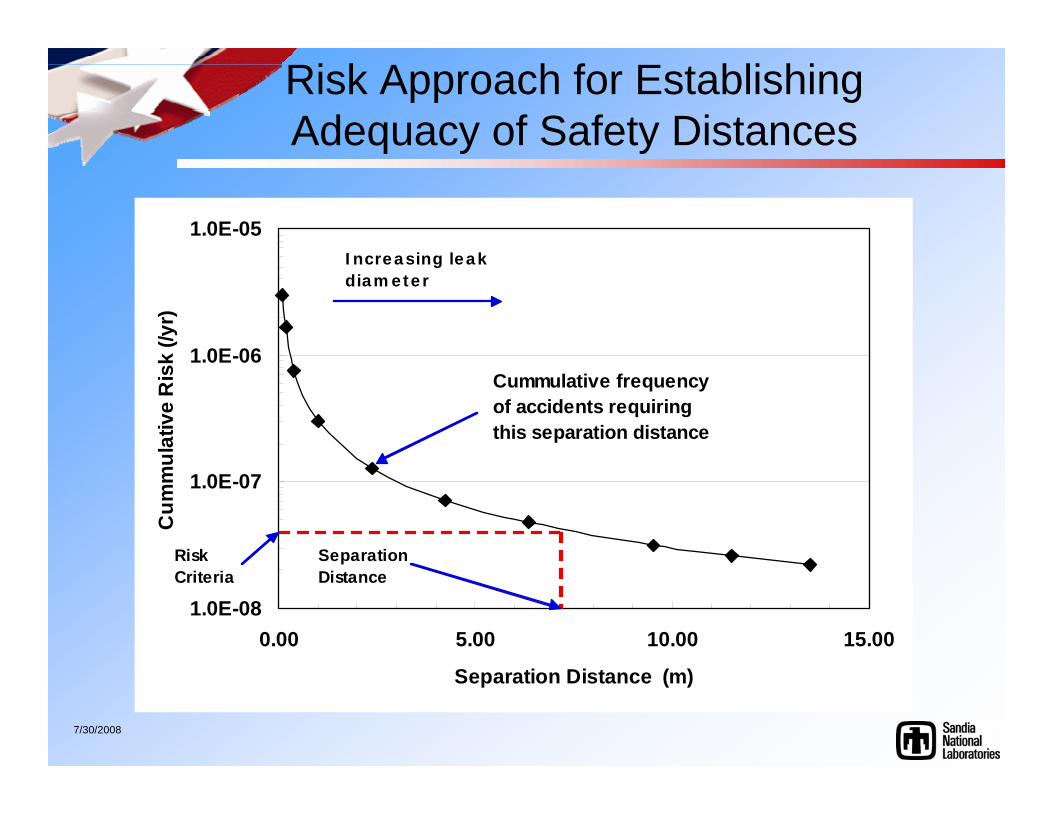
Risk Approach for Establishing Adequacy of Safety Distances
1.0E-08
1.0E-07
1.0E-06
1.0E-05
0.00 5.00 10.00 15.00
Separation Distance (m)
Cum
mul
ativ
e R
isk
(/yr)
Risk Criteria
Separation Distance
Cummulative frequency of accidents requiring this separation distance
Increasing leak diameter
7/30/2008
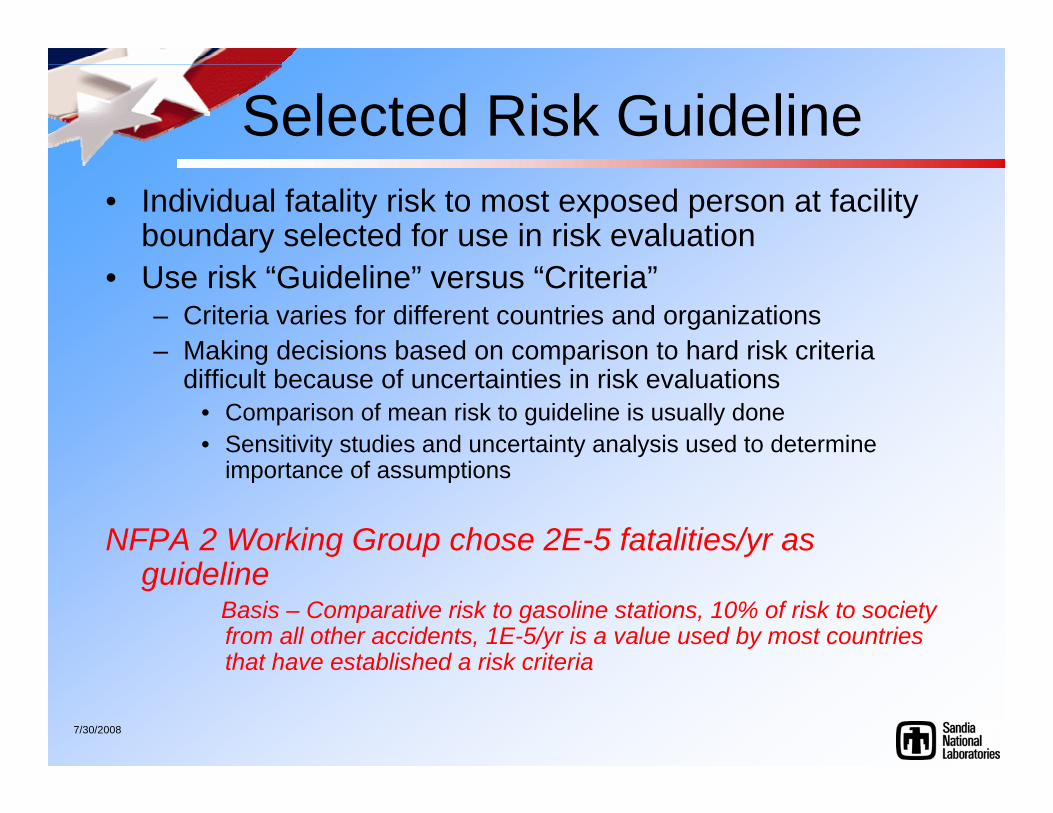
Selected Risk Guideline• Individual fatality risk to most exposed person at facility
boundary selected for use in risk evaluation• Use risk “Guideline” versus “Criteria”
– Criteria varies for different countries and organizations – Making decisions based on comparison to hard risk criteria
difficult because of uncertainties in risk evaluations• Comparison of mean risk to guideline is usually done• Sensitivity studies and uncertainty analysis used to determine
importance of assumptions
NFPA 2 Working Group chose 2E-5 fatalities/yr as guideline
Basis – Comparative risk to gasoline stations, 10% of risk to society from all other accidents, 1E-5/yr is a value used by most countries that have established a risk criteria
7/30/2008
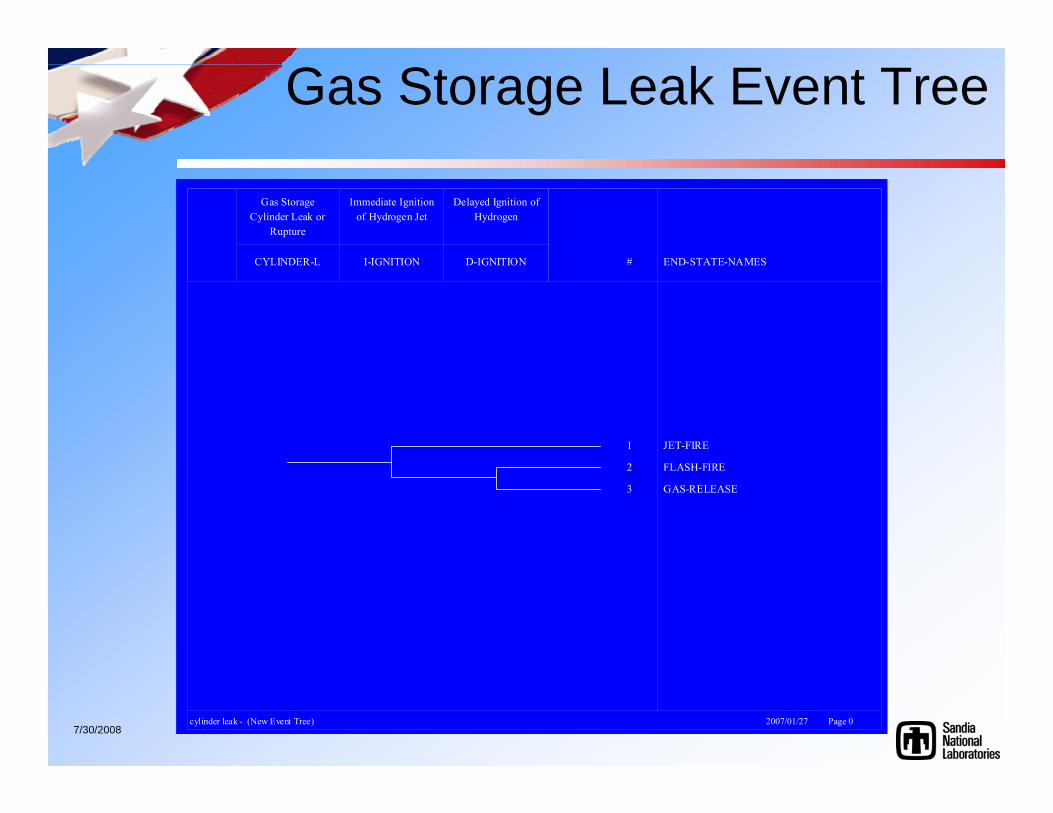
Gas Storage Leak Event Tree
D-IGNITION
Delayed Ignition ofHydrogen
I-IGNITION
Immediate Ignitionof Hydrogen Jet
CYLINDER-L
Gas StorageCylinder Leak or
Rupture
# END-STATE-NAMES
1 JET-FIRE
2 FLASH-FIRE
3 GAS-RELEASE
cylinder leak - (New Event Tree) 2007/01/27 Page 0
7/30/2008
Risk Analysis Facts
• Used leak frequencies from Bayesian analysis that incorporates hydrogen-specific data
• Used DNV ignition probabilities• Used Tsao and Perry Probit function• Currently only includes random leakage events
(common to all facilities)• No VCEs included in analysis (high momentum
jets)• No volume effects have been incorporated
(conservative)• Assumes circular leaks (conservative)
7/30/2008
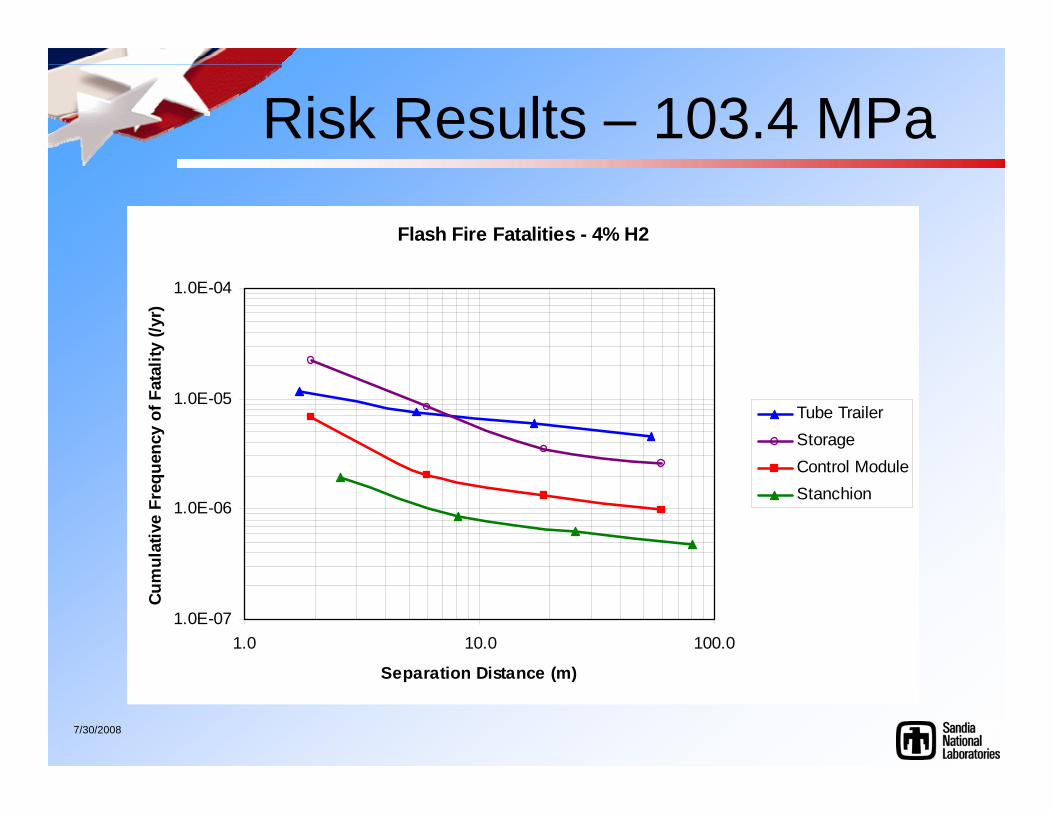
Risk Results – 103.4 MPa
Flash Fire Fatalities - 4% H2
1.0E-07
1.0E-06
1.0E-05
1.0E-04
1.0 10.0 100.0
Separation Distance (m)
Cum
ulat
ive
Freq
uenc
y of
Fat
ality
(/yr
)
Tube TrailerStorageControl ModuleStanchion
7/30/2008
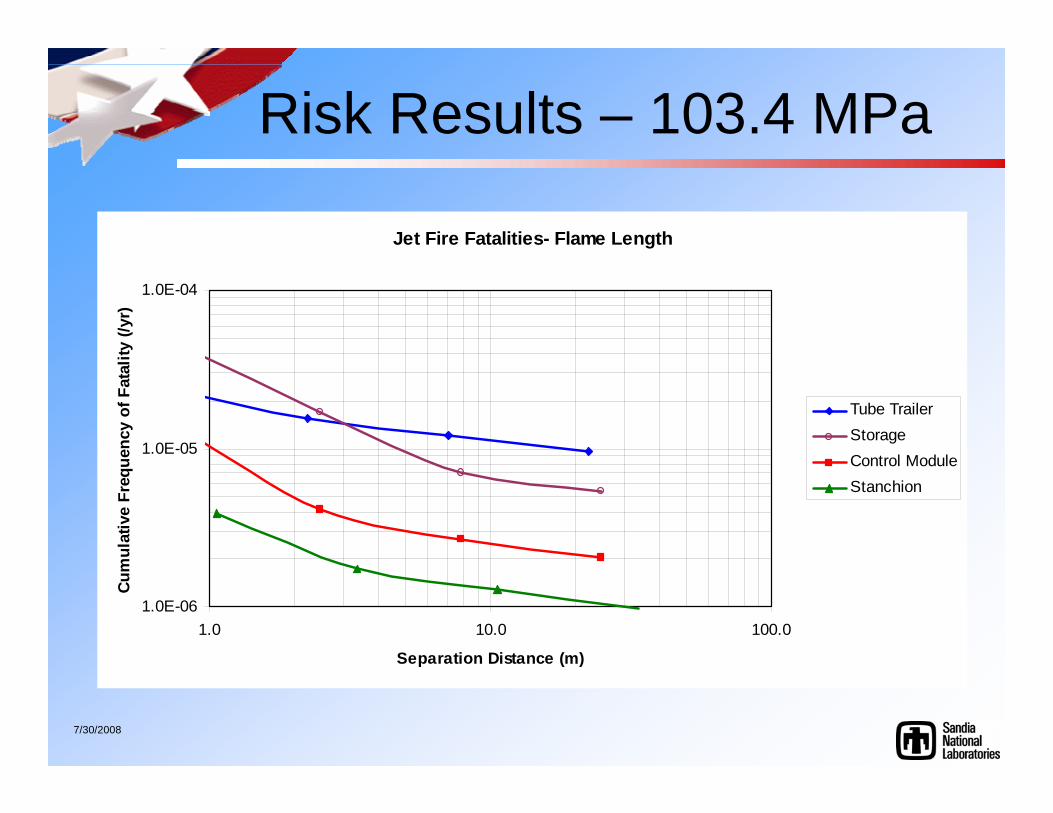
Risk Results – 103.4 MPa
Jet Fire Fatalities- Flame Length
1.0E-06
1.0E-05
1.0E-04
1.0 10.0 100.0
Separation Distance (m)
Cum
ulat
ive
Freq
uenc
y of
Fat
ality
(/yr
)
Tube TrailerStorageControl ModuleStanchion
7/30/2008
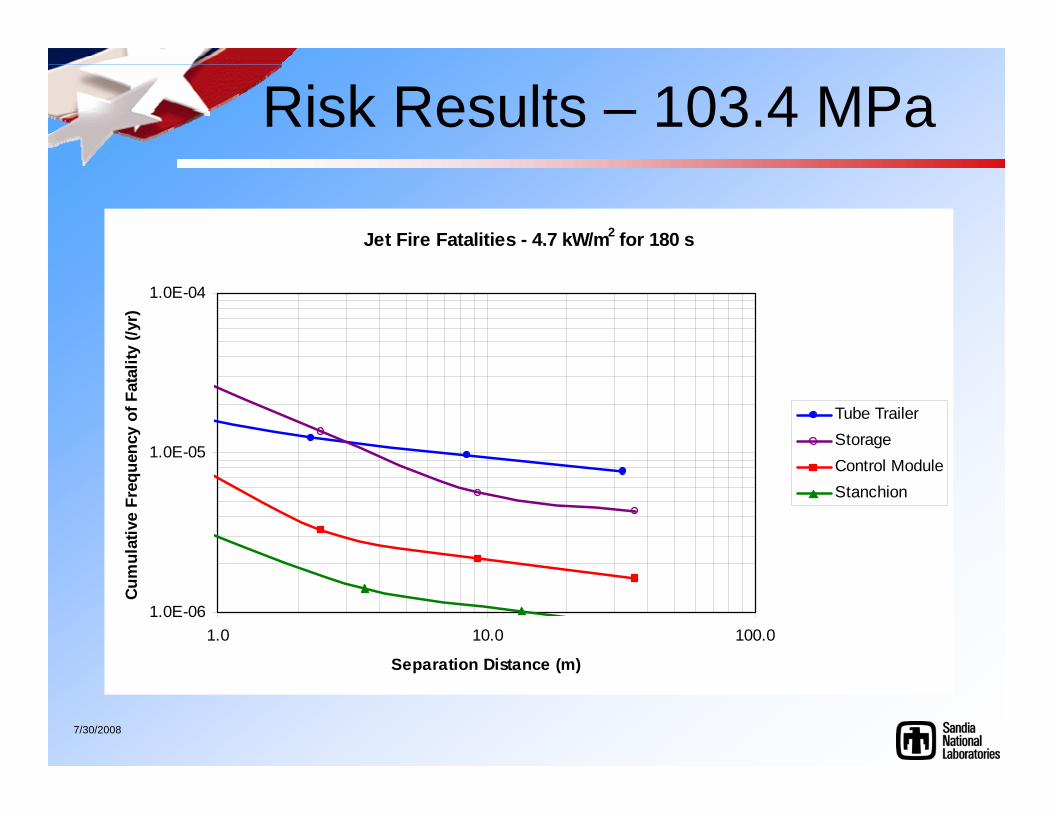
Risk Results – 103.4 MPa
Jet Fire Fatalities - 4.7 kW/m2 for 180 s
1.0E-06
1.0E-05
1.0E-04
1.0 10.0 100.0
Separation Distance (m)
Cum
ulat
ive
Freq
uenc
y of
Fat
ality
(/yr
)
Tube TrailerStorageControl ModuleStanchion
7/30/2008
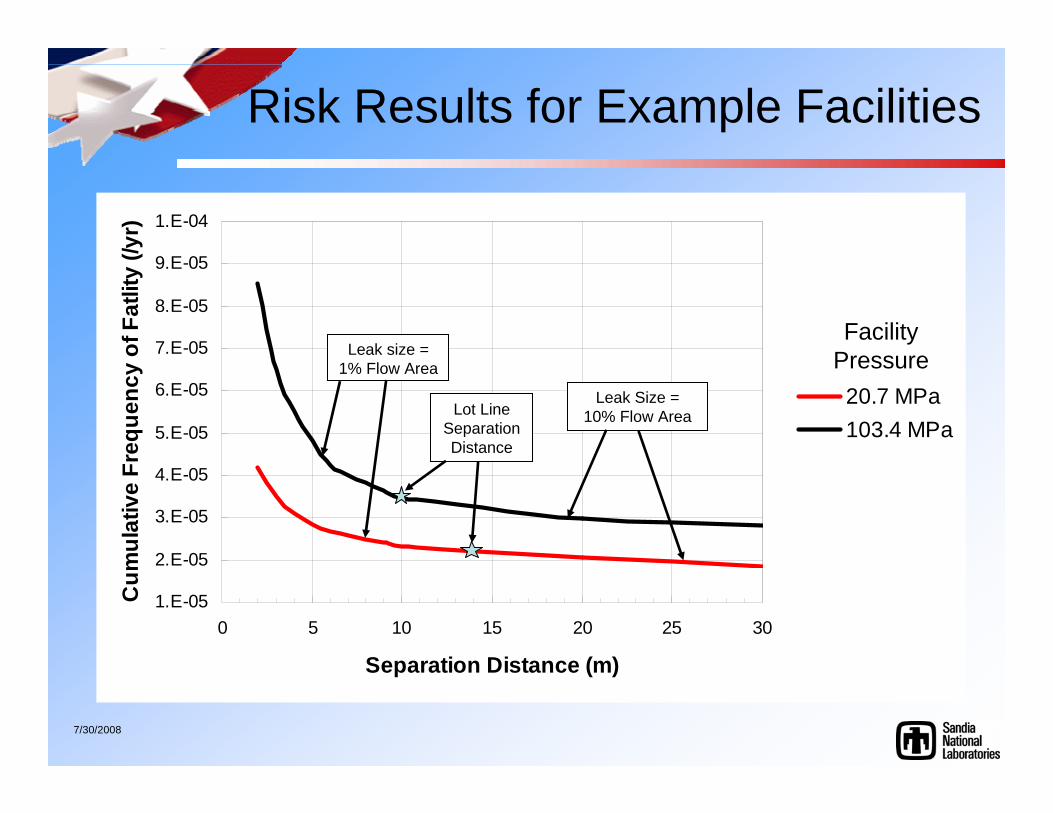
Risk Results for Example Facilities
1.E-05
2.E-05
3.E-05
4.E-05
5.E-05
6.E-05
7.E-05
8.E-05
9.E-05
1.E-04
0 5 10 15 20 25 30
Separation Distance (m)
Cum
ulat
ive
Freq
uenc
y of
Fat
lity
(/yr)
20.7 MPa103.4 MPa
Leak size = 1% Flow Area
Leak Size =10% Flow Area
Facility Pressure
Lot Line Separation Distance
7/30/2008
Summary
• Separation distances are significantly affected by facility operating parameters (H2 pressure and volume)
• Separation distances can be prohibitively long for large leak diameters
• If small leak diameters can be justified, short separation distances even for high pressures can be justified
• Data analysis was used to select leak diameter used to determine separation distances (>95% leaks included)
• Risk analysis was used to show that risk for larger leaks is acceptable
• Selection of 3% flow area as leak size can be justified based both on leak frequency and risk bases