
Quantitative phase analysis - Seoul National University
23
1 CHAN PARK, MSE, SNU Spring-2019 Crystal Structure Analyses Quantitative phase analysis Crystal Structure Analysis Materials Science & Engineering, Seoul National University CHAN PARK Jenkins & Snyder Chap 13 Cullity Chap 12 Bish & Post Chap 5 Klug & Alexander Chap 7 Krawitz Chap 8 2 CHAN PARK, MSE, SNU Spring-2019 Crystal Structure Analyses QPA - reference Madsen, I.C. and Scarlett, N.V.Y. (2008) Quantitative Phase Analysis In "Powder Diffraction: Theory and Practice." Dinnebier, R.E. and Billinge, S.J.L., Editors. The Royal Society of Chemistry: Cambridge, UK Madsen, I.C. and Scarlett, N.V.Y., Riley, D.P. and Raven, M.D. (2012) Quantitative Phase Analysis using the Rietveld Method In "Modern Diffraction Methods", Mittemeijer, E.J. and Welzel, U., Editors. Wiley-VCH Madsen, I.C., Scarlett, N.V.Y. and Kern, A. (2011) Description and survey of methodologies for the determination of amorphous content via X-ray powder diffraction. Z. Krist., 226, 944-955. Kern, A., Madsen, I.C. and Scarlett, N.V.Y. (2012) Quantifying amorphous phases. Uniting Electron Crystallography and Powder Diffraction. Editors: Kolb, U., Shankland, K., Meshi, L., Avilov, A. & David, W. Springer Madsen, I.C., Scarlett, N.V.Y. and Webster, N.A.S. (2012) Quantitative phase analysis. Uniting Electron Crystallography and Powder Diffraction. Editors: Kolb, U., Shankland, K., Meshi, L., Avilov, A. & David, W. Springer Presentation of Arnt Kern, DXC 2014 Workshop, “QUANTIFYING CRYSTALLINE AND AMORPHOUS PHASES”
Transcript of Quantitative phase analysis - Seoul National University

1 CHAN PARK, MSE, SNU Spring-2019 Crystal Structure Analyses
Quantitative phase analysis
Crystal Structure Analysis
Materials Science & Engineering, Seoul National University
CHAN PARK
Jenkins & Snyder Chap 13
Cullity Chap 12
Bish & Post Chap 5
Klug & Alexander Chap 7
Krawitz Chap 8
2 CHAN PARK, MSE, SNU Spring-2019 Crystal Structure Analyses
QPA - reference
Madsen, I.C. and Scarlett, N.V.Y. (2008) Quantitative Phase Analysis In "Powder Diffraction: Theory
and Practice." Dinnebier, R.E. and Billinge, S.J.L., Editors. The Royal Society of Chemistry:
Cambridge, UK
Madsen, I.C. and Scarlett, N.V.Y., Riley, D.P. and Raven, M.D. (2012) Quantitative Phase Analysis
using the Rietveld Method In "Modern Diffraction Methods", Mittemeijer, E.J. and Welzel, U.,
Editors. Wiley-VCH
Madsen, I.C., Scarlett, N.V.Y. and Kern, A. (2011) Description and survey of methodologies for the
determination of amorphous content via X-ray powder diffraction. Z. Krist., 226, 944-955.
Kern, A., Madsen, I.C. and Scarlett, N.V.Y. (2012) Quantifying amorphous phases. Uniting Electron
Crystallography and Powder Diffraction. Editors: Kolb, U., Shankland, K., Meshi, L., Avilov, A. &
David, W. Springer
Madsen, I.C., Scarlett, N.V.Y. and Webster, N.A.S. (2012) Quantitative phase analysis. Uniting
Electron Crystallography and Powder Diffraction. Editors: Kolb, U., Shankland, K., Meshi, L., Avilov,
A. & David, W. Springer
Presentation of Arnt Kern, DXC 2014 Workshop, “QUANTIFYING CRYSTALLINE AND AMORPHOUS PHASES”
3 CHAN PARK, MSE, SNU Spring-2019 Crystal Structure Analyses
QPA – reference (continued)
Rietveld Refinement Round Robin (http://www.iucr.org/iucr-top/comm/cpd/)
Hill, R.J. (1992): "Rietveld Refinement Round Robin. I. Analysis of Standard X-ray and Neutron Data for PbSO4".
J. Appl. Cryst., 25, 589-610
Hill, R.J. & Cranswick, L.M.D (1994): "Rietveld Refinement Round Robin. II. Analysis of Monoclinic ZrO2". J. Appl.
Cryst., 27, 802-844
QPA Round Robin (http://www.iucr.org/iucr-top/comm/cpd/)
Madsen, I.C. et al. (2001): "Outcomes of the International Union of Crystallography Commission on Powder
Diffraction Round Robin on Quantitative Phase Analysis: samples 1a to 1h". J. Appl. Cryst., 34, 409-426
Scarlett, N.V.Y. et al. (2002): "Outcomes of the International Union of Crystallography Commission on Powder
Diffraction Round Robin on Quantitative Phase Analysis: samples 2, 3, 4, synthetic bauxite, natural granodiorite
and pharmaceuticals". J. Appl. Cryst., 35, 383-400
Biannual "Reynold's Cup" series (http://www.clays.org/Reynolds.html) (Clay Minerals Society)
Quantitative Rietveld Phase Analysis of Pharmaceuticals"
Fawcett T.G., Needham, F., Faber, J.N. & Crowder, C.E. (2010): "International Centre for Diffraction Data Round
Robin on Quantitative Rietveld Phase Analysis of Pharmaceuticals". Powder Diffraction, 25 (1), 1-8
Presentation of Arnt Kern, DXC 2014 Workshop “QUANTIFYING CRYSTALLINE AND AMORPHOUS PHASES”
4 CHAN PARK, MSE, SNU Spring-2019 Crystal Structure Analyses
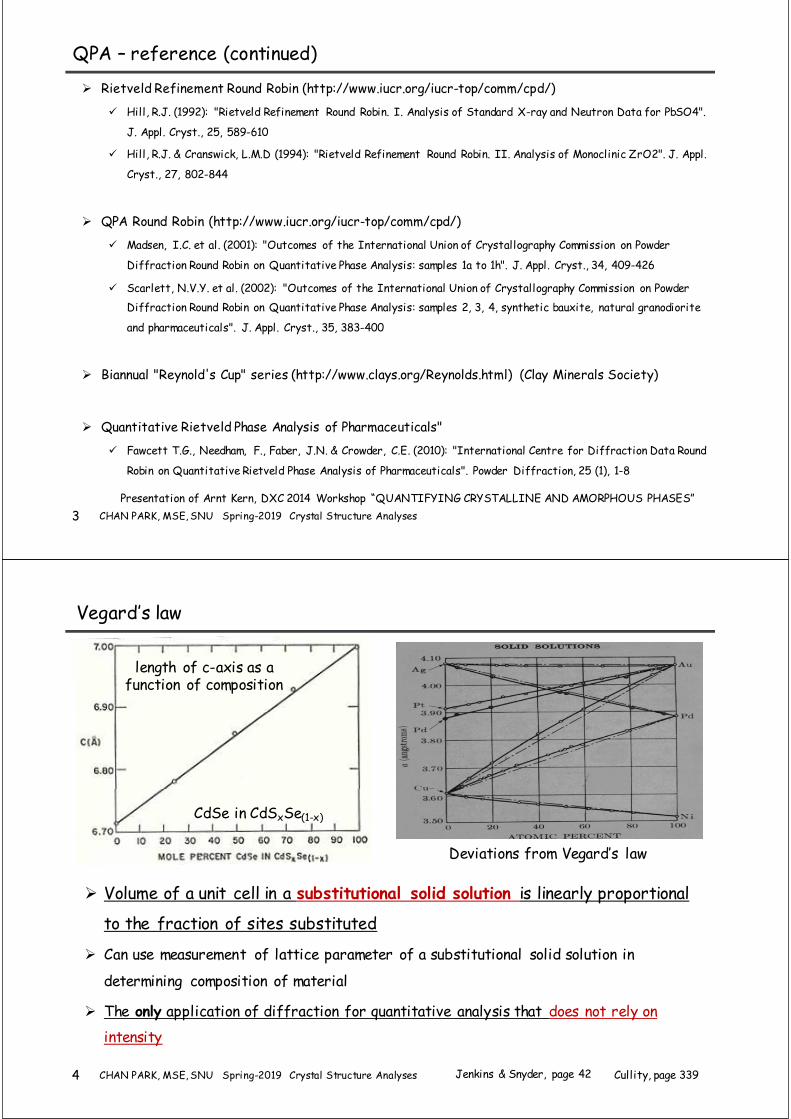
Vegard’s law
Volume of a unit cell in a substitutional solid solution is linearly proportional
to the fraction of sites substituted
Can use measurement of lattice parameter of a substitutional solid solution in
determining composition of material
The only application of diffraction for quantitative analysis that does not rely on
intensity
CdSe in CdSxSe(1-x)
length of c-axis as a function of composition
Jenkins & Snyder, page 42 Cullity, page 339
Deviations from Vegard’s law
5 CHAN PARK, MSE, SNU Spring-2019 Crystal Structure Analyses
Quantitative phase analyses using line intensities
First done by L. Navias (GE) in 1925 on sillimanite and mullite
Typical accuracy worse than 10%
Best RIR analysis ~3%
Best multi-line Copland-Bragg analysis ~1%
Routine Rietveld analysis ~1%
RIR ; reference intensity ratio
Jenkins & Snyder, Chap 13
6 CHAN PARK, MSE, SNU Spring-2019 Crystal Structure Analyses
Factors affecting line intensities in XRPD
factor parameter factor parameter
Structure-sensitive Atomic scattering factor Sample
sensitive
Microabsorption
Structure factor Crystallite size
Polarization Degree of crystallinity
Multiplicity Residual stress
Temperature Degree of peak overlap
Instrument-sensitive
(Absolute intensity)
Source intensity Preferred orientation
Diffractometer efficiency Measurem
ent-
sensitive
Method of peak area measurement
Voltage drift Degree of peak overlap
Takeoff angle of tube Method of background subtraction
Receiving slit width Ka2 stripping or not
Axial divergence allowed Degree of data smoothing used
Instrument-sensitive
(Relative intensity)
Divergence slit aperture
Detector dead time
Jenkins & Snyder
7 CHAN PARK, MSE, SNU Spring-2019 Crystal Structure Analyses
Sample sensitive parameters
Preferred orientation – most serious effect, present to some degree in
most specimen mounts
Absorption – same at all angles in Bragg-Brentano diffractometer
Microabsorption – can distort I’s of all the lines, can be minimized by
grinding powder to < 10um size
Crystallite statistics
Extinction
Degree of crystallinity
8 CHAN PARK, MSE, SNU Spring-2019 Crystal Structure Analyses
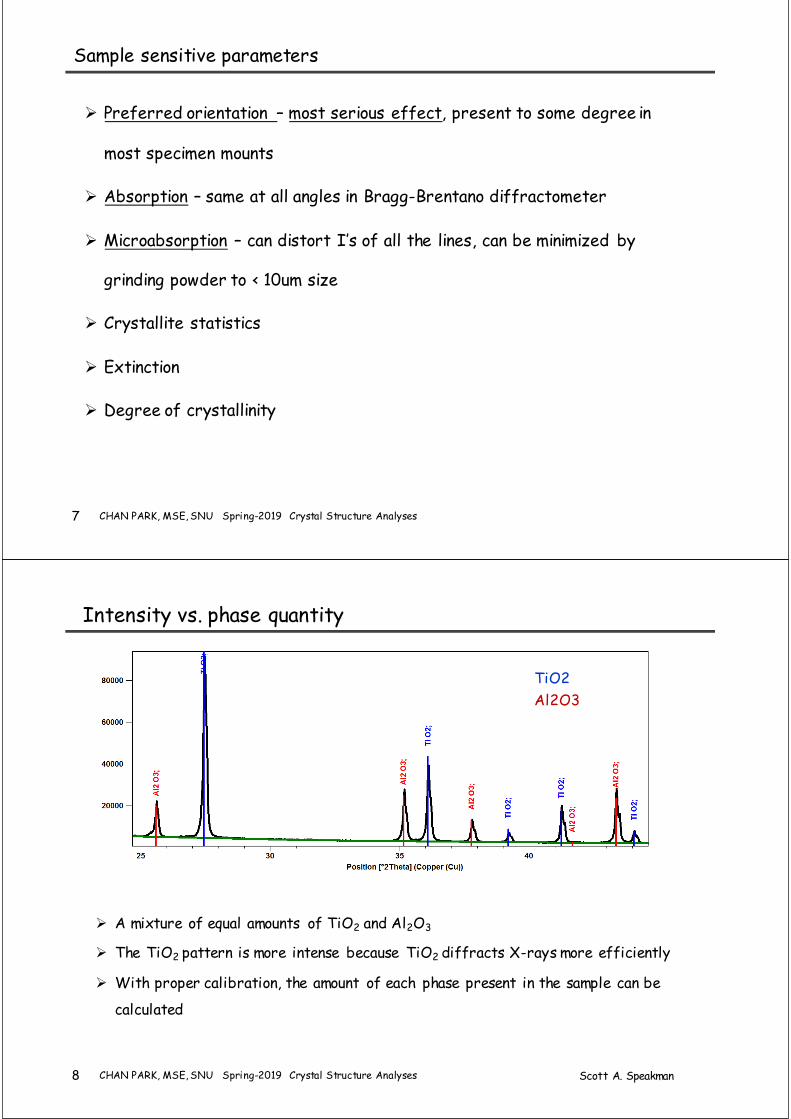
Intensity vs. phase quantity
A mixture of equal amounts of TiO2 and Al2O3
The TiO2 pattern is more intense because TiO2 diffracts X-rays more efficiently
With proper calibration, the amount of each phase present in the sample can be
calculated
TiO2
Al2O3
Scott A. Speakman
9 CHAN PARK, MSE, SNU Spring-2019 Crystal Structure Analyses
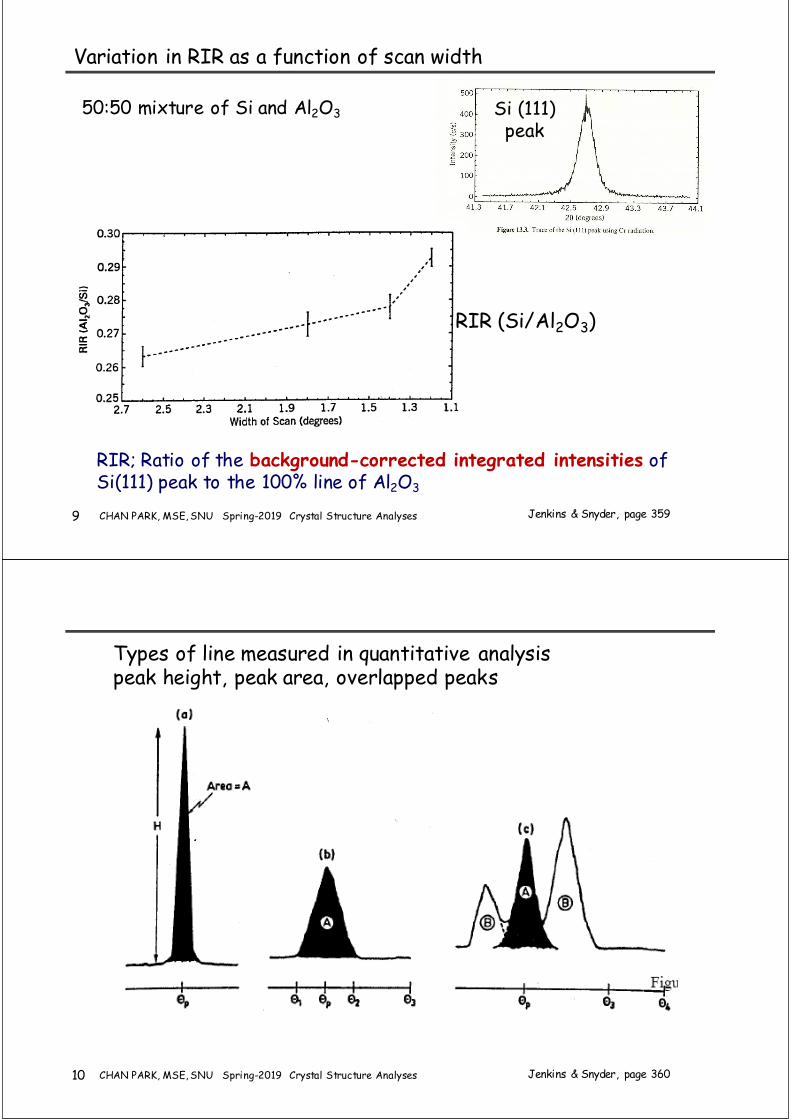
RIR; Ratio of the background-corrected integrated intensities of Si(111) peak to the 100% line of Al2O3
Variation in RIR as a function of scan width
Jenkins & Snyder, page 359
50:50 mixture of Si and Al2O3 Si (111)peak
RIR (Si/Al2O3)
10 CHAN PARK, MSE, SNU Spring-2019 Crystal Structure Analyses
Types of line measured in quantitative analysispeak height, peak area, overlapped peaks
Jenkins & Snyder, page 360
11 CHAN PARK, MSE, SNU Spring-2019 Crystal Structure Analyses
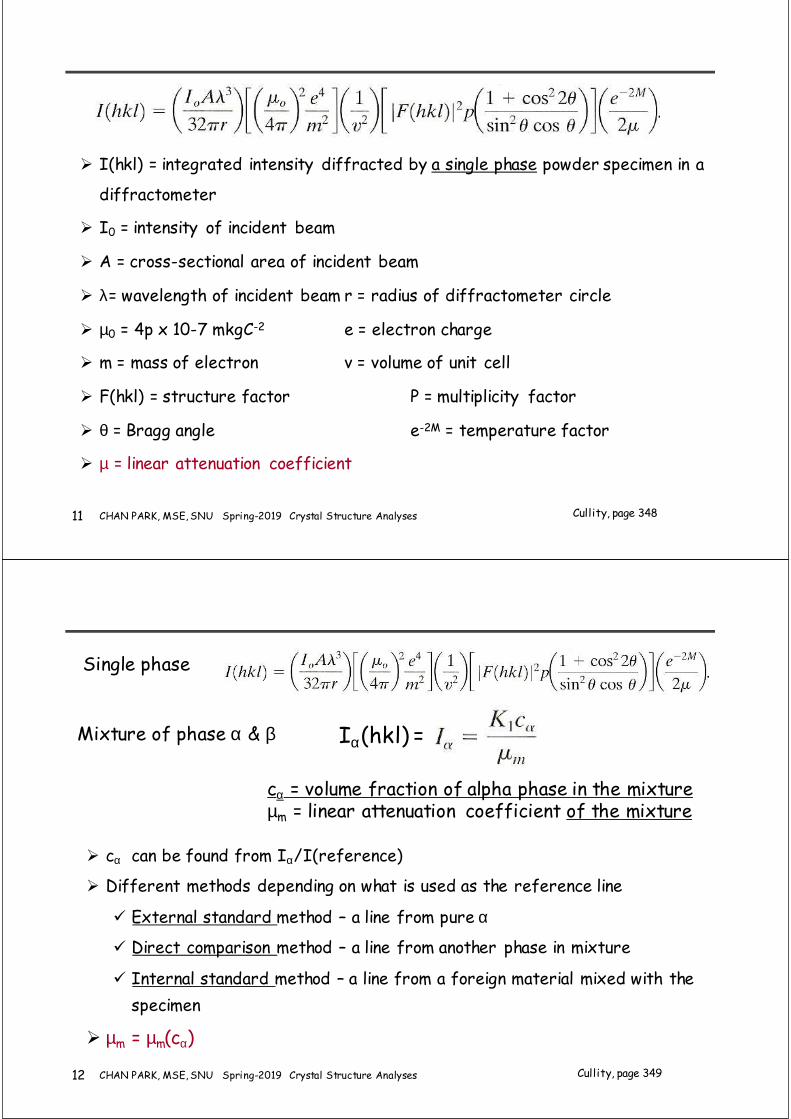
I(hkl) = integrated intensity diffracted by a single phase powder specimen in a
diffractometer
I0 = intensity of incident beam
A = cross-sectional area of incident beam
λ= wavelength of incident beam r = radius of diffractometer circle
µ0 = 4p x 10-7 mkgC-2 e = electron charge
m = mass of electron v = volume of unit cell
F(hkl) = structure factor P = multiplicity factor
θ = Bragg angle e-2M = temperature factor
µ = linear attenuation coefficient
Cullity, page 348
12 CHAN PARK, MSE, SNU Spring-2019 Crystal Structure Analyses
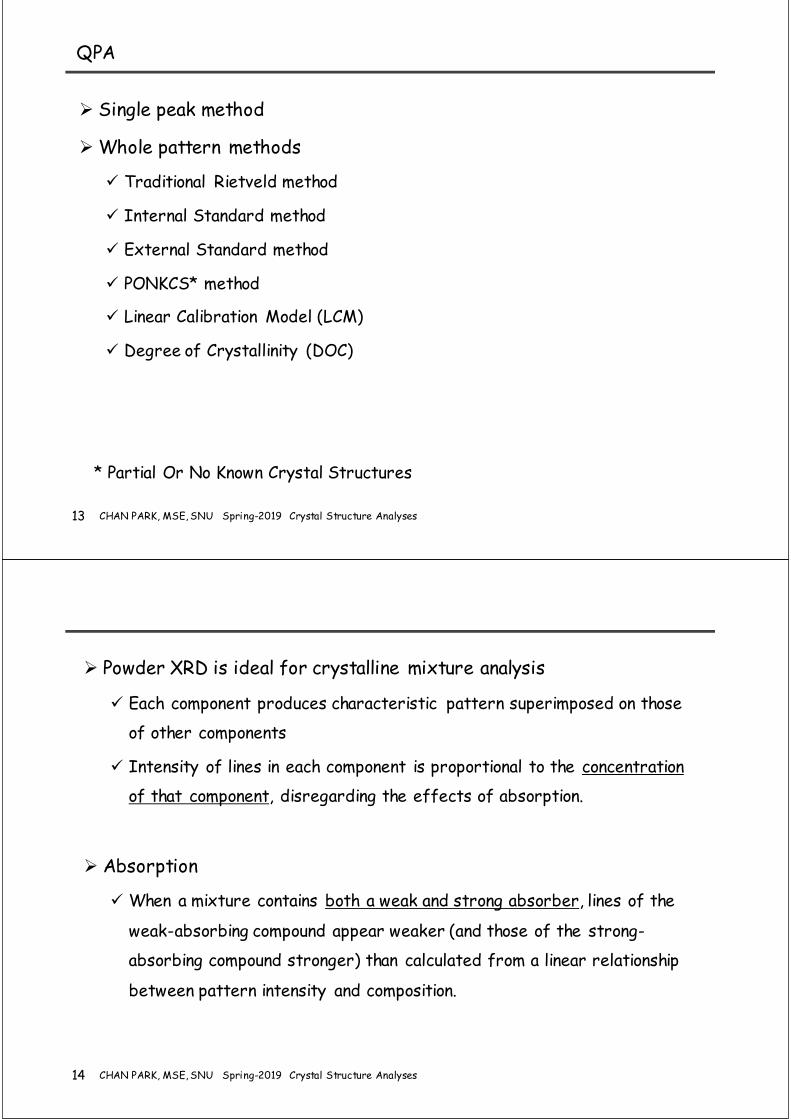
cα can be found from Iα/I(reference)
Different methods depending on what is used as the reference line
External standard method – a line from pure α
Direct comparison method – a line from another phase in mixture
Internal standard method – a line from a foreign material mixed with the
specimen
µm = µm(cα)
Iα(hkl) = Mixture of phase α & β
Single phase
cα = volume fraction of alpha phase in the mixtureµm = linear attenuation coefficient of the mixture
Cullity, page 349
13 CHAN PARK, MSE, SNU Spring-2019 Crystal Structure Analyses
QPA
Single peak method
Whole pattern methods
Traditional Rietveld method
Internal Standard method
External Standard method
PONKCS* method
Linear Calibration Model (LCM)
Degree of Crystallinity (DOC)
* Partial Or No Known Crystal Structures
14 CHAN PARK, MSE, SNU Spring-2019 Crystal Structure Analyses
Powder XRD is ideal for crystalline mixture analysis
Each component produces characteristic pattern superimposed on those
of other components
Intensity of lines in each component is proportional to the concentration
of that component, disregarding the effects of absorption.
Absorption
When a mixture contains both a weak and strong absorber, lines of the
weak-absorbing compound appear weaker (and those of the strong-
absorbing compound stronger) than calculated from a linear relationship
between pattern intensity and composition.
15 CHAN PARK, MSE, SNU Spring-2019 Crystal Structure Analyses
Nomenclature (Klug & Alexander)
i,j,k,… lines in diffraction pattern
I, J, K, … components of a mixture
S subscript referring to component used as reference standard
ρJ density of components J
fJ volume fraction of component J in a mixture
xJ weight fraction of component J in a mixture
µJ linear absorption coefficient of component J for X-ray wavelength l
µJ* = µJ/ρJ mass absorption coefficient of component J for X-ray wavelength l
µ linear absorption coefficient of sample with N components
µ* mass absorption coefficient of sample with N components µ* = xJ µJ*
IiJ intensity of ith line of component J in mixture
(IiJ)0 intensity of ith line of pure component J
I/Icor ratio of intensity of strongest peak of each component to a common
standard, synthetic corundum, in a 1;1 mixture of sample and standard
RIRJ,S reference intensity ratio of phase J with respect to phase S
16 CHAN PARK, MSE, SNU Spring-2019 Crystal Structure Analyses
Basic concepts
Integrated intensity proportional to analyte phase concentration
Intensity functionally dependent on absorbing power of mixture for X-rays
Dependence is generally non-linear and unknown
Absorption
IiJ = (KiJ fJ)/µ = (KiJ xJ)/(ρJ µ*)
Density is constant for given phase
IiJ = (KiJ xJ)/µ* = (KiJ xJ)/( xk µk*)
Can get xJ by
Measuring intensity IiJ
Determining µ* of sample
Determining calibration constant KiJ
µ = linear attenuation coefficient
ρ = density
µ/ρ = mass attenuation coefficient; materials constant, f(λ)
17 CHAN PARK, MSE, SNU Spring-2019 Crystal Structure Analyses
Multi-phase mixtures
Absorption-diffraction method (external standard method)
Compare the experimental line intensity from the mixture to a line from a pure phase
Known mass absorption coefficient for mixture
Internal standard method
Compare the experimental line intensity from the mixture to a line from foreign material mixed with the sample
Sample doped with reference
Direct comparison method
Compare the experimental line intensity from the mixture to a line from another phase in the mixture
Standard addition method (spiking method)
Sample spiked with analyte phase
Whole pattern profile matching/ Whole pattern fitting (Rietveld method)
Absolute technique
When intensity of the peak in the pure analyte (IiJ)0 is involved in the equations to solve for xJ
Depend on experimental conditions (instrument type, setting, etc) so it is difficult to compare results
from different labs
Relative technique (Ratio technique)
When ratios, not absolute intensities, are used (e.g. internal & external standard techniques)
Independent of experimental conditions
18 CHAN PARK, MSE, SNU Spring-2019 Crystal Structure Analyses
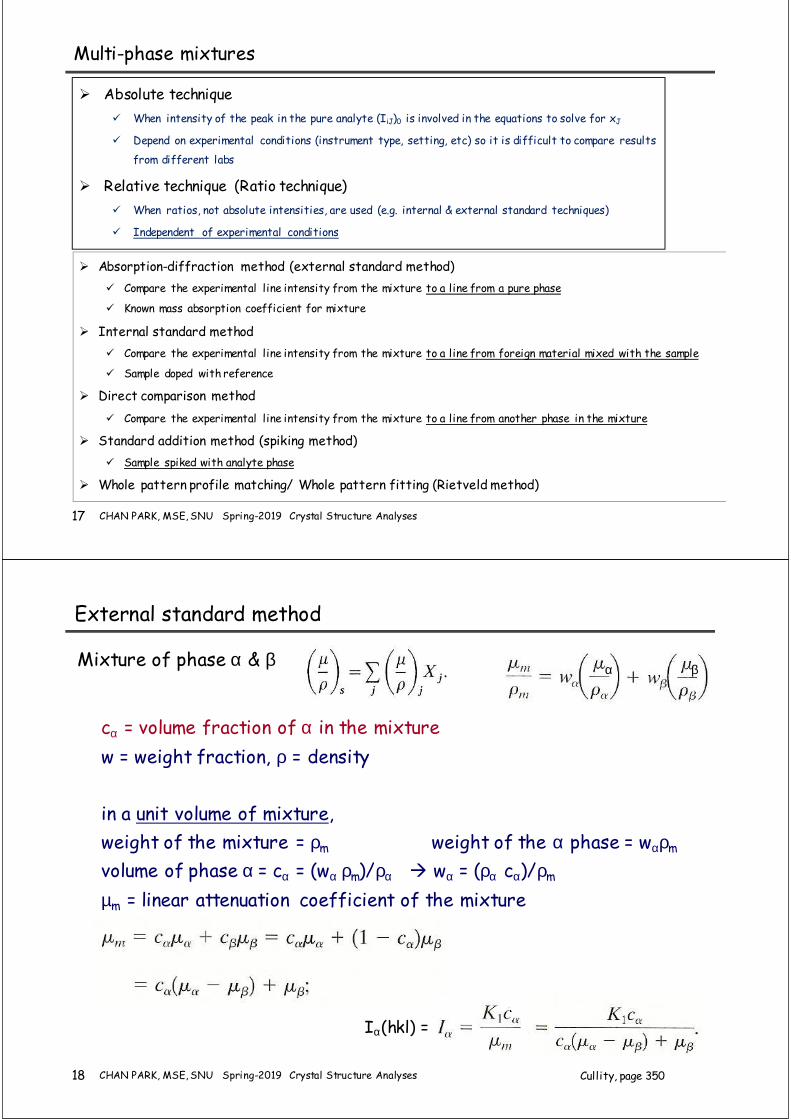
External standard method
α β
cα = volume fraction of α in the mixture
w = weight fraction, ρ = density
in a unit volume of mixture,
weight of the mixture = ρm weight of the α phase = wαρm
volume of phase α = cα = (wα ρm)/ρα wα = (ρα cα)/ρm
µm = linear attenuation coefficient of the mixture
Iα(hkl) =
Mixture of phase α & β
Cullity, page 350
19 CHAN PARK, MSE, SNU Spring-2019 Crystal Structure Analyses
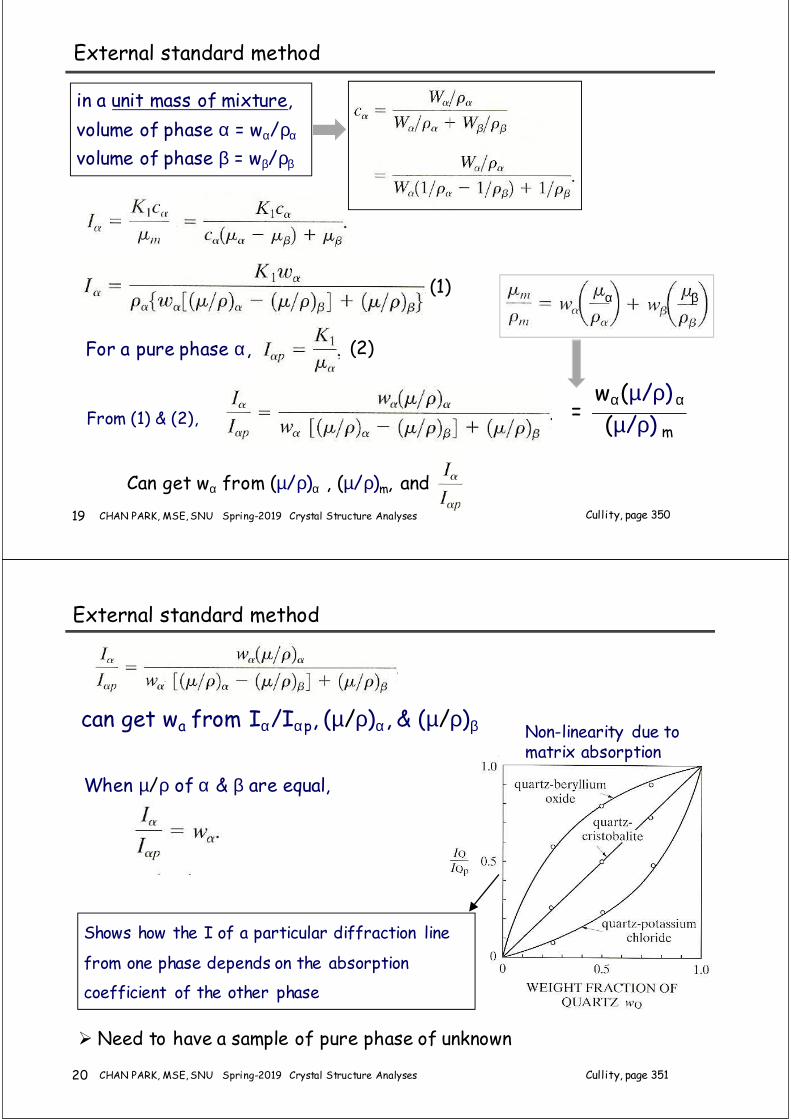
External standard method
in a unit mass of mixture,
volume of phase α = wα/ρα
volume of phase β = wβ/ρβ
For a pure phase α,
(1)
(2)
From (1) & (2), =wα(µ/ρ) α
(µ/ρ) m
Can get wα from (µ/ρ)α , (µ/ρ)m, and
Cullity, page 350
α β
20 CHAN PARK, MSE, SNU Spring-2019 Crystal Structure Analyses
External standard method
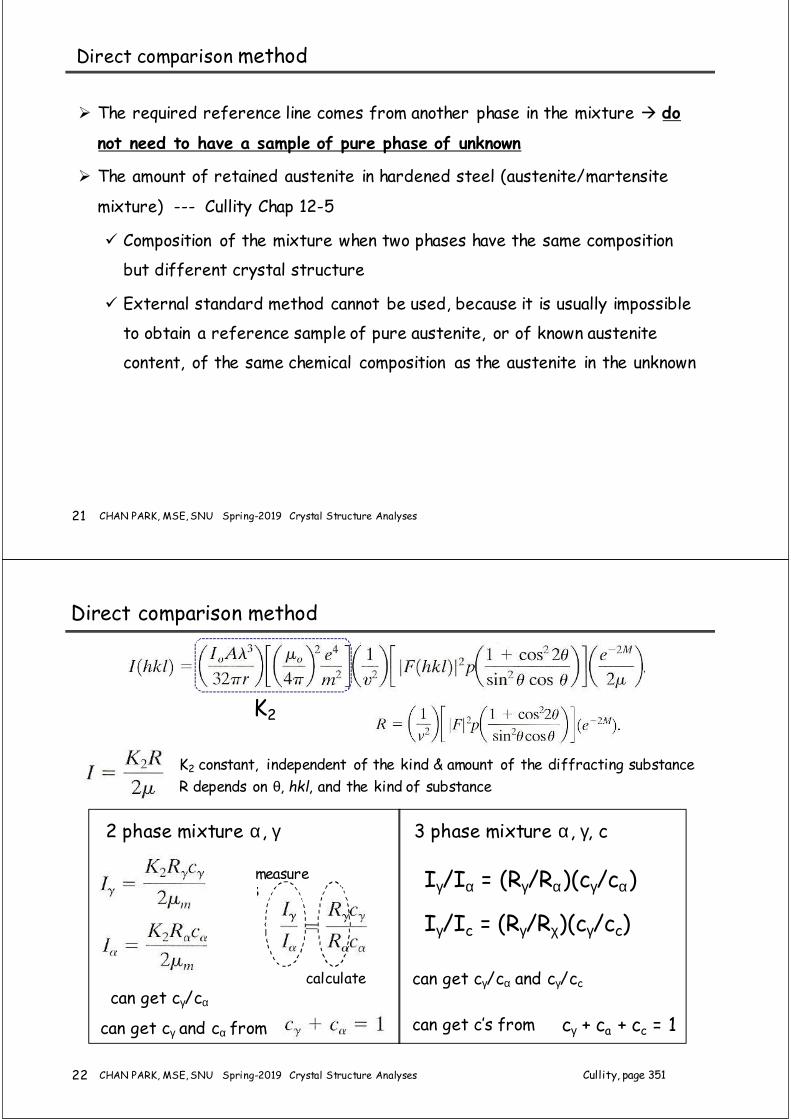
Need to have a sample of pure phase of unknown
When µ/ρ of α & β are equal,
can get wa from Iα/Iαp, (µ/ρ)α, & (µ/ρ)β
Cullity, page 351
Shows how the I of a particular diffraction line
from one phase depends on the absorption
coefficient of the other phase
Non-linearity due to matrix absorption
21 CHAN PARK, MSE, SNU Spring-2019 Crystal Structure Analyses
Direct comparison method
The required reference line comes from another phase in the mixture do
not need to have a sample of pure phase of unknown
The amount of retained austenite in hardened steel (austenite/martensite
mixture) --- Cullity Chap 12-5
Composition of the mixture when two phases have the same composition
but different crystal structure
External standard method cannot be used, because it is usually impossible
to obtain a reference sample of pure austenite, or of known austenite
content, of the same chemical composition as the austenite in the unknown
22 CHAN PARK, MSE, SNU Spring-2019 Crystal Structure Analyses
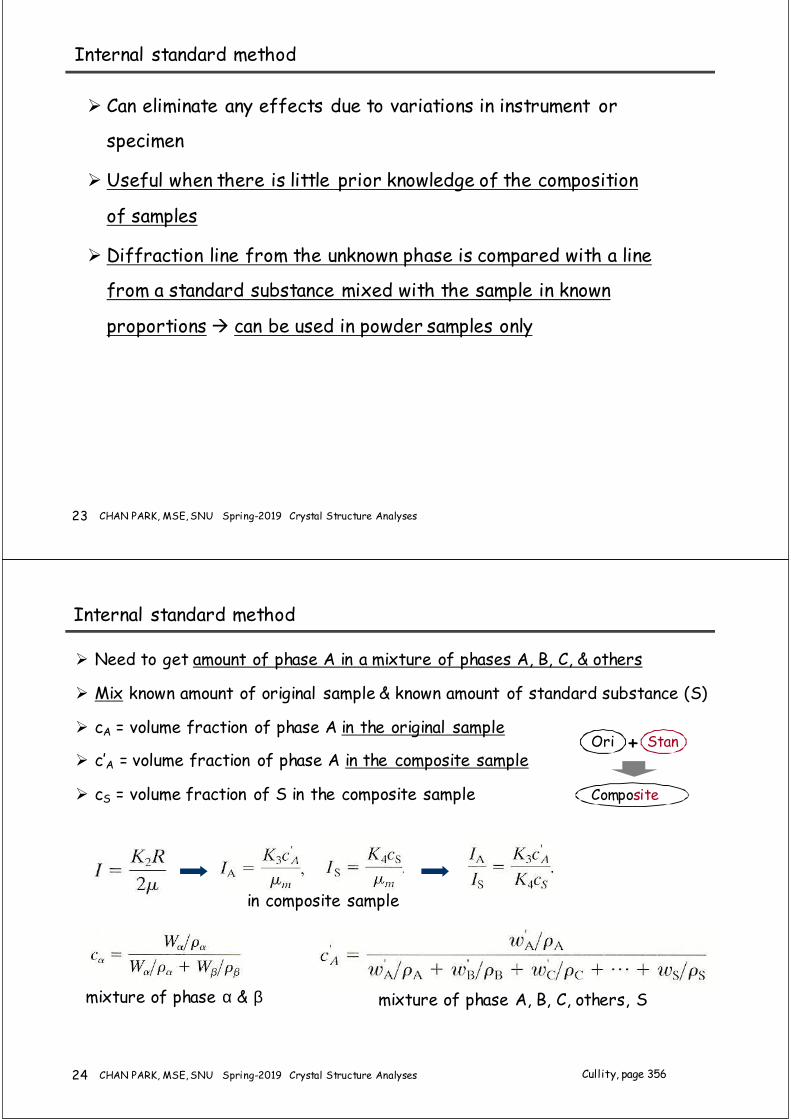
Direct comparison method
2 phase mixture α, γ
measure
calculate
3 phase mixture α, γ, c
Iγ/Iα = (Rγ/Rα)(cγ/cα)
Iγ/Ic = (Rγ/Rχ)(cγ/cc)
cγ + ca + cc = 1
Cullity, page 351
K2 constant, independent of the kind & amount of the diffracting substance
R depends on θ, hkl, and the kind of substance
can get cγ/cα
can get cγ and cα from
can get cγ/cα and cγ/cc
can get c’s from
K2
23 CHAN PARK, MSE, SNU Spring-2019 Crystal Structure Analyses
Internal standard method
Can eliminate any effects due to variations in instrument or
specimen
Useful when there is little prior knowledge of the composition
of samples
Diffraction line from the unknown phase is compared with a line
from a standard substance mixed with the sample in known
proportions can be used in powder samples only
24 CHAN PARK, MSE, SNU Spring-2019 Crystal Structure Analyses
Internal standard method
Need to get amount of phase A in a mixture of phases A, B, C, & others
Mix known amount of original sample & known amount of standard substance (S)
cA = volume fraction of phase A in the original sample
c’A = volume fraction of phase A in the composite sample
cS = volume fraction of S in the composite sample
in composite sample
mixture of phase α & β mixture of phase A, B, C, others, S
Cullity, page 356
Ori Stan
Composite
+
25 CHAN PARK, MSE, SNU Spring-2019 Crystal Structure Analyses
Internal standard method
Calibration curve (wA vs. (IA/IS)) wA can be obtained from (IA/IS)
for a composite with same wS which was used in the calibration curve
in composite sample
mixture of phase α & β
mixture of phase A, B, C, others, S
Cullity, page 356
ws is kept constant in all composite samples
26 CHAN PARK, MSE, SNU Spring-2019 Crystal Structure Analyses
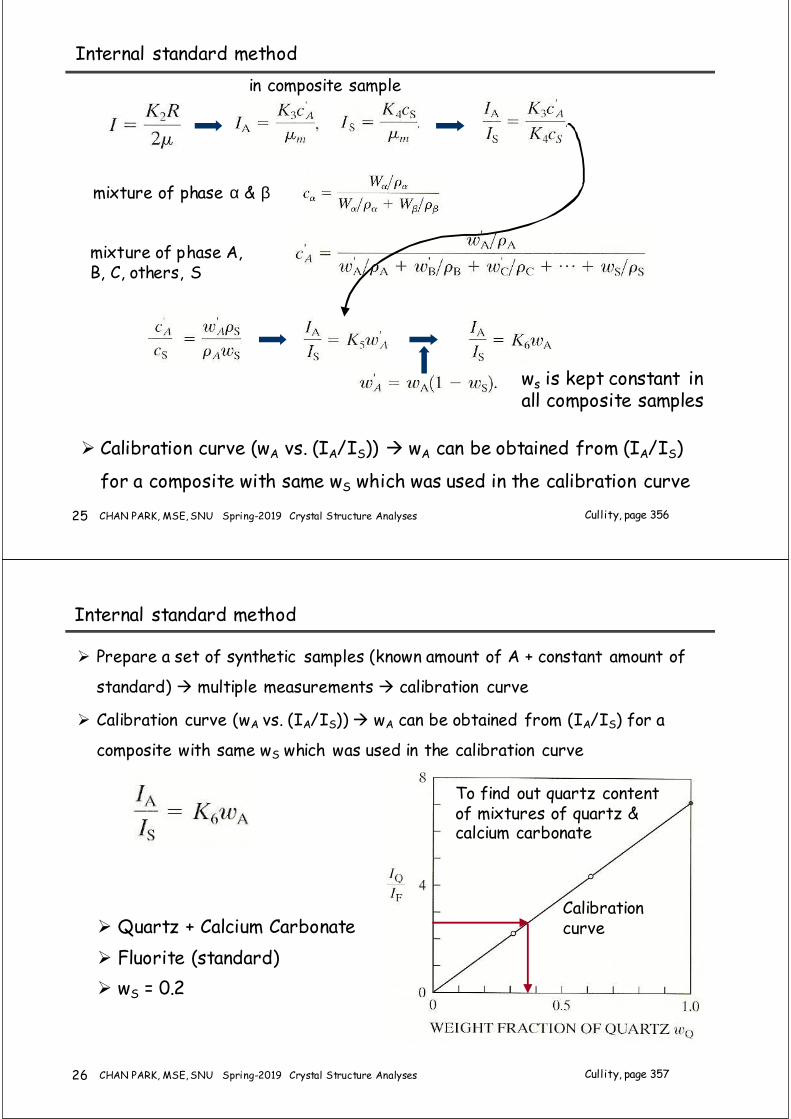
Internal standard method
Prepare a set of synthetic samples (known amount of A + constant amount of
standard) multiple measurements calibration curve
Calibration curve (wA vs. (IA/IS)) wA can be obtained from (IA/IS) for a
composite with same wS which was used in the calibration curve
Quartz + Calcium Carbonate
Fluorite (standard)
wS = 0.2
To find out quartz content of mixtures of quartz & calcium carbonate
Calibration curve
Cullity, page 357
27 CHAN PARK, MSE, SNU Spring-2019 Crystal Structure Analyses
Internal standard method
Relative class
Sample doped with known amount of reference material (internal standard)
x’J weight fraction of the unknown phase J in the doped sample
xJ weight fraction of phase J in the un-doped sample
xS weight fraction of internal standard
x’J = xJ (1 – xS)
IiJ = (KiJ xJ)/µ* ---- (Q1)
IiJ = KiJ xJ (1-xS) / µd* (for phase J)
µd* mass absorption coefficient of doped sample
IhS = KhS xS / µd* (for internal standard)
IiJ/IhS = [KiJ xJ (1-xS)] / [KhS xS]
Ratio of intensity is independent of absorption
xJ = [KhS xS] /[KiJ (1-xS)] • [IiJ/IhS] = constant • [IiJ/IhS]
Can be used to analyze any phase in a mixture without analyzing remaining phase.
www.ccp14.ac.uk/poster-talks/david-hay-quant-notes-axaa99/html/sld001.htm
28 CHAN PARK, MSE, SNU Spring-2019 Crystal Structure Analyses
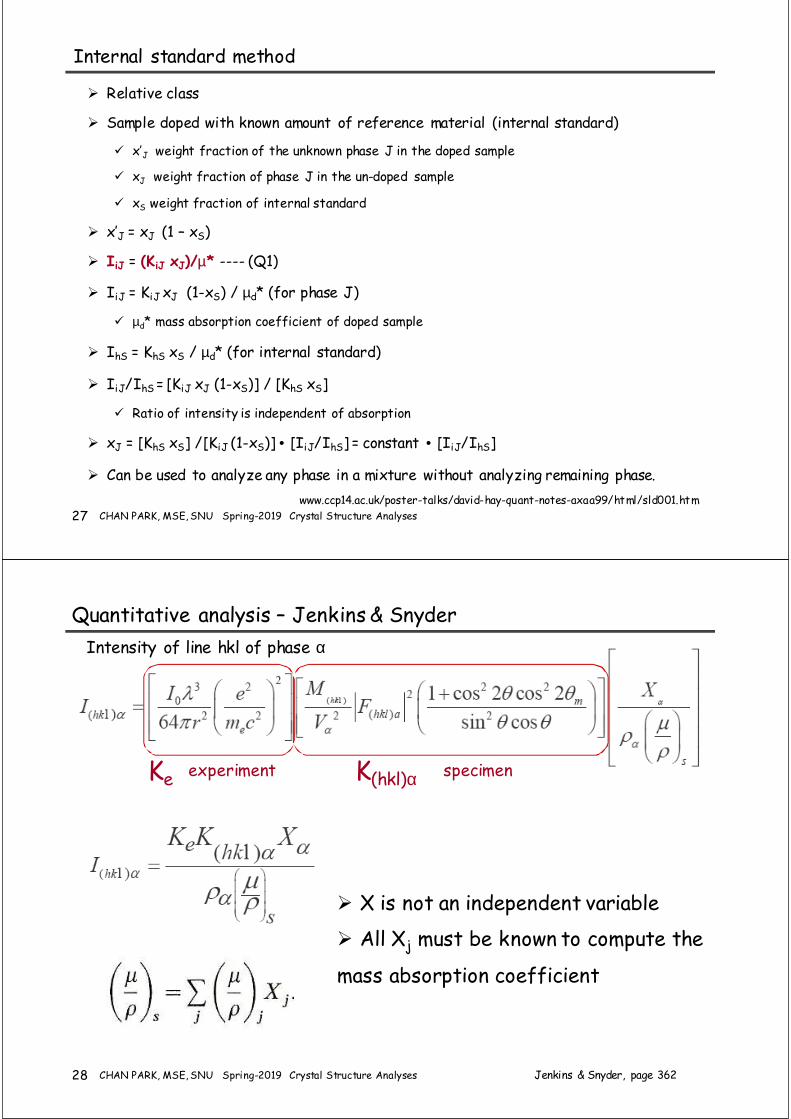
Quantitative analysis – Jenkins & Snyder
Intensity of line hkl of phase α
Ke K(hkl)αexperiment specimen
X is not an independent variable
All Xj must be known to compute the
mass absorption coefficient
Jenkins & Snyder, page 362

29 CHAN PARK, MSE, SNU Spring-2019 Crystal Structure Analyses
Internal standard method
The ratio of a line from phase α to a line
from phase β in any specimen causes the mass
absorption coefficient to cancel
Adding a phase of known concentration to the
specimen will permit the evaluation of k for a
known and then the evaluation of the wt.
fraction of alpha in any unknown
Jenkins & Snyder, page 369
30 CHAN PARK, MSE, SNU Spring-2019 Crystal Structure Analyses
Absorption-diffraction method (external standard method)
µ* (mass absorption coeff of sample with N components, µ* = xJ µJ*)
previously determined by
Calculation from known composition, summation of atomic absorption
coefficients
Direct absorption measurement
Measurement of Compton scattering
Case with constant µ* (include phase transitions where chemical composition
remains unchanged during the transition)
www.ccp14.ac.uk/poster-talks/david-hay-quant-notes-axaa99/html/sld001.htm
31 CHAN PARK, MSE, SNU Spring-2019 Crystal Structure Analyses
Absorption-diffraction method
Multiple phases, variable absorption coefficient
Requires measurement of (IiJ)0 for the pure phases in the mixture
IiJ = (KiJ xJ)/µ* pure phase (xJ = 1) (IiJ)0 = KiJ/µJ*
xJ = (IiJ)/(IiJ)0 • (µ* /µJ*)
xJ can be obtained from (IiJ), (IiJ)0, µ*, and µJ*
log xJ – log[IiJ/(IiJ)0] = log [µ*/µJ*] should be a straight line, but deviates (due to
microabsorption)
xJ = (IiJ)/(IiJ)0 • (µ* /µJ*)α
a is not constant, depends on grain size of analyte and the nature of the matrix of
other phases
Microabsorption effect can be severe when absorption properties and crystallite size
distribution of the pure phase J and the multi-phase mixture are widely different
32 CHAN PARK, MSE, SNU Spring-2019 Crystal Structure Analyses
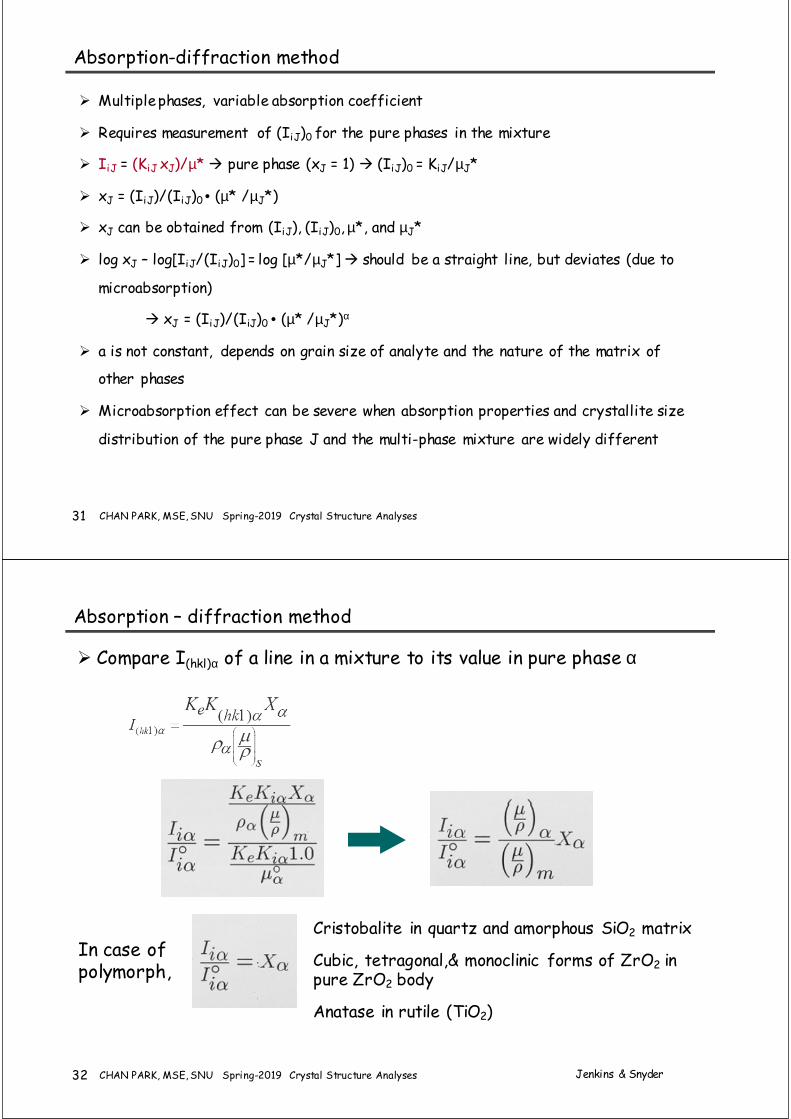
Absorption – diffraction method
Compare I(hkl)α of a line in a mixture to its value in pure phase α
In case ofpolymorph,
Jenkins & Snyder
Cristobalite in quartz and amorphous SiO2 matrix
Cubic, tetragonal,& monoclinic forms of ZrO2 in pure ZrO2 body
Anatase in rutile (TiO2)
33 CHAN PARK, MSE, SNU Spring-2019 Crystal Structure Analyses
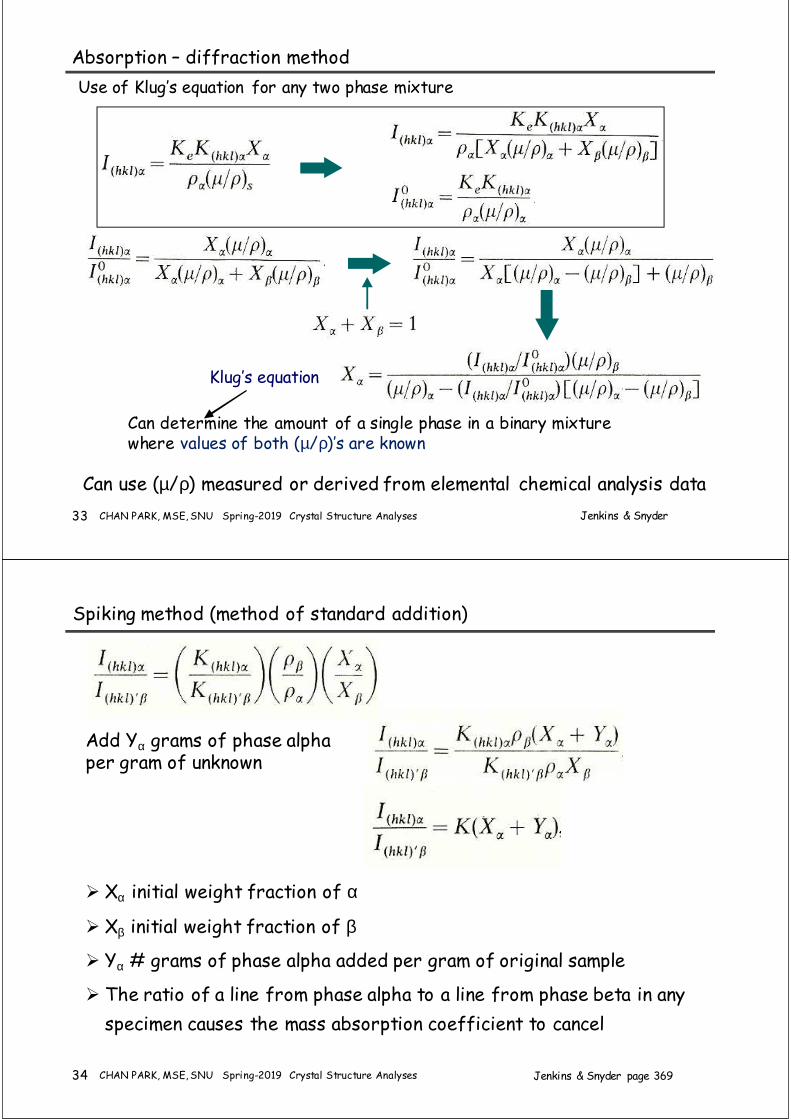
Absorption – diffraction method
Can use (µ/ρ) measured or derived from elemental chemical analysis data
Jenkins & Snyder
Klug’s equation
Can determine the amount of a single phase in a binary mixture where values of both (µ/ρ)’s are known
Use of Klug’s equation for any two phase mixture
34 CHAN PARK, MSE, SNU Spring-2019 Crystal Structure Analyses
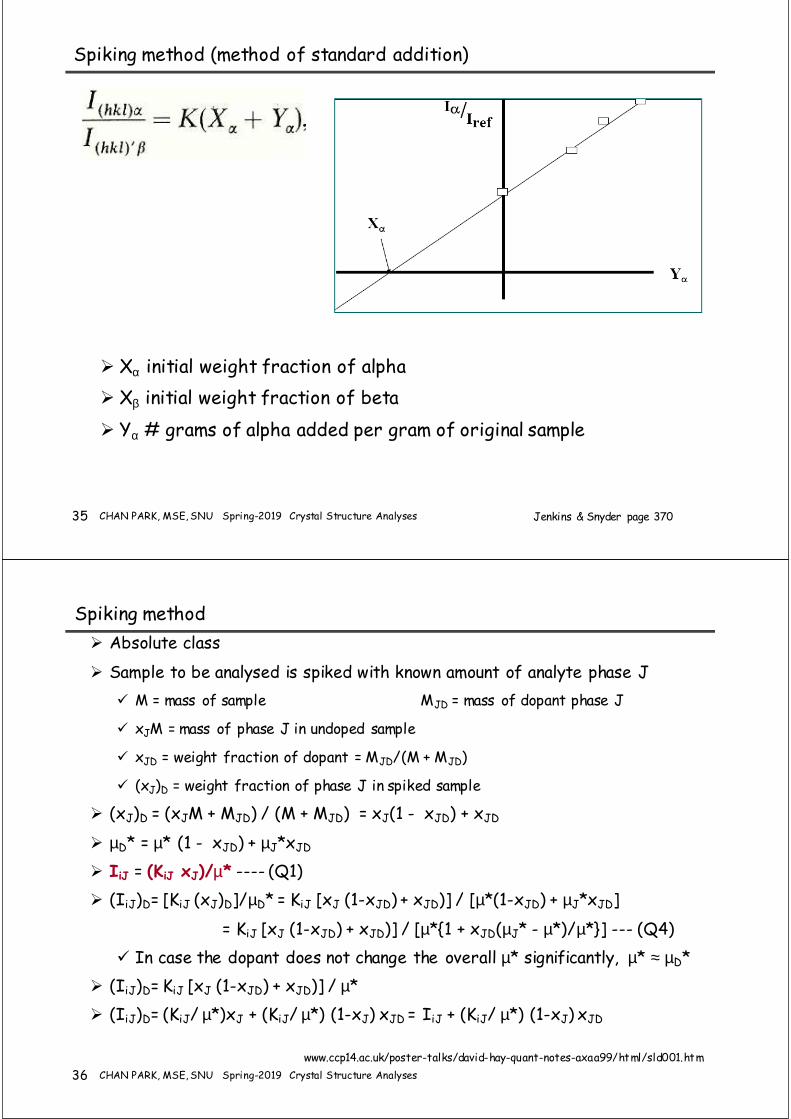
Spiking method (method of standard addition)
Xα initial weight fraction of α
Xβ initial weight fraction of β
Yα # grams of phase alpha added per gram of original sample
The ratio of a line from phase alpha to a line from phase beta in any
specimen causes the mass absorption coefficient to cancel
Add Yα grams of phase alpha per gram of unknown
Jenkins & Snyder page 369
35 CHAN PARK, MSE, SNU Spring-2019 Crystal Structure Analyses
Spiking method (method of standard addition)
Xα initial weight fraction of alpha
Xβ initial weight fraction of beta
Yα # grams of alpha added per gram of original sample
Jenkins & Snyder page 370
36 CHAN PARK, MSE, SNU Spring-2019 Crystal Structure Analyses
Spiking method
Absolute class
Sample to be analysed is spiked with known amount of analyte phase J
M = mass of sample MJD = mass of dopant phase J
xJM = mass of phase J in undoped sample
xJD = weight fraction of dopant = MJD/(M + MJD)
(xJ)D = weight fraction of phase J in spiked sample
(xJ)D = (xJM + MJD) / (M + MJD) = xJ(1 - xJD) + xJD
µD* = µ* (1 - xJD) + µJ*xJD
IiJ = (KiJ xJ)/µ* ---- (Q1)
(IiJ)D= [KiJ (xJ)D]/µD* = KiJ [xJ (1-xJD) + xJD)] / [µ*(1-xJD) + µJ*xJD]
= KiJ [xJ (1-xJD) + xJD)] / [µ*{1 + xJD(µJ* - µ*)/µ*}] --- (Q4)
In case the dopant does not change the overall µ* significantly, µ* ≈ µD*
(IiJ)D= KiJ [xJ (1-xJD) + xJD)] / µ*
(IiJ)D= (KiJ/ µ*)xJ + (KiJ/ µ*) (1-xJ) xJD = IiJ + (KiJ/ µ*) (1-xJ) xJD
www.ccp14.ac.uk/poster-talks/david-hay-quant-notes-axaa99/html/sld001.htm
37 CHAN PARK, MSE, SNU Spring-2019 Crystal Structure Analyses
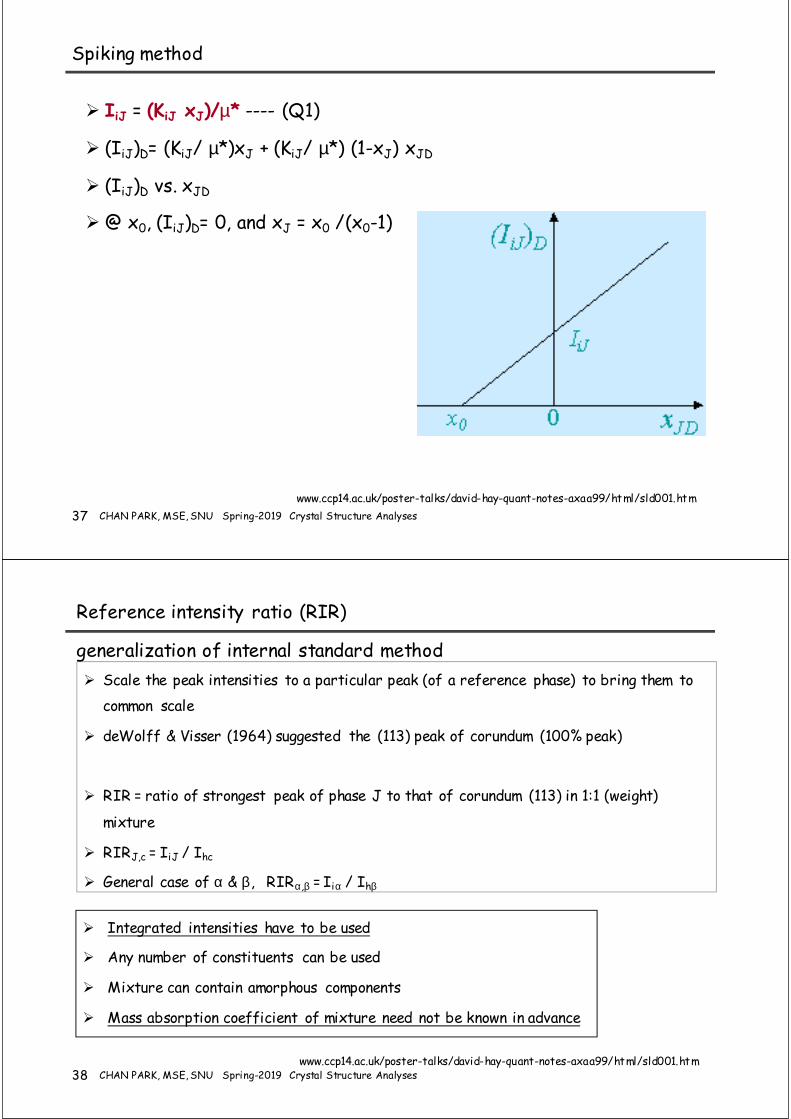
Spiking method
IiJ = (KiJ xJ)/µ* ---- (Q1)
(IiJ)D= (KiJ/ µ*)xJ + (KiJ/ µ*) (1-xJ) xJD
(IiJ)D vs. xJD
@ x0, (IiJ)D= 0, and xJ = x0 /(x0-1)
www.ccp14.ac.uk/poster-talks/david-hay-quant-notes-axaa99/html/sld001.htm
38 CHAN PARK, MSE, SNU Spring-2019 Crystal Structure Analyses
Reference intensity ratio (RIR)
Scale the peak intensities to a particular peak (of a reference phase) to bring them to
common scale
deWolff & Visser (1964) suggested the (113) peak of corundum (100% peak)
RIR = ratio of strongest peak of phase J to that of corundum (113) in 1:1 (weight)
mixture
RIRJ,c = IiJ / Ihc
General case of α & β, RIRα,β = Iiα / Ihβ
www.ccp14.ac.uk/poster-talks/david-hay-quant-notes-axaa99/html/sld001.htm
generalization of internal standard method
Integrated intensities have to be used
Any number of constituents can be used
Mixture can contain amorphous components
Mass absorption coefficient of mixture need not be known in advance

39 CHAN PARK, MSE, SNU Spring-2019 Crystal Structure Analyses
I/Icorundum (I/Icor)
The slope of the internal standard curve is a materials constant
Scale the peak intensities to a particular peak (of a reference phase) to
bring them to common scale
deWolff & Visser (1966) suggested that all materials be mixed 50:50 with
corundum and the ratio of the 100% lines be published with reference
patterns.
ICDD has a great number in the current PDF
Jenkins & Snyder
40 CHAN PARK, MSE, SNU Spring-2019 Crystal Structure Analyses
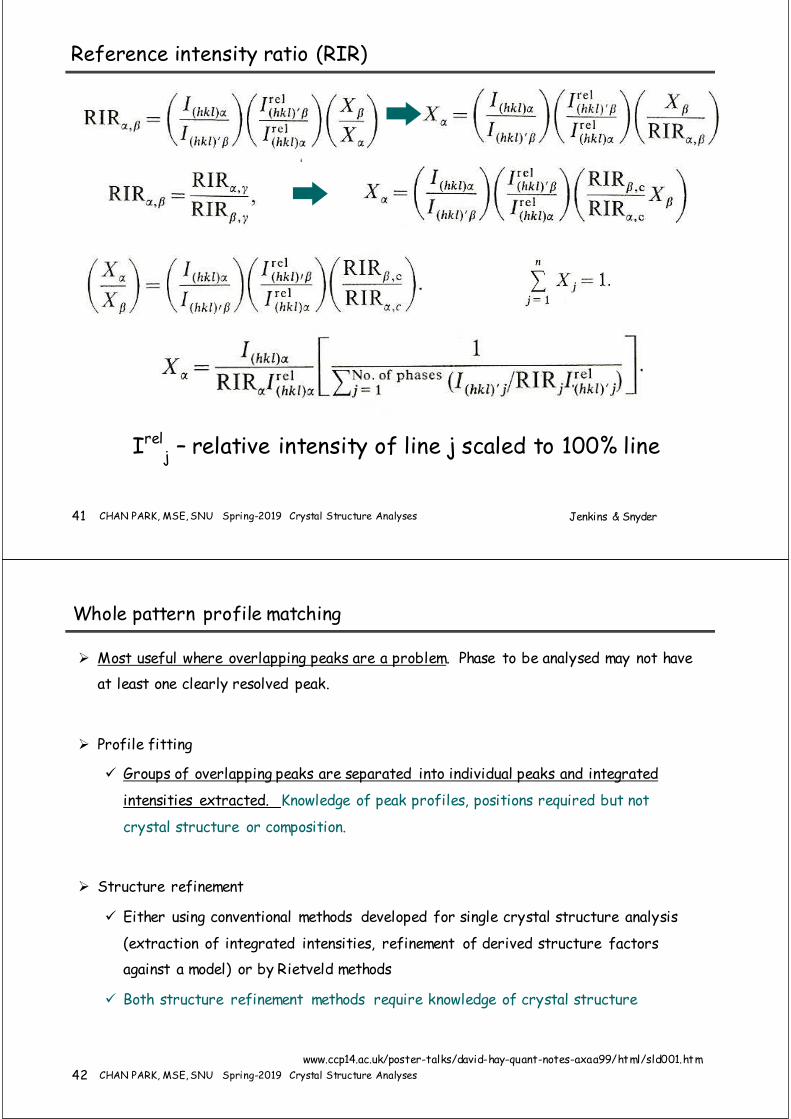
Reference intensity ratio (RIR)
Jenkins & Snyder page 372
Irelj– relative intensity of line j scaled to 100% line
vs. straight line (slope = k)k; measure of inherent diffracted
intensities of the two phases
β = corundum, 1;1 mixture, hkl’s = 100% intensity lines = I/Icor
β = any phasearbitrary concentration
hkl’s = any lines
41 CHAN PARK, MSE, SNU Spring-2019 Crystal Structure Analyses
Reference intensity ratio (RIR)
Jenkins & Snyder
Irelj– relative intensity of line j scaled to 100% line
42 CHAN PARK, MSE, SNU Spring-2019 Crystal Structure Analyses
Whole pattern profile matching
Most useful where overlapping peaks are a problem. Phase to be analysed may not have
at least one clearly resolved peak.
Profile fitting
Groups of overlapping peaks are separated into individual peaks and integrated
intensities extracted. Knowledge of peak profiles, positions required but not
crystal structure or composition.
Structure refinement
Either using conventional methods developed for single crystal structure analysis
(extraction of integrated intensities, refinement of derived structure factors
against a model) or by Rietveld methods
Both structure refinement methods require knowledge of crystal structure
www.ccp14.ac.uk/poster-talks/david-hay-quant-notes-axaa99/html/sld001.htm
43 CHAN PARK, MSE, SNU Spring-2019 Crystal Structure Analyses
Use of total pattern; Rietveld quant
Rietveld scale factor contains the weight fraction of each phase
The quantity minimized
Rietveld scale factor
Preferred orientation function
backgroundProfile shape function
Jenkins & Snyder
44 CHAN PARK, MSE, SNU Spring-2019 Crystal Structure Analyses
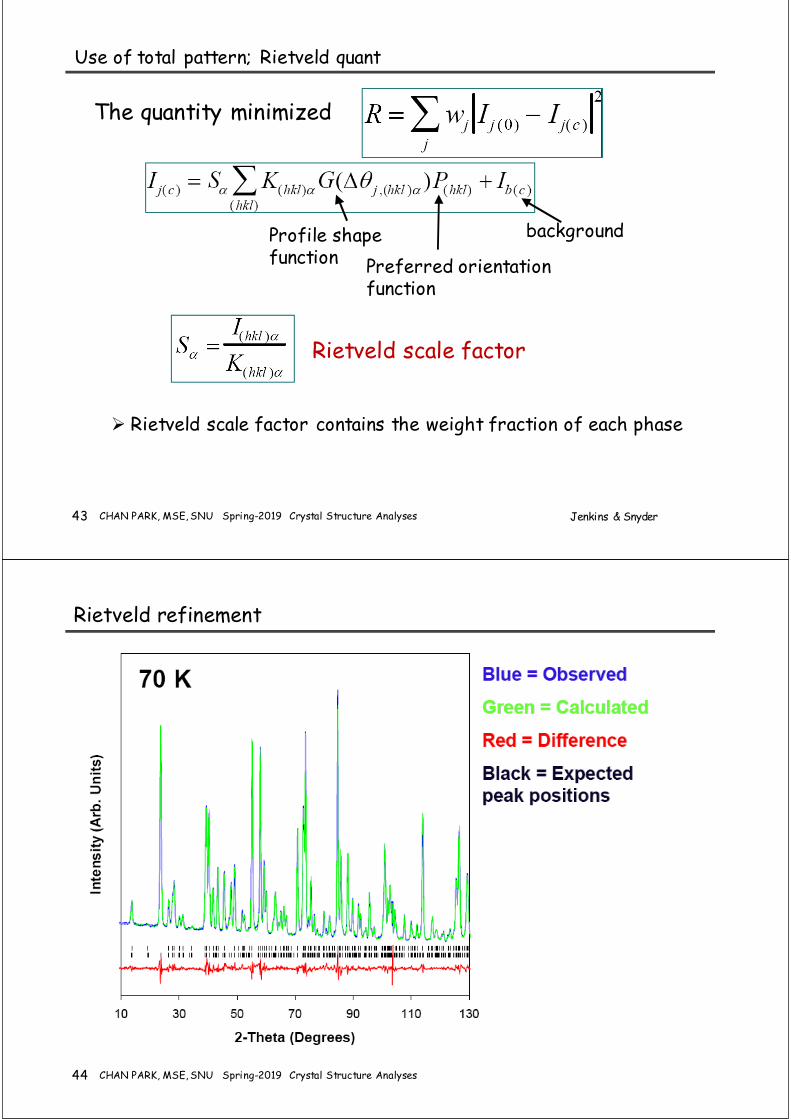
Rietveld refinement

45 CHAN PARK, MSE, SNU Spring-2019 Crystal Structure Analyses
Example > Alka-Seltzer 1 > phase ID
46 CHAN PARK, MSE, SNU Spring-2019 Crystal Structure Analyses
Example > Alka-Seltzer 2 > Quant using Rietveld refinement
on the package refined
CompoundAmoun
t (mg)
Concentrati
on (wt%)
Concentra
tion (wt%)
NaHCO3
Sodium bicarbonate1916 59.12 61.4(3)
C9H8O4
Acetylsalicylic acid325 10.03 10.1(2)
C6H8O7
Citric acid1000 30.86 28.5(3)


![t Quantitative Phase Technology QP - HREM Research · Quantitative Phase Technology! QP t ... (FFT) [1], and provides a solution to phase contrast electron microscopy. ! ... QPt5.ppt](https://static.fdocuments.net/doc/165x107/5add786b7f8b9a595f8ce382/t-quantitative-phase-technology-qp-hrem-research-phase-technology-qp-t-fft.jpg)


