Quantitative measurements of liquid holdup and drainage in foam using NMRI
7
Quantitative Measurements of Liquid Holdup and Drainage in Foam Using NMRI Paul Stevenson Centre for Multiphase Processes, University of Newcastle, Callaghan, NSW 2308, Australia Michael D. Mantle, Andrew J. Sederman, and Lynn F. Gladden Dept. of Chemical Engineering, University of Cambridge, Cambridge, CB2 3RA, United Kingdom DOI 10.1002/aic.11068 Published online December 19, 2006 in Wiley InterScience (www.interscience.wiley.com). Liquid fraction profiles of a column of draining aqueous foam stabilized with sodium dodecyl sulfate were studied by nuclear magnetic resonance imaging (NMRI) at high spatial and temporal resolution. It was observed that the liquid holdup in the column is not locally homogeneous in the direction of the column axis with liquid holdup exhibiting periodic variation in time. This creates ‘‘ripples’’ in the liquid content pro- files (that is, an approximately sinusoidal variation of liquid fraction in space). These ripples are seen to actually rise in the column as liquid drains down through the foam. This behavior may be explained by a simple mass balance: the rising velocity of the ripples multiplied by the gas fraction in the foam is equivalent to the liquid superficial drainage rate. Thus, NMRI is proposed as a powerful tool for studying drainage of foams because it provides a noninvasive method of measuring superficial drainage rate in foams that yields time-resolved instantaneous drainage rates as a function of posi- tion in the column. The measured liquid drainage rates were compared with a dimen- sionless expression for the liquid drainage rate and excellent agreement was achieved. Ó 2006 American Institute of Chemical Engineers AIChE J, 53: 290–296, 2007 Keywords: magnetic resonance imaging, foam, multiphase flow, fluid mechanics Introduction There are a number of techniques that can be used to mea- sure the evolution of the volumetric liquid fraction (e) within foam as drainage occurs. The measurement of capacitance or conductance of the foam is a common technique and its main advantage is that it is noninvasive. 1 However, it is diffi- cult to achieve good spatial resolution and the inference of drainage rates from profiles of liquid volume fraction can be problematical. Nuclear magnetic resonance imaging (NMRI) methods can obtain the liquid holdup profile in a column of foam with excellent temporal and spatial resolution. Some of the earliest investigators of foam drainage using NMRI were Assink et al., 2 who reported five drainage profiles of a small column (1.13 cm in height) of aqueous foam stabilized with polymer and alcohol additives at up to 90 min after the foam was created. The one-dimensional (1D) NMRI results were qualitatively compared to a simple foam drainage model and showed poor agreement at short drainage times, although this improved for longer drainage times (typically 50 min). In a similar study. McCarthy 3 examined the variation in proton signal intensity of egg white foams to follow the change in foam density with time using 1D magnetic resonance profile imaging. In addition, McCarthy examined how the spin–spin (T 2 ) relaxation behavior of the system varied with time and found that there were two distinct environments for the hydrogen nuclei of a draining foam: one corresponding to bulk-like liquid, predominantly in the Plateau borders, and the other being those adjacent to the gas–liquid interface of the foam. Since then only a few articles have been published Correspondence concerning this article should be addressed to P. Stevenson at [email protected]. Ó 2006 American Institute of Chemical Engineers AIChE Journal February 2007 Vol. 53, No. 2 290
-
Upload
paul-stevenson -
Category
Documents
-
view
213 -
download
1
Transcript of Quantitative measurements of liquid holdup and drainage in foam using NMRI

Quantitative Measurements of Liquid Holdupand Drainage in Foam Using NMRI
Paul StevensonCentre for Multiphase Processes, University of Newcastle, Callaghan, NSW 2308, Australia
Michael D. Mantle, Andrew J. Sederman, and Lynn F. GladdenDept. of Chemical Engineering, University of Cambridge, Cambridge, CB2 3RA, United Kingdom
DOI 10.1002/aic.11068Published online December 19, 2006 in Wiley InterScience (www.interscience.wiley.com).
Liquid fraction profiles of a column of draining aqueous foam stabilized with sodiumdodecyl sulfate were studied by nuclear magnetic resonance imaging (NMRI) at highspatial and temporal resolution. It was observed that the liquid holdup in the columnis not locally homogeneous in the direction of the column axis with liquid holdupexhibiting periodic variation in time. This creates ‘‘ripples’’ in the liquid content pro-files (that is, an approximately sinusoidal variation of liquid fraction in space). Theseripples are seen to actually rise in the column as liquid drains down through the foam.This behavior may be explained by a simple mass balance: the rising velocity of theripples multiplied by the gas fraction in the foam is equivalent to the liquid superficialdrainage rate. Thus, NMRI is proposed as a powerful tool for studying drainage offoams because it provides a noninvasive method of measuring superficial drainage ratein foams that yields time-resolved instantaneous drainage rates as a function of posi-tion in the column. The measured liquid drainage rates were compared with a dimen-sionless expression for the liquid drainage rate and excellent agreement was achieved.� 2006 American Institute of Chemical Engineers AIChE J, 53: 290–296, 2007
Keywords: magnetic resonance imaging, foam, multiphase flow, fluid mechanics
Introduction
There are a number of techniques that can be used to mea-sure the evolution of the volumetric liquid fraction (e) withinfoam as drainage occurs. The measurement of capacitance orconductance of the foam is a common technique and itsmain advantage is that it is noninvasive.1 However, it is diffi-cult to achieve good spatial resolution and the inference ofdrainage rates from profiles of liquid volume fraction can beproblematical. Nuclear magnetic resonance imaging (NMRI)methods can obtain the liquid holdup profile in a column offoam with excellent temporal and spatial resolution. Some of
the earliest investigators of foam drainage using NMRI were
Assink et al.,2 who reported five drainage profiles of a small
column (1.13 cm in height) of aqueous foam stabilized with
polymer and alcohol additives at up to 90 min after the foam
was created. The one-dimensional (1D) NMRI results were
qualitatively compared to a simple foam drainage model and
showed poor agreement at short drainage times, although this
improved for longer drainage times (typically 50 min). In a
similar study. McCarthy3 examined the variation in proton
signal intensity of egg white foams to follow the change in
foam density with time using 1D magnetic resonance profile
imaging. In addition, McCarthy examined how the spin–spin
(T2) relaxation behavior of the system varied with time and
found that there were two distinct environments for thehydrogen nuclei of a draining foam: one corresponding tobulk-like liquid, predominantly in the Plateau borders, andthe other being those adjacent to the gas–liquid interface ofthe foam. Since then only a few articles have been published
Correspondence concerning this article should be addressed to P. Stevenson [email protected].
� 2006 American Institute of Chemical Engineers
AIChE JournalFebruary 2007 Vol. 53, No. 2290
in the literature addressing more general aspects of foambehavior. Gonatas et al.4 used two-dimensional NMRI toobserve the coarsening inside a foam with time, whereasPrause et al.5 presented the first three-dimensional images ofa gelatin solution foam; gelatin was chosen because drainagerates were slow, thus allowing for large acquisition time.None of these studies gave true quantitative measurement ofeither (1) liquid volume fraction during foam drainage or (2)the evolution of the local superficial liquid drainage velocitywith increasing time.
Fully quantitative liquid holdup profiles of the free drain-age of a column of aqueous foam are reported herein. High-spatial and temporal-resolution NMRI data were obtained(312 mm and 2 s, respectively) for the acquisition of foamliquid holdup profiles. Although downward drainage wasobserved as the liquid percolated through the froth, pocketsof relatively high liquid holdup foam were seen to actuallyrise up the column in what we describe as ripples. When theposition of these ripples is plotted as a function of time, thegradient of the monotonically rising curves that are apparentis equal to the (rising) velocity of the ripples in the foam.This seemingly curious phenomenon of rising ripples indraining foams will be explained by a simple mass balanceon the foam. Moreover, the gradient of the ripples multipliedby the gas fraction will be shown to be equal to the local su-perficial liquid drainage velocity. Thus, for the first time, anew noninvasive method of directly measuring the free liquiddrainage rate in foam systems is demonstrated at any pointalong the axis of the foam. In addition we show that themeasured liquid drainage rate from foams stabilized with so-dium dodecyl sulfate (SDS) is in excellent agreement with asimple dimensionless expression that correlates the nondi-mensionalized drainage rate with a power-law function of thevolumetric liquid fraction.
The characterization of liquid drainage rate from foam isimportant not only to gain understanding of the behavior ofstationary gas–liquid foams, but also to assist in predictionof the hydrodynamic condition of pneumatic froths in miner-als flotation and foam fractionation.6 Neethling et al.7 ass-erted that two adjustable constants are required to character-ize liquid drainage from foam to account for viscous losseswithin the Plateau borders and within the nodes, and theyperformed ‘‘forced drainage’’ experiments to ascertain theirvalues for two different types of surfactant. The forced drain-age experiments proceed by the formation of a very dry sta-tionary foam, to which liquid at a known rate is added to thetop surface. A ‘‘wet front’’ travels down the column of foamand, if the velocity of this front is measured, then the liquiddrainage rate as a function of liquid holdup can be measuredand therefore the values of the two necessary adjustable con-stants can be inferred. However, the forced drainage experi-ment can be problematic because the wet front velocity mustbe measured either visually, which is difficult and subjective,or by electrical tomographical methods, which require dedi-cated experimental apparatus. The technique described hereinis presented as an alternative method of accurately measuringand characterizing liquid drainage rate in gas–liquid foam.NMRI’s specific advantages over other techniques are that itis a completely noninvasive and quantitative technique thatallows the measurement of high spatial and temporal liquidholdups, providing information that is not available by other
techniques. These are done in situ without the addition of atracer or further liquid and thus may be carried out withoutdisturbing the measurement.
Experimental Technique
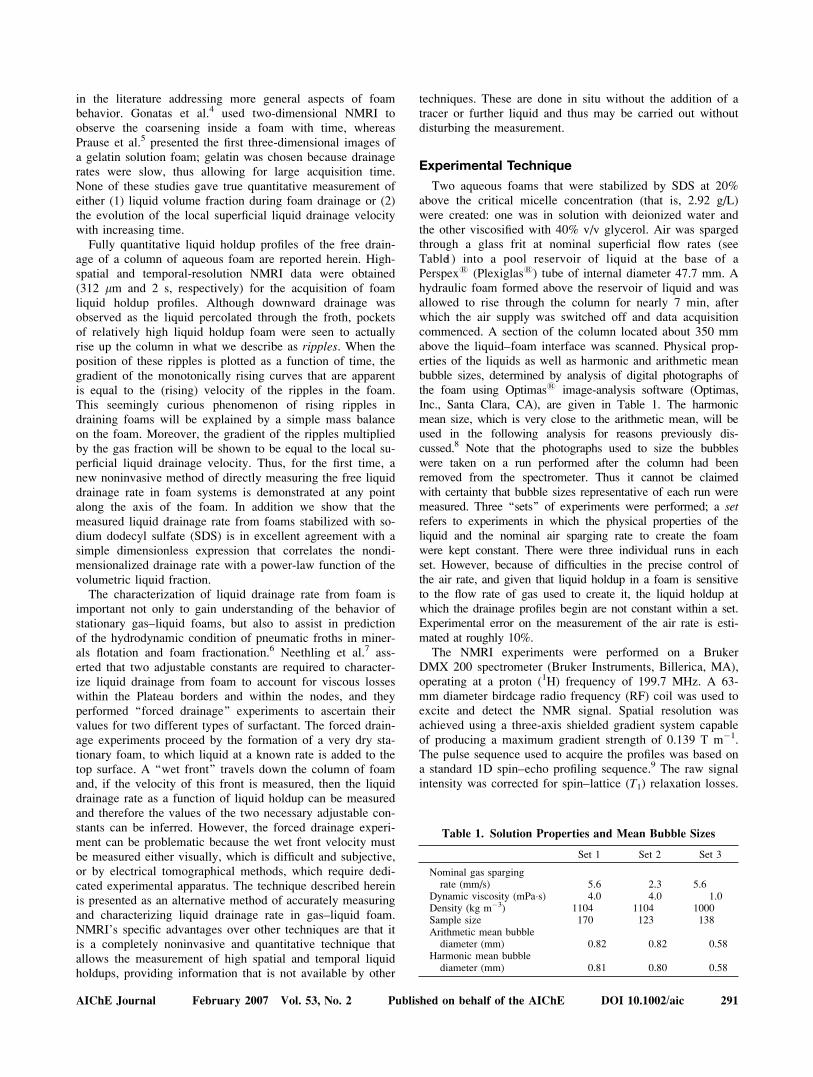
Two aqueous foams that were stabilized by SDS at 20%above the critical micelle concentration (that is, 2.92 g/L)were created: one was in solution with deionized water andthe other viscosified with 40% v/v glycerol. Air was spargedthrough a glass frit at nominal superficial flow rates (seeTable1) into a pool reservoir of liquid at the base of aPerspex1 (Plexiglas1) tube of internal diameter 47.7 mm. Ahydraulic foam formed above the reservoir of liquid and wasallowed to rise through the column for nearly 7 min, afterwhich the air supply was switched off and data acquisitioncommenced. A section of the column located about 350 mmabove the liquid–foam interface was scanned. Physical prop-erties of the liquids as well as harmonic and arithmetic meanbubble sizes, determined by analysis of digital photographs ofthe foam using Optimas1 image-analysis software (Optimas,Inc., Santa Clara, CA), are given in Table 1. The harmonicmean size, which is very close to the arithmetic mean, will beused in the following analysis for reasons previously dis-cussed.8 Note that the photographs used to size the bubbleswere taken on a run performed after the column had beenremoved from the spectrometer. Thus it cannot be claimedwith certainty that bubble sizes representative of each run weremeasured. Three ‘‘sets’’ of experiments were performed; a setrefers to experiments in which the physical properties of theliquid and the nominal air sparging rate to create the foamwere kept constant. There were three individual runs in eachset. However, because of difficulties in the precise control ofthe air rate, and given that liquid holdup in a foam is sensitiveto the flow rate of gas used to create it, the liquid holdup atwhich the drainage profiles begin are not constant within a set.Experimental error on the measurement of the air rate is esti-mated at roughly 10%.
The NMRI experiments were performed on a BrukerDMX 200 spectrometer (Bruker Instruments, Billerica, MA),operating at a proton (1H) frequency of 199.7 MHz. A 63-mm diameter birdcage radio frequency (RF) coil was used toexcite and detect the NMR signal. Spatial resolution wasachieved using a three-axis shielded gradient system capableof producing a maximum gradient strength of 0.139 T m�1.The pulse sequence used to acquire the profiles was based ona standard 1D spin–echo profiling sequence.9 The raw signalintensity was corrected for spin–lattice (T1) relaxation losses.
Table 1. Solution Properties and Mean Bubble Sizes
Set 1 Set 2 Set 3
Nominal gas spargingrate (mm/s) 5.6 2.3 5.6
Dynamic viscosity (mPa�s) 4.0 4.0 1.0Density (kg m�3) 1104 1104 1000Sample size 170 123 138Arithmetic mean bubblediameter (mm) 0.82 0.82 0.58
Harmonic mean bubblediameter (mm) 0.81 0.80 0.58
AIChE Journal February 2007 Vol. 53, No. 2 Published on behalf of the AIChE DOI 10.1002/aic 291

In addition, spin–spin (T2) relaxation losses were also deter-mined to be negligible at <2%. The echo time (TE) andrelaxation time (TR) for all experiments were 4.54 ms and2.0 s, respectively; 256 complex data points were acquiredover an axial field of view of 80.0 mm, thus giving a spatialresolution of 312 mm. A single scan profile was acquired ev-ery 2 s for typically >10 min.
A calibration phantom, to fully quantify the NMRI signalintensity, was prepared by mixing distilled water (H2O) withheavy water (D2O, Aldrich 99%) such that the volumetricwater (H2O) fraction was 0.1. The response of the phantomwas measured and used to calculate a calibration factor sothat the raw magnetic resonance data could be expressed asvolumetric liquid fraction. In addition, this phantom was alsoused to correct for RF inhomogeneities of the excitation B1
field following the method previously described.2 The liquidholdup intensity profiles after RF homogeneity correction(performed by dividing every experimental liquid holdupprofile by that of the water calibration phantom) showed thatonly 31 mm of the scanned 80 mm was found to be within5% of unity (see Figure 1). Thus only sections 31 mm longare shown in the following results.
Results and Discussion
Liquid holdup profiles for one experiment in ‘‘Set 1’’ areshown in Figure 2. It is seen that the liquid fraction isapproximately constant over the 31 mm of the columnscanned and that drainage rate slows as the experiment pro-gresses. Capillarity effects may be discounted in the model-ing of drainage in this section because capillary forces are
absent if the holdup is macroscopically spatially invariant.However, even though it is seen that liquid fraction is macro-scopically constant, it is not locally constant. For the data atzero seconds, a slight ripple, which is above the inherentnoise level of the data, can be detected in the profile; thishas a spatial wavelength of about 1.2 mm, which is roughly50% greater than the harmonic mean bubble diameter (seeTable 1). This arises from the geometric structure of thefoam. Foam has a periodic structure made up of four Plateauborders that meet at a vertex (node), with very thin films orlamellae connecting the Plateau borders. It is reasonable toassert that when the liquid holdup in a thin slice is measuredin a tube of finite cross-sectional area, the periodicity of thefoam structure will cause some slices to exhibit higher liquidfraction than that of others because of the cellular nature ofthe froth structure. Similar ripples are seen in the relativefluid content vs. fluid height plot of Prause et al.5 The behav-ior of these ripples, with time, will be used here to directlydetermine liquid drainage rate in the foam.
The evolution of the average liquid holdup in the 31-mmsection of the foam is shown in Figure 3 for all nine ex-periments. Note that the starting values of holdup differwithin each set. Liquid holdup is strongly dependent on thegas flow rate used to form the foam.8 In the experimentsdescribed here the gas rate could not be controlled with pre-cision, as described above; the reported gas rates should beconsidered nominal values only. Initial liquid holdup ishighest for the runs in Set 1 because the highest gas ratewas used and the elevated viscosity caused more liquidentrainment into the foam. Despite this, the liquid fractionconverges to similar values as those seen in Set 2 that werefor the same solution. Set 3 drains to lower values of liquidvolume fraction because the viscosity of the interstitial fluidis lower.
The ripples discussed above obtained for one of theexperiments in Set 1 are shown in Figure 4. Here, the firstderivative with respect to time of the acquired signal is plot-ted on a time vs. axial height plot. The first derivative intime is plotted, rather than the absolute value of the signal,to improve visual contrast. The bright regions (positive dif-ference value) in Figure 4 correspond to an increase in signalwith respect to time and dark regions (negative difference
Figure 1. 1H spin density profile of a water phantom,foam drainage data, and the result of RF ho-mogeneity correction after division of thefoam drainage data by the water phantom.
The solid line represents the result from division of thefoam profile by the water phantom profile.
Figure 2. Liquid holdup profiles for one experiment in‘‘Set 1.’’
The extent of the data shown here is the region identifiedin braces in Figure 1.
292 DOI 10.1002/aic Published on behalf of the AIChE February 2007 Vol. 53, No. 2 AIChE Journal

value) correspond to a decrease in signal with respect totime. These ripples are seen to actually rise up the column asliquid drains down. This apparently counterintuitive behaviorwill be used to directly determine the drainage rate in foamand is explained in the next section. To obtain the ripple risevelocities from the magnetic resonance intensity profiles, across-correlation algorithm to automatically determine thegradient of the ripples in Figure 4 (and the other eightexperiments) as a function of time was used. The cross-corre-lation is defined as
cðdÞ ¼X
i
½xðiÞ � yðiþ dÞ� (1)
where c(d) is the correlation at a shift of d (in this case aposition shift) and x(i) and y(i) are two profiles (at a knowntime increment) to be compared. c(d) is computed for alldelays and the maximum in the correlation indicates thepositional shift of the structural characteristics (ripples) inthe profiles. Because the minimum shift that can be regis-tered is one digital point, the raw data were first zero filledto 2048 complex points before Fourier transformation toimprove the velocity resolution and to enable the identifica-
tion of smaller velocities. The velocity resolution is found bydividing the spatial resolution (here 39 mm) by the time delaybetween the correlated profiles; herein a minimum velocityresolution was 2 mm s�1 and the maximum was 20 mm s�1.The profiles were B1 corrected and normalized before cross-correlation so that the correlation of just the local intensityvariations (ripples) were identified. For ‘‘Set 2’’ a furthersubtraction of neighboring profiles was necessary to removeslight global intensity variations arising from the very low in-tensity difference of the ripples, which were typically a frac-tion of <0.005 of the signal intensity and, individually,below the noise level of the profiles.
Slope of ripples used to calculate drainage rate
The rising ripples observed are explained by the fact thatthe liquid volume fraction in the foam is not locally constantbecause of the foam structure and, as liquid drains throughthe foam, gas bubbles must be displaced upward. Thus, inthe absence of bubble breakage, the entire structure of thefoam must rise in the column to allow for gas displacement.The velocity of the displaced foam is observed to be equal tothe gradient of the ripples in Figure 4. To mathematicallysimulate this behavior the following model is adopted.
Consider the differential control volume shown in Figure 5.Making the assumption that both the gas and liquid phases areincompressible, a mass balance gives
djddx
¼ ð1� eÞ dVdx
� Vdedx
(2)
where V is the absolute velocity of the foam structure, x isthe vertical length scale in the column, and jd is the superfi-cial liquid drainage rate. This can be simplified to
djddx
¼ d½Vð1� eÞ�dx
(3)
Integrating Eq. 3 gives
jd ¼ Vð1� eÞ þ K (4)
where K is a constant of integration and is readily seen totake the value of zero by considering an equilibrium froth withno drainage. Thus the velocity of the gas (foam structure, orthe gradient of the ripples in Figure 4) multiplied by the vol-umetric gas fraction in the foam is seen to be identical to the
Figure 3. Time evolution of average liquid holdup.
Figure 4. First derivative of arbitrary signal intensitywith respect to time of one experiment in‘‘Set 1.’’
The first derivative is presented rather than the signal in-tensity itself to improve contrast and thus the clarity of theripples. [Color figure can be viewed in the online issue,which is available at www.interscience.wiley.com.]
AIChE Journal February 2007 Vol. 53, No. 2 Published on behalf of the AIChE DOI 10.1002/aic 293

superficial liquid drainage rate and is plotted in Figures 6–8. Ifthe foam is to retain its structural identity (that is, there is nobursting of bubbles and Ostwald ripening is discounted) theabsolute gas velocity must be equal to the velocity of the foamstructure because the gas can only be displaced upward bytraveling within a single bubble.
The method of experimentally determining liquid drainagerate is very accurate because we estimate that e can be meas-ured to within about 2% (the accuracy is governed by the ac-curacy of the D2O calibration) and determination of the slopeof the ripples is associated with only very few sources of error.
Calculated foam drainage rate
It was previously shown10 by dimensional analysis that, ifinertial pressure losses were assumed to be negligible, theliquid superficial drainage rate expressed as a dimensionlessStokes-type number (Sk), where
Sk ¼ jdngr2b
(5)
can be described by a function of e only, that is,
Sk ¼ f ðeÞ (6)
Here, g is the acceleration due to gravity, rb is the harmonicmean bubble radius, and n is the kinematic viscosity of theinterstitial liquid.
In fact, a power-law relationship is seen to provide a re-markable fit to both existing experimental data and theoreti-cal models, that is,
Sk ¼ men (7)
where m and n are dimensionless adjustable constants thatimplicitly contain information about the surface shear viscos-ity of the air–liquid interface and the viscous losses at thenodes in the foam where four Plateau borders meet. In fact,because an intrinsic factor such as shear viscosity is notmeasurable for systems with soluble surfactants,11 and vis-cous losses within nodes are not, as yet, quantifiable, two ad-justable constants are the minimum required to describe thissystem.
Figure 6. Experimentally measured drainage rate(crosses) and that calculated using Eq. 12for the three experiments of ‘‘Set 1.’’
The calculated values are for the most part obscured bythe experimental results. [Color figure can be viewed inthe online issue, which is available at www.interscience.wiley.com.]
Figure 7. Experimentally measured drainage rate(crosses) and that calculated using Eq. 12for the three experiments of ‘‘Set 2.’’
[Color figure can be viewed in the online issue, which isavailable at www.interscience.wiley.com.]
Figure 8. Experimentally measured drainage rate(crosses) and that calculated using Eq. 12for the three experiments of ‘‘Set 3.’’
[Color figure can be viewed in the online issue, which isavailable at www.interscience.wiley.com.]
Figure 5. Control volume for a differential element of adraining foam.
294 DOI 10.1002/aic Published on behalf of the AIChE February 2007 Vol. 53, No. 2 AIChE Journal

The Leonard–Lemlich model12 for the drainage of foam,in which viscous losses are assumed to occur wholly withinthe Plateau borders, is shown9 to be approximated by
Sk ¼ 0:0018e1:92 (8)
when the surface shear viscosity is assumed to be infinite(that is, the Plateau border walls are assumed to be rigid),whereas the model of Koehler et al.13 is well approximatedby
Sk ¼ 0:49
Ie1:55 (9)
which assumed that viscous losses occur only in the nodes ofthe foam rather than in the Plateau borders, where I is thesame dimensionless adjustable constant used by Koehleret al.13 In addition Stevenson10 showed that the drainage dataof Neethling et al.7 fit
Sk ¼ 0:012e1:74 (10)
for foams stabilized by SDS and
Sk ¼ 0:013e1:78 (11)
for foams stabilized by tetradecyltrimethyl ammonium bro-mide (TTAB) at undisclosed concentrations. The rigid-walledLeonard–Lemlich model (represented by Eq. 8) underpredictsthe drainage rate experimentally measured by Neethlinget al. by a factor of about 10 because the Plateau borderwalls, in practice, exhibit surface mobility. The semiempiri-cal model of Koehler et al.13 is only in moderate agreementwith the experimental data, even after the adjustable constantI has been fitted, because of the constraint that there are noviscous losses in the Plateau borders (that is, zero surfaceshear viscosity).
Note that capillarity effects can be discounted in this workbecause the data shown in Figure 2 are essentially invariantin height.
Comparison of measured and calculated drainage rates
In Figure 6 it is seen that, on a plot against liquid superfi-cial drainage rate jd vs. time that Eq. 7 gives excellent agree-ment to the data of ‘‘Set 1’’ with values of m and n such that
Sk ¼ 0:016e2 (12)
These constants are close to those that fit previously reporteddata7 (Eq. 10) for foams stabilized with SDS, obtained usingthe method of forced drainage. However, surface shear vis-cosity (and therefore m and n) changes with surfactant con-centration; Neethling et al.13 do not disclose the surfactantconcentration at which they worked. Note that the values ofthe adjustable constants used in Eq. 12 are only appropriatefor the type and concentration of surfactant used in theseexperiments (that is, 2.92 g L�1 SDS). The procedure mustbe repeated if the values of the constants that pertain to dif-ferent surfactant systems are required. The agreement of Eq.12 with the data of ‘‘Set 2’’ is reasonable, but less satisfac-tory than that of ‘‘Set 1’’ (see Figure 7). For the experimentsof ‘‘Set 3,’’ Eq. 12 is in good agreement with the drainage
rate at a short time (Figure 8), although it significantlyundercalculates (by a factor of roughly 5) the drainage rateat longer times when e becomes small. It is suggested thatthe undercalculation of the actual flow rate may be explainedby the bursting of bubbles within the foam, causing excessliquid drainage over and above that calculated by Eq. 12.Liquid associated with a bubble that bursts is liberated anddrains downward. Quantification of the excess liquid drain-age could provide an indirect method of determining bubblecoalescence within the bulk of the froth.
Conclusions
(1) Nuclear magnetic resonance imaging scans of the freedrainage of an aqueous foam stabilized with SDS were usedto quantitatively ascertain the time evolution of liquid vol-ume fraction in a foam.
(2) The scans reveal curious ripples of relatively high liq-uid fraction that rise in the column as liquid drains down. Byintroducing a dynamic volume balance, it was shown that thegradient of these ripples, plotted on a graph of height vs.time, multiplied by the volumetric gas fraction of the foam,is equivalent to the superficial drainage rate of the liquid.Thus the superficial liquid drainage rate from foam can bemeasured noninvasively.
(3) This experimentally measured drainage rate has beencompared to a simple dimensionless expression (Eq. 12). Theagreement is excellent for wet foams with more viscous in-terstitial liquid. Moreover, it appears that in experimentsusing a less viscous interstitial liquid, in which bubble break-age is expected to be greater, that the excess drainage result-ing from bubble breakage may be ascertained for the differ-ence between the actual total drainage rate and that calcu-lated by Eq. 12 fitted to the data at earlier times in theexperiment.
Acknowledgments
The support provided by an Australian Research Council Discovery-Projects grant is acknowledged. MDM, AJS, and LFG thank the EPSRCfor provision of the MRI spectrometer. Dr. Robert Niven of the Austra-lian Defence Force Academy gave useful comments on a draft of thismanuscript and Miss Jacqueline Hicks performed the bubble sizing.
Notation
d = bubble diameter, mg = acceleration due to gravity, m s�2
I = Koehler’s adjustable constant used in Eq. 9jd = liquid superficial velocity, m s�1
K = a constant of integration, m s�1
rb = bubble radius (:0.5d), mSk = Stokes-type number defined in Eq. 5t = time, sV = absolute gas velocity, m s�1
x = vertical distance in the column (measured positiveupward), m
Greek letters
e = volumetric liquid fraction in the foamn = liquid kinematic viscosity, m2 s�1
AIChE Journal February 2007 Vol. 53, No. 2 Published on behalf of the AIChE DOI 10.1002/aic 295

Literature Cited
1. Barigou M, Deshpande NS, Wiggers FN. An enhanced electrical re-sistance technique for foam drainage measurement. Colloids Surf A.2001;189:237–246.
2. Assink RA, Caprihan A, Fukushima E. Density profiles of a draining foamby nuclear magnetic resonance imaging. AIChE J. 1988;34:2077–2079.
3. McCarthy MJ. Interpretation of the magnetic resonance imaging sig-nal from a foam. AIChE J. 1990;36:287–290.
4. Gonatas CP, Leigh JS, Yodh AG, Glazier JA, Prause B. Magnetic reso-nance-images of coarsening inside a foam. Phys Rev Lett. 1995;75:573–576.
5. Prause BA, Glazier JA, Gravina SJ, Montegmagno CD. Three-dimensional magnetic resonance imaging of a liquid foam. J Phys:Condens Matter. 1995;7:511–515.
6. Stevenson P. The wetness of a rising foam. Ind Eng Chem Res.2006;45:803–807.
7. Neethling SJ, Lee HT, Cilliers JJ. A foam drainage equation generalizedfor all liquid contents. J Phys: Condens Matter. 2002;14:331–342.
8. Stevenson P, Stevanov C. Effect of rheology and interfacial rigidityon liquid recovery from rising froth. Ind Eng Chem Res. 2004;43:6187–6194.
9. Callaghan PT. Principles of Nuclear Magnetic Resonance Spectros-copy. Oxford, UK: Clarendon Press; 1993.
10. Stevenson P. Dimensional analysis of foam drainage. Chem Eng Sci.2006;61:4503–4510.
11. Stevenson P. Remarks on the shear viscosity of surfaces stabilisedwith soluble surfactants. J Colloid Interface Sci. 2005;290:603–606.
12. Leonard R, Lemlich R. A study of interstitial liquid flow in foam.AIChE J. 1965;11:18–25.
13. Koehler SA, Hilgenfeldt S, Stone HA. Liquid flow through aqueousfoams: The node-dominated foam drainage equation. Phys Rev Lett.1999;82:4232–4235.
Manuscript received Mar. 23, 2006, revision received Sept. 12, 2006, and finalrevision received Nov. 10, 2006.
296 DOI 10.1002/aic Published on behalf of the AIChE February 2007 Vol. 53, No. 2 AIChE Journal