QUANTITATIVE FLUORESCENT SPECKLE MICROSCOPY OF ...Quantitative Fluorescent Speckle Microscopy of...
29
Quantitative Fluorescent Speckle Microscopy of Cytoskeleton Dynamics Gaudenz Danuser and Clare M. Waterman-Storer Department of Cell Biology, The Scripps Research Institute, La Jolla, California 92037; email: [email protected], [email protected] Annu. Rev. Biophys. Biomol. Struct. 2006. 35:361–87 The Annual Review of Biophysics and Biomolecular Structure is online at biophys.annualreviews.org doi: 10.1146/ annurev.biophys.35.040405.102114 Copyright c 2006 by Annual Reviews. All rights reserved 1056-8700/06/0609- 0361$20.00 Key Words computer vision, particle tracking, actin, microtubule, focal adhesion Abstract Fluorescent speckle microscopy (FSM) is a technology used to an- alyze the dynamics of macromolecular assemblies in vivo and in vitro. Speckle formation by random association of fluorophores with a macromolecular structure was originally discovered for micro- tubules. Since then FSM has been expanded to study other cytoskele- ton and cytoskeleton-binding proteins. Specialized software has been developed to convert the stochastic speckle image signal into spa- tiotemporal maps of polymer transport and turnover in living cells. These maps serve as a unique quantitative readout of the dynamic steady state of the cytoskeleton and its responses to molecular and genetic interventions, allowing a systematic study of the mechanisms of cytoskeleton regulation and its effect on cell function. Here, we explain the principles of FSM imaging and signal analysis, outline the biological questions and corresponding methodological advances that have led to the current state of FSM, and give a glimpse of new FSM modalities under development. 361 Annu. Rev. Biophys. Biomol. Struct. 2006.35:361-387. Downloaded from arjournals.annualreviews.org by Clare Waterman-Storer on 06/01/06. For personal use only.
Transcript of QUANTITATIVE FLUORESCENT SPECKLE MICROSCOPY OF ...Quantitative Fluorescent Speckle Microscopy of...

ANRV275-BB35-16 ARI 4 April 2006 20:11
Quantitative FluorescentSpeckle Microscopy ofCytoskeleton DynamicsGaudenz Danuser and Clare M.Waterman-StorerDepartment of Cell Biology, The Scripps Research Institute, La Jolla,California 92037; email: [email protected], [email protected]
Annu. Rev. Biophys. Biomol. Struct.2006. 35:361–87
The Annual Review ofBiophysics and BiomolecularStructure is online atbiophys.annualreviews.org
doi: 10.1146/annurev.biophys.35.040405.102114
Copyright c© 2006 byAnnual Reviews. All rightsreserved
1056-8700/06/0609-0361$20.00
Key Words
computer vision, particle tracking, actin, microtubule, focaladhesion
AbstractFluorescent speckle microscopy (FSM) is a technology used to an-alyze the dynamics of macromolecular assemblies in vivo and invitro. Speckle formation by random association of fluorophores witha macromolecular structure was originally discovered for micro-tubules. Since then FSM has been expanded to study other cytoskele-ton and cytoskeleton-binding proteins. Specialized software has beendeveloped to convert the stochastic speckle image signal into spa-tiotemporal maps of polymer transport and turnover in living cells.These maps serve as a unique quantitative readout of the dynamicsteady state of the cytoskeleton and its responses to molecular andgenetic interventions, allowing a systematic study of the mechanismsof cytoskeleton regulation and its effect on cell function. Here, weexplain the principles of FSM imaging and signal analysis, outlinethe biological questions and corresponding methodological advancesthat have led to the current state of FSM, and give a glimpse of newFSM modalities under development.
361
Ann
u. R
ev. B
ioph
ys. B
iom
ol. S
truc
t. 20
06.3
5:36
1-38
7. D
ownl
oade
d fr
om a
rjou
rnal
s.an
nual
revi
ews.
org
by C
lare
Wat
erm
an-S
tore
r on
06/
01/0
6. F
or p
erso
nal u
se o
nly.
ANRV275-BB35-16 ARI 4 April 2006 20:11
Contents
INTRODUCTION. . . . . . . . . . . . . . . . . 362PRINCIPLES OF SPECKLE
IMAGE FORMATION . . . . . . . . . . 363Stochastic Association of
Fluorophores withMicrotubules . . . . . . . . . . . . . . . . . 363
Stochastic Association ofFluorophores in Other Systems:The Platform Model forSpeckle Formation . . . . . . . . . . . . 365
Naı̈ve Interpretation of SpeckleDynamics . . . . . . . . . . . . . . . . . . . . . 366
Computational Models of SpeckleDynamics . . . . . . . . . . . . . . . . . . . . 366
Statistical Analysis of SpeckleDynamics . . . . . . . . . . . . . . . . . . . . . 367
Single-Fluorophore VersusMulti-Fluorophore Speckles . . . 370
REQUIREMENTS FOR SPECKLEIMAGING . . . . . . . . . . . . . . . . . . . . . . 370
ANALYSIS OF SPECKLEMOVEMENTS. . . . . . . . . . . . . . . . . . 371Tracking Speckle Flow: Early and
Recent Developments . . . . . . . . . 371Tracking Single-Speckle
Trajectories . . . . . . . . . . . . . . . . . . . 373Mapping Polymer Turnover
Without Speckle Trajectories . . 375APPLICATIONS OF FSM FOR
STUDYING PROTEIN
DYNAMICS IN VITRO ANDIN VIVO . . . . . . . . . . . . . . . . . . . . . . . . 376
SELECTED RESULTS FROMTHE STUDY OF ACTIN INEPITHELIAL CELLMIGRATION . . . . . . . . . . . . . . . . . . . 377Organization of Actin
Cytoskeleton in FourKinematically and KineticallyDistinct Regions . . . . . . . . . . . . . . 377
Correlation of Actin Assembly witha GFP-p34 Signal IndicatesDifferent Function of theArp2/3 Complex inLamellipodium and Lamella . . . 377
Coupling of Actin Disassembly andContraction in theConvergence Zone . . . . . . . . . . . . 379
Heterogeneity in Speckle Velocityand Lifetime Reveals SpatialOverlap of Lamellipodium andLamella at the Leading Edge . . . 379
NEW APPLICATIONS OF FSM . . . 381Two-Speckle Microrheology
Probes Viscoelastic Propertiesof Actin Networks . . . . . . . . . . . . . 381
Correlational qFSM of theDynamic Engagement of ActinCytoskeleton and FocalAdhesions . . . . . . . . . . . . . . . . . . . . . 382
CONCLUSION . . . . . . . . . . . . . . . . . . . . 383
Fluorescentspeckle microscopy(FSM): imaging ofspeckle signals usingthe differentmodalities offluorescence lightmicroscopy
INTRODUCTION
Fluorescent speckle microscopy (FSM) is amethod used to analyze the movement andassembly/disassembly dynamics of macro-molecular structures in vivo and in vitro (58).As reviewed in References 10 and 57, FSMis derived from the principles of fluorescentanalog cytochemistry. There, purified pro-tein is covalently linked to a fluorophore andmicroinjected or expressed as a GFP fusionin living cells. Fluorescent protein that in-
corporates into cellular structures is then vi-sualized by epifluorescence light microscopy(40, 54). This classic approach has yieldedmuch information about protein localizationand the dynamics of macromolecular assem-blies in cells but has been limited in its abilityto report protein dynamics because of inher-ently high background fluorescence from un-incorporated and out-of-focus incorporatedfluorescent subunits. In addition it is oftenimpossible to detect movement or turnover
362 Danuser ·Waterman-Storer
Ann
u. R
ev. B
ioph
ys. B
iom
ol. S
truc
t. 20
06.3
5:36
1-38
7. D
ownl
oade
d fr
om a
rjou
rnal
s.an
nual
revi
ews.
org
by C
lare
Wat
erm
an-S
tore
r on
06/
01/0
6. F
or p
erso
nal u
se o
nly.
ANRV275-BB35-16 ARI 4 April 2006 20:11
of subunits within assemblies because of theuniform fluorescent labeling of structures.These problems have been alleviated by theuse of laser photobleaching and photoacti-vation of fluorescence to mark structures inlimited cell areas and measure the movementand turnover of subunits in the marked re-gion at steady state (25, 31, 46, 52, 53, 66).Similar to these techniques is the ratiomet-ric method of fluorescence localization af-ter photobleaching (FLAP) (12, 70). FSMprovides the same information as these pho-tomarking techniques. In addition, it deliv-ers simultaneous kinetic data in large areasof the cell, offering the capability to detectnonsteady-state molecular dynamics withinassemblies at high spatial and temporal res-olution. FSM also reduces out-of-focus flu-orescence in images and improves the visi-bility of fluorescently labeled structures andtheir dynamics in three-dimensional poly-mer arrays such as the mitotic spindle (27,28, 59).
In its initial development, FSM utilizedwide-field epifluorescence light microscopyand digital imaging with a sensitive, low-noisecooled charge-coupled-device (CCD) cameraand was applied to the study of assembly dy-namics and movement of microtubules (60).Since then FSM has been transferred to con-focal and total internal reflection fluorescencemicroscopes (1, 2, 16, 27) and has been ap-plied to new biological problems in vivo andin vitro. A critical step in advancing FSM tobecome a routine method for measuring cy-toskeleton flow and turnover was the devel-opment of fully automated computer-basedtracking and statistical analysis of speckle dy-namics. Recently, these models for speckle im-age analysis have been expanded to infer thetransient coupling between two protein as-semblies and to probe viscoelastic propertiesof polymer networks.
In this paper, we review the principlesof speckle formation and describe the imag-ing and analytical requirements for FSM tobecome a quantitative technique. We heav-ily rely on FSM data of actin cytoskeleton
MAP: microtubule-associatedprotein
Fluorescentspeckle: random,diffraction-limitedintensity peak in theimage signalsignificantly brighterthan the neighboringsignal
dynamics in epithelial cell migration, wherewe believe the integration of FSM imag-ing and computational image analysis hasbeen brought to the most sophisticated level.The value of FSM as a general techniquefor the analysis of macromolecular assem-blies is documented in a comprehensive ta-ble (Table S1; follow the Supplemental Mate-rial link from the Annual Reviews home pageat http://www.annualreviews.org). The pa-per concludes with an outlook on ournewest developments of FSM for the mea-surement of cytoskeleton-adhesion couplingand of material properties of actin filamentnetworks.
PRINCIPLES OF SPECKLEIMAGE FORMATION
Stochastic Association ofFluorophores with Microtubules
FSM was discovered by accident when it wasnoticed in high-resolution images of cells in-jected with X-rhodamine tubulin that somemicrotubules exhibited variations in fluores-cence intensity along their lattices, i.e., theylooked speckled (Figure 1a,b) (60). Therewere several possible interpretations of suchimages: (a) the fluorescent tubulin couldpreferentially associate with itself, formingbright oligomers or aggregates on the mi-crotubule; (b) cellular factors such as or-ganelles or microtubule-associated proteins(MAPs) could be bound to the microtubuleand “mask” or quench the fluorescence ofsome regions; or (c) variations in the num-ber of fluorescent tubulin subunits in eachresolution-limited image region along the mi-crotubule could occur as the microtubule as-sembled from a pool of labeled and unlabeleddimers (61).
We discounted the hypothesis that speck-les were generated by fluorescent aggregatesby showing that labeled tubulin dimers sedi-ment similarly to unlabeled purified dimers inan analytical ultracentrifugation assay. Next,we showed that fluorescent speckle patterns
www.annualreviews.org • Fluorescent Speckle Microscopy 363
Ann
u. R
ev. B
ioph
ys. B
iom
ol. S
truc
t. 20
06.3
5:36
1-38
7. D
ownl
oade
d fr
om a
rjou
rnal
s.an
nual
revi
ews.
org
by C
lare
Wat
erm
an-S
tore
r on
06/
01/0
6. F
or p
erso
nal u
se o
nly.

ANRV275-BB35-16 ARI 4 April 2006 20:11
Figure 1Speckle formation in microtubule and actin cytoskeletal polymers and focal adhesion (FAs). (a, b)Comparison of random speckle pattern of fluorescence along microtubules for (a) a living epithelial cellmicroinjected with X-rhodamine-labeled tubulin and for (b) microtubules assembled in vitro from 5%X-rhodamine-labeled tubulin. Scale bar: 5 μm. (c) Model for fluorescent speckle pattern formation in amicrotubule grown from a tubulin pool containing a small fraction of labeled dimers. (d ) Dependence ofspeckle contrast on the fraction of labeled tubulin dimers. (e, f ) Speckle formation in actin filamentnetworks. An epithelial cell was microinjected with a low level of X-rhodamine-labeled actin, fixed, andstained with Alexa-488 phalloidin. (e) Phalloidin image showing the organization of actin filaments inamorphous filament networks and bundles. ( f ) In the single FSM image much of the structuralinformation is lost, but time-lapse FSM series contain dynamic information of filament transport andturnover not accessible with higher-level labeling of the cytoskeleton. ( g) Close-up of 2 μm × 2 μmwindow in panels e and f. (h) Colorized speckle signal overlaid onto a quick-freeze deep etch image of thesame-sized region of the actin cytoskeleton in the leading edge of a fibroblast (kindly provided byTatyana Svitkina) with hypothetical fluorophore distribution that could give rise to such speckle pattern.This indicates the scale of FSM compared with ultrastructure of the polymer network and illustrates thata small proportion of the total actin fluoresces and that fluorophores from different filaments contributeto the same speckle. (i, j ) Low-level expression of GFP-tagged FA protein vinculin results in speckledFAs in TIRF images. A cell expressing GFP-vinculin was fixed and immunofluorescently stained withantibodies to (i ) vinculin to reveal the position of FAs, which in the ( j ) GFP channel appear speckledbecause of the low level of incorporation of GFP-vinculin.
364 Danuser ·Waterman-Storer
Ann
u. R
ev. B
ioph
ys. B
iom
ol. S
truc
t. 20
06.3
5:36
1-38
7. D
ownl
oade
d fr
om a
rjou
rnal
s.an
nual
revi
ews.
org
by C
lare
Wat
erm
an-S
tore
r on
06/
01/0
6. F
or p
erso
nal u
se o
nly.
ANRV275-BB35-16 ARI 4 April 2006 20:11
on microtubules assembled from purifiedtubulin in vitro were similar to those of micro-tubules in cells where MAPs and organellesare present (61). Thus, the most plausibleexplanation for speckle formation in micro-tubules was that variations existed in the num-ber of fluorescent tubulin subunits in eachresolution-limited image region along themicrotubule.
To understand how speckles originated,we considered how the images of fluo-rescent microtubules were formed by themicroscope (Figure 1c). Microtubules assem-ble from α/β tubulin dimers into the 25-nm-diameter cylindrical wall such that there are1625 dimers per micron (11). The final imageresults from a convolution of the fluorophoredistribution along the microtubule with thepoint-spread function (PSF) of the micro-scope. For a two-dimensional treatment of thesituation, the in-focus slice of the PSF is givenby the Airy disk, for which the radius of thefirst ring with zero intensity amounts to r =0.61 λ /NA (20). The parameters λ and NAdenote the emission wavelength of the fluo-rophore and the numerical aperture of the ob-jective lens, respectively. For X-rhodamine-labeled microtubules (620-nm emission), theradius of the Airy disk is 270 nm (NA = 1.4),which corresponds to 440 tubulin dimers. Agiven fraction of fluorescent dimers, f, pro-duces a mean number of fluorescent dimersn = 440 × f per PSF. The speckle patternalong the microtubule is produced by vari-ations in the number of fluorescent dimersper PSF relative to this mean. Thus, the con-trast of the speckle pattern can be approxi-mated by the ratio of the standard deviationand the mean of a binomial distribution withn elements: c = √
n · f · (1 − f )/(n · f ). Thisformula suggests that the contrast c increaseswith decreasing f and decreases with increas-ing n, indicating the requirement for opticswith the highest NA possible. This behavioris illustrated in Figure 1d. Microtubules as-sembled from pure tubulin containing 1.25%to 5% labeled dimers exhibit speckles of vary-ing intensity along their length. Microtubules
PSF: point spreadfunction of themicroscope
F-actin: filamentous(polymeric) actin
assembled from 10% to 50% labeled tubulinare evenly labeled.
In theory, optimal contrast is obtainedwhere speckles are formed by a single fluo-rophore per Airy disk (55, 62). For a micro-tubule, 80% or more speckles arise from asingle fluorophore when f is less than 0.1%(10). In practice, however, the lower boundfor f is determined by two considerations:(a) Technologically, the noise level and sen-sitivity of the imaging system, instability ofthe microscope, and the dynamics of the ob-served process may all deteriorate feasibilityof single fluorophore detection. (b) Experi-mentally, too-low fractions result in a verylow density of speckles, i.e., in low spatiotem-poral sampling of underlying dynamics. Wehave found by both theory and practice thatit is often desirable to image speckles at frac-tions in the range of 0.5% to 2%. In this rangespeckles consist of three to eight fluorophores(10).
Stochastic Association ofFluorophores in Other Systems:The Platform Model for SpeckleFormation
When cells are injected with low levels of flu-orescently labeled actin and imaged at highresolution, actin-rich structures appear rela-tively evenly speckled and do not indicate thearchitectural organization of the cytoskeleton(Figure 1e,f ) (41, 51, 55, 58, 63). Similar im-ages can also be obtained by expressing GFP-fused actin at a very low level (23, 55) or byinjecting trace amounts of the labeled actin-binding molecule phalloidin (47, 69). In con-trast to speckle formation in isolated micro-tubules, labeled actin subunits associate witha highly cross-linked three-dimensional net-work of actin filaments (F-actin) (34, 44, 45).The mesh size of an F-actin network in liv-ing cells is nearly always below the resolutionlimit of the light microscope (Figure 1g,h).Consequently, unless f is kept extremely lowso that only one fluorophore falls into the PSFvolume (55), fluorescent speckles arise most
www.annualreviews.org • Fluorescent Speckle Microscopy 365
Ann
u. R
ev. B
ioph
ys. B
iom
ol. S
truc
t. 20
06.3
5:36
1-38
7. D
ownl
oade
d fr
om a
rjou
rnal
s.an
nual
revi
ews.
org
by C
lare
Wat
erm
an-S
tore
r on
06/
01/0
6. F
or p
erso
nal u
se o
nly.
ANRV275-BB35-16 ARI 4 April 2006 20:11
FA: focal adhesion
likely from subunits distributed across severalfilaments.
The same concept of speckle formation hasbeen exploited to visualize molecules makingup focal adhesions (FAs) (1). GFP-fusions toFA proteins, including vinculin, talin, paxilin,α-actinin, zyxin, or αvintegrin (15), have beenexpressed in epithelial cells from crippled pro-moters to achieve very low levels. Labeledproteins assembling with endogenous, unla-beled proteins give FAs a speckled appearance(Figure 1i,j ). As with actin networks, speck-les represent randomly distributed fluorescentFA proteins that are temporarily clustered inthe FA complex within the three-dimensionalvolume of one PSF.
A speckle is thus defined as a diffraction-limited image region that is significantlyhigher in fluorophore concentration (re-ported by fluorescence intensity) than itsneighboring diffraction-limited image re-gions. In addition, for a speckle signal tobe detected, the contributing fluorescentmolecules must be immobilized within thePSF volume for the 0.1 to 2 s exposuretime required by most digital cameras to ac-quire the dim FSM image. In contrast, un-bound, diffusible fluorescent molecules yieldan evenly distributed background signal ofsignificantly lower magnitude across the manypixels that the molecules visit during theexposure. In a high-resolution (∼250 nm),high-magnification (100 × ) image, actinmonomers move ∼60 pixels s−1 (26). The con-cept of fluorophore immobilization leading tospeckle formation was nicely demonstrated byWatanabe & Mitchison (55). Diffusible GFPexpressed in cells at very low levels producedan even distribution of fluorescence, whereas asimilar level of GFP-conjugated actin that in-corporated into the cytoskeleton produced aspeckled image. The same idea was pursued byBulinski et al. (7) and by Kapoor & Mitchison(24). GFP chimera of the MAP ensconsin (7)and fluorescently tagged tetrameric kinesinmotor Eg5 (24) were used to observe the tran-sient binding of these molecules to micro-tubules in vitro and in vivo.
In summary, speckle signal formation oc-curs when one or a few fluorescently labeledmolecules within a PSF volume associate witha molecular scaffold where no other fluores-cent molecules are located. We refer to thisscaffold as the speckle platform. Associationwith the platform occurs when labeled sub-units completely incorporate into the plat-form, as with tubulin or actin, or when theybind to it, as in the case of cytoskeleton-binding proteins or FA molecules. The dura-tion of association must be equal to or longerthan the camera exposure of one frame in atime-lapse image sequence.
Naı̈ve Interpretation of SpeckleDynamics
Following the platform model, one would ex-pect the appearance of a speckle to correspondto the local association of subunits with theplatform. Conversely, the disappearance of aspeckle would mark the local dissociation ofsubunits. In other words, FSM allows, in prin-ciple, the direct kinetic measurement of sub-unit turnover in space and time via specklelifetime analysis. In addition, once a speckle isformed, it may undergo motion that indicatesthe coordinated movement of labeled subunitson the platform and/or the movement of theplatform itself.
Computational Models of SpeckleDynamics
The interpretation of speckle dynamics be-comes significantly more complicated whenindividual speckles arise from fluorophoresdistributed over multiple polymers. To exam-ine how speckle appearance and disappear-ance relate to the rates of assembly and disas-sembly of F-actin, we performed Monte Carlosimulations of fluorophore incorporation intogrowing and shrinking filaments in dense andbranched networks and generated syntheticFSM time-lapse sequences (39). The first les-son we learned from this modeling was thatthe speckle density is independent of whether
366 Danuser ·Waterman-Storer
Ann
u. R
ev. B
ioph
ys. B
iom
ol. S
truc
t. 20
06.3
5:36
1-38
7. D
ownl
oade
d fr
om a
rjou
rnal
s.an
nual
revi
ews.
org
by C
lare
Wat
erm
an-S
tore
r on
06/
01/0
6. F
or p
erso
nal u
se o
nly.

ANRV275-BB35-16 ARI 4 April 2006 20:11
the network assembles or disassembles; itdepends only on how many Airy disks canbe resolved per unit area, e.g., 1 μm2. WithNA = 1.4/100 × optics, this amounts to∼4 (approximately 2 × 2), as confirmed byFigure 2a. The graph displays the meanspeckle density from five simulations of a net-work that starts with no fluorophores, assem-bles for 120 s (inset: mean fluorescence in-tensity increases), and disassembles for 360 s(inset: mean fluorescence intensity decreases)at equal rates. The density does not changeafter saturation at 100 s and remains constantdespite further addition of fluorophores foranother 20 s. This suggests that monomer as-sociation can cause an equal number of speckleappearances and disappearances. The sameholds in the opposite sense during networkdisassembly.
Whereas the NA of the optics definesthe maximum number of resolvable speck-les per unit area, the labeling ratio influencesthe speckle density indirectly. For multi-fluorophore speckles the ratio f is the maindeterminant of speckle contrast. When in-creasing the ratio the speckle density dropsbecause the difference between the peak in-tensity of a speckle and its surroundings is nolonger distinguishable from intensity fluctua-tions due to noise. Similarly, at labeling ratioswhere speckles represent the image of singlefluorophores ( f < 0.1%), a further decrease off reduces the speckle density proportionally.Across the optimal range of ratios for multi-fluorophore speckles (0.5% < f < 3%) thedensity is almost constant. These model pre-dictions were largely confirmed experimen-tally by Adams et al. (1).
The reason for the constant speckle den-sity in the range of 0.5% < f < 3% is illustratedin Figure 2b. A speckle is defined as a local im-age intensity maximum significantly above thesurrounding background. The critical inten-sity difference �Icrit depends on both the cam-era noise and the shot noise. The shot noiseis by itself a function of the speckle intensity(39). Speckles may appear (speckle birth) fortwo reasons: the intensity of a local maximum
Multi-fluorophorespeckle: fluorescentspeckle withcontributions fromseveral fluorophores
gets brighter because of the association of flu-orescent subunits, or the intensity of the sur-rounding background gets dimmer because ofsubunit dissociation in the neighborhood. Inboth cases a speckle birth is detected whenthe peak-to-background intensity differenceexceeds �Icrit. Analogously, speckles may dis-appear (speckle death) either because of sub-unit dissociation in the location of a speckleor because of subunit association in the neigh-borhood.
Statistical Analysis of SpeckleDynamics
With the classification scheme in Figure 2b,speckles become time-specific, diffraction-limited probes of polymer network turnover.The change in foreground or background in-tensity that causes the birth or death of aspeckle is, on average, proportional to the netnumber of subunits �m added to or removedfrom the PSF volume between two frames.This defined an algorithm for the local mea-surement of network assembly or disassem-bly kinetics (39): (a) calculation of changes inforeground and background intensities. Af-ter detection of a speckle birth/death event,regression lines are fitted to the foregroundand background intensities for one time pointbefore, at, and after the event (Figure 2c).Intensity values before birth and after deathare extrapolated (39). The line fits providetwo estimates af and ab of the slopes of fore-ground and background intensity variation.They also yield the standard deviations σ(af )and σ(ab ) of the slopes, which are derived fromthe residuals of the intensity values to the re-gression line. Noisy data, poorly representedby the regression model, generate large valuesfor σ; intensity values in perfect match withthe model result in small values for σ. (b) Eachof the two slopes is tested for statistical signif-icance. Insignificant intensity changes are dis-carded. (c) If both foreground and backgroundslopes are significant, the one with the highersignificance (lower p-value) is selected as thecause of the event. In the example given in
www.annualreviews.org • Fluorescent Speckle Microscopy 367
Ann
u. R
ev. B
ioph
ys. B
iom
ol. S
truc
t. 20
06.3
5:36
1-38
7. D
ownl
oade
d fr
om a
rjou
rnal
s.an
nual
revi
ews.
org
by C
lare
Wat
erm
an-S
tore
r on
06/
01/0
6. F
or p
erso
nal u
se o
nly.

ANRV275-BB35-16 ARI 4 April 2006 20:11
Figure 2c the foreground slope has the highersignificance. The magnitude of the more sig-nificant slope is recorded as the score of thebirth/death event. If neither foreground norbackground slope is statistically significant, noscore is generated.
Score values represent instantiations ofa random variable with an expectation valueμ = α�m · f and variance σ 2 = α2�m2 ·f (1 − f ), where α denotes the unknownintensity of one fluorophore. In addition,the scores are perturbed by noise. However,
assuming that the net rate �m remains con-stant for a small probing window, the intrinsicscore variation and noise are approximatelyeliminated by averaging all scores falling intothe window. The choice of the window sizedepends on the density of significant scoresand the user’s preference for spatial or tem-poral resolution. The larger the number ofscores averaged by time integration, the lessspatial averaging is required, and vice versa.
Figure 2d displays rates of actin assem-bly (red) and disassembly (green) of the actin
368 Danuser ·Waterman-Storer
Ann
u. R
ev. B
ioph
ys. B
iom
ol. S
truc
t. 20
06.3
5:36
1-38
7. D
ownl
oade
d fr
om a
rjou
rnal
s.an
nual
revi
ews.
org
by C
lare
Wat
erm
an-S
tore
r on
06/
01/0
6. F
or p
erso
nal u
se o
nly.

ANRV275-BB35-16 ARI 4 April 2006 20:11
network at the edge of an epithelial cell. Here,score values were averaged over 10 min, re-flecting the steady-state turnover. Animatedmaps resolved at 10-s intervals are providedas online supplementary material (movies M1and M2; follow the Supplemental Materiallink from the Annual Reviews home pageat http://www.annualreviews.org). The twosmaller panels indicate the rate distributionscalculated from scores extracted from specklebirths due to monomer association and fromspeckle deaths due to monomer dissociationonly (Figure 2d-i), and from births due tomonomer dissociation and from deaths dueto monomer association only (Figure 2d-ii).Both panels display the same distribution ofloci of strong assembly (for example, thecell edge) and disassembly but at differentevent densities. Figure 2d-i corresponds tothe naı̈ve interpretation of speckle appear-ance and disappearance. These events con-tribute ∼70% of all scores. The other ∼30%of significant scores is related to the coun-terintuitive cases of speckle birth and death.Neglecting them would significantly reducethe sample size. How many intuitive versuscounterintuitive cases occur depends on thefraction of labeled monomers. The lower the
Single-fluorophorespeckle: fluorescentspeckle that consistsof an isolatedfluorophoregenerating adetectable signalabove backgroundaccording to thedefinition of afluorescent speckle
fraction, the fewer counterintuitive cases ob-served, with a lower boundary defined by thesingle-fluorophore speckle regime, in whichall speckle appearances are due to monomerassociation and all disappearances are due tomonomer dissociation.
The processing of only short time inter-vals around speckle births and deaths focusesthe analysis on image events that are morelikely to have originated from monomer ex-change rather than from intensity fluctua-tions due to image noise, bleaching, and in-and out-of-focus speckle motion. In addition,the algorithm rejects ∼60% of all specklebirth and death events as insignificant (36),i.e., these events are not classifiable as in-duced by monomer exchange with the cer-tainty the user chooses as the confidence levelfor the analysis. Bleaching affects all specklescores and thus can be corrected on the basisof global drifts in the image signal (39). Wealso showed that, with a NA = 1.4 objectivelens, focus drifts smaller than 100 nm overthree frames (e.g., 30 nm per 1–5 s) have noeffect on the mapping of network turnover.Thus, the statistical model described in thissection provides a robust method for calcu-lating spatiotemporal maps of assembly and
←−−−−−−−−−−−−−−−−−−−−−−−−−−−−−−−−−−−−−−−−−−−−−−−−−−−−−−−−−−−−−−−−−−−−−Figure 2Relationship between speckle appearance (birth) and disappearance (death) and the turnover in theunderlying macromolecular assembly. (a) Simulated speckle density in an actin filament networkassembling for 120 s and disassembling for 360 s. Inset: Mean intensity indicating the overall change inbound fluorophore over time. (b) Classification of speckle birth and death due to monomer associationand dissociation with the network. A speckle appears when the difference between foreground (pink line)and background (light blue line) is greater than a threshold �IC , which is a function of the camera noiseand the shot noise of the signal (39). (c) Measurement of intensity changes in foreground (solid pink line)and background (solid light blue line) during a speckle birth. The entire lifetime of the speckle is shown(40 s). Dash-dotted gray line: Mean between foreground and background; error bars: �IC computed inevery time point. Birth and death are defined as the time points at which the intensity difference exceeds�IC for the first and the last time. Red line: Regression line to the foreground intensity values before, at,and after birth. Blue dotted line: Regression line to the background intensity values. The cause of specklebirth is inferred by statistical classification of the two slopes and their standard deviations (see text). Thestatistically more dominant of the two slopes, if also significant relative to image noise, defines the scoreof the event (foreground slope in the example given). (d ) Averaging of scores accumulated over a definedtime window of a FSM time-lapse sequence yields maps of net polymerization (red ) anddepolymerization ( green). Scores from birth due to association and death due to dissociation (d-i) or frombirth due to dissociation and death due to association (d-ii) reveal the same distribution of polymerizationand depolymerization. Figure in parts reproduced from (39) and from (37) with permission of BiophysicalJournal and Science.
www.annualreviews.org • Fluorescent Speckle Microscopy 369
Ann
u. R
ev. B
ioph
ys. B
iom
ol. S
truc
t. 20
06.3
5:36
1-38
7. D
ownl
oade
d fr
om a
rjou
rnal
s.an
nual
revi
ews.
org
by C
lare
Wat
erm
an-S
tore
r on
06/
01/0
6. F
or p
erso
nal u
se o
nly.

ANRV275-BB35-16 ARI 4 April 2006 20:11
TIRFM: totalinternal reflectionfluorescencemicroscopy
disassembly of macromolecular structuressuch as F-actin networks.
Single-Fluorophore VersusMulti-Fluorophore Speckles
It seems that, in many aspects, FSM wouldbe most powerful if implemented as a single-molecule imaging method, where speckle ap-pearances and disappearances unambiguouslysignal association and dissociation of fluores-cent subunits to the platform (55). However,the much simpler signal analysis is counter-weighed by several disadvantages not encoun-tered when using multi-fluorophore speckles.First, establishing that an image contains onlysingle-fluorophore speckles can be challeng-ing, especially when the signal of one flu-orophore is close to the noise floor of theimaging system. Our experience with single-fluorophore speckles suggests that, particu-larly in three-dimensional structures, a largefraction of speckles has residual contributionsof at least one other fluorophore. Those mix-tures need to be deconvolved or eliminatedfrom the statistics. Second, the imaging ofsingle-fluorophore speckles is much more de-manding than multi-fluorophore FSM andrequires longer camera exposures to cap-ture the very dim signals, reducing thetemporal resolution. Third, in addition tothe substantially lower temporal resolution,single-fluorophore FSM offers lower spa-tial resolution because the density of speck-les drops significantly with the extremelylow labeling ratio. Fourth, multi-fluorophorespeckles distinguish between fast and slowturnover, whereas single-fluorophore speck-les deliver on/off information only. To mea-sure rates, single-fluorophore speckle analysismust also rely on spatial and temporal averag-ing, which further decreases the resolution.Watanabe and Mitchison (55) used single-fluorophore speckle analysis to probe actinnetwork turnover in migrating cells with ret-rograde flow, where most speckles form at thecell edge, move, and then disappear at a dis-tinct site. It remains an open question whether
single-fluorophore speckles can characterizethe dynamic equilibrium of a spatially station-ary or slowly moving network where polymer-ization and depolymerization coexist over dis-tances less than 1 μm, as achieved by multi-fluorophore speckle analysis (38, 39). It is alsounclear whether single-fluorophore speckleanalysis has sufficient temporal resolution toextract the short-term components of thedynamic equilibrium.
REQUIREMENTS FOR SPECKLEIMAGING
Time-lapse FSM requires imaging high-resolution diffraction-limited regions con-taining 1 to 10 fluorophores and inhibitingfluorescence photobleaching. This requires asensitive imaging system with little extrane-ous background fluorescence, efficient lightcollection, a camera with low noise, highquantum efficiency, high dynamic range, highresolution, and suppression of fluorescencephotobleaching with illumination shuttersand/or oxygen scavengers (30, 58, 64). In addi-tion, all fluorescently labeled molecules mustbe functionally competent to bind their plat-form; otherwise they will contribute to dif-fusible background and obfuscate the specklecontrast (56). We refer the reader to Gupton& Waterman-Storer (17) for a recent in-depthdiscussion of the hardware requirements forobtaining FSM images.
Because FSM is achieved by the level offluorescent protein in the sample, it is adapt-able to various modes of high-resolution flu-orescence microscopy, such that the specificadvantages of each mode can be exploitedin combination with the quantitative capa-bilities of FSM. For example, we have per-formed FSM on both spinning-disk confocalmicroscope (2) and total internal reflectionfluorescence microscope (TIRFM) systems(1) to gain speckle data in two spectralchannels with the specific image advantagesof confocal and TIRFM. However, to dateFSM has proved incompatible with all com-mercial laser-scanning confocal microscope
370 Danuser ·Waterman-Storer
Ann
u. R
ev. B
ioph
ys. B
iom
ol. S
truc
t. 20
06.3
5:36
1-38
7. D
ownl
oade
d fr
om a
rjou
rnal
s.an
nual
revi
ews.
org
by C
lare
Wat
erm
an-S
tore
r on
06/
01/0
6. F
or p
erso
nal u
se o
nly.

ANRV275-BB35-16 ARI 4 April 2006 20:11
Figure 3Comparison of X-rhodamine actin FSM images of the edge of migrating Ptk1 epithelial cells using (a)wide-field epifluorescence, (b) spinning-disk confocal microscopy, and (c) total internal reflectionfluorescence microscopy. Panels a and b were acquired using a Nikon 100× 1.4 NA Plan Apo phasecontrast objective lens and a 14 bit Hamamatsu Orca II camera with 6.7 micron pixels. Panel c wasacquired with a Nikon 100× 1.45 NA Plan Apo TIRF objective lens and a 14 bit Hamamatsu Orca II ERwith 6.4 micron pixels. Note that speckle contrast and the ability to detect speckles in more central cellregions increases from panels a to c. Note, however, in the TIRF image that speckles are very bright a fewmicrons back from the edge, likely where the cell is in closer contact with the substrate.
systems available. This is because these instru-ments use photomultipliers as detectors thatare noisy and have a limited dynamic rangecompared with the low-noise, high dynamicrange CCDs used with spinning-disk confo-cal microscope systems. A comparison of FSMimages of the actin cytoskeleton in migratingepithelial cells acquired by wide-field epifluo-rescence, spinning-disk confocal microscope,and TIRFM is shown in Figure 3. Clearly,speckle contrast is improved by reducing out-of-focus fluorescence with either of the lasttechniques. Contrast in TIRFM images is fur-ther improved over the spinning-disk confo-cal image because the evanescent field exci-tation depth is reduced to ∼50 nm into thespecimen. We quantified the effect of the re-duced effective imaging volume on modula-tion and detectability of actin and FA speck-les in wide-field epifluorescence and TIRFM.Our analysis showed that TIR-FSM indeedaffords major improvements in these parame-ters over wide-field epifluorescence for imag-ing macromolecular assemblies at the ventralsurface of living cells, both in thin peripheraland thick central cell regions (1).
TIR-FSM: totalinternal reflectionfluorescent specklemicroscopy
ANALYSIS OF SPECKLEMOVEMENTS
Tracking Speckle Flow: Early andRecent Developments
In addition to revealing the kinetics of as-sociation and dissociation of subunits withina molecular platform, speckles show themovement of the platform. This is evi-dent from raw FSM movies provided asonline supplementary material (movies M3and M4; follow the Supplemental Materiallink from the Annual Reviews home pageat http://www.annualreviews.org). The firstexample shows a speckled actin network,where speckle motion indicates the retrogradeflow of the cytoskeleton polymer away fromthe cell edge. The second example displaysspeckled microtubules in a meiotic spindlefrom a Xenopus laevis extract. Here, specklesindicate antiparallel, poleward flux of tubu-lin subunits in the interdigitating microtubulescaffolds of the two half-spindles.
In early applications of FSM, specklemotion was quantified by hand tracking afew speckles, a tedious, error-prone, and
www.annualreviews.org • Fluorescent Speckle Microscopy 371
Ann
u. R
ev. B
ioph
ys. B
iom
ol. S
truc
t. 20
06.3
5:36
1-38
7. D
ownl
oade
d fr
om a
rjou
rnal
s.an
nual
revi
ews.
org
by C
lare
Wat
erm
an-S
tore
r on
06/
01/0
6. F
or p
erso
nal u
se o
nly.

ANRV275-BB35-16 ARI 4 April 2006 20:11
incomplete way of analyzing the wealth of in-formation contained by these images (41, 43,55). Alternatively, kymographs provided aver-age estimates of speckle velocities (6, 13, 19,24, 27, 28, 58, 63, 65).
Initial attempts to automate the extrac-tion of more complete speckle flow mapsfrom FSM time-lapse sequences of actin net-works relied on correlation-based tracking.The speckled area of a source frame in themovie was divided into small probing win-dows. Each window was displaced until thenormalized cross-correlation of the windowwith the signal of the target frame, i.e., thenext frame in the movie, was maximized. Thisapproach reported the average motion of allthe speckles falling into the window. Thewindow size pitted robustness in correlationagainst spatial resolution. The larger the win-dow, the more unique was the speckle patternto be recognized in the target frame. On theother hand, larger windows increased the av-eraging of distinct speckle motions within thewindow.
Underlying the method of cross-corre-lation tracking is the assumption that the sig-nal of a probing window, although translo-cated in space, does not change betweensource and target frame. In practice, this as-sumption is always violated because of noise.But, the cross-correlation of two image sig-nals appears to be tolerant toward spatiallyuncorrelated noise, making it a prime ob-jective function in computer vision tracking(21, 29, 67). The many speckle appearancesand disappearances in F-actin networks, how-ever, introduce signal perturbations that can-not be tackled by the cross-correlation func-tion (49). Instead, we developed a particle flowmethod, in which each speckle was probedseparately (49). Speckles were linked betweenframes by nearest-neighbor assignment in adistance graph, in which conflicts betweensource speckles competing for the same targetspeckle were resolved by global optimization(3). Extension of the graph to three frames al-lowed speckle assignments to be constrainedin smooth and unidirectional trajectories, so
that speckles moving in antiparallel flow fieldscould be tracked (49).
Surprisingly, cross-correlation-basedtracking was successful in measuring averagetubulin flux in mitotic spindles (32). Sim-ulated time-lapse sequences demonstratedthat if a significant subpopulation of specklesin the probing window moves jointly, thecoherent component of the flow can beestimated even when the rest of the specklesmove randomly or, as in the case of themitotic spindle, a smaller population movescoherently in opposite direction. However,the tracking result will be ambiguous ifthe window contains multiple, coherentlymoving speckle subpopulations of equal size.Miyamoto et al. (32) carefully chose windowsin the central region of a half-spindle, wherethe motion of speckles toward the nearer ofthe two poles dominated speckle motion inthe opposite direction and random compo-nents. The approach was aided further byseveral features of the spindle system: Tubulinflux in a spindle is quasi-stationary; speckleappearances and disappearances are concen-trated at the spindle midzone and in the poleregions, both of which were excluded fromthe probing window; and the flow fields wereapproximately parallel inside the probingwindow.
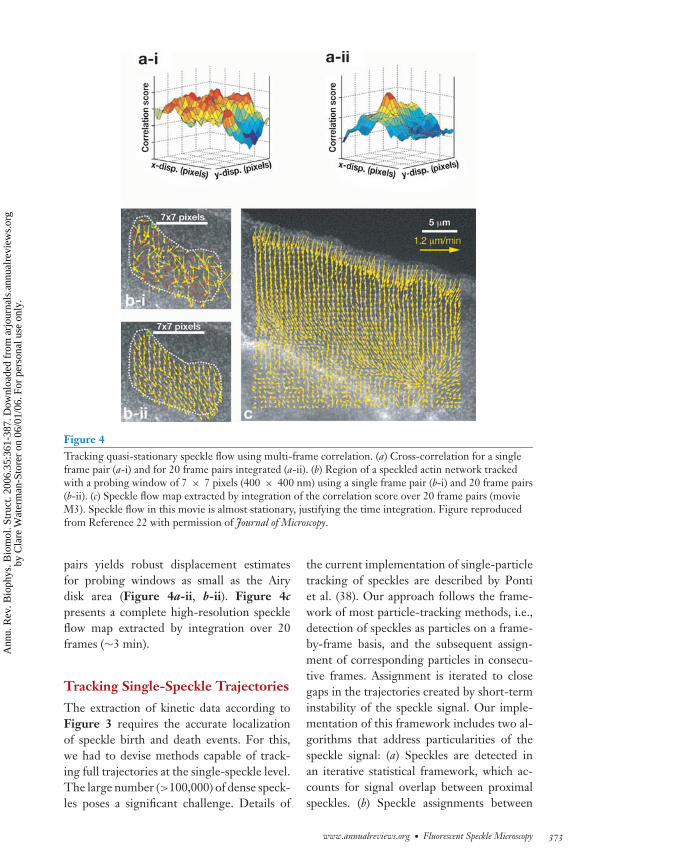
Encouraged by these results, we returnedto cross-correlation tracking of speckle flowalso in F-actin networks (22). The advan-tage of cross-correlation tracking over particleflow tracking is that there is no requirementto detect the same speckle in at least two con-secutive frames. Hence, speckle flows can betracked in movies with high noise levels andweak speckle contrast (22). To avoid tradingcorrelation stability for spatial resolution, wecapitalized on the fact that actin cytoskeletontransport is often stationary on the timescaleof minutes. Thus, although the correlation ofa single pair of probing windows in sourceand target frames is ambiguous (Figure 4a-i),rendering the tracking of speckle flow im-possible (Figure 4b-i), time integration ofthe correlation function over multiple frame
372 Danuser ·Waterman-Storer
Ann
u. R
ev. B
ioph
ys. B
iom
ol. S
truc
t. 20
06.3
5:36
1-38
7. D
ownl
oade
d fr
om a
rjou
rnal
s.an
nual
revi
ews.
org
by C
lare
Wat
erm
an-S
tore
r on
06/
01/0
6. F
or p
erso
nal u
se o
nly.
ANRV275-BB35-16 ARI 4 April 2006 20:11
Figure 4Tracking quasi-stationary speckle flow using multi-frame correlation. (a) Cross-correlation for a singleframe pair (a-i) and for 20 frame pairs integrated (a-ii). (b) Region of a speckled actin network trackedwith a probing window of 7 × 7 pixels (400 × 400 nm) using a single frame pair (b-i) and 20 frame pairs(b-ii). (c) Speckle flow map extracted by integration of the correlation score over 20 frame pairs (movieM3). Speckle flow in this movie is almost stationary, justifying the time integration. Figure reproducedfrom Reference 22 with permission of Journal of Microscopy.
pairs yields robust displacement estimatesfor probing windows as small as the Airydisk area (Figure 4a-ii, b-ii). Figure 4c
presents a complete high-resolution speckleflow map extracted by integration over 20frames (∼3 min).
Tracking Single-Speckle Trajectories
The extraction of kinetic data according toFigure 3 requires the accurate localizationof speckle birth and death events. For this,we had to devise methods capable of track-ing full trajectories at the single-speckle level.The large number (>100,000) of dense speck-les poses a significant challenge. Details of
the current implementation of single-particletracking of speckles are described by Pontiet al. (38). Our approach follows the frame-work of most particle-tracking methods, i.e.,detection of speckles as particles on a frame-by-frame basis, and the subsequent assign-ment of corresponding particles in consecu-tive frames. Assignment is iterated to closegaps in the trajectories created by short-terminstability of the speckle signal. Our imple-mentation of this framework includes two al-gorithms that address particularities of thespeckle signal: (a) Speckles are detected inan iterative statistical framework, which ac-counts for signal overlap between proximalspeckles. (b) Speckle assignments between
www.annualreviews.org • Fluorescent Speckle Microscopy 373
Ann
u. R
ev. B
ioph
ys. B
iom
ol. S
truc
t. 20
06.3
5:36
1-38
7. D
ownl
oade
d fr
om a
rjou
rnal
s.an
nual
revi
ews.
org
by C
lare
Wat
erm
an-S
tore
r on
06/
01/0
6. F
or p
erso
nal u
se o
nly.
ANRV275-BB35-16 ARI 4 April 2006 20:11
consecutive frames are executed in a hy-brid approach combining speckle flow andsingle-speckle tracking. Speckle flow fieldsare extracted iteratively from previous solu-tions of single-speckle trajectories and em-ployed to propagate speckle motion betweenframes prior to establishing the correspon-dence between thousands of speckle pairsby an efficient numerical implementation ofa global nearest-neighbor assignment (4, 8).The very first speckle flow field is obtained bycorrelation-based tracking (22).
Motion propagation allows us to cope withtwo problems of FSM data. First, in manycases the magnitude of speckle displacementsbetween two frames significantly exceeds halfthe distance between speckles. Hence, no so-lution to the correspondence problem existswithout prediction of future speckle locations.Second, speckles undergo sharp spatial gradi-ents in speed and direction of motion. A globalpropagation scheme discarding regional vari-ations will thus fail, whereas an iterative ex-traction of the flow field permits a gradu-ally refined trajectory reconstruction in theseareas.
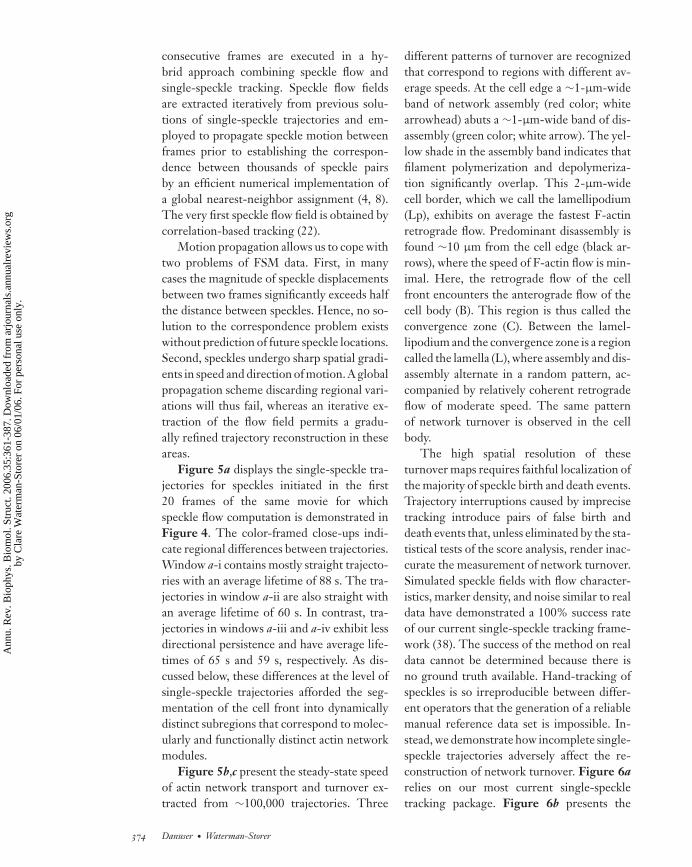
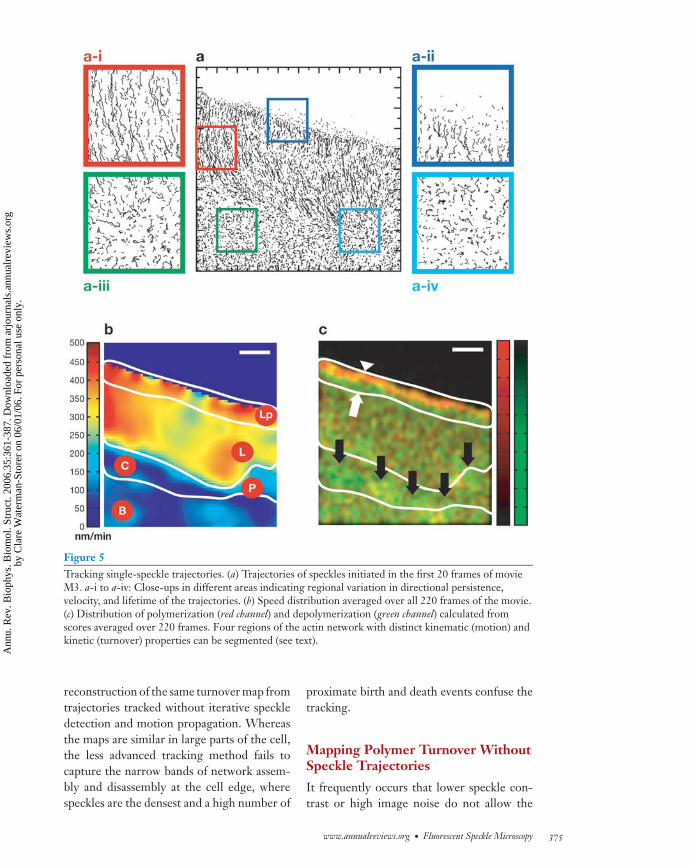
Figure 5a displays the single-speckle tra-jectories for speckles initiated in the first20 frames of the same movie for whichspeckle flow computation is demonstrated inFigure 4. The color-framed close-ups indi-cate regional differences between trajectories.Window a-i contains mostly straight trajecto-ries with an average lifetime of 88 s. The tra-jectories in window a-ii are also straight withan average lifetime of 60 s. In contrast, tra-jectories in windows a-iii and a-iv exhibit lessdirectional persistence and have average life-times of 65 s and 59 s, respectively. As dis-cussed below, these differences at the level ofsingle-speckle trajectories afforded the seg-mentation of the cell front into dynamicallydistinct subregions that correspond to molec-ularly and functionally distinct actin networkmodules.
Figure 5b,c present the steady-state speedof actin network transport and turnover ex-tracted from ∼100,000 trajectories. Three
different patterns of turnover are recognizedthat correspond to regions with different av-erage speeds. At the cell edge a ∼1-μm-wideband of network assembly (red color; whitearrowhead) abuts a ∼1-μm-wide band of dis-assembly (green color; white arrow). The yel-low shade in the assembly band indicates thatfilament polymerization and depolymeriza-tion significantly overlap. This 2-μm-widecell border, which we call the lamellipodium(Lp), exhibits on average the fastest F-actinretrograde flow. Predominant disassembly isfound ∼10 μm from the cell edge (black ar-rows), where the speed of F-actin flow is min-imal. Here, the retrograde flow of the cellfront encounters the anterograde flow of thecell body (B). This region is thus called theconvergence zone (C). Between the lamel-lipodium and the convergence zone is a regioncalled the lamella (L), where assembly and dis-assembly alternate in a random pattern, ac-companied by relatively coherent retrogradeflow of moderate speed. The same patternof network turnover is observed in the cellbody.
The high spatial resolution of theseturnover maps requires faithful localization ofthe majority of speckle birth and death events.Trajectory interruptions caused by imprecisetracking introduce pairs of false birth anddeath events that, unless eliminated by the sta-tistical tests of the score analysis, render inac-curate the measurement of network turnover.Simulated speckle fields with flow character-istics, marker density, and noise similar to realdata have demonstrated a 100% success rateof our current single-speckle tracking frame-work (38). The success of the method on realdata cannot be determined because there isno ground truth available. Hand-tracking ofspeckles is so irreproducible between differ-ent operators that the generation of a reliablemanual reference data set is impossible. In-stead, we demonstrate how incomplete single-speckle trajectories adversely affect the re-construction of network turnover. Figure 6a
relies on our most current single-speckletracking package. Figure 6b presents the
374 Danuser ·Waterman-Storer
Ann
u. R
ev. B
ioph
ys. B
iom
ol. S
truc
t. 20
06.3
5:36
1-38
7. D
ownl
oade
d fr
om a
rjou
rnal
s.an
nual
revi
ews.
org
by C
lare
Wat
erm
an-S
tore
r on
06/
01/0
6. F
or p
erso
nal u
se o
nly.
ANRV275-BB35-16 ARI 4 April 2006 20:11
Figure 5Tracking single-speckle trajectories. (a) Trajectories of speckles initiated in the first 20 frames of movieM3. a-i to a-iv: Close-ups in different areas indicating regional variation in directional persistence,velocity, and lifetime of the trajectories. (b) Speed distribution averaged over all 220 frames of the movie.(c) Distribution of polymerization (red channel) and depolymerization (green channel) calculated fromscores averaged over 220 frames. Four regions of the actin network with distinct kinematic (motion) andkinetic (turnover) properties can be segmented (see text).
reconstruction of the same turnover map fromtrajectories tracked without iterative speckledetection and motion propagation. Whereasthe maps are similar in large parts of the cell,the less advanced tracking method fails tocapture the narrow bands of network assem-bly and disassembly at the cell edge, wherespeckles are the densest and a high number of
proximate birth and death events confuse thetracking.
Mapping Polymer Turnover WithoutSpeckle Trajectories
It frequently occurs that lower speckle con-trast or high image noise do not allow the
www.annualreviews.org • Fluorescent Speckle Microscopy 375
Ann
u. R
ev. B
ioph
ys. B
iom
ol. S
truc
t. 20
06.3
5:36
1-38
7. D
ownl
oade
d fr
om a
rjou
rnal
s.an
nual
revi
ews.
org
by C
lare
Wat
erm
an-S
tore
r on
06/
01/0
6. F
or p
erso
nal u
se o
nly.

ANRV275-BB35-16 ARI 4 April 2006 20:11
Figure 6Reconstruction of actin network turnover from trajectories with different tracking quality. (a) Applicationof the model in Figure 2 to birth and death events determined by the currently most advancedsingle-speckle tracking method available in our software package. (b) Result obtained with a morestandard single-particle tracking method that does not include iterative detection of overlapping specklesand motion propagation (see text). Figure reproduced from Reference 22 with permission of Journal ofMicroscopy.
precise identification of single-speckle trajec-tory endpoints. However, the trackable sub-sections of the trajectories are usually suffi-cient to extract the overall structure of speckleflow. In this case an alternative scheme rely-ing on the continuity of the optical densityof the speckle field permits the mapping ofturnover at lower resolution (48). Shown inFigure 7, this method reveals a qualitativelysimilar organization of actin network assem-bly and disassembly, but essential features ofthe turnover patterns that allowed a clear dis-tinction of different regions in Figure 5c, aswell as the spatial coexistence of polymeriza-tion and depolymerization at the cell edge, arelost with this coarser analysis.
APPLICATIONS OF FSM FORSTUDYING PROTEINDYNAMICS IN VITRO ANDIN VIVO
Applications of FSM have thus far focusedmostly on the study of actin and micro-tubule cytoskeleton systems, but other sys-
Figure 7Reconstruction of actin network turnover fromspeckle flow (Figure 4c) without explicitidentification of speckle births and deaths (seetext). A spatial organization similar to that inFigure 5c is mapped; however, essential details inthe fine structure of the network turnover are lost.Figure reproduced from Reference 48 withpermission of Proceedings of the National Academy ofSciences, USA.
tems have been analyzed with it as well.A summary of the FSM literature can befound in Table S1, which reviews the major
376 Danuser ·Waterman-Storer
Ann
u. R
ev. B
ioph
ys. B
iom
ol. S
truc
t. 20
06.3
5:36
1-38
7. D
ownl
oade
d fr
om a
rjou
rnal
s.an
nual
revi
ews.
org
by C
lare
Wat
erm
an-S
tore
r on
06/
01/0
6. F
or p
erso
nal u
se o
nly.

ANRV275-BB35-16 ARI 4 April 2006 20:11
biological findings and highlights technicaladvances in FSM that have been made in thesestudies. Most of the FSM data analysis hasbeen limited to kymograph measurements ofaverage speckle flow (see above) and to man-ual tracking of a few hundred speckles to ex-tract lifetime information (55) and selectedtrajectories of cytoskeleton structures (19, 41,43). To our knowledge, in addition to thosementioned in the previous section, few effortshave been made outside our labs to system-atically exploit the full spatiotemporal infor-mation offered by FSM about transport andturnover in molecular assemblies. The mostcomplete quantitative FSM (qFSM) analyseshave so far been performed on F-actin cy-toskeleton dynamics in migrating epithelialcells. In the following section we summarizesome of the most relevant results of these stud-ies to showcase the technical possibilities ofqFSM.
SELECTED RESULTS FROM THESTUDY OF ACTIN INEPITHELIAL CELL MIGRATION
Organization of Actin Cytoskeletonin Four Kinematically and KineticallyDistinct Regions
Figures 4 and 5 indicate the steady-state or-ganization of the F-actin cytoskeleton in fourkinematically and kinetically distinct zones:(a) the lamellipodium, characterized by fastretrograde flow and two narrow bands of as-sembly and disassembly resulting from thefast treadmilling of actin between its poly-meric and monomeric states (34, 35); (b) thelamella, characterized by reduced retrogradeflow and assembly and disassembly in ran-dom punctate patterns; (c) the cell body, char-acterized by anterograde flow and turnoverpatterns similar to those of the lamella; and(d) the convergence zone, where the flows ofthe lamella and cell body meet and wherestrong depolymerization suggests that thelamella and cell body are materially separatestructures.
Quantitativefluorescent specklemicroscopy(qFSM):combination of FSMwith statisticalanalysis of thespeckle signal usingspecialized qFSMsoftware
qFSM also delivers nonsteady-state mea-surements of flow and turnover, revealing dis-tinct variations in the periodicity of turnoverbetween these regions (38). In combinationwith pharmacological perturbation, qFSMwas used to dissect the mechanisms of ret-rograde flow. We found that lamellipodiumflow is independent of myosin motor con-traction, whereas lamella flow is blocked byspecific inhibition of myosin II activity (37).Also, the lamellipodium and the lamella ex-hibited different sensitivity to disruption offilament assembly, disassembly, and severing,suggesting that the regional differences couldbe associated with differential molecular reg-ulation (37). This hypothesis has thus far beenconfirmed by immunostaining studies (18,37) and by expression of constitutively activeand dominant negative constructs of regula-tory proteins (18; M. Machacek, V. Delorme,G. M. Bokoch, C. M. Waterman-Storer &G. Danuser, unpublished data). Here, qFSMprovides a critical insight into cytoskeletondynamic responses to shifted activation ofregulatory factors. In summary, these datademonstrate how qFSM can be used to quan-titate spatiotemporal modulations of the ki-netics and kinematics of molecular assembliesand to identify dynamically distinct structuralmodules even when they are composed of thesame base protein.
Correlation of Actin Assembly with aGFP-p34 Signal Indicates DifferentFunction of the Arp2/3 Complex inLamellipodium and Lamella
Immunolocalization experiments showed thatthe lamellipodium is enriched in Arp2/3, aprotein complex thought to activate networkpolymerization by nucleating new filamentsoff preexisting filaments, and in ADF/cofilin,which promotes filament severing and de-polymerization (18, 37). Together, these pro-teins have been described as mediators of actintreadmilling in the lamellipodium (35). How-ever, Arp2/3 stain was also present in punc-tate patterns in the lamella. We therefore
www.annualreviews.org • Fluorescent Speckle Microscopy 377
Ann
u. R
ev. B
ioph
ys. B
iom
ol. S
truc
t. 20
06.3
5:36
1-38
7. D
ownl
oade
d fr
om a
rjou
rnal
s.an
nual
revi
ews.
org
by C
lare
Wat
erm
an-S
tore
r on
06/
01/0
6. F
or p
erso
nal u
se o
nly.
ANRV275-BB35-16 ARI 4 April 2006 20:11
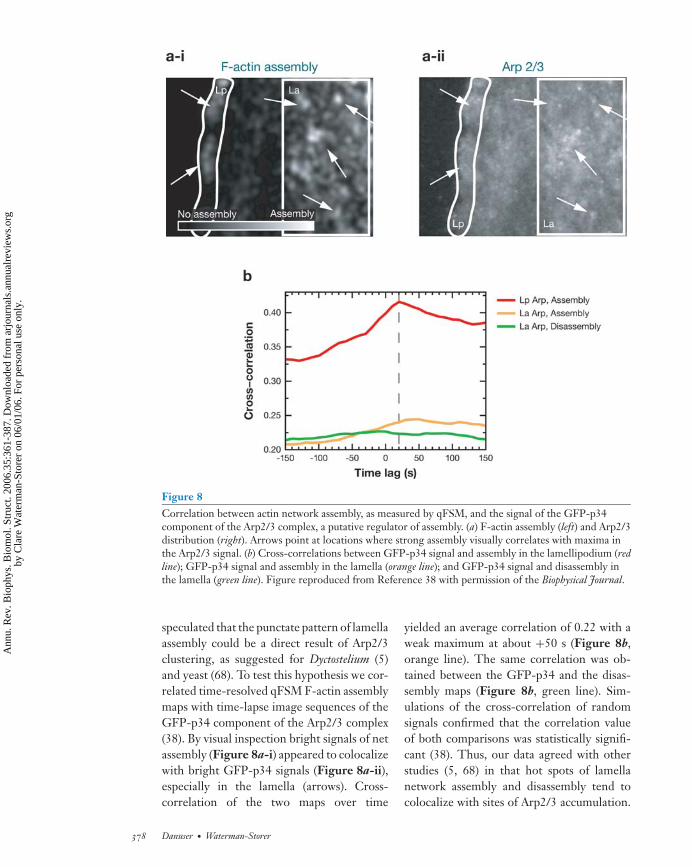
Figure 8Correlation between actin network assembly, as measured by qFSM, and the signal of the GFP-p34component of the Arp2/3 complex, a putative regulator of assembly. (a) F-actin assembly (left) and Arp2/3distribution (right). Arrows point at locations where strong assembly visually correlates with maxima inthe Arp2/3 signal. (b) Cross-correlations between GFP-p34 signal and assembly in the lamellipodium (redline); GFP-p34 signal and assembly in the lamella (orange line); and GFP-p34 signal and disassembly inthe lamella (green line). Figure reproduced from Reference 38 with permission of the Biophysical Journal.
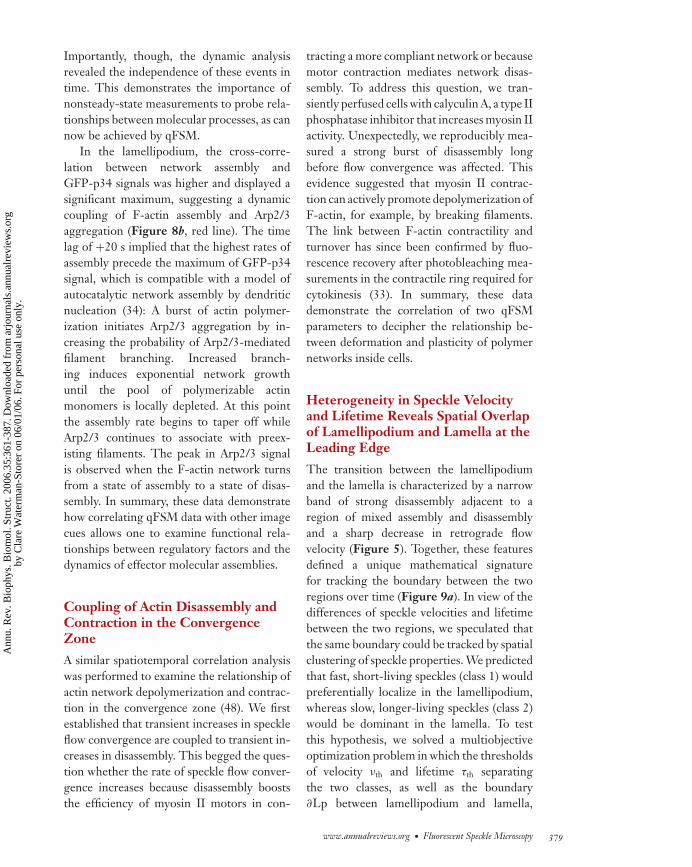
speculated that the punctate pattern of lamellaassembly could be a direct result of Arp2/3clustering, as suggested for Dyctostelium (5)and yeast (68). To test this hypothesis we cor-related time-resolved qFSM F-actin assemblymaps with time-lapse image sequences of theGFP-p34 component of the Arp2/3 complex(38). By visual inspection bright signals of netassembly (Figure 8a-i) appeared to colocalizewith bright GFP-p34 signals (Figure 8a-ii),especially in the lamella (arrows). Cross-correlation of the two maps over time
yielded an average correlation of 0.22 with aweak maximum at about +50 s (Figure 8b,orange line). The same correlation was ob-tained between the GFP-p34 and the disas-sembly maps (Figure 8b, green line). Sim-ulations of the cross-correlation of randomsignals confirmed that the correlation valueof both comparisons was statistically signifi-cant (38). Thus, our data agreed with otherstudies (5, 68) in that hot spots of lamellanetwork assembly and disassembly tend tocolocalize with sites of Arp2/3 accumulation.
378 Danuser ·Waterman-Storer
Ann
u. R
ev. B
ioph
ys. B
iom
ol. S
truc
t. 20
06.3
5:36
1-38
7. D
ownl
oade
d fr
om a
rjou
rnal
s.an
nual
revi
ews.
org
by C
lare
Wat
erm
an-S
tore
r on
06/
01/0
6. F
or p
erso
nal u
se o
nly.
ANRV275-BB35-16 ARI 4 April 2006 20:11
Importantly, though, the dynamic analysisrevealed the independence of these events intime. This demonstrates the importance ofnonsteady-state measurements to probe rela-tionships between molecular processes, as cannow be achieved by qFSM.
In the lamellipodium, the cross-corre-lation between network assembly andGFP-p34 signals was higher and displayed asignificant maximum, suggesting a dynamiccoupling of F-actin assembly and Arp2/3aggregation (Figure 8b, red line). The timelag of +20 s implied that the highest rates ofassembly precede the maximum of GFP-p34signal, which is compatible with a model ofautocatalytic network assembly by dendriticnucleation (34): A burst of actin polymer-ization initiates Arp2/3 aggregation by in-creasing the probability of Arp2/3-mediatedfilament branching. Increased branch-ing induces exponential network growthuntil the pool of polymerizable actinmonomers is locally depleted. At this pointthe assembly rate begins to taper off whileArp2/3 continues to associate with preex-isting filaments. The peak in Arp2/3 signalis observed when the F-actin network turnsfrom a state of assembly to a state of disas-sembly. In summary, these data demonstratehow correlating qFSM data with other imagecues allows one to examine functional rela-tionships between regulatory factors and thedynamics of effector molecular assemblies.
Coupling of Actin Disassembly andContraction in the ConvergenceZone
A similar spatiotemporal correlation analysiswas performed to examine the relationship ofactin network depolymerization and contrac-tion in the convergence zone (48). We firstestablished that transient increases in speckleflow convergence are coupled to transient in-creases in disassembly. This begged the ques-tion whether the rate of speckle flow conver-gence increases because disassembly booststhe efficiency of myosin II motors in con-
tracting a more compliant network or becausemotor contraction mediates network disas-sembly. To address this question, we tran-siently perfused cells with calyculin A, a type IIphosphatase inhibitor that increases myosin IIactivity. Unexpectedly, we reproducibly mea-sured a strong burst of disassembly longbefore flow convergence was affected. Thisevidence suggested that myosin II contrac-tion can actively promote depolymerization ofF-actin, for example, by breaking filaments.The link between F-actin contractility andturnover has since been confirmed by fluo-rescence recovery after photobleaching mea-surements in the contractile ring required forcytokinesis (33). In summary, these datademonstrate the correlation of two qFSMparameters to decipher the relationship be-tween deformation and plasticity of polymernetworks inside cells.
Heterogeneity in Speckle Velocityand Lifetime Reveals Spatial Overlapof Lamellipodium and Lamella at theLeading Edge
The transition between the lamellipodiumand the lamella is characterized by a narrowband of strong disassembly adjacent to aregion of mixed assembly and disassemblyand a sharp decrease in retrograde flowvelocity (Figure 5). Together, these featuresdefined a unique mathematical signaturefor tracking the boundary between the tworegions over time (Figure 9a). In view of thedifferences of speckle velocities and lifetimebetween the two regions, we speculated thatthe same boundary could be tracked by spatialclustering of speckle properties. We predictedthat fast, short-living speckles (class 1) wouldpreferentially localize in the lamellipodium,whereas slow, longer-living speckles (class 2)would be dominant in the lamella. To testthis hypothesis, we solved a multiobjectiveoptimization problem in which the thresholdsof velocity νth and lifetime τth separatingthe two classes, as well as the boundary∂Lp between lamellipodium and lamella,
www.annualreviews.org • Fluorescent Speckle Microscopy 379
Ann
u. R
ev. B
ioph
ys. B
iom
ol. S
truc
t. 20
06.3
5:36
1-38
7. D
ownl
oade
d fr
om a
rjou
rnal
s.an
nual
revi
ews.
org
by C
lare
Wat
erm
an-S
tore
r on
06/
01/0
6. F
or p
erso
nal u
se o
nly.

ANRV275-BB35-16 ARI 4 April 2006 20:11
Figure 9Distinction of two spatially overlapping actin networks based on heterogeneity of single-speckleproperties. (a) Raw FSM image overlaid with the boundary between lamellipodium and lamellacomputed from spatial gradients in actin turnover and flow velocity. Animation of this data is provided inmovie M5 (follow the Supplemental Material link from the Annual Reviews home page athttp://www.annualreviews.org). (b, c) Cluster analysis of speckle lifetime and velocity (see text). (d )Class 1 speckles constitute the rapidly treadmilling lamellipodium. Class 2 speckles constitute the lamellawith a punctate pattern of random actin turnover. Both networks spatially overlap in the first 2 μm fromthe cell edge.
were determined subject to the rule{∂Lp,τth, νth} = max (N1/(N1 + N2) ∈ Lp) &min (N1/(N1 + N2) ∈ La) (Figure 9b).N1 and N2 denote the number of speckles inclasses 1 and 2, respectively. Our predictionwas confirmed in the lamella, where class 1speckles occupied a statistically insignificantfraction. However, class 2 speckles madeup 30% to 40% of the lamellipodium,indicating that in this region speckles withdifferent kinetic and kinematic behavior
colocalize. This information was previouslylost in the averaged analysis of single-speckletrajectories. When mapping the scores ofclass 1 and class 2 speckles separately, wediscovered that class 1 speckles define thebands of polymerization and depolymer-ization characteristic of the lamellipodiumand that class 2 speckles define the punctaof assembly and disassembly characteristicof the lamella, which reaches all the way tothe leading edge. Subsequent experiments
380 Danuser ·Waterman-Storer
Ann
u. R
ev. B
ioph
ys. B
iom
ol. S
truc
t. 20
06.3
5:36
1-38
7. D
ownl
oade
d fr
om a
rjou
rnal
s.an
nual
revi
ews.
org
by C
lare
Wat
erm
an-S
tore
r on
06/
01/0
6. F
or p
erso
nal u
se o
nly.

ANRV275-BB35-16 ARI 4 April 2006 20:11
specifically disrupting actin treadmilling inthe lamellipodium confirmed our findingthat the lamellipodium and lamella formtwo spatially overlapping yet kinetically,kinematically, and molecularly different actinnetworks (18, 37).
In summary, these data exemplify thatqFSM analysis has come to the level at whichsingle-speckle properties can be exploited toprobe the heterogeneity of molecular assem-blies in space and time.
NEW APPLICATIONS OF FSM
Two-Speckle Microrheology ProbesViscoelastic Properties of ActinNetworks
Speckle trajectories probe different dynamicphenomena at different spatial and tempo-ral scales. So far we have exploited the long-range, directed components of trajectories toextract the flow and deformation of F-actinnetworks induced by molecular forces coor-dinated over several microns, e.g., the activ-ity of a large number of myosin II motorsin the convergence zone. On a shorter spa-tiotemporal scale, speckle trajectories containcomponents associated with microscopic de-formations of the network that are inducedby less coordinated local contractions of small
−−−−−−−−−−−−−−−−−−−−−−−−−−−−−−−−−→Figure 10Two-speckle microrheology of F-actin networkstiffness inside cells. (a) Correlation of randommotion of two speckles as a function of theirdistance r. The curves follow a 1/r decay (seeinset), as is predicted for a viscoelastic medium.(b) Spatial mapping of correlation values. Thecorrelation landscape has a smooth spatialvariation at length scales much longer than thesize of one probing window. This suggests thatregional heterogeneity is not due to noise.(c) Correlation as a function of the time lag overwhich speckle displacements are determined. Thelinearity of the curve indicates that the correlationis dominated by diffusive motion, which permitsdirect conversion of the correlation values intoparameters describing the viscoelasticity of F-actinnetworks.
myosin patches (50) and thermal forces. Also,positional fluctuations of speckles relate tothe sliding of decoupled filaments, filamentbending inside the network, and photomet-ric shifts of the speckle centroids inducedby local fluorophore exchange. These fluc-tuations occur at a length scale shorter thanthe mesh size of the network and/or are
www.annualreviews.org • Fluorescent Speckle Microscopy 381
Ann
u. R
ev. B
ioph
ys. B
iom
ol. S
truc
t. 20
06.3
5:36
1-38
7. D
ownl
oade
d fr
om a
rjou
rnal
s.an
nual
revi
ews.
org
by C
lare
Wat
erm
an-S
tore
r on
06/
01/0
6. F
or p
erso
nal u
se o
nly.

ANRV275-BB35-16 ARI 4 April 2006 20:11
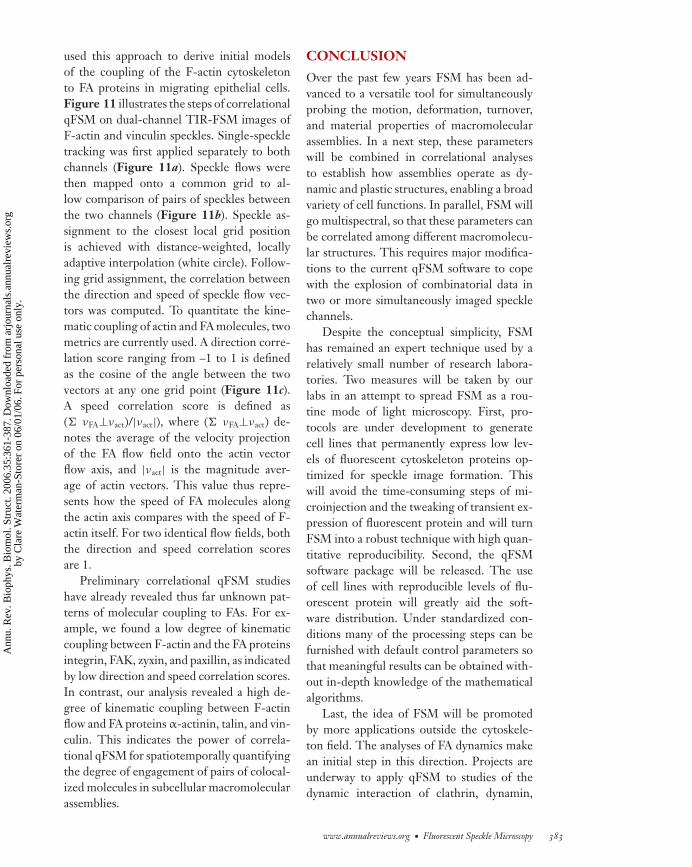
Figure 11Correlative, multispectral qFSM analysis of F-actin and vinculin. (a–c)Processing steps in the measurement of the coupling of F-actin (redvectors) and vinculin (green vectors) flows, overlaid to the raw speckle imageof vinculin (see text for further discussion). Blue (actin) and yellow(vinculin) vectors in panel c indicate a region where the two molecules aredirectionally decoupled. Scale bar: 5 μm.
independent between speckles. When calcu-lating the cross-correlation of trajectories oftwo speckles separated by a distance greaterthan the mesh size of the network, thesefluctuations cancel out. However, even after
directional components are eliminated, thecross-correlation between two-speckle trajec-tories decays with 1/r, where r denotes thedistance between them (Figure 10a). Thisbehavior is known from two-point microrhe-ology, in which embedded beads instead ofspeckles are used to track thermal fluctua-tions in polymer networks (9, 14). Thus, spa-tially correlated yet undirected components ofspeckle motion could be used to probe mate-rial properties of polymer networks inside acell with a resolution at the scale of the inter-speckle distance.
This possibility capitalizes on recent en-hancements of speckle tracking to an accu-racy of approximately one tenth of a pixel evenwhen speckles overlap. Also, we implementeda module that performs correlation analysisin small windows to map out the spatial mod-ulation of material properties (Figure 10b).Whereas in a noncontractile polymer networkthis map would directly reveal spatial vari-ation of network stiffness, the inhomogene-ity could also be the result of spatially vari-able motor activity. To test for this possibilitywe computed the correlation as a function ofthe time over which speckle displacements aretracked. For purely thermal fluctuations therelationship between cross-correlation mag-nitude and time is linear, whereas for a motor-driven fluctuation one would expect superdif-fusive speckle motion (42). Figure 10c showsthat for a time range of 5 to 50 s the rela-tionship is indeed linear. Thus, Figure 10b
may provide a first glimpse of the variationof the stiffness of F-actin networks at themicron scale.
Correlational qFSM of the DynamicEngagement of Actin Cytoskeletonand Focal Adhesions
We have begun to extend our particle-tracking-based analysis of speckles in onespectral channel to correlative particle track-ing in two spectrally distinct channels withthe goal of analyzing the kinematic couplingbetween two macromolecular assemblies. We
382 Danuser ·Waterman-Storer
Ann
u. R
ev. B
ioph
ys. B
iom
ol. S
truc
t. 20
06.3
5:36
1-38
7. D
ownl
oade
d fr
om a
rjou
rnal
s.an
nual
revi
ews.
org
by C
lare
Wat
erm
an-S
tore
r on
06/
01/0
6. F
or p
erso
nal u
se o
nly.
ANRV275-BB35-16 ARI 4 April 2006 20:11
used this approach to derive initial modelsof the coupling of the F-actin cytoskeletonto FA proteins in migrating epithelial cells.Figure 11 illustrates the steps of correlationalqFSM on dual-channel TIR-FSM images ofF-actin and vinculin speckles. Single-speckletracking was first applied separately to bothchannels (Figure 11a). Speckle flows werethen mapped onto a common grid to al-low comparison of pairs of speckles betweenthe two channels (Figure 11b). Speckle as-signment to the closest local grid positionis achieved with distance-weighted, locallyadaptive interpolation (white circle). Follow-ing grid assignment, the correlation betweenthe direction and speed of speckle flow vec-tors was computed. To quantitate the kine-matic coupling of actin and FA molecules, twometrics are currently used. A direction corre-lation score ranging from –1 to 1 is definedas the cosine of the angle between the twovectors at any one grid point (Figure 11c).A speed correlation score is defined as( νFA⊥νact)/|νact|), where ( νFA⊥νact) de-notes the average of the velocity projectionof the FA flow field onto the actin vectorflow axis, and |νact| is the magnitude aver-age of actin vectors. This value thus repre-sents how the speed of FA molecules alongthe actin axis compares with the speed of F-actin itself. For two identical flow fields, boththe direction and speed correlation scoresare 1.
Preliminary correlational qFSM studieshave already revealed thus far unknown pat-terns of molecular coupling to FAs. For ex-ample, we found a low degree of kinematiccoupling between F-actin and the FA proteinsintegrin, FAK, zyxin, and paxillin, as indicatedby low direction and speed correlation scores.In contrast, our analysis revealed a high de-gree of kinematic coupling between F-actinflow and FA proteins α-actinin, talin, and vin-culin. This indicates the power of correla-tional qFSM for spatiotemporally quantifyingthe degree of engagement of pairs of colocal-ized molecules in subcellular macromolecularassemblies.
CONCLUSION
Over the past few years FSM has been ad-vanced to a versatile tool for simultaneouslyprobing the motion, deformation, turnover,and material properties of macromolecularassemblies. In a next step, these parameterswill be combined in correlational analysesto establish how assemblies operate as dy-namic and plastic structures, enabling a broadvariety of cell functions. In parallel, FSM willgo multispectral, so that these parameters canbe correlated among different macromolecu-lar structures. This requires major modifica-tions to the current qFSM software to copewith the explosion of combinatorial data intwo or more simultaneously imaged specklechannels.
Despite the conceptual simplicity, FSMhas remained an expert technique used by arelatively small number of research labora-tories. Two measures will be taken by ourlabs in an attempt to spread FSM as a rou-tine mode of light microscopy. First, pro-tocols are under development to generatecell lines that permanently express low lev-els of fluorescent cytoskeleton proteins op-timized for speckle image formation. Thiswill avoid the time-consuming steps of mi-croinjection and the tweaking of transient ex-pression of fluorescent protein and will turnFSM into a robust technique with high quan-titative reproducibility. Second, the qFSMsoftware package will be released. The useof cell lines with reproducible levels of flu-orescent protein will greatly aid the soft-ware distribution. Under standardized con-ditions many of the processing steps can befurnished with default control parameters sothat meaningful results can be obtained with-out in-depth knowledge of the mathematicalalgorithms.
Last, the idea of FSM will be promotedby more applications outside the cytoskele-ton field. The analyses of FA dynamics makean initial step in this direction. Projects areunderway to apply qFSM to studies of thedynamic interaction of clathrin, dynamin,
www.annualreviews.org • Fluorescent Speckle Microscopy 383
Ann
u. R
ev. B
ioph
ys. B
iom
ol. S
truc
t. 20
06.3
5:36
1-38
7. D
ownl
oade
d fr
om a
rjou
rnal
s.an
nual
revi
ews.
org
by C
lare
Wat
erm
an-S
tore
r on
06/
01/0
6. F
or p
erso
nal u
se o
nly.

ANRV275-BB35-16 ARI 4 April 2006 20:11
and actin structures during endocytosis, andof DNA repair. Despite the many exist-ing discoveries already made by FSM, as
documented by the sizable list of publicationsin Table S1, it is still a technology in theinfancy of its uses.
ACKNOWLEDGMENTS
This research is supported by NIH through the grant R01 GM67230 to C.W.S. and G.D. Weare grateful to Ke Hu, Lin Ji, Stephanie Gupton, and Dinah Loerke for sharing unpublisheddata; and to Kathryn Thompson for a careful reading of the manuscript.
LITERATURE CITED
1. Guidelines forthe practicalimplementation ofa total internalreflection lightmicroscopeamenable to FSM.
1. Adams M, Matov A, Yarar D, Gupton S, Danuser G, Waterman-Storer CM. 2004.Signal analysis of total internal reflection fluorescent speckle microscopy (TIR-FSM) and widefield epi-fluorescence FSM of the actin cytoskeleton and focal adhe-sions in living cells. J. Microsc. 216:138–52
2. Guidelines forthe practicalimplementation ofa spinning diskconfocalmicroscopeamenable to FSM.
2. Adams MC, Salmon WC, Gupton SL, Cohan CS, Wittmann T, et al. 2003. Ahigh-speed multispectral spinning-disk confocal microscope system for fluorescentspeckle microscopy of living cells. Methods 29:29–41
3. Ahuja RK, Magnanti TM, Orlin JB. 1993. Network Flows: Theory, Algorithms and Optimiza-tion. Saddle River, NJ: Prentice-Hall. 846 pp.
4. Blackman SS, Popoli R. 1999. Design and Analysis of Modern Tracking Systems. Noorwood,MA: Artech House
5. Bretschneider T, Diez S, Anderson K, Heuser JA, Clarke M, et al. 2004. Dynamic actinpatterns and Arp2/3 assembly at the substrate-attached surface of motile cells. Curr. Biol.14:1–10
6. Brust-Mascher I, Scholey JM. 2002. Microtubule flux and sliding in mitotic spindles ofDrosophila embryos. Mol. Biol. Cell 13:3967–75
7. Application ofFSM to study thetransientassociation of acytoskeleton-binding proteinwith thecytoskeleton.
7. Bulinski JC, Odde DJ, Howell BJ, Salmon TD, Waterman-Storer CM. 2001. Rapiddynamics of the microtubule binding of ensconsin in vivo. J. Cell Sci. 114:3885–97
8. Burkard KE, Cela E. 1999. Linear assignment problems and extensions. In Handbook ofCombinatorial Optimization, ed. DZ Du, PM Pardalos, pp. 75–149. Dordrecht: KluwerAcad. Publ.
9. Crocker JC, Valentine MT, Weeks ER, Gisler T, Kaplan PD, et al. 2000. Two-pointmicrorheology of inhomogeneous soft materials. Phys. Rev. Lett. 85:888–91
10. Danuser G, Waterman-Storer CM. 2003. Fluorescent speckle microscopy: where it camefrom and where it is going. J. Microsc. 211:191–207
11. Desai A, Mitchison TJ. 1997. Microtubule polymerization dynamics. Annu. Rev. Cell Dev.Biol. 13:83–117
12. Dunn GA, Dobbie IM, Monypenny J, Holt MR, Zicha D. 2002. Fluorescence localizationafter photobleaching (FLAP): a new method for studying protein dynamics in living cells.J. Microsc. 205:109–12
13. Gaetz J, Kapoor TM. 2004. Dynein/dynactin regulate metaphase spindle length by tar-geting depolymerizing activities to spindle poles. J. Cell Biol. 166:465–71
14. Gardel ML, Shin JH, MacKintosh FC, Mahadevan L, Matsudaira P, Weitz DA. 2004.Elastic behavior of cross-linked and bundled actin networks. Science 304:1301–5
15. Geiger B, Bershadsky A, Pankov R, Yamada KM. 2001. Transmembrane extracellularmatrix-cytoskeleton crosstalk. Nat. Rev. Mol. Cell Biol. 2:793–805
384 Danuser ·Waterman-Storer
Ann
u. R
ev. B
ioph
ys. B
iom
ol. S
truc
t. 20
06.3
5:36
1-38
7. D
ownl
oade
d fr
om a
rjou
rnal
s.an
nual
revi
ews.
org
by C
lare
Wat
erm
an-S
tore
r on
06/
01/0
6. F
or p
erso
nal u
se o
nly.

ANRV275-BB35-16 ARI 4 April 2006 20:11
16. Grego S, Cantillana V, Salmon ED. 2001. Microtubule treadmilling in vitro investigatedby fluorescence speckle and confocal microscopy. Biophys. J. 81:66–78
17. Guidelines forthe preparation oflive cell samples forFSM and for therealization ofperfusion chambersthat allow thetransientapplication ofsmall-moleculeinhibitors ofcytoskeletonfunctions duringFSM imaging.
17. Gupton S, Waterman-Storer CM. 2006. Live-cell fluorescent speckle microscopy(FSM) of actin cytoskeletal dynamics and their perturbation by drug perfusion. InCell Biology: A Laboratory Handbook, ed. J Celis, JV Small, pp. 137–51. Amsterdam:Elsevier
18. Gupton SL, Anderson KL, Kole TP, Fischer RS, Ponti A, et al. 2005. Cell migrationwithout a lamellipodium: translation of actin dynamics into cell movement mediated bytropomyosin. J. Cell Biol. 168:619–31
19. Gupton SL, Salmon WC, Waterman-Storer CM. 2002. Converging populations of F-actinpromote breakage of associated microtubules to spatially regulate microtubule turnover inmigrating cells. Curr. Biol. 12:1891–99
20. Inoue S, Spring KR. 1997. Video Microscopy: The Fundamentals. New York/London: Plenum.764 pp.
21. Jepson AD, Fleet DJ, El-Maraghi TF. 2003. Robust online appearance models for visualtracking. IEEE Trans. Pattern Anal. Mach. Intell. 25:1296–311
22. Ji L, Danuser G. 2005. Tracking quasi-stationary flow of weak fluorescent features bymulti-frame correlation. J. Microsc. 220:150–67
23. Jurado C, Haserick JR, Lee J. 2005. Slipping or gripping? Fluorescent speckle microscopyin fish keratocytes reveals two different mechanisms for generating a retrograde flow ofactin. Mol. Biol. Cell 16:507–18
24. Kapoor TM, Mitchison TJ. 2001. Eg5 is static in bipolar spindles relative to tubulin:evidence for a static spindle matrix. J. Cell Biol. 154:1125–34
25. Lippincott-Schwartz J, Patterson GH. 2003. Development and use of fluorescent proteinmarkers in living cells. Science 300:87–91
26. Luby-Phelps K. 2000. Cytoarchitecture and physical properties of cytoplasm: volume,viscosity, diffusion, intracellular surface area. Int. Rev. Cytol. 192:189–221
27. Maddox P, Desai A, Oegema K, Mitchison TJ, Salmon ED. 2002. Poleward microtubuleflux is a major component of spindle dynamics and anaphase A in mitotic Drosophila em-bryos. Curr. Biol. 12:1670–74
28. Maddox P, Straight A, Coughlin P, Mitchison TJ, Salmon ED. 2003. Direct observation ofmicrotubule dynamics at kinetochores in Xenopus extract spindles: implications for spindlemechanics. J. Cell Biol. 162:377–82
29. Micheli ED, Torre V, Uras S. 1993. The accuracy of the computation of optical flow andof the recovery of motion parameters. IEEE Trans. Pattern Anal. Mach. Intell. 15:434–47
30. Mikhailov AV, Gundersen GG. 1995. Centripetal transport of microtubules in motile cells.Cell Motil. Cytoskelet. 32:173–86
31. Mitchison TJ. 1989. Polewards microtubule flux in the mitotic spindle: evidence fromphotoactivation of fluorescence. J. Cell Biol. 109:637–52
32. Miyamoto DT, Perlman ZE, Burbank KS, Groen AC, Mitchison TJ. 2004. The kinesinEg5 drives poleward microtubule flux in Xenopus laevis egg extract spindles. J. Cell Biol.167:813–18
33. Murthy K, Wadsworth P. 2005. Myosin-II-dependent localization and dynamics of F-actinduring cytokinesis. Curr. Biol. 15:724–31
34. Pollard TD, Blanchoin L, Mullins RD. 2000. Molecular mechanisms controlling actinfilament dynamics in nonmuscle cells. Annu. Rev. Biophys. Biomol. Struct. 29:545–76
35. Pollard TD, Borisy GB. 2003. Cellular motility driven by assembly and disassembly ofactin filaments. Cell 112:453–65
www.annualreviews.org • Fluorescent Speckle Microscopy 385
Ann
u. R
ev. B
ioph
ys. B
iom
ol. S
truc
t. 20
06.3
5:36
1-38
7. D
ownl
oade
d fr
om a
rjou
rnal
s.an
nual
revi
ews.
org
by C
lare
Wat
erm
an-S
tore
r on
06/
01/0
6. F
or p
erso
nal u
se o
nly.

ANRV275-BB35-16 ARI 4 April 2006 20:11
36. Ponti A. 2004. High-Resolution Analysis of F-Actin Meshwork Kinetics and Kinematics UsingComputational Fluorescent Speckle Microscopy. Zurich: ETH. 185 pp.
37. Discovery oftwo dynamicallyand molecularlydistinct yet spatiallyoverlapping actincytoskeletonstructures inepithelial cellsusing clusteranalysis ofsingle-speckleproperties.
37. Ponti A, Machacek M, Gupton SL, Waterman-Storer CM, Danuser G. 2004. Twodistinct actin networks drive the protrusion of migrating cells. Science 305:1782–86
38. Ponti A, Matov A, Adams M, Gupton S, Waterman-Storer CM, Danuser G. 2005. Periodicpatterns of actin turnover in lamellipodia and lamellae of migrating epithelial cells analyzedby quantitative fluorescent speckle microscopy. Biophys. J. 89:3456–69
39. Statisticalmodel for theextraction of ratesof polymerassembly anddisassembly byclassification ofintensity changesduring speckleappearance anddisappearanceevents.
39. Ponti A, Vallotton P, Salmon WC, Waterman-Storer CM, Danuser G. 2003. Com-putational analysis of F-actin turnover in cortical actin meshworks using fluorescentspeckle microscopy. Biophys. J. 84:3336–52
40. Prasher DC. 1995. Using GFP to see the light. Trends Genet. 11:320–23
41. Application oftwo-color FSM toexamine theinteraction of theactin andmicrotubulecytoskeletons inepithelial cellmigration.
41. Salmon WC, Adams MC, Waterman-Storer CM. 2002. Dual-wavelength fluores-cent speckle microscopy reveals coupling of microtubule and actin movements inmigrating cells. J. Cell Biol. 158:31–37
42. Saxton MJ, Jacobson K. 1997. Single-particle tracking: application to membrane dynamics.Annu. Rev. Biophys. Biomol. Struct. 26:373–99
43. Application oftwo-color FSM toexamine theinteraction of theactin andmicrotubulecytoskeletons inneuronal growthcones.
43. Schaefer AW, Kabir N, Forscher P. 2002. Filopodia and actin arcs guide the assemblyand transport of two populations of microtubules with unique dynamic parametersin neuronal growth cones. J. Cell Biol. 158:139–52
44. Small V. 1981. Organization of actin in the leading edge of cultured cells. J. Cell Biol.91:695–705
45. Svitkina TM, Verkhovsky AB, McQuade KM, Borisy GG. 1997. Analysis of the actin-myosin II system in fish epidermal keratocytes: mechanism of cell body translocation. J.Cell Biol. 139:397–415
46. Theriot JA, Mitchison TJ. 1991. Actin microfilament dynamics in locomoting cells. Nature352:126–31
47. Vallotton P, Danuser G, Bohnet S, Meister JJ, Verkhovsky A. 2005. Retrograde flow inkeratocytes: news from the front. Mol. Biol. Cell 16:1223–31
48. Vallotton P, Gupton SL, Waterman-Storer CM, Danuser G. 2004. Simultaneous mappingof filamentous actin flow and turnover in migrating cells by quantitative fluorescent specklemicroscopy. Proc. Natl. Acad. Sci. USA 101:9660–65
49. Vallotton P, Ponti A, Waterman-Storer CM, Salmon ED, Danuser G. 2003. Recovery,visualization, and analysis of actin and tubulin polymer flow in live cells: a fluorescencespeckle microscopy study. Biophys. J. 85:1289–306
50. Verkhovsky AB, Svitkina TM, Borisy GG. 1999. Network contraction model for celltranslocation and retrograde flow. In Cell Behaviour: Control and Mechanism of Motility,ed. JM Lackie, GA Dunn, GE Jones, pp. 207–22. London: Portland
51. Verkhovsky AB, Svitkina TM, Borisy GG. 1999. Self-polarization and directional motilityof cytoplasm. Curr. Biol. 9:11–20
52. Wadsworth P, Salmon E. 1986. Analysis of the treadmilling model during metaphase ofmitosis using fluorescence redistribution after photobleaching. J. Cell Biol. 102:1032–38
53. Wang Y. 1985. Exchange of actin subunits at the leading edge of living fibroblasts: possiblerole of treadmilling. J. Cell Biol. 101:597–602
54. Wang YL, Heiple JM, Taylor DL. 1982. Fluorescent analog cytochemistry of contractileproteins. Methods Cell Biol. 25:1–11
55. Imaging andanalysis ofsingle-fluorophorespeckles to probeactin cytoskeletondynamics duringcell motility. 55. Watanabe Y, Mitchison TJ. 2002. Single-molecule speckle analysis of actin filament
turnover in lamellipodia. Science 295:1083–86
386 Danuser ·Waterman-Storer
Ann
u. R
ev. B
ioph
ys. B
iom
ol. S
truc
t. 20
06.3
5:36
1-38
7. D
ownl
oade
d fr
om a
rjou
rnal
s.an
nual
revi
ews.
org
by C
lare
Wat
erm
an-S
tore
r on
06/
01/0
6. F
or p
erso
nal u
se o
nly.
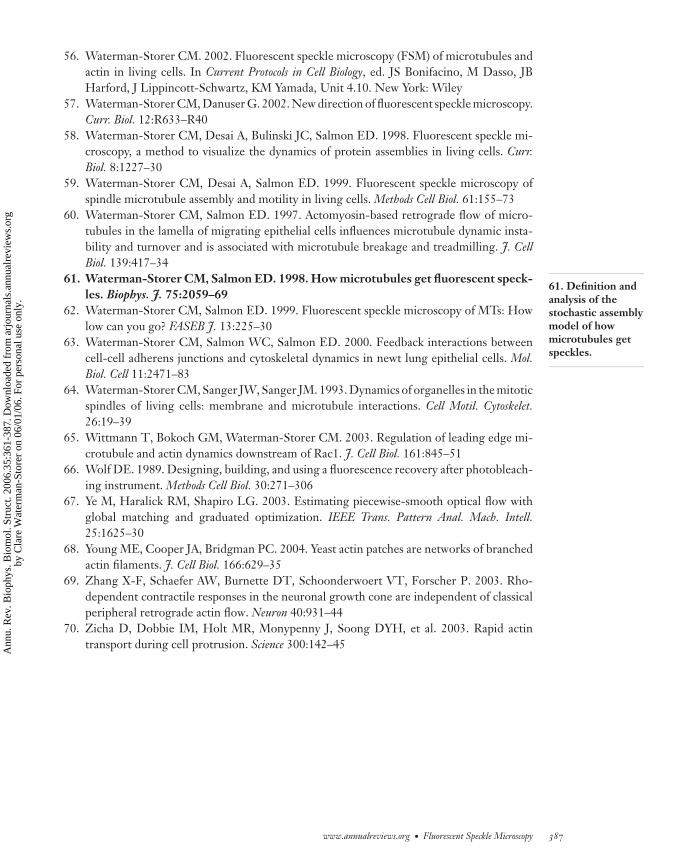
ANRV275-BB35-16 ARI 4 April 2006 20:11
56. Waterman-Storer CM. 2002. Fluorescent speckle microscopy (FSM) of microtubules andactin in living cells. In Current Protocols in Cell Biology, ed. JS Bonifacino, M Dasso, JBHarford, J Lippincott-Schwartz, KM Yamada, Unit 4.10. New York: Wiley
57. Waterman-Storer CM, Danuser G. 2002. New direction of fluorescent speckle microscopy.Curr. Biol. 12:R633–R40
58. Waterman-Storer CM, Desai A, Bulinski JC, Salmon ED. 1998. Fluorescent speckle mi-croscopy, a method to visualize the dynamics of protein assemblies in living cells. Curr.Biol. 8:1227–30
59. Waterman-Storer CM, Desai A, Salmon ED. 1999. Fluorescent speckle microscopy ofspindle microtubule assembly and motility in living cells. Methods Cell Biol. 61:155–73
60. Waterman-Storer CM, Salmon ED. 1997. Actomyosin-based retrograde flow of micro-tubules in the lamella of migrating epithelial cells influences microtubule dynamic insta-bility and turnover and is associated with microtubule breakage and treadmilling. J. CellBiol. 139:417–34
61. Definition andanalysis of thestochastic assemblymodel of howmicrotubules getspeckles.
61. Waterman-Storer CM, Salmon ED. 1998. How microtubules get fluorescent speck-les. Biophys. J. 75:2059–69
62. Waterman-Storer CM, Salmon ED. 1999. Fluorescent speckle microscopy of MTs: Howlow can you go? FASEB J. 13:225–30
63. Waterman-Storer CM, Salmon WC, Salmon ED. 2000. Feedback interactions betweencell-cell adherens junctions and cytoskeletal dynamics in newt lung epithelial cells. Mol.Biol. Cell 11:2471–83
64. Waterman-Storer CM, Sanger JW, Sanger JM. 1993. Dynamics of organelles in the mitoticspindles of living cells: membrane and microtubule interactions. Cell Motil. Cytoskelet.26:19–39
65. Wittmann T, Bokoch GM, Waterman-Storer CM. 2003. Regulation of leading edge mi-crotubule and actin dynamics downstream of Rac1. J. Cell Biol. 161:845–51
66. Wolf DE. 1989. Designing, building, and using a fluorescence recovery after photobleach-ing instrument. Methods Cell Biol. 30:271–306
67. Ye M, Haralick RM, Shapiro LG. 2003. Estimating piecewise-smooth optical flow withglobal matching and graduated optimization. IEEE Trans. Pattern Anal. Mach. Intell.25:1625–30
68. Young ME, Cooper JA, Bridgman PC. 2004. Yeast actin patches are networks of branchedactin filaments. J. Cell Biol. 166:629–35
69. Zhang X-F, Schaefer AW, Burnette DT, Schoonderwoert VT, Forscher P. 2003. Rho-dependent contractile responses in the neuronal growth cone are independent of classicalperipheral retrograde actin flow. Neuron 40:931–44
70. Zicha D, Dobbie IM, Holt MR, Monypenny J, Soong DYH, et al. 2003. Rapid actintransport during cell protrusion. Science 300:142–45
www.annualreviews.org • Fluorescent Speckle Microscopy 387
Ann
u. R
ev. B
ioph
ys. B
iom
ol. S
truc
t. 20
06.3
5:36
1-38
7. D
ownl
oade
d fr
om a
rjou
rnal
s.an
nual
revi
ews.
org
by C
lare
Wat
erm
an-S
tore
r on
06/
01/0
6. F
or p
erso
nal u
se o
nly.

Contents ARI 12 April 2006 20:14
Annual Reviewof Biophysics andBiomolecularStructure
Volume 35, 2006Contents
FrontispieceMartin Karplus � � � � � � � � � � � � � � � � � � � � � � � � � � � � � � � � � � � � � � � � � � � � � � � � � � � � � � � � � � � � � � � � � � � � � � � � � � � � � � � �xii
Spinach on the Ceiling: A Theoretical Chemist’s Return to BiologyMartin Karplus � � � � � � � � � � � � � � � � � � � � � � � � � � � � � � � � � � � � � � � � � � � � � � � � � � � � � � � � � � � � � � � � � � � � � � � � � � � � � � � � � 1
Computer-Based Design of Novel Protein StructuresGlenn L. Butterfoss and Brian Kuhlman � � � � � � � � � � � � � � � � � � � � � � � � � � � � � � � � � � � � � � � � � � � � � � � � � � � �49
Lessons from Lactose PermeaseLan Guan and H. Ronald Kaback � � � � � � � � � � � � � � � � � � � � � � � � � � � � � � � � � � � � � � � � � � � � � � � � � � � � � � � � � � � �67
Evolutionary Relationships and Structural Mechanisms of AAA+ProteinsJan P. Erzberger and James M. Berger � � � � � � � � � � � � � � � � � � � � � � � � � � � � � � � � � � � � � � � � � � � � � � � � � � � � � �93
Symmetry, Form, and Shape: Guiding Principles for Robustness inMacromolecular MachinesFlorence Tama and Charles L. Brooks, III � � � � � � � � � � � � � � � � � � � � � � � � � � � � � � � � � � � � � � � � � � � � � � � � � 115
Fusion Pores and Fusion Machines in Ca2+-Triggered ExocytosisMeyer B. Jackson and Edwin R. Chapman � � � � � � � � � � � � � � � � � � � � � � � � � � � � � � � � � � � � � � � � � � � � � � � � 135
RNA Folding During TranscriptionTao Pan and Tobin Sosnick � � � � � � � � � � � � � � � � � � � � � � � � � � � � � � � � � � � � � � � � � � � � � � � � � � � � � � � � � � � � � � � � � � 161
Roles of Bilayer Material Properties in Function and Distribution ofMembrane ProteinsThomas J. McIntosh and Sidney A. Simon � � � � � � � � � � � � � � � � � � � � � � � � � � � � � � � � � � � � � � � � � � � � � � � � 177
Electron Tomography of Membrane-Bound Cellular OrganellesTerrence G. Frey, Guy A. Perkins, and Mark H. Ellisman � � � � � � � � � � � � � � � � � � � � � � � � � � � � � � � 199
Expanding the Genetic CodeLei Wang, Jianming Xie, and Peter G. Schultz � � � � � � � � � � � � � � � � � � � � � � � � � � � � � � � � � � � � � � � � � � � 225
Radiolytic Protein Footprinting with Mass Spectrometry to Probe theStructure of Macromolecular ComplexesKeiji Takamoto and Mark R. Chance � � � � � � � � � � � � � � � � � � � � � � � � � � � � � � � � � � � � � � � � � � � � � � � � � � � � � � 251
v
Ann
u. R
ev. B
ioph
ys. B
iom
ol. S
truc
t. 20
06.3
5:36
1-38
7. D
ownl
oade
d fr
om a
rjou
rnal
s.an
nual
revi
ews.
org
by C
lare
Wat
erm
an-S
tore
r on
06/
01/0
6. F
or p
erso
nal u
se o
nly.

Contents ARI 12 April 2006 20:14
The ESCRT Complexes: Structure and Mechanism of aMembrane-Trafficking NetworkJames H. Hurley and Scott D. Emr � � � � � � � � � � � � � � � � � � � � � � � � � � � � � � � � � � � � � � � � � � � � � � � � � � � � � � � � 277
Ribosome Dynamics: Insights from Atomic Structure Modeling intoCryo-Electron Microscopy MapsKakoli Mitra and Joachim Frank � � � � � � � � � � � � � � � � � � � � � � � � � � � � � � � � � � � � � � � � � � � � � � � � � � � � � � � � � � 299
NMR Techniques for Very Large Proteins and RNAs in SolutionAndreas G. Tzakos, Christy R.R. Grace, Peter J. Lukavsky, and Roland Riek � � � � � � � � � � 319
Single-Molecule Analysis of RNA Polymerase TranscriptionLu Bai, Thomas J. Santangelo, and Michelle D. Wang � � � � � � � � � � � � � � � � � � � � � � � � � � � � � � � � � � � 343
Quantitative Fluorescent Speckle Microscopy of CytoskeletonDynamicsGaudenz Danuser and Clare M. Waterman-Storer � � � � � � � � � � � � � � � � � � � � � � � � � � � � � � � � � � � � � � 361
Water Mediation in Protein Folding and Molecular RecognitionYaakov Levy and José N. Onuchic � � � � � � � � � � � � � � � � � � � � � � � � � � � � � � � � � � � � � � � � � � � � � � � � � � � � � � � � � � 389
Continuous Membrane-Cytoskeleton Adhesion Requires ContinuousAccommodation to Lipid and Cytoskeleton DynamicsMichael P. Sheetz, Julia E. Sable, and Hans-Günther Döbereiner � � � � � � � � � � � � � � � � � � � � � � � 417
Cryo-Electron Microscopy of Spliceosomal ComponentsHolger Stark and Reinhard Lührmann � � � � � � � � � � � � � � � � � � � � � � � � � � � � � � � � � � � � � � � � � � � � � � � � � � � � 435
Mechanotransduction Involving Multimodular Proteins: ConvertingForce into Biochemical SignalsViola Vogel � � � � � � � � � � � � � � � � � � � � � � � � � � � � � � � � � � � � � � � � � � � � � � � � � � � � � � � � � � � � � � � � � � � � � � � � � � � � � � � � � � � 459
INDEX
Subject Index � � � � � � � � � � � � � � � � � � � � � � � � � � � � � � � � � � � � � � � � � � � � � � � � � � � � � � � � � � � � � � � � � � � � � � � � � � � � � � � � � � � 489
Cumulative Index of Contributing Authors, Volumes 31–35 � � � � � � � � � � � � � � � � � � � � � � � � � � � 509
Cumulative Index of Chapter Titles, Volumes 31–35 � � � � � � � � � � � � � � � � � � � � � � � � � � � � � � � � � � � � 512
ERRATA
An online log of corrections to Annual Review of Biophysics and Biomolecular Structurechapters (if any, 1997 to the present) may be found athttp://biophys.annualreviews.org/errata.shtml
vi Contents
Ann
u. R
ev. B
ioph
ys. B
iom
ol. S
truc
t. 20
06.3
5:36
1-38
7. D
ownl
oade
d fr
om a
rjou
rnal
s.an
nual
revi
ews.
org
by C
lare
Wat
erm
an-S
tore
r on
06/
01/0
6. F
or p
erso
nal u
se o
nly.