Quantitative Easing and the Dollar-Yen Carry Trade
9
Quantitative Easing and the Dollar-Yen Carry Trade Leila Heckman, Ph.D., Founder John Mullin, Ph.D., Chief Strategist For More Information (917) 386-6261 www.heckmanglobal.com MARCH 2018 INTERNATIONAL EQUITY WHITEPAPER A division of DCM Advisors, LLC.
Transcript of Quantitative Easing and the Dollar-Yen Carry Trade
Quantitative Easing and the Dollar-Yen Carry Trade Leila Heckman, Ph.D., Founder John Mullin, Ph.D., Chief Strategist
For More Information(917) 386-6261www.heckmanglobal.com
MARCH 2018 INTERNATIONAL EQUITY WHITEPAPER
A division of DCM Advisors, LLC.
Heckman Global Advisors A Division of DCM Advisors, LLC March 2018
1
Quantitative Easing and the Dollar-Yen Carry Trade
-John Mullin
This paper augments a predictive model of the Dollar-Yen FX trade to take into account central bank
quantitative easing. The paper finds that the inclusion of an indicator dubbed “Relative Quantitative
Restraint” substantially improves the performance of a three-indicator model based on valuation,
interest rate differentials, and momentum. In addition, the analysis provides the following point
estimate: During 2007-2017, a 16% monetary base expansion had the same FX impact as a 1% interest
rate reduction.
Modeling the “Long JPY, Short USD” Trade
Before the onset of the financial crisis in 2007, a reasonably robust predictive model for the “Long JPY,
Short USD” trade could be constructed using three explanatory variables:1
1. Value: The “Long JPY, Short USD” trade tends to be more profitable when the yen appears to be undervalued in real terms relative to the dollar
2. Interest Rate Differential: The “Long JPY, Short USD” trade tends to be more profitable when Japanese money market interest rates are high relative U.S. money market interest rates (the carry trade incentive)
3. Momentum: The “Long JPY, Short USD “ trade tends to be more profitable when the
trade has momentum (that is, when the trade has been recently profitable)
However, the three indicator model’s explanatory power waned after the onset of the financial crisis—in
what became the era of central bank quantitative easing. To address this shortcoming, this paper
augments the three indicator model with a fourth explanatory variable:
4. Relative Quantitative Restraint: The “Long JPY, Short USD” trade tends to be more
profitable in periods after monetary base growth has been more restrained in Japan than
in the United States.
Econometric Model without Relative Quantitative Restraint
We estimated the three-indicator model (without Relative Quantitative Restraint) over 1985 – 2017. The
summary statistics of the regression models are given in the tables below. The model’s F-Statistic is
highly statistically significant, and each of the three explanatory variables had the expected coefficient
1 The return of the “Long JPY-Short USD” trade is the difference between (a) the Japanese money market return in USD (unhedged); and (b)
the U.S. money market return in USD. Fuller definitions as well as econometric model specifications are given in the appendix.

Heckman Global Advisors A Division of DCM Advisors, LLC March 2018
2
sign. The t-Statistic associated with the Momentum indicator was high at 2.3, followed by the Interest
Rate Differential indicator with a t-Statistic of 1.9 and the Value indicator with a t-Statistic of 1.6.
However, the three-indicator model lost much of its explanatory power during and after the financial
crisis (2007-17). During this period, the model’s F-Statistic was statistically insignificant, and each of the
three explanatory variables had lower t-Statistics than in the full 1985-2017 period. The coefficient signs
for Value and Momentum remained positive, but the sign for Interest Rate Differential became
indistinguishable from zero.
The results for 20017-17 raise the question of whether model performance could be improved by
explicitly accounting for the role of quantitative easing during the financial crisis and its aftermath.
Regression Analysis of "Long JPY, Short USD" Return
Without Relative Quantitative Restraint
1985 - 2017
Coefficient Standard Error t Stat
Intercept 0.4% 0.2% 1.7
Value 1.6% 1.0% 1.6
Interest Rate Differential 0.2% 0.1% 1.9
Momentum 3.3% 1.4% 2.3
R Square 3.0%
Adjusted R-Square 2.3%
F Statistic 4.1
Significance of F Statistic 0.7%
Source: Heckman Global Advisors
Regression Analysis of "Long JPY, Short USD" Return
Without Relative Quantitative Restraint
2007 - 2017
Coefficient Standard Error t Stat
Intercept -0.1% 0.3% -0.3
Value 2.2% 2.3% 1.0
Interest Rate Differential 0.0% 0.2% -0.1
Momentum 3.9% 2.8% 1.4
R Square 1.5%
Adjusted R-Square -0.8%
F Statistic 0.7
Significance of F Statistic 57.6%
Source: Heckman Global Advisors
Heckman Global Advisors A Division of DCM Advisors, LLC March 2018
3
Quantitative Easing in the United States and Japan Since 2007
A central bank engages in quantitative easing by expanding its balance sheet through open market purchases of
securities and other extensions of credit. This expansion can be monitored by tracking the liability side of the
central bank’s balance sheet, which is known as the monetary base.
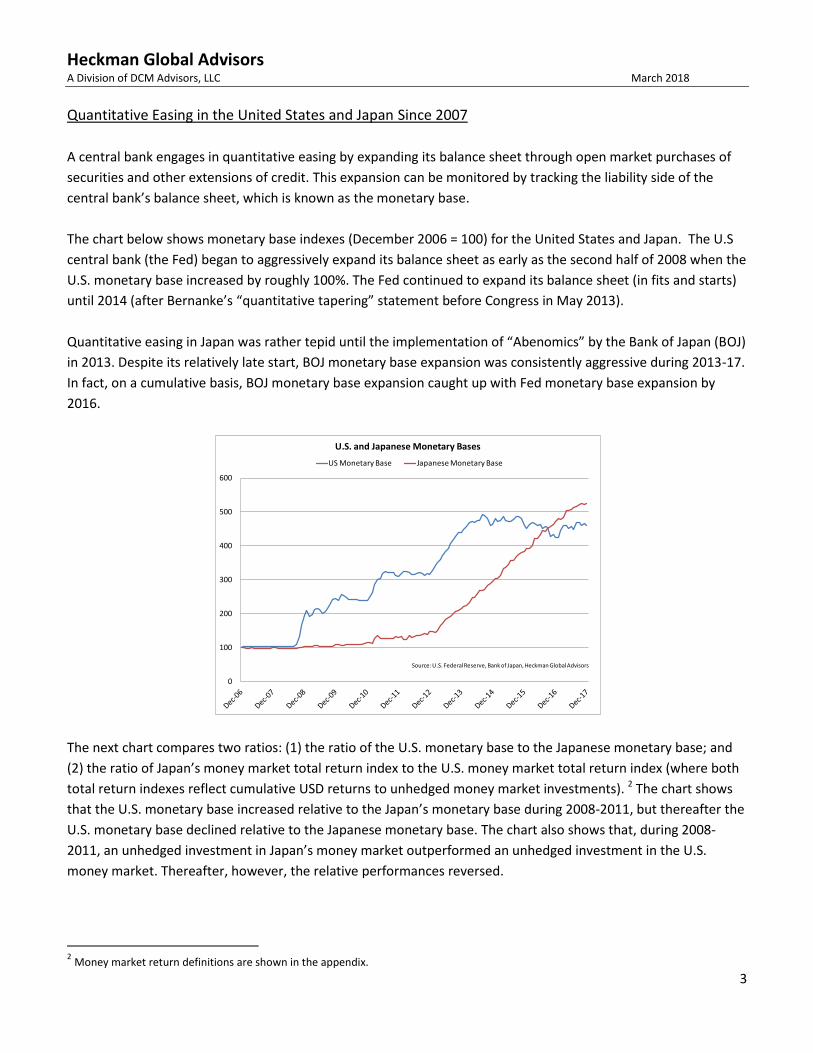
The chart below shows monetary base indexes (December 2006 = 100) for the United States and Japan. The U.S
central bank (the Fed) began to aggressively expand its balance sheet as early as the second half of 2008 when the
U.S. monetary base increased by roughly 100%. The Fed continued to expand its balance sheet (in fits and starts)
until 2014 (after Bernanke’s “quantitative tapering” statement before Congress in May 2013).
Quantitative easing in Japan was rather tepid until the implementation of “Abenomics” by the Bank of Japan (BOJ)
in 2013. Despite its relatively late start, BOJ monetary base expansion was consistently aggressive during 2013-17.
In fact, on a cumulative basis, BOJ monetary base expansion caught up with Fed monetary base expansion by
2016.
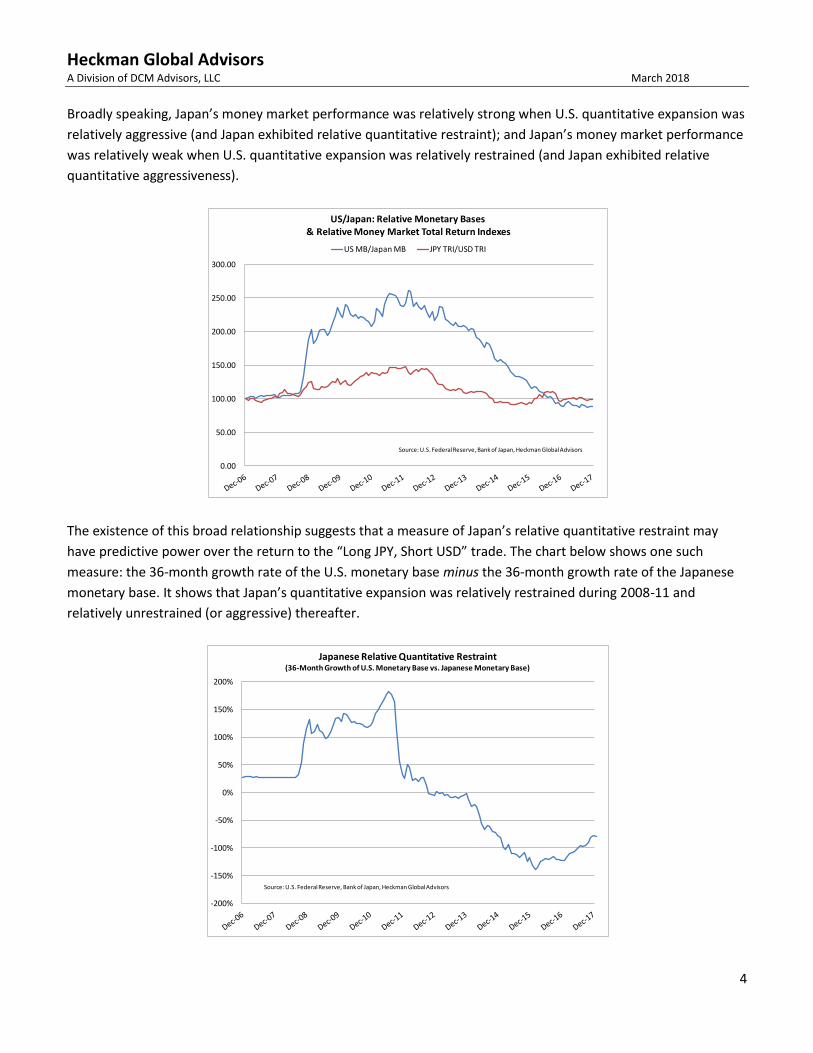
The next chart compares two ratios: (1) the ratio of the U.S. monetary base to the Japanese monetary base; and
(2) the ratio of Japan’s money market total return index to the U.S. money market total return index (where both
total return indexes reflect cumulative USD returns to unhedged money market investments). 2 The chart shows
that the U.S. monetary base increased relative to the Japan’s monetary base during 2008-2011, but thereafter the
U.S. monetary base declined relative to the Japanese monetary base. The chart also shows that, during 2008-
2011, an unhedged investment in Japan’s money market outperformed an unhedged investment in the U.S.
money market. Thereafter, however, the relative performances reversed.
2 Money market return definitions are shown in the appendix.
0
100
200
300
400
500
600
U.S. and Japanese Monetary Bases
US Monetary Base Japanese Monetary Base
Source: U.S. Federal Reserve, Bank of Japan, Heckman Global Advisors
Heckman Global Advisors A Division of DCM Advisors, LLC March 2018
4
Broadly speaking, Japan’s money market performance was relatively strong when U.S. quantitative expansion was
relatively aggressive (and Japan exhibited relative quantitative restraint); and Japan’s money market performance
was relatively weak when U.S. quantitative expansion was relatively restrained (and Japan exhibited relative
quantitative aggressiveness).
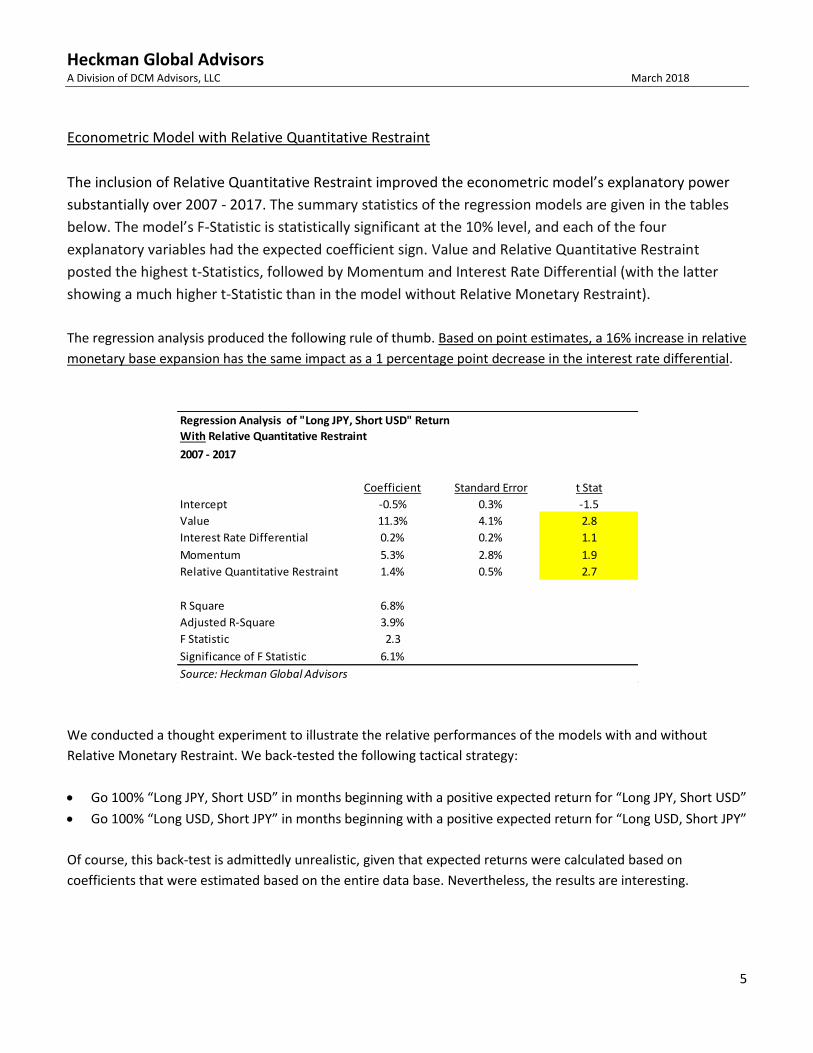
The existence of this broad relationship suggests that a measure of Japan’s relative quantitative restraint may
have predictive power over the return to the “Long JPY, Short USD” trade. The chart below shows one such
measure: the 36-month growth rate of the U.S. monetary base minus the 36-month growth rate of the Japanese
monetary base. It shows that Japan’s quantitative expansion was relatively restrained during 2008-11 and
relatively unrestrained (or aggressive) thereafter.
0.00
50.00
100.00
150.00
200.00
250.00
300.00
US/Japan: Relative Monetary Bases& Relative Money Market Total Return Indexes
US MB/Japan MB JPY TRI/USD TRI
Source: U.S. Federal Reserve, Bank of Japan, Heckman Global Advisors
-200%
-150%
-100%
-50%
0%
50%
100%
150%
200%
Japanese Relative Quantitative Restraint (36-Month Growth of U.S. Monetary Base vs. Japanese Monetary Base)
Source: U.S. Federal Reserve, Bank of Japan, Heckman Global Advisors
Heckman Global Advisors A Division of DCM Advisors, LLC March 2018
5
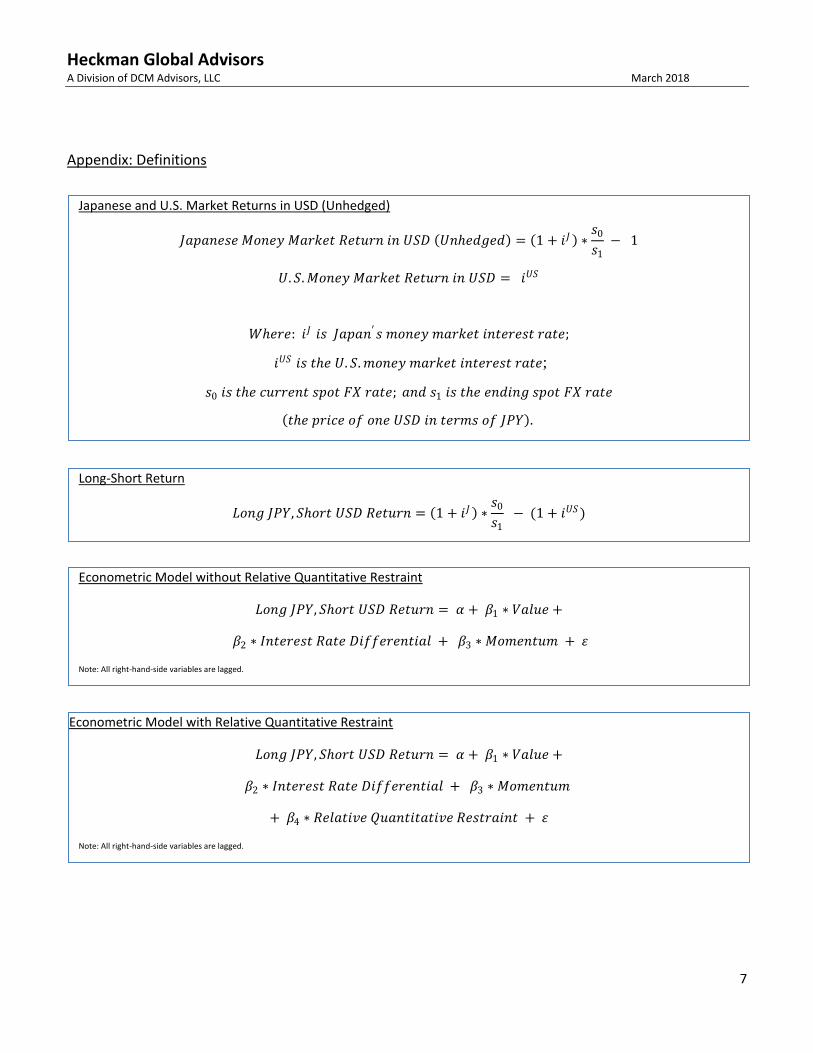
Econometric Model with Relative Quantitative Restraint
The inclusion of Relative Quantitative Restraint improved the econometric model’s explanatory power
substantially over 2007 - 2017. The summary statistics of the regression models are given in the tables
below. The model’s F-Statistic is statistically significant at the 10% level, and each of the four
explanatory variables had the expected coefficient sign. Value and Relative Quantitative Restraint
posted the highest t-Statistics, followed by Momentum and Interest Rate Differential (with the latter
showing a much higher t-Statistic than in the model without Relative Monetary Restraint).
The regression analysis produced the following rule of thumb. Based on point estimates, a 16% increase in relative
monetary base expansion has the same impact as a 1 percentage point decrease in the interest rate differential.
We conducted a thought experiment to illustrate the relative performances of the models with and without
Relative Monetary Restraint. We back-tested the following tactical strategy:
Go 100% “Long JPY, Short USD” in months beginning with a positive expected return for “Long JPY, Short USD”
Go 100% “Long USD, Short JPY” in months beginning with a positive expected return for “Long USD, Short JPY”
Of course, this back-test is admittedly unrealistic, given that expected returns were calculated based on
coefficients that were estimated based on the entire data base. Nevertheless, the results are interesting.
Regression Analysis of "Long JPY, Short USD" Return
With Relative Quantitative Restraint
2007 - 2017
Coefficient Standard Error t Stat
Intercept -0.5% 0.3% -1.5
Value 11.3% 4.1% 2.8
Interest Rate Differential 0.2% 0.2% 1.1
Momentum 5.3% 2.8% 1.9
Relative Quantitative Restraint 1.4% 0.5% 2.7
R Square 6.8%
Adjusted R-Square 3.9%
F Statistic 2.3
Significance of F Statistic 6.1%
Source: Heckman Global Advisors

Heckman Global Advisors A Division of DCM Advisors, LLC March 2018
6
The chart below shows annual back-test alphas (based on annualized monthly averages). During 1985-2017, the
model without Relative Quantitative Restraint had an average annualized alpha of 6%. However, the model’s
annualized alpha declined to 1% on average during 2007-2017. In contrast, the model with Relative Quantitative
Restraint performed much better during 2007-2017, registering an average annualized alpha of 8%
-15%
-10%
-5%
0%
5%
10%
15%
20%
25%
Alpha: Tactical Long-Short JPY-USD Trading Rule
Without Relative Quantitative Restraint With Relative Quantitative Restraint
Source: Heckman Global Advisors
Heckman Global Advisors A Division of DCM Advisors, LLC March 2018
7
Appendix: Definitions
Japanese and U.S. Market Returns in USD (Unhedged)
𝐽𝑎𝑝𝑎𝑛𝑒𝑠𝑒 𝑀𝑜𝑛𝑒𝑦 𝑀𝑎𝑟𝑘𝑒𝑡 𝑅𝑒𝑡𝑢𝑟𝑛 𝑖𝑛 𝑈𝑆𝐷 𝑈𝑛ℎ𝑒𝑑𝑔𝑒𝑑 = 1 + 𝑖𝐽 ∗𝑠0
𝑠1 − 1
𝑈. 𝑆. 𝑀𝑜𝑛𝑒𝑦 𝑀𝑎𝑟𝑘𝑒𝑡 𝑅𝑒𝑡𝑢𝑟𝑛 𝑖𝑛 𝑈𝑆𝐷 = 𝑖𝑈𝑆
𝑊ℎ𝑒𝑟𝑒: 𝑖𝐽 𝑖𝑠 𝐽𝑎𝑝𝑎𝑛′𝑠 𝑚𝑜𝑛𝑒𝑦 𝑚𝑎𝑟𝑘𝑒𝑡 𝑖𝑛𝑡𝑒𝑟𝑒𝑠𝑡 𝑟𝑎𝑡𝑒;
𝑖𝑈𝑆 𝑖𝑠 𝑡ℎ𝑒 𝑈. 𝑆. 𝑚𝑜𝑛𝑒𝑦 𝑚𝑎𝑟𝑘𝑒𝑡 𝑖𝑛𝑡𝑒𝑟𝑒𝑠𝑡 𝑟𝑎𝑡𝑒;
𝑠0 𝑖𝑠 𝑡ℎ𝑒 𝑐𝑢𝑟𝑟𝑒𝑛𝑡 𝑠𝑝𝑜𝑡 𝐹𝑋 𝑟𝑎𝑡𝑒; 𝑎𝑛𝑑 𝑠1 𝑖𝑠 𝑡ℎ𝑒 𝑒𝑛𝑑𝑖𝑛𝑔 𝑠𝑝𝑜𝑡 𝐹𝑋 𝑟𝑎𝑡𝑒
𝑡ℎ𝑒 𝑝𝑟𝑖𝑐𝑒 𝑜𝑓 𝑜𝑛𝑒 𝑈𝑆𝐷 𝑖𝑛 𝑡𝑒𝑟𝑚𝑠 𝑜𝑓 𝐽𝑃𝑌 .
Long-Short Return
𝐿𝑜𝑛𝑔 𝐽𝑃𝑌, 𝑆ℎ𝑜𝑟𝑡 𝑈𝑆𝐷 𝑅𝑒𝑡𝑢𝑟𝑛 = 1 + 𝑖𝐽 ∗𝑠0
𝑠1 − (1 + 𝑖𝑈𝑆)
Econometric Model without Relative Quantitative Restraint
𝐿𝑜𝑛𝑔 𝐽𝑃𝑌, 𝑆ℎ𝑜𝑟𝑡 𝑈𝑆𝐷 𝑅𝑒𝑡𝑢𝑟𝑛 = 𝛼 + 𝛽1 ∗ 𝑉𝑎𝑙𝑢𝑒 +
𝛽2 ∗ 𝐼𝑛𝑡𝑒𝑟𝑒𝑠𝑡 𝑅𝑎𝑡𝑒 𝐷𝑖𝑓𝑓𝑒𝑟𝑒𝑛𝑡𝑖𝑎𝑙 + 𝛽3 ∗ 𝑀𝑜𝑚𝑒𝑛𝑡𝑢𝑚 + 𝜀
Note: All right-hand-side variables are lagged.
Econometric Model with Relative Quantitative Restraint
𝐿𝑜𝑛𝑔 𝐽𝑃𝑌, 𝑆ℎ𝑜𝑟𝑡 𝑈𝑆𝐷 𝑅𝑒𝑡𝑢𝑟𝑛 = 𝛼 + 𝛽1 ∗ 𝑉𝑎𝑙𝑢𝑒 +
𝛽2 ∗ 𝐼𝑛𝑡𝑒𝑟𝑒𝑠𝑡 𝑅𝑎𝑡𝑒 𝐷𝑖𝑓𝑓𝑒𝑟𝑒𝑛𝑡𝑖𝑎𝑙 + 𝛽3 ∗ 𝑀𝑜𝑚𝑒𝑛𝑡𝑢𝑚
+ 𝛽4 ∗ 𝑅𝑒𝑙𝑎𝑡𝑖𝑣𝑒 𝑄𝑢𝑎𝑛𝑡𝑖𝑡𝑎𝑡𝑖𝑣𝑒 𝑅𝑒𝑠𝑡𝑟𝑎𝑖𝑛𝑡 + 𝜀
Note: All right-hand-side variables are lagged.

Heckman Global Advisors A Division of DCM Advisors, LLC March 2018
8
Important Disclosures: This material has been prepared and issued by DCM Advisors, LLC (DCM), a registered investment advisor, for distribution to market professionals and institutional investor clients only. This document has been prepared for informational purposes only and is not a solicitation of any offer to buy or sell any security, commodity, futures contract or instrument or related derivative (hereinafter "instrument") or to participate in any trading strategy. Any such offer would be made only after a prospective participant had completed its own independent investigation of the instrument or trading strategy and received all information it required to make its own investment decision, including, where applicable, a review of any prospectus, prospectus supplement, offering circular or memorandum describing such instrument or trading strategy. This material does not provide individually tailored investment advice or offer tax, regulatory, accounting or legal advice. The securities discussed in this material may not be suitable or appropriate for all investors. Prior to entering into any proposed transaction, recipients should determine, in consultation with their own investment, legal, tax, regulatory and accounting advisors, the economic risks and merits, as well as the legal, regulatory and accounting characteristics and consequences of the transaction. You should consider this material among other factors in making an investment decision. This information is not intended to be provided and may not be used by any person or entity in any jurisdiction where the provision or use thereof would be contrary to applicable laws, rules or regulations. Any securities referred to in this material may not have been registered under the U.S. Securities Act of 1933, as amended, and, if not, may not be offered or sold absent an exemption therefrom. The information contained herein is intended for informational purposes only and has been obtained from sources believed to be reliable, but is not necessarily complete and its accuracy cannot be guaranteed. The comments contained herein are opinions and may not represent the opinions of DCM and are subject to change without notice. It should not be assumed that any recommendations incorporated herein will be profitable, will equal past performance or will achieve same or similar results. The country allocations recommended herein are solely those of the Heckman Global Advisors (HGA) division of DCM and may differ from those of other business units of DCM. The countries mentioned herein are covered by our proprietary top-down country allocation model and are included, together with any rankings and/or weightings, for illustrative purposes only. The representative countries and related information are subject to change at any time and are not intended as a specific recommendation for investment. Foreign securities can be subject to greater risks than U.S. investments, including currency fluctuations, less liquid trading markets, greater price volatility, political and economic instability, less publicly available information, and changes in tax or currency laws or monetary policy. These risks are likely to be greater for emerging markets than in developed markets. Certain investments may invest in derivatives, which may increase volatility of its net asset value and may result in a loss. Model, back-tested or hypothetical performance information and results do not reflect actual trading or asset or fund advisory management and the results may not reflect the impact that material economic and market factors may have had, and can reflect the benefit of hindsight, on HGA’s decision-making if HGA were actually managing client’s money. Any reference to performance information that is provided gross of fees does not reflect the deduction of management or advisory fees. Client returns will be reduced by such fees and other expenses that may be incurred in the management of the account. Advisory fees are described in Part 2A of Form ADV of DCM and its affiliated individuals may, from time to time, own, have long or short positions in, or options on, any securities discussed herein. Nothing contained herein constitutes an offer to sell or a solicitation of an offer to buy any security or an interest in any Dinosaur Capital Management LLC investment vehicle(s). Any chart, graph, or formula should not be used by itself to make any trading or investment decision. Morgan Stanley Capital International (MSCI) indexes are unmanaged market capitalization-weighted indexes. The indexes do not reflect transaction costs or management fees and other expenses. MSCI index returns are calculated with dividends reinvested. Unlike the indices, the strategies described are actively managed and may have volatility, investment and other characteristics that differ from the benchmark index. Source: MSCI. Pursuant to our agreement with MSCI, the MSCI information may only be used for your internal use, may not be reproduced or re-disseminated in any form and may not be used to create any financial instruments or products or any indices. The MSCI information is provided on an “as is” basis and the user of this information assumes the entire risk of any use it may make or permit to be made of this information. Neither MSCI, any of its affiliates or any other person involved in or related to compiling, computing or creating the MSCI information (collectively, the “MSCI Parties”) makes any express or implied warranties or representations with respect to such information or the results to be obtained by the use thereof, and the MSCI Parties hereby expressly disclaim all warranties (including, without limitation, all warranties of originality, accuracy, completeness, timeliness, non-infringement, merchantability and fitness for a particular purpose) with respect to this information. Without limiting any of the foregoing, in no event shall any MSCI Party have any liability for any direct, indirect, special, incidental, punitive, consequential or any other damages (including, without limitation, lost profits) even if notified of, or if it might otherwise have anticipated, the possibility of such damages.