Quantitative detection of bubble dynamics by Doppler ... ultrasound.pdf · Quantitative detection...
15
Int. J. Functional Informatics and Personalised Medicine, Vol. 2, No. 4, 2009 379 Copyright © 2009 Inderscience Enterprises Ltd. Quantitative detection of bubble dynamics by Doppler ultrasound Yufeng Zhou Department of Medicine, Division of Gastroenterology, University of Washington, Seattle, Washington 98195, USA Fax: 206-221-2331 E-mail: [email protected] Abstract: Bubble cavitation is one of the major mechanisms for ultrasound-induced bioeffects. Characterising the bubble dynamics, expansion and collapse, is of importance in understanding the cavitation phenomenon and estimating the consequent outcome. In this study, Doppler ultrasound method was firstly used to measure the bubble wall velocity. Bubbles were generated in water using a beam of high-intensity focused laser light or inside a vessel phantom using a shock wave generator. Agreement was found between the determination by high-speed photographs and Doppler method. Overall, it is suggested that Doppler ultrasound could be a noninvasive method of quantitatively detecting bubble dynamics in vivo. Keywords: bubble dynamics; Doppler ultrasound; high-speed imaging; backscattering signal. Reference to this paper should be made as follows: Zhou, Y. (2009) ‘Quantitative detection of bubble dynamics by Doppler ultrasound’, Int. J. Functional Informatics and Personalised Medicine, Vol. 2, No. 4, pp.379–393. Biographical notes: Yufeng Zhou is a Research Scientist at the University of Washington. He received his PhD Degree in bioacoustics from Duke University (2003). His research interests include bubble dynamics, therapeutic ultrasound technology (shock wave lithotripsy for stone treatment, high-intensity focused ultrasound for solid tumour/cancer ablation, ultrasound-enhanced drug delivery, shock wave therapy), non-destructive evaluation, and acoustic wave propagation. 1 Introduction Ultrasound has been used in clinical diagnosis for four decades because of its low cost and non-ionisation, especially for foetus (Szabo, 2004). According to the regulation of the Food and Drug Administration (FDA) of the USA the temporal-averaged acoustic intensity of diagnostic ultrasound should be no higher than 720 mW/cm 2 . In recent years medical ultrasound has taken on a new life in several therapeutic applications by increasing the acoustic intensity to 1∼20,000 W/cm 2 , such as Shock Wave Lithotripsy (SWL) in breaking kidney stones (Lingeman et al., 2003), High-Intensity Focused
Transcript of Quantitative detection of bubble dynamics by Doppler ... ultrasound.pdf · Quantitative detection...

Int. J. Functional Informatics and Personalised Medicine, Vol. 2, No. 4, 2009 379
Copyright © 2009 Inderscience Enterprises Ltd.
Quantitative detection of bubble dynamics by Doppler ultrasound
Yufeng Zhou Department of Medicine, Division of Gastroenterology, University of Washington, Seattle, Washington 98195, USA Fax: 206-221-2331 E-mail: [email protected]
Abstract: Bubble cavitation is one of the major mechanisms for ultrasound-induced bioeffects. Characterising the bubble dynamics, expansion and collapse, is of importance in understanding the cavitation phenomenon and estimating the consequent outcome. In this study, Doppler ultrasound method was firstly used to measure the bubble wall velocity. Bubbles were generated in water using a beam of high-intensity focused laser light or inside a vessel phantom using a shock wave generator. Agreement was found between the determination by high-speed photographs and Doppler method. Overall, it is suggested that Doppler ultrasound could be a noninvasive method of quantitatively detecting bubble dynamics in vivo.
Keywords: bubble dynamics; Doppler ultrasound; high-speed imaging; backscattering signal.
Reference to this paper should be made as follows: Zhou, Y. (2009) ‘Quantitative detection of bubble dynamics by Doppler ultrasound’, Int. J. Functional Informatics and Personalised Medicine, Vol. 2, No. 4, pp.379–393.
Biographical notes: Yufeng Zhou is a Research Scientist at the University of Washington. He received his PhD Degree in bioacoustics from Duke University (2003). His research interests include bubble dynamics, therapeutic ultrasound technology (shock wave lithotripsy for stone treatment, high-intensity focused ultrasound for solid tumour/cancer ablation, ultrasound-enhanced drug delivery, shock wave therapy), non-destructive evaluation, and acoustic wave propagation.
1 Introduction
Ultrasound has been used in clinical diagnosis for four decades because of its low cost and non-ionisation, especially for foetus (Szabo, 2004). According to the regulation of the Food and Drug Administration (FDA) of the USA the temporal-averaged acoustic intensity of diagnostic ultrasound should be no higher than 720 mW/cm2. In recent years medical ultrasound has taken on a new life in several therapeutic applications by increasing the acoustic intensity to 1∼20,000 W/cm2, such as Shock Wave Lithotripsy (SWL) in breaking kidney stones (Lingeman et al., 2003), High-Intensity Focused

380 Y. Zhou
Ultrasound (HIFU) in thermal ablation for cancer/tumour (Rebillard et al., 2008; ter Haar and Coussios, 2007; Wu et al., 2005), Shock Wave Therapy (SWT) for bone fracture and musculoskeletal disease (Haake et al., 2003; Wang, 2003), ultrasound enhanced transdermal drug delivery (Mitragotri et al., 1995), and sonoporation for drug delivery or gene transfection to cells (Bao et al., 1997). FDA has already approved some of them for clinical use, whereas others are at various stages of development.
The major mechanisms of the ultrasound therapy include the thermal effects due to the absorption of acoustic energy in tissue and the mechanical effects such as bubble cavitation, shear stress, microstreaming, and radiation force (Bailey et al., 2003). Bubble cavitation, the nucleation, growth, and oscillation of gaseous cavities, is found to be the most significant non-thermal effect of ultrasound exposure (AIUM, 2000). Cavitation involves either rapid growth or collapse of bubbles (inertial cavitation) or sustained oscillatory motion of bubbles (stable cavitation) (Crum, 1988; Flynn, 1964). Both types of cavitation induce obvious physical, chemical, and biological effects (Deng et al., 2004; Kim et al., 1996; Wu, 2002). Therefore, quantitative detection of bubble dynamics can evaluate both the quantity and the quality of ultrasound therapy. However, due to the short lifespan and rapid dynamics of bubble cavitation in tissue, detecting bubble dynamics and measuring bubble wall velocity profile are of difficulty, but in a great need.
Currently, there are several methods available of detecting bubble dynamics. High-speed photography with sufficient magnification and contrast provides straightforward evidence of bubble expansion, oscillation, and collapse either by using stroboscopic reconstruction method (Zhou et al., 2005) or by using a multi-frame camera (Sankin et al., 2005). The detectable bubble is limited by not only the image resolution but also its quality. Another popular optical method is light scattering/transmission, which is easy to set up and sensitive for much smaller bubbles (Zhou et al., 2005). However, optic light has limited penetration in tissue, and thus both of these methods are only available in vitro. It is noticed that ultrasound could be used to detect bubble activities in vivo. Ultrasound method is noninvasive and can provide a good tradeoff between penetration depth and spatial resolution. The Active Cavitation Detection (ACD), such as diagnostic B-mode imaging, has a high echogenicity (hyperecho) in the specific region, where air bubbles are produced (Kuwahara et al., 1989). The Passive Cavitation Detection (PCD) is using a focused transducer whose focal point is aligned to the Region of Interest (ROI) to measure acoustic signals, including the scattering signal from bubble and those produced by the bubble oscillation (Cleveland et al., 2000; Coleman et al., 1992). However, both ACD and PCD show the existence of the bubble cavitation, but provide little information of the bubble dynamics.
Doppler ultrasound is a noninvasive test that employs the Doppler effect to assess whether structures (usually blood) are moving towards or away from the probe, and its relative velocity by analysing high-frequency ultrasound burst off red blood cells (Szabo, 2004). It is particularly useful in cardiovascular studies and essential in many areas such as determining reverse blood flow in the liver vasculature in portal hypertension. Because of the high velocities of bubble wall and the unique characteristics of both expansion and collapse in inertial cavitation, these Doppler signals associated with oscillating bubbles could be easily separated from the background noise, such as the tissue vibration caused by the ultrasound radiation force and blood circulation. Therefore, Doppler ultrasound method may provide satisfactory signal-to-noise ratio and

Quantitative detection of bubble dynamics by Doppler ultrasound 381
high sensitivity in vivo. In this study, Doppler ultrasound technique was firstly used to detect the frequency shift in the backscattering signal associated with bubble dynamics. Bubbles were produced either in a free field by a short high-intensity focused laser beam or inside a vessel phantom by a shock wave generator. Gradient zero-crossing and Short-Time Fourier Transform (STFT) methods were applied to analyse the backscattering signal. Good agreement was found between the photographic observation and Doppler ultrasound measurement. In addition, the proposed protocol is compatible with current medical ultrasound diagnostic instrument for real-time monitoring. Altogether, the Doppler ultrasound may be an excellent modality of quantitatively detecting bubble dynamics in vivo.
2 Methods
2.1 Laser-generated single bubble in water
In this experiment, a single large bubble was generated in water by focusing a high-intensity beam (see Figure 1(a)) from a Q-switched neogymium doped yttrium aluminum garnet (Nd:YAG) laser with a wavelength of 1064 nm, a pulse duration of ∼5 ns, and maximum energy of 200 mJ (Tempest 10, New Wave Research, Sunnyvale, CA). The short-pulse laser light was reflected by a mirror and then collimated and focused by a customer-designed cylinder consists of two bi-convex optic lenses (focal length and diameter are 12.7 mm and 6.35 mm, and 250 mm and 50.8 mm, respectively, Newport, Irvine, CA). The focusing cylinder was water-proof and its front end was immersed in water (Sankin et al., 2005). The water in the tank was degassed for at least 20 min with oxygen concentration less than 4 mg/L and the laser exposure rate was no faster than 0.1 Hz. Before each exposure any visible bubble on the surface of the focusing lens will be carefully removed in order to avoid the damage to optical components.
Figure 1 Schematic diagram of the experimental setup of (a) generating a single bubble in water by a high-intensity focused laser light, capturing bubble dynamics using high-speed shadowgraph, and (b) detecting the backscattering signal from the bubble using Doppler ultrasound simultaneously. Ultrasound transducer was aligned confocally with the optic focusing (see online version for colours)
(a)

382 Y. Zhou
Figure 1 Schematic diagram of the experimental setup of (a) generating a single bubble in water by a high-intensity focused laser light, capturing bubble dynamics using high-speed shadowgraph, and (b) detecting the backscattering signal from the bubble using Doppler ultrasound simultaneously. Ultrasound transducer was aligned confocally with the optic focusing (see online version for colours) (continued)
(b)
2.2 Shock wave-generated intraluminal bubble
A piezoelectric shock wave generator (PiezoSon 100 with FB-12 source, Richard Wolf GmbH, Knittlingen, Germany), which is especially designed for clinical use in orthopaedics and traumatology with its innovative dual-layer design in the transducer at various frequencies (1∼4 shocks per second) and intensities (0.05–1.48 mJ/mm2), was amounted at the bottom of the testing tank and used to induce bubble dynamics inside the vessel phantom. The typical pressure waveform generated by PiezoSon 100 in water (20°C) is comprised of a leading compressive wave with a peak pressure of 39 MPa and a pulse duration of 1 µs, followed by a trailing tensile wave of –8 MPa in peak pressure and a pulse duration of ∼2 µs at the maximum output by fibre optic probe hydrophone (FOPH-500, RP Acoustics, Leutenbach, Germany). Its –6 dB beam size at the maximum output level is 1.3 × 1.3 × 4.2 mm (Sankin et al., 2005).
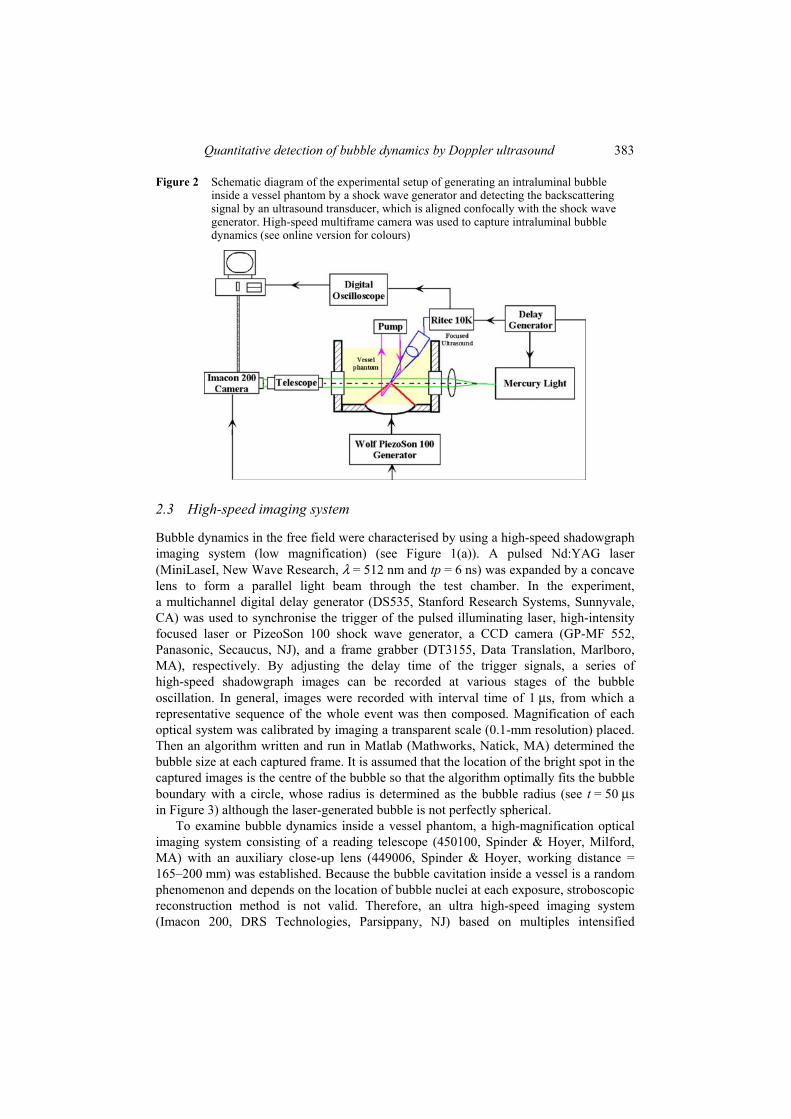
Thin-walled, Regenerated Cellulose (RC) hollow fibres of 200-mm inner diameter, taken from commercially available fibre bundles (132290, Spectrum, Gardena, CA) developed for dialysis and ultrafiltration, were used to construct vessel phantoms. The hollow fibres were cut into 70-mm long segments, and then embedded in straight connectors (E-31801-00, Cole-Parmer, Vernon Hills, IL) at both ends using fast curing epoxy. The free space between the connectors is about 34 mm, sufficiently wider than the beam diameter of the PiezoSon 100 generator. In the experiment, each fibre assembly was connected to a circulation system driven by a peristaltic pump (Model 7619-50, Cole-Parmer) operating at its lowest speed, which yields a mean flow rate of 241 mm/s. To allow a clear observation of intraluminal bubble dynamics, degassed water (O2 concentration: < 4 mg/L) containing 0.2% Definity (Lantheus Medical Imaging, N. Billerica, MA) serving as cavitation nuclei was used as the circulating fluid. The tube assembly was attached to an inverted U-shape holder fixed on a three-axis translation stage for positioning and scanning the vessel phantom in the acoustic field (see Figure 2).
Quantitative detection of bubble dynamics by Doppler ultrasound 383
Figure 2 Schematic diagram of the experimental setup of generating an intraluminal bubble inside a vessel phantom by a shock wave generator and detecting the backscattering signal by an ultrasound transducer, which is aligned confocally with the shock wave generator. High-speed multiframe camera was used to capture intraluminal bubble dynamics (see online version for colours)
2.3 High-speed imaging system
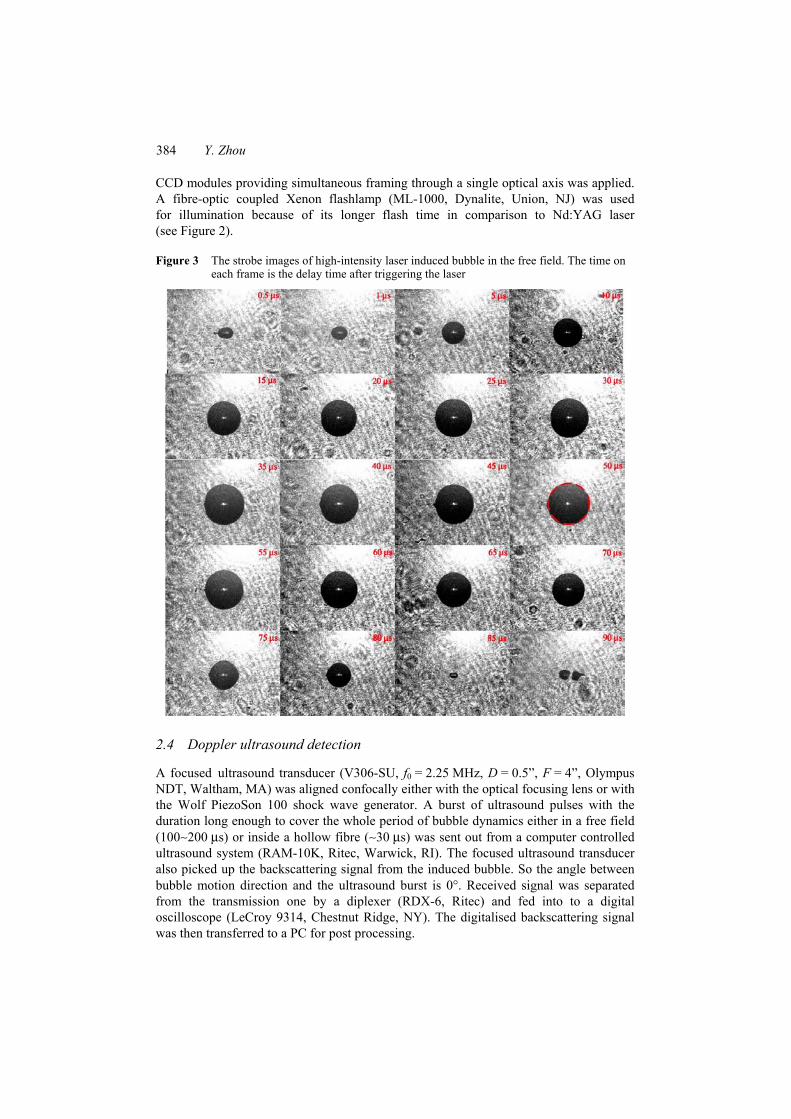
Bubble dynamics in the free field were characterised by using a high-speed shadowgraph imaging system (low magnification) (see Figure 1(a)). A pulsed Nd:YAG laser (MiniLaseI, New Wave Research, λ = 512 nm and tp = 6 ns) was expanded by a concave lens to form a parallel light beam through the test chamber. In the experiment, a multichannel digital delay generator (DS535, Stanford Research Systems, Sunnyvale, CA) was used to synchronise the trigger of the pulsed illuminating laser, high-intensity focused laser or PizeoSon 100 shock wave generator, a CCD camera (GP-MF 552, Panasonic, Secaucus, NJ), and a frame grabber (DT3155, Data Translation, Marlboro, MA), respectively. By adjusting the delay time of the trigger signals, a series of high-speed shadowgraph images can be recorded at various stages of the bubble oscillation. In general, images were recorded with interval time of 1 µs, from which a representative sequence of the whole event was then composed. Magnification of each optical system was calibrated by imaging a transparent scale (0.1-mm resolution) placed. Then an algorithm written and run in Matlab (Mathworks, Natick, MA) determined the bubble size at each captured frame. It is assumed that the location of the bright spot in the captured images is the centre of the bubble so that the algorithm optimally fits the bubble boundary with a circle, whose radius is determined as the bubble radius (see t = 50 µsin Figure 3) although the laser-generated bubble is not perfectly spherical.
To examine bubble dynamics inside a vessel phantom, a high-magnification optical imaging system consisting of a reading telescope (450100, Spinder & Hoyer, Milford, MA) with an auxiliary close-up lens (449006, Spinder & Hoyer, working distance = 165–200 mm) was established. Because the bubble cavitation inside a vessel is a random phenomenon and depends on the location of bubble nuclei at each exposure, stroboscopic reconstruction method is not valid. Therefore, an ultra high-speed imaging system (Imacon 200, DRS Technologies, Parsippany, NJ) based on multiples intensified
384 Y. Zhou
CCD modules providing simultaneous framing through a single optical axis was applied. A fibre-optic coupled Xenon flashlamp (ML-1000, Dynalite, Union, NJ) was used for illumination because of its longer flash time in comparison to Nd:YAG laser (see Figure 2).
Figure 3 The strobe images of high-intensity laser induced bubble in the free field. The time on each frame is the delay time after triggering the laser
2.4 Doppler ultrasound detection
A focused ultrasound transducer (V306-SU, f0 = 2.25 MHz, D = 0.5”, F = 4”, Olympus NDT, Waltham, MA) was aligned confocally either with the optical focusing lens or with the Wolf PiezoSon 100 shock wave generator. A burst of ultrasound pulses with the duration long enough to cover the whole period of bubble dynamics either in a free field (100∼200 µs) or inside a hollow fibre (∼30 µs) was sent out from a computer controlled ultrasound system (RAM-10K, Ritec, Warwick, RI). The focused ultrasound transducer also picked up the backscattering signal from the induced bubble. So the angle between bubble motion direction and the ultrasound burst is 0°. Received signal was separated from the transmission one by a diplexer (RDX-6, Ritec) and fed into to a digital oscilloscope (LeCroy 9314, Chestnut Ridge, NY). The digitalised backscattering signal was then transferred to a PC for post processing.

Quantitative detection of bubble dynamics by Doppler ultrasound 385
2.5 Doppler detection methods
Since the bubble dynamics in the free field or inside the vessel phantom is too rapid, Fourier transform method in conventional Doppler ultrasound to determine the target velocities would give significant systemic error. In this study two methods have been applied in analysing the backscattering signal, gradient zero-crossing and STFT. The gradient zero-crossing algorithm, a modified processing method of zero-crossing algorithm, does a gradient operation on the backscattering signal first and then detects the zero-crossing points, which is to detect the locations of each peaks and troughs in the backscattering signal. The time delay between the nearby peak and trough, ∆d(t), is used to determine the bubble velocity v(t) at time t:
0
00
12 ( )( )
fd tv t c
f
−∆= (1)
where c0 is the small amplitude sound speed in water at room temperature, f0 is the centre frequency of the transmitting ultrasound burst from focused transducer. This method is insensitive to the baseline of the backscattering signal and simple to be implemented even for the future real-time in vivo detection. However, the acoustic spikes (such as optical breakdown and bubble collapse signal in Figure 6(a)) and signals with small amplitude below a threshold will be excluded in order to reduce the outcome error. STFT is firstly breaking the discrete data into chunks or frames (which usually overlap each other, to reduce artefacts at the boundary) and then performing standard Fourier transform on each chunk, which can be expressed as:
STFT{ [ ]} ( , ) [ ] [ ]e j n
n
x n X m x n w n m ωω∞
−
= −∞
≡ = −ä (2)
where x[n]is the discrete signal, w[n] is the window signal. It provides flexible temporal resolution for both large- and small-scale applications, but relies on the variables used in the processing, such as the length of time, type of window, and the length of zeros-padding. In addition, the width of the windowing function determines whether there is good frequency resolution or good time resolution, but not both. In this study, Hamming window function with the window length of 2 µs was used and the window was shifted 0.15 µs to detect the velocity at the next temporal point.
3 Results
3.1 Bubble dynamics in the free field
The exposure of high-intensity focused laser can generate a single bubble via optical breakdown (Sankin et al., 2005). Laser exposure showed as a tiny bright spot at the focus (data not shown) and subsequently the shapes of the laser-induced plasma and bubble formation are all nearly spherical (see Figure 3). After the bubble collapse (see t = 85 µsin Figure 3), there may be several rebounds of the remaining bubble nuclei (see t = 90 µsin Figure 3), which are usually non-spherical. The laser energy level was set to be 100∼700 (10∼70% of maximum energy) because as the energy exceeds 70% multiple

386 Y. Zhou
spots of optical breakdown are observed with the location of the largest plasma shifted toward the optical lens while optical breakdown may not always occur when the energy is lower than 10%. The maximum bubble radius increased from 252 ± 46 µm to 934 ± 57 µm in the range of 10–70% energy output (see Figure 4). In addition, the measured bubble radius during the whole cavitation period can be fitted by a polynomial curve (see Figure 5). It is found that the laser-generated bubble is mostly stable and repeatable although the variation can still be figured out when the bubble reaches its maximum size and subsequently begins to shrink. The laser-generated single bubble is comparable to that in an electrohydraulic shock wave lithotripter field (about 2∼4 mm at the output voltage of 16∼24 kV), but with much higher consistency (less than 10% variation).
Figure 4 Temporal dependency of the radius of laser-generated bubble determinedby the high-speed shadowgraph (dot) and fitted by a polynomial curve (line) at laser output level of (a) 250 and (b) 700 (see online version for colours)
(a) (b)
Figure 5 The dose-dependency of the maximum bubble radius within the laser output levelfrom 100 to 700 (see online version for colours)
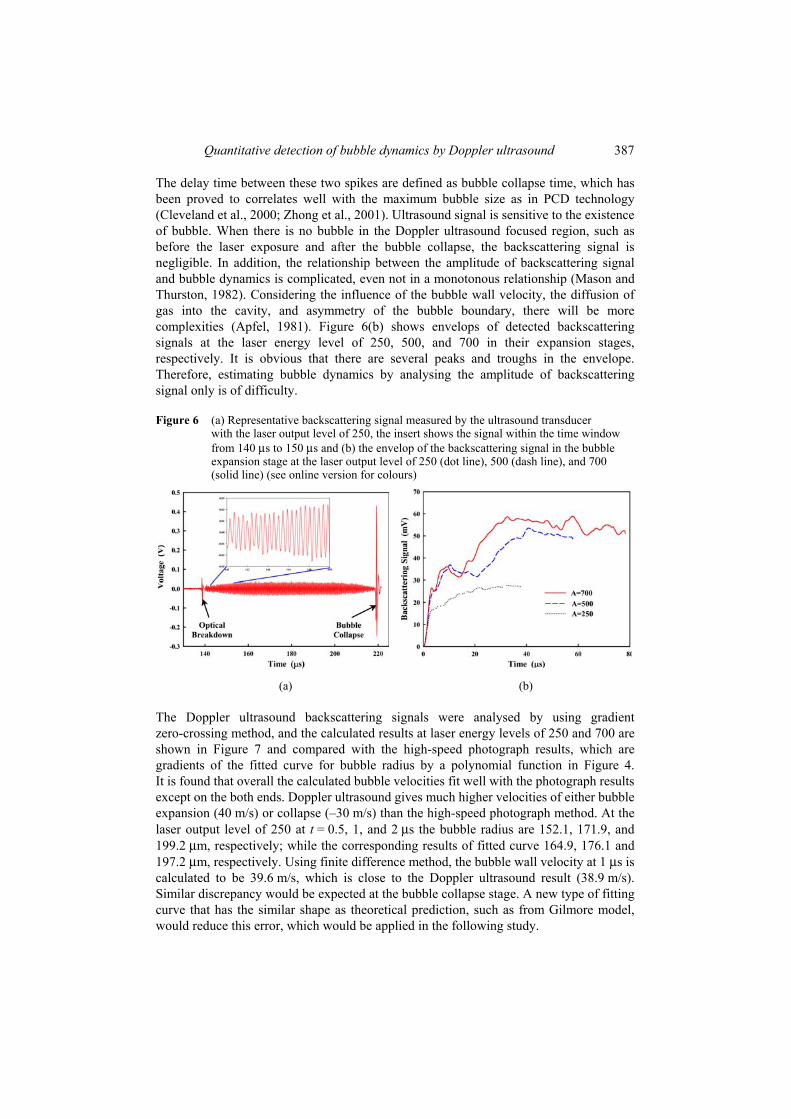
A representative backscattering ultrasound signal is shown in Figure 6(a). Two spikes in the received signal represent the optical breakdown and bubble collapse, respectively.
Quantitative detection of bubble dynamics by Doppler ultrasound 387
The delay time between these two spikes are defined as bubble collapse time, which has been proved to correlates well with the maximum bubble size as in PCD technology (Cleveland et al., 2000; Zhong et al., 2001). Ultrasound signal is sensitive to the existence of bubble. When there is no bubble in the Doppler ultrasound focused region, such as before the laser exposure and after the bubble collapse, the backscattering signal is negligible. In addition, the relationship between the amplitude of backscattering signal and bubble dynamics is complicated, even not in a monotonous relationship (Mason and Thurston, 1982). Considering the influence of the bubble wall velocity, the diffusion of gas into the cavity, and asymmetry of the bubble boundary, there will be more complexities (Apfel, 1981). Figure 6(b) shows envelops of detected backscattering signals at the laser energy level of 250, 500, and 700 in their expansion stages, respectively. It is obvious that there are several peaks and troughs in the envelope. Therefore, estimating bubble dynamics by analysing the amplitude of backscattering signal only is of difficulty.
Figure 6 (a) Representative backscattering signal measured by the ultrasound transducerwith the laser output level of 250, the insert shows the signal within the time window from 140 µs to 150 µs and (b) the envelop of the backscattering signal in the bubble expansion stage at the laser output level of 250 (dot line), 500 (dash line), and 700 (solid line) (see online version for colours)
(a) (b)
The Doppler ultrasound backscattering signals were analysed by using gradient zero-crossing method, and the calculated results at laser energy levels of 250 and 700 are shown in Figure 7 and compared with the high-speed photograph results, which are gradients of the fitted curve for bubble radius by a polynomial function in Figure 4. It is found that overall the calculated bubble velocities fit well with the photograph results except on the both ends. Doppler ultrasound gives much higher velocities of either bubble expansion (40 m/s) or collapse (–30 m/s) than the high-speed photograph method. At the laser output level of 250 at t = 0.5, 1, and 2 µs the bubble radius are 152.1, 171.9, and 199.2 µm, respectively; while the corresponding results of fitted curve 164.9, 176.1 and 197.2 µm, respectively. Using finite difference method, the bubble wall velocity at 1 µs is calculated to be 39.6 m/s, which is close to the Doppler ultrasound result (38.9 m/s). Similar discrepancy would be expected at the bubble collapse stage. A new type of fitting curve that has the similar shape as theoretical prediction, such as from Gilmore model, would reduce this error, which would be applied in the following study.

388 Y. Zhou
Figure 7 Comparison of the bubble velocity detected by Doppler ultrasound (dot) and high-speed shadowgraph (line) at the laser output level of (a) 250 and (b) 700 (see online version for colours)
(a) (b)
3.2 Intraluminal bubble dynamics
After the passage of shock front the bubble nuclei (microbubbles of the ultrasound contrast agent) inside the circulating fluid through the vessel phantom will expand, establish the contact with the vessel, dilate the vessel wall, and then collapse (Zhong et al., 2001). In comparison to the intraluminal bubble generated by an experimental shock wave lithotripter, Dornier XL-1 (Dornier MedTech, Kennesaw, GA), those observed in this study were much smaller and the dilation on the vessel wall was not so significant, which may be due to the incorrect triggering on the dual-layer piezoelectric transducer of PiezoSon 100. The two-layer shock wave source consists of two piezo-ceramic layers arranged one above the other, which are excited separately by a high-voltage pulse generator. Only correct delay time between the two layers would guarantee the cumulative energy at the focus. In addition, the multi-cycles pulse waveform generated by the piezoelectric materials because of the reverberation from both ends instead of a single pulse by electrohydraulic method of a short underwater spark discharge may limit the bubble expansion although with comparable pressure amplitude, which is one of the reasons why electrohydraulic lithotripter has the poorest performance in all commercial types (Lingeman et al., 2003). From the high-speed images it is found that bubble expansion and collapse begin at about 53 µs and 62 µs, respectively. The number and locations of the induced intraluminal bubbles are random according to the experimental observation. Because of the limited magnification and resolution of the shadowgraphy system, the bubble boundary cannot be determined as in the free field. After the bubble collapse, several rebounds and recollapses from the remaining bubble nuclei (see t = 63 µs in Figure 8) could also occur.
Backscattering ultrasound signal from the hollow fibre can always be picked up even with the absence of intraluminal bubbles. So the delay time between the trigger of shock wave generator and transmission of Doppler ultrasound burst should be carefully selected to cover the whole period of intraluminal bubble dynamics. A representative backscattering signal is shown in Figure 9(a). The shock wave-induced intraluminal bubbles will not increase the amplitude of backscattering signal and no significant spikes

Quantitative detection of bubble dynamics by Doppler ultrasound 389
associated with the bubble initial production and collapse were detected as in the free field (see Figure 6(a)) although the temporal location of the bubble collapse could also be figured out (see Figure 9(a)). In the bubble expansion and collapsing stage most of velocities detected by both gradient zero-crossing algorithm and STFT method are correspondingly positive and negative, respectively, although the systemic error was higher than that in the free field (see Figure 9(b) and (c)).
Figure 8 The multiframe images of bubble dynamics inside a vessel phantom inducedby a shock wave generator. The time on each frame is the delay time after triggering the shock wave generator
Figure 9 (a) Representative backscattering signal from intraluminal bubbles, and the calculated bubble velocity using; (b) gradient zero-crossing algorithm and (c) short-time Fourier transform method (see online version for colours)
(a) (b)

390 Y. Zhou
Figure 9 (a) Representative backscattering signal from intraluminal bubbles, and the calculated bubble velocity using; (b) gradient zero-crossing algorithm and (c) short-time Fourier transform method (see online version for colours) (continued)
(c)
4 Discussion and conclusion
Ultrasound-induced biological, physical, or chemical effects are found correlate well with the dose of bubble cavitation. Tissue injuries in SWL are primarily vascular lesions, characterised by extensive damage of the endothelial cells and mechanical rupture of small blood vessels. By using high-speed photography it is found that shock wave-induced intraluminal bubble dynamics is an important contributory factor for tissue injury in SWL (Zhong et al., 2001). Quantitative assessment of bubble dynamics would be helpful in evaluating SWL-induced vascular rupture and consequent chronic renal malfunction. In this study, Doppler ultrasound technique was firstly used to quantitatively detect bubble dynamics. Velocities of bubble expansion and collapse in the free field and inside the hollow fibre were determined from the backscattering signal. Doppler results were found to correlate well with the dynamics measured by high-speed photographs. Overall, it is suggested that Doppler ultrasound would be a new and effective tool in monitoring bubble dynamics in the ultrasound application.
Doppler ultrasound usually is used to monitor the blood flow in clinics. The velocity of blood flow varies from about 0.5 m/s to 5 m/s (Szabo, 2004), depending on the size of the vascular vessel, and the heart rate of normal human is ∼1 beat per second. In comparison, the expanding and collapsing velocities of bubble are much higher in amplitude and the bubble cavitation phenomenon is shorter in time (up to a few hundred microseconds). The maximum bubble wall velocity detected in this study in the free field was about 40 m/s, which is close to the theoretical estimation for an electrohydraulic lithotripter using Gilmore model (Zhong et al., 2001). Therefore, the conventional Doppler ultrasound analysis method, Fast Fourier Transform (FFT), on the backscattering signal, may under-estimate the bubble wall velocity because FFT needs at least a few cycles of signals in analysis and provides the averaged velocity during the selected sampling window. Zero-crossing algorithm is a simple method of analysing frequency shift in real time. However, it is found that the baseline of the backscattering signal,

Quantitative detection of bubble dynamics by Doppler ultrasound 391
which may be due to the transmitted ultrasound burst or the low-frequency response of the detecting system, has great effect on the calculation results. So a modified version, gradient zero-crossing algorithm, was developed to calculate the delay time between nearby peak and trough. This modification reduces the influence of environmental noise on algorithm performance and keeps the advantage of simple operation for future real-time processing. STFT was also applied in this study on bubble dynamics both in the free field (data not shown) and inside the hollow fibre. Different types of window function (such as rectangular, Hann, and Blackman) were applied, but no significant differences were found (data not shown). The performance of STFT was similar to gradient zero-crossing algorithm in this study (see Figure 9(c)) although more complexity in calculation. So it may not have advantage in real-time application.
Multiple bubbles rather than a single one are often produced in the high-intensity ultrasound field. Individual bubble may have unique characteristic. If two bubbles are close to each other, coalescence may occur. The merged bubble has larger size, longer bubble cavitation time, and consequently stronger cavitation strength. In PCD measurement, the spectra amplitude within a range between two harmonic components or at very high frequency (such as at 20 MHz while the driving frequency is around 1 MHz) was used to represent the cavitation strength in ROI, which is from a mixture of bubbles with various sizes. However, little information of the dynamics of individual one can be provided. In this study, since the –6 dB beam width of the focused ultrasound transducer is quite large (5.5 mm), the backscattering signals from all of those induced bubbles with different dynamic characteristics were picked up by the Doppler ultrasound. Therefore, the calculated velocity profile has multiple peaks and troughs (Figure 9(b) and (c)) instead of a single ‘cotangent-shape’ curve in the free field (Figure 7). How to separate and analyse backscattering signals from multiple bubbles will be investigated in the following study. Furthermore, Doppler ultrasound may also be used to observe the bubble coalescence, the distortion of bubble near either a soft or a hard boundary, and the formation of microjet when external force applied on the cavitation bubble (Apfel, 1981; Crum, 1988).
Although the preliminary results are encouraging, further investigation of this novel technique, especially in vivo trial, such as in small animal of rabbit and mouse, are necessary to completely evaluate its performance. In animal experiment how to enhance systemic signal-to-noise ratio would be of importance in analysing the backscattering signal and calculating velocity profile. Since bubble dynamics is a rapid phenomenon the duration of the ultrasound burst should be sufficiently long to cover the whole cavitation process, arriving ROI before the bubbles being generated and terminating until cavitation ends. As a result, the axial resolution would be poor, which is determined by the burst duration. One possible solution would be analysing Doppler ultrasound signals from an array of receivers with appropriate beam-forming algorithm, which increases both the cost and the complexity of the detection system. In summary, Doppler ultrasound is a noninvasive method and could provide quantitative detection on bubble dynamics.
ReferencesAIUM (2000) ‘Mechanical bioeffects from diagnostic ultrasound: American Institute of Ultrasound
in Medicine consensus statements’, Journal of Ultrasound in Medicine, Vol. 19, pp.69–72. Apfel, R.E. (1981) ‘Acoustic cavitation, ultrasonics’, in Edmonds, P.D. (Ed.), Academic Press,
New York, pp.355–411.

392 Y. Zhou
Bailey, M.R., Khokhlova, V.A., Sapozhnikov, O.A., Kargl, S.G. and Crum, L.A. (2003) ‘Physical mechanism of the therapeutic effect of ultrasound (a review)’, Acoustical Physics,Vol. 49, pp.369–388.
Bao, S.P., Thrall, B.D. and Miller, D.L. (1997) ‘Transfection of a reporter plasmid into cultured cells by sonoporation in vitro’, Ultrasound in Medicine and Biology, Vol. 23, pp.953–959.
Cleveland, R.O., Sapozhnikov, O.A., Bailey, M.R. and Crum, L.A. (2000) ‘A dual passive cavitation detector for localized detection of lithotripsy-induced cavitation in vitro,’ Journal of the Acoustical Society of America, Vol. 107, pp.1745–1758.
Coleman, A.J., Choi, M.J., Saunders, J.E. and Leighton, T.G. (1992) ‘Acoustic emission and sonoluminescence due to cavitation at the beam focus of an electrohydraulic shock wave lithotripter’, Ultrasound in Medicine and Biology, Vol. 18, pp.267–281.
Crum, L.A. (1988) ‘Cavitation microjets as a contributory mechanism for renal calculi disintegration in ESWL’, Journal of Urology, Vol. 140, pp.1587–1590.
Deng, C.X., Sieling, F., Pan, H. and Cui, J.M. (2004) ‘Ultrasound-induced cell membrane porosity’, Ultrasound in Medicine and Biology, Vol. 30, pp.519–526.
Flynn, H.G. (1964) Physics of Acoustic Cavitation in Liquids, Academic Press, New York. Haake, M., Buch, M., Schoellner, C., Goebel, F., Vogel, M., Mueller, I., Hausdorf, J.,
Zamzow, K., Schade-Brittinger, C. and Mueller, H.H. (2003) ‘Extracorporeal shock wave therapy for plantar fasciitis: randomised controlled multicentre trial’, British Medical Journal,Vol. 327, p.7406.
Kim, H.J., Greenleaf, J.F., Kinnick, R.R., Bronk, J.T. and Bolander, M.E. (1996) ‘Ultrasound-mediated transfection of mammalian cells’, Human Gene Therapy, Vol. 7, pp.1339–1346.
Kuwahara, M., Ioritani, N., Kamke, K., Shirai, S., Taguchi, K., Saitoh, T., Orikasa, S., Takayama, K., Aida, S. and Iwama, N. (1989) ‘Hyperechoic region induced by focued shock waves in vitro and in vivo: possibility of acoustic cavitation bubbles’, Journal of Lithotripsy Stone Disease, Vol. 1, pp.218–288.
Lingeman, J.E., Kim, S.C., Kuo, R.L., McAteer, J.A. and Evan, A.P. (2003) ‘Shockwave lithotripsy: anecdotes and insigts’, J. Endourol., Vol. 17, p.687.
Mason, W.P. and Thurston, R.N. (1982) Physical Acoustics: Principles and Methods, Academic Press, New York.
Mitragotri, S., Edwards, D.A., Blankschtein, D. and Langer, R. (1995) ‘A mechanistic study of ultrasonically-enhanced transdermal drug delivery’, Journal of Pharmaceutical Sciences,Vol. 84, pp.697–706.
Rebillard, X., Soulié, M., Chartier-Kastler, E., Davin, J.L., Mignard, J.P., Moreau, J.L. and Coulange, C. (2008) ‘High-intensity focused ultrasound in prostate cancer: a systematic literature review of the French Association of Urology’, British Journal of Urology, Vol. 101, pp.1205–1213.
Sankin, G.N., Simmons, W.N., Zhu, S.L. and Zhong, P. (2005) ‘Shock wave interaction with laser-generated single bubbles’, Physical Review Letters, Vol. 95, p.034501.
Szabo, T.L. (2004) Diagnostic Ultrasound Imaging: Inside Out, Elsevier Academic Press, London.
ter Haar, G. and Coussios, C. (2007) ‘High intensity focused ultrasound: physical principles and devices’, International Journal of Hyperthermia, Vol. 23, pp.89–104.
Wang, C.J. (2003) ‘An overview of shock wave therapy in musculoskeletal disorders’, Chang Gung Med J., Vol. 26, pp.220–230.
Wu, F., Wang, Z.B., Zhu, H., Chen, W.Z., Zou, J.Z., Bai, J., Li, K.Q., Jin, C.B., Xie, F.L. and Su, H.B. (2005) ‘Feasibility of US-guided high-intensity focused ultrasound treatment in patients with advanced pancreatic cancer: initial experience’, Radiology, Vol. 236, pp.1034–1040.

Quantitative detection of bubble dynamics by Doppler ultrasound 393
Wu, J.R. (2002) ‘Theoretical study on shear stress generated by microstreaming surrounding contrast agents attached to living cells’, Ultrasound in Medicine and Biology, Vol. 28, pp.125–129.
Zhong, P., Zhou, Y.F. and Zhu, S.L. (2001) ‘Dynamics of bubble oscillation in constrained media and mechanisms of vessel rupture in SWL’, Ultrasound in Med. and Biol., Vol. 27, pp.119–134.
Zhou, Y.F., Qin, J. and Zhong, P. (2005) ‘The characteristics of cavitation bubble induced by the secondary shock wave in an HM-3 lithotripter and its effect on stone comminution’, in Clement, G.T., McDannold, N.J. and Hynynen, K. (Eds.): 5th International Symposium on Therapeutic Ultrasound, American Institute of Physics, Boston, MA, pp.298–302.