Quantitative Analysis of Propagation Characteristics for ...
6
University of Nebraska - Lincoln University of Nebraska - Lincoln DigitalCommons@University of Nebraska - Lincoln DigitalCommons@University of Nebraska - Lincoln Faculty Publications in Computer & Electronics Engineering (to 2015) Electrical & Computer Engineering, Department of 2011 Quantitative Analysis of Propagation Characteristics for Mobile Quantitative Analysis of Propagation Characteristics for Mobile WiMAX WiMAX Pradhumna Shrestha University of Nebraska Lincoln Puttipong Mahasukhon University of Nebraska-Lincoln, [email protected] Michael Hempel University of Nebraska Lincoln, [email protected] Tao Ma University of Nebraska Lincoln, [email protected] Hamid Sharif University of Nebraska-Lincoln, [email protected] Follow this and additional works at: https://digitalcommons.unl.edu/computerelectronicfacpub Part of the Computer Engineering Commons Shrestha, Pradhumna; Mahasukhon, Puttipong; Hempel, Michael; Ma, Tao; and Sharif, Hamid, "Quantitative Analysis of Propagation Characteristics for Mobile WiMAX" (2011). Faculty Publications in Computer & Electronics Engineering (to 2015). 96. https://digitalcommons.unl.edu/computerelectronicfacpub/96 This Article is brought to you for free and open access by the Electrical & Computer Engineering, Department of at DigitalCommons@University of Nebraska - Lincoln. It has been accepted for inclusion in Faculty Publications in Computer & Electronics Engineering (to 2015) by an authorized administrator of DigitalCommons@University of Nebraska - Lincoln.
Transcript of Quantitative Analysis of Propagation Characteristics for ...

University of Nebraska - Lincoln University of Nebraska - Lincoln
DigitalCommons@University of Nebraska - Lincoln DigitalCommons@University of Nebraska - Lincoln
Faculty Publications in Computer & Electronics Engineering (to 2015)
Electrical & Computer Engineering, Department of
2011
Quantitative Analysis of Propagation Characteristics for Mobile Quantitative Analysis of Propagation Characteristics for Mobile
WiMAX WiMAX
Pradhumna Shrestha University of Nebraska Lincoln
Puttipong Mahasukhon University of Nebraska-Lincoln, [email protected]
Michael Hempel University of Nebraska Lincoln, [email protected]
Tao Ma University of Nebraska Lincoln, [email protected]
Hamid Sharif University of Nebraska-Lincoln, [email protected]
Follow this and additional works at: https://digitalcommons.unl.edu/computerelectronicfacpub
Part of the Computer Engineering Commons
Shrestha, Pradhumna; Mahasukhon, Puttipong; Hempel, Michael; Ma, Tao; and Sharif, Hamid, "Quantitative Analysis of Propagation Characteristics for Mobile WiMAX" (2011). Faculty Publications in Computer & Electronics Engineering (to 2015). 96. https://digitalcommons.unl.edu/computerelectronicfacpub/96
This Article is brought to you for free and open access by the Electrical & Computer Engineering, Department of at DigitalCommons@University of Nebraska - Lincoln. It has been accepted for inclusion in Faculty Publications in Computer & Electronics Engineering (to 2015) by an authorized administrator of DigitalCommons@University of Nebraska - Lincoln.
Abstract— In wireless networks, careful planning and link budget analysis is required for delivering maximum throughput reliably with minimum overhead. The efficiency of planning and eventual network performance is totally dependent upon the accuracy and quality of data used for analysis. In most studies, computer simulations and analytical models are used for generating such data. However these simulations are limited to many assumptions which are different from the actual implemented hardware, therefore, the data generated are not accurate. In this paper, we analyze the performance of Mobile WiMAX utilizing the empirical data measured from leading WiMAX equipment. We believe this data can be used to predict an accurate and reliable throughput and link budget in WiMAX networks.
Index Terms— Mobile WiMAX, Throughput, Error, Latency
I. INTRODUCTION Our team at the Advanced Telecommunications
Engineering Laboratory at the University of Nebraska-Lincoln has been actively involved in the feasibility study and design of wireless communications infrastructure, mainly for railroad environments [1, 2, 3, 4, 5]. An essential part of designing any network is planning and link budget analysis. For maintaining quality and keeping costs reasonable, several performance parameters must be considered for analysis like throughput and signal strength. These parameters directly affect the number and location of base stations, the coverage of each base station and the number of subscribers it can reliably support.
There are several ways of estimating these unknown parameters. Computer simulations based on analytical models have been popularly used for estimating performance of communication equipments. However such simulations oftentimes use unrealistic assumptions and the output data generated are thus also idealized and impractical, especially for large networks over long distances.
Mobile WiMAX [6] has emerged as a popular broadband solution for networks. Mahasukhon et. al. discussed the physical and MAC layers of Mobile WiMAX in [4], showing its advantages. However, a thorough investigation of essential performance parameters of Mobile WiMAX devices is absent. In [7], the authors emphasize on the need of real-life tests of
WiMAX devices and present some data rate results. However, they have not explored any parameters except for throughput and it is difficult to generalize their results. In [8], the authors have reported some field test results but their results are not comprehensive and do not account for different environments that communication networks operate in.
In this paper, we present the performance parameters of Mobile WiMAX equipment under real-world conditions. The rest of the paper is structured in the following manner. Section II specifies the equipments and the conditions used for testing. Section III describes the experiments performed. Section IV shows the results of the experiments. Finally, Section V concludes the paper.
II. EQUIPMENT AND TEST CONDITIONS In this section, our WiMAX platform including the
network topology and equipment for a base station and mobile units are discussed.
A. Mobile WiMAX Equipment We used BreezeMAX Macro Outdoor [9] as the base
station. It is an all-outdoor, Mobile WiMAX 802.16e certified base station for wireless access. It uses advanced MIMO and beamforming technologies to ensure maximum resource utilization. Similarly, we used Open Range Communication, Inc.’s Mobile WiMAX Wireless Broadband Access Subscriber Station [10] at the subscriber end. Both devices provide a Mobile WiMAX 802.16e-2005 Wave2 compliant air interface for communication. The base and subscriber stations are shown in Figures 1 and 2, respectively.
B. Channel Emulator We used the ACE-400WB [11], a Wireless Channel
Emulator from Azimuth Systems, to emulate channels for our experiments.
Using a channel emulator, rather than transmitting over the air, is a very efficient way of testing communication devices. When we transmit over the air, there are several parameters beyond our control which affect the system and the outcome of the tests. Also, these parameters may or may not be present in actual real-world deployment locations or may present differently than in a field test location. Also it is impossible to ascertain which aspects of the performance, and to what extent, was affected by these uncontrollable parameters since they cannot be isolated. The channel emulator allows us to recreate real-world parameters, individually and one at a time, so that we are able to investigate the affect of a particular channel parameter and finally realize the real-world channel
This project was funded in part by the Federal Railroad Administration and Open Range Communications Inc. 978-1-4577-0161-0/11/$26.00 ©2011 IEEE
Quantitative Analysis of Propagation Characteristics for Mobile WiMAX
Pradhumna Lal Shrestha, Puttipong Mahasukhon, Michael Hempel, Tao Ma and Hamid Sharif Computer and Electronics Engineering Department
University of Nebraska – Lincoln, Omaha, NE 68182, USA {plshrestha, pmahasukhon, mhempel, tma, hsharif }@unlnotes.unl.edu
Wireless Telecommunications Symposium (WTS), 2011 doi: 10.1109/WTS.2011.5960861
the equipment would eventually work under. It also provides the ability to recreate test conditions every time a test is performed.
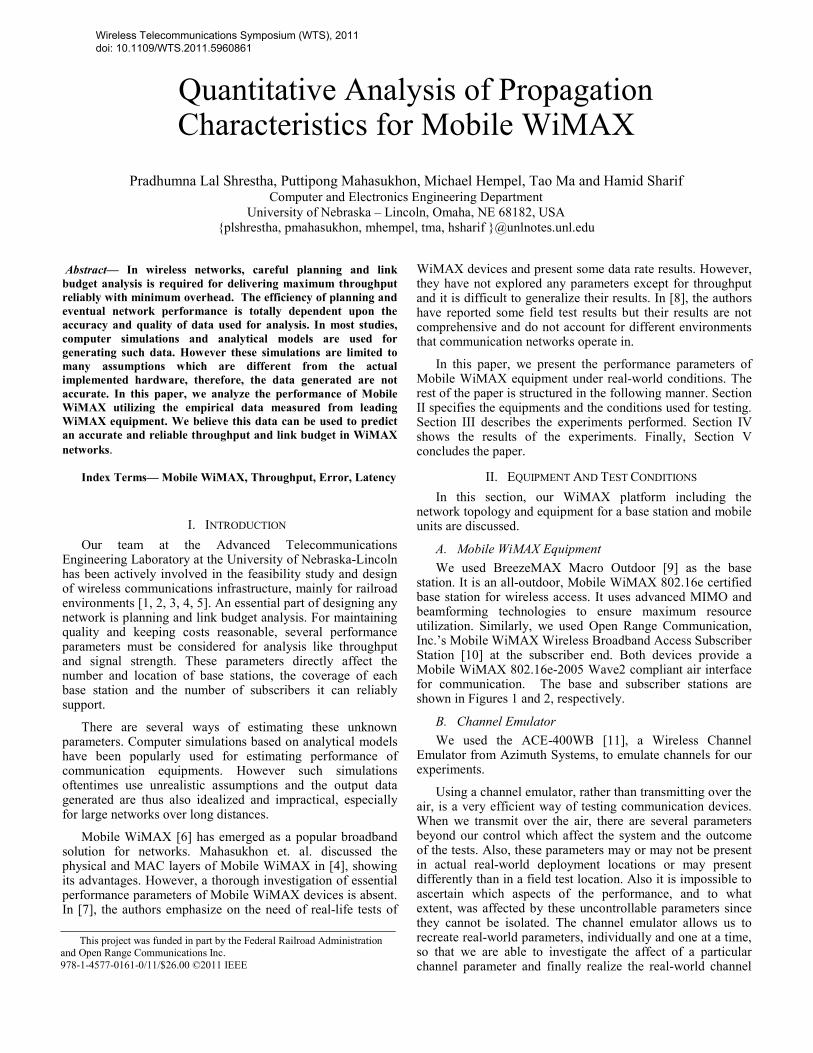
C. Network Topology Figure 3 shows the network utilized for testing the Mobile
WiMAX equipment. The channel emulator creates a virtual channel between the base station and the subscriber station. Two laptops are connected to either end of the link to function as server and end user. A base station server and a gateway shown in the figure are purely for administrative purposes and do not alter the quality of the link or affect the outcome of the
tests. Table 1 shows the channel parameters used in our tests.
The channel emulator is a MIMO capable device. The base station and the subscriber station are configured using a 2x2 MIMO configuration.
III. EXPERIMENTS PERFORMED
A. Throughput Measurement The effective throughput is one of the most important
features of link quality, which directly determines the number of users a base station can support reliably. Using our channel
Figure 1: Base Station
Figure 2: Subscriber Station
Channel/Link Parameter Value Central Frequency 2.49 GHz
Bandwidth 10 MHz Frame Duration 5 ms
Downlink/Uplink Ratio 27/18 CBR traffic generation
rate (uplink) 10 Mbps
CBR traffic generation rate (downlink) 20 Mbps
CBR Packet Size 1400 bytes Ping packet Size 64 bytes
Ping Rate 5 per second Base station transmission power 28 dBm
Subscriber station transmission power
15 dBm to 27 dBm
Channel Path Loss 90 dB to 140 dB HARQ ON
Power Control ON Adaptive Modulation and Coding ON
Table 1: Channel conditions for performance measurement
Figure 3: Network used for testing
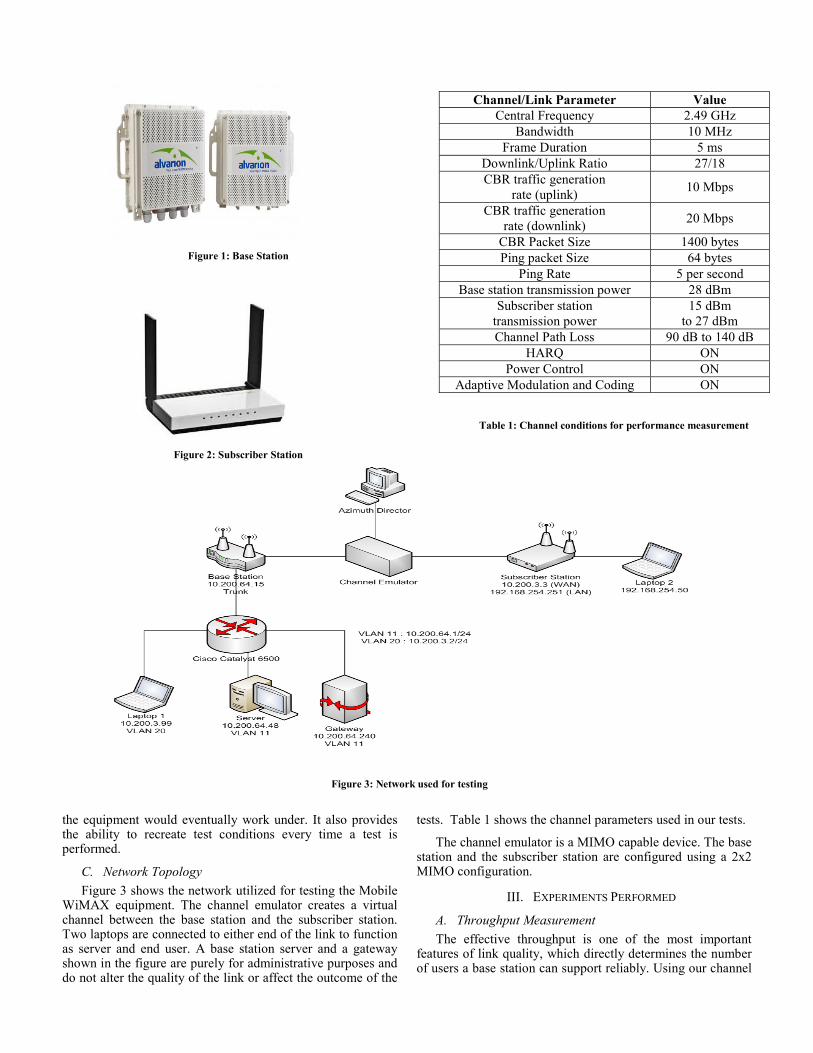
emulator, we configured the following channels for measuring effective data rate in both forward and reverse channels.
i) Butler Model ii) Pedestrian A 5 km/hr, no antenna correlation iii) Pedestrian B 5 km/hr, no antenna correlation iv) Vehicular A 30 km/hr, no antenna correlation v) Vehicular A 60 km/hr, no antenna correlation vi) Vehicular B 30 km/hr, no antenna correlation vii) Vehicular B 60 km/hr, no antenna correlation
Gradually varying the path loss between the base and subscriber stations, we observed the instantaneous throughput of the link in both directions.
B. Received Signal Strength Indicator (RSSI) and Carrier to Interference+Noise Ratio (CINR)
The received signal strength is an important indicator of the link quality. Poor RSSI will result is low received data rate, no matter how large the transmission rate is. However,
RSSI still does not tell the whole story as it does not account for noise. CINR is the measure of how strong the desired signal is compared with prevalent noise and multipath. Even if the RSSI and available bandwidth are high, a low CINR will cause higher errors and hence lower end-to-end throughput.
For all channel models mentioned in the earlier section, the instantaneous RSSI values were observed by gradually varying the path loss of the link.
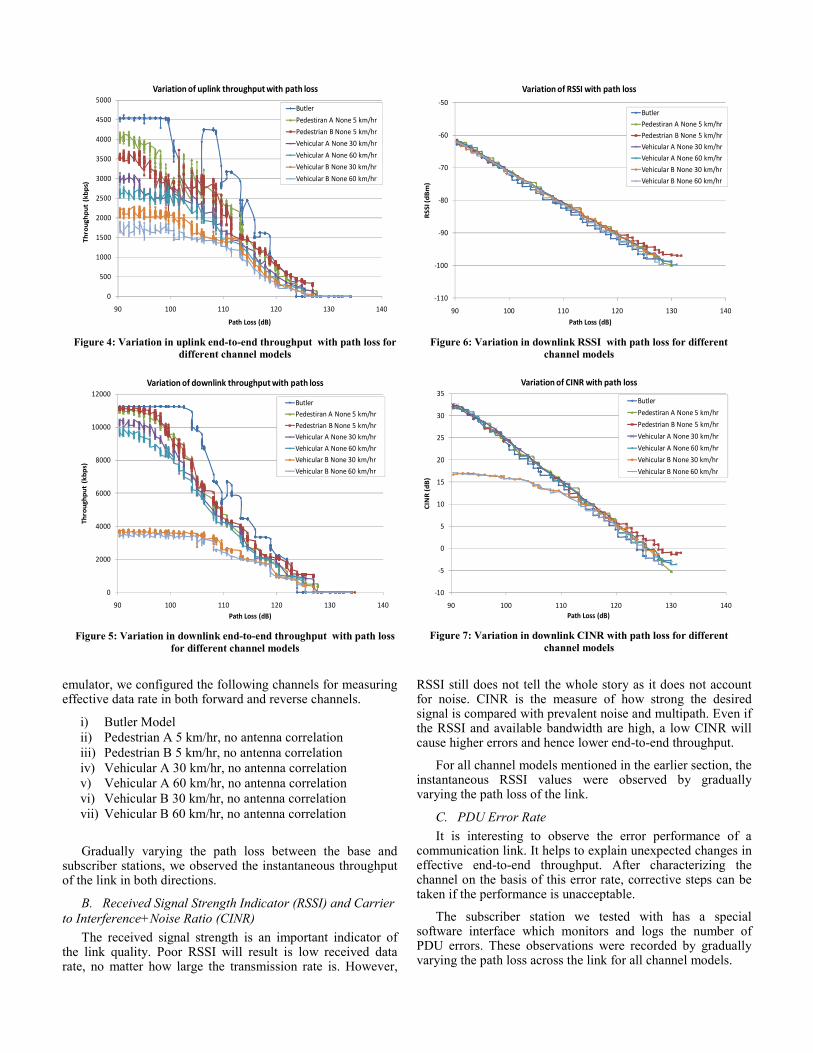
C. PDU Error Rate It is interesting to observe the error performance of a
communication link. It helps to explain unexpected changes in effective end-to-end throughput. After characterizing the channel on the basis of this error rate, corrective steps can be taken if the performance is unacceptable.
The subscriber station we tested with has a special software interface which monitors and logs the number of PDU errors. These observations were recorded by gradually varying the path loss across the link for all channel models.
Figure 4: Variation in uplink end-to-end throughput with path loss for
different channel models
Figure 6: Variation in downlink RSSI with path loss for different
channel models
Figure 5: Variation in downlink end-to-end throughput with path loss
for different channel models
Figure 7: Variation in downlink CINR with path loss for different
channel models
0
500
1000
1500
2000
2500
3000
3500
4000
4500
5000
90 100 110 120 130 140
Thro
ughp
ut (
kbps
)
Path Loss (dB)
Variation of uplink throughput with path loss
Butler
Pedestiran A None 5 km/hr
Pedestrian B None 5 km/hr
Vehicular A None 30 km/hr
Vehicular A None 60 km/hr
Vehicular B None 30 km/hr
Vehicular B None 60 km/hr
-110
-100
-90
-80
-70
-60
-50
90 100 110 120 130 140
RSS
I (dB
m)
Path Loss (dB)
Variation of RSSI with path loss
Butler
Pedestiran A None 5 km/hr
Pedestrian B None 5 km/hr
Vehicular A None 30 km/hr
Vehicular A None 60 km/hr
Vehicular B None 30 km/hr
Vehicular B None 60 km/hr
0
2000
4000
6000
8000
10000
12000
90 100 110 120 130 140
Thro
ughp
ut (
kbps
)
Path Loss (dB)
Variation of downlink throughput with path loss
Butler
Pedestiran A None 5 km/hr
Pedestrian B None 5 km/hr
Vehicular A None 30 km/hr
Vehicular A None 60 km/hr
Vehicular B None 30 km/hr
Vehicular B None 60 km/hr
-10
-5
0
5
10
15
20
25
30
35
90 100 110 120 130 140
CIN
R (d
B)
Path Loss (dB)
Variation of CINR with path loss
Butler
Pedestiran A None 5 km/hr
Pedestrian B None 5 km/hr
Vehicular A None 30 km/hr
Vehicular A None 60 km/hr
Vehicular B None 30 km/hr
Vehicular B None 60 km/hr

D. Latency For any communication link, bandwidth only tells one side
of the story. If the link suffers from very high latency, even channels with large bandwidths are not able to produce high end-to-end throughput. As in earlier cases, characterizing a channel on the basis of latency allows us to isolate the problem and deal with it, if unacceptable.
Setting a ping packet size of 64 bytes and ping rate of 5 per second, both uplink and downlink latency were observed for all values of path loss for all channel models.
The latency values are for one way end-to-end observation. Along with the link latency, it also includes latencies introduced by the network devices like LAN cards and other hardware encountered by the packets traversing the test network.
IV. RESULTS Figure 4 and 5 show the uplink and downlink throughputs
of the link for different path loss values. We see that the throughput curves are constant initially, then roll off gradually and eventually flatten out. Since the link is asymmetric at the MAC layer with the configured 27:18 DL/UL ratio, downlink rates are much higher than uplink rates. These curves clearly demonstrate the direct effect of multipath components and Doppler shift on channel performance.
The Butler channel model, without multipath and Doppler shift, has the highest throughput. Vehicular B, with the multipath component spread by as much as 20 ms, has the lowest throughput. Even within the same channel models, those at higher velocity, and hence higher Doppler shift, show inferior performance. A measure of such performance drop is essential in any form of network planning or upgrading.
The curves are not monotonic is some places, especially for those at good channel conditions. From the observation of subscriber station transmit power; we can attribute this feature to power control. We observed a sudden increase in transmit power of the subscriber station which resulted in a sudden uplink end-to-end throughput increase as shown in Figure 4. While operating in less favorable channel conditions, the subscriber station is already transmitting at full power, even at
lower path loss to compensate for the multipath and Doppler shift effects on the signal, and also portrays high variance in transmit power. Therefore, there is no significant jump in uplink throughput when we use those channels. Figure 6 and 7 show the RSSI and CINR values for downlink. RSSI decreases with an increase in path loss, indicating channel quality degradation. The impact of it is fairly similar for all tested channel models. Since RSSI only accounts for received signal strength, the multipath introduced by the channels do not affect it. On the other hand, the CINR values represent the impact of multipath as well. Clearly the CINR values for Vehicular B channels are very low, owing to the high multipath scattering environment and hence resulting in significantly lower downlink throughput, in spite of having an almost identical RSSI. Therefore, it is of utmost importance to restrain from judging channel quality on the basis of RSSI alone. As clearly evident from our results, inclusion of other channel parameters is mandatory to get the real picture of channel performance.
Figure 8 shows the PDU error rate of the downlink. We can see worsening channel conditions decrease the performance. The measurement unit is the number of PDUs received with errors per second. Since the PDU rate under good channel conditions is substantially higher, the number of both error free and error prone PDUs are also higher, which explains the high rate of error even under good conditions.
Figure 9 shows the downlink latency of the channel. Since the channels are physically symmetric, the uplink latency characteristic is also identical. Higher latency, especially for poor channel conditions can be explained by HARQ.
V. CONCLUSION Performance evaluations of wireless networks which are
based on analytical models and computer simulations may provide misleading results due to assumptions which are different from the actual hardware used in networks. In this paper, we have analyzed the link parameters between two physical Mobile WiMAX devices over several channel models. We found the downlink and uplink throughputs may reach up to 11.5 Mbps and 4.5 Mbps under channel and equipment parameters in our test platform. We also investigated other link parameters such as RSSI, CINR, PDU
Figure 8: Variation in downlink PDU error rate with path loss for
different channel models
Figure 9: Variation in downlink end-to-end latency with path loss for
different channel models
0
5
10
15
20
25
30
90 95 100 105 110 115 120 125 130 135
Erro
r Rat
e (P
DU
s/se
cond
)
Path Loss (dB)
Variation of PDU Error Rate with path loss
ButlerPedestrian A None 5 km/hrPedestrian B None 5 km/hrVehicular A None 30 km/hrVehicular A None 60 km/hrVehicular B None 30 km/hrVehicular B None 60 km/hr
15000
25000
35000
45000
55000
65000
75000
85000
90 95 100 105 110 115 120 125 130 135
Del
ay (m
icro
seco
nd)
Path Loss (dB)
Variance of Downlink Latency with pathloss
ButlerPedestrian A None 5 km/hrPedestrian B None 5 km/hrVehicular A None 30 km/hrVehicular A None 60 km/hrVehicular B None 30 km/hrVehicular B None 60 km/hr

error rate and latency. Characterizing a channel based on these parameters assists the designers to have a better understanding of throughput performance with some non-monotone and abnormality. Further, these parameters single out problems in the link and provide a starting point for corrective actions if the problems are unacceptable.
VI. ACKNOWLEDGEMENT This study was conducted at the University of Nebraska-
Lincoln by the Advanced Telecommunications Engineering Laboratory (www.TEL.unl.edu) researchers, and funded in part by the Federal Railroad Administration (FRA) and Open Range Communications Inc.
REFERENCES [1] Michael Hempel, Hamid Sharif, Wei Wang, Ting Zhou, Puttipong
Mahasukhon, “A Study of Critical Baseline Performance Characteristics for IEEE 802.16e-2005”, IWCMC 2008
[2] P. Mahasukhon, H. Sharif, M. Hempel, T. Zhou, W.Wang, H.-H. Chen, “IEEE 802.11b based ad hoc networking and its performance in mobile channels”, Communications, IET 2009
[3] Puttipong Mahasukhon, Hamid Sharif, Michael Hempel, Ting Zhou, Wei Wang, Tao Ma, “Type I HARQ performance modeling and evaluation of mobile WiMAX for network simulators”, IWCMC 2009
[4] Puttipong Mahasukhon, Hamid Sharif, Michael Hempel, Ting Zhou, and Tao Ma, “Distance and Throughput Measurements in Mobile WiMAX Test Bed”, MILITARY COMMUNICATIONS CONFERENCE, 2010 - MILCOM 2010
[5] Wei Wang, Hamid Sharif, Michael Hempel, Ting Zhou, Puttipong Mahasukhon, “Throughput vs. Distance Tradeoffs and Deployment Considerations for a Multi-Hop IEEE 802.16e Railroad Test Bed”, Vehicular Technology Conference, 2008. VTC Spring 2008. IEEE
[6] IEEE Standard 802.16e. Part 16: Air interface for fixed and mobile broadband wireless access systems, 2006.
[7] O. Grondalen, P. Gronsund, T Breivik, P. Engelstad, “Fixed WiMAX Field Trial Measurements and Analyses”, Mobile and Wireless Communications Summit, 2007. 16th IST
[8] Jeffrey De Bruyne, Wout Joseph, Leen Verloock, and Luc Martens, aMeasurements and Evaluation of the Network Performance of a Fixed WiMAX System in a Suburban Environment”, ISWCS 2008
[9] Alvarion Ltd., http://www.alvarion.com/index.php/en/products/products-list/breezemax/breezemax-macro-outdoor
[10] Open Range Communications, Inc., http://www.openrangecomm.com/4g_wireless_internet/more_about_4g.aspx
[11] Azimuth Systems Inc., http://www.azimuthsystems.com/platforms-channel-400wb.htm