
QUANTITATIVE ANALYSIS OF CALCIUM OXIDE DESICCANT CONVERSION TO
8
QUANTITATIVE ANALYSIS OF CALCIUM OXIDE DESICCANT CONVERSION TO CALCIUM HYDROXIDE USING X-RAY DIFFRACTION Thomas N. Blanton and Craig L. Barnes Eastman Kodak Company, Research & Development Laboratories, Rochester, NY 14650-2106 ABSTRACT Calcium oxide (calcia, CaO) can be used as a desiccant in electronic displays. When exposed to water, CaO converts to Ca(OH) 2 . X-ray diffraction techniques have been developed to study the conversion process and quantify the amount of CaO/Ca(OH) 2 in powder and dispersed samples using the reference intensity ratio (RIR) method. To incorporate CaO in an electronic device the powder is dispersed in a polymeric binder. X-ray diffraction was also used to conduct in situ humidity studies to evaluate the water uptake of calcia dispersed in different polymeric binders. The time required to convert 50 percent of the CaO to Ca(OH) 2 was selected as the criteria for rating the best polymers to be used in this application. INTRODUCTION The interest in organic materials for use in organic light-emitting diodes (OLEDs) began with the pioneering report of efficient green electroluminescence from Alq 3, tris(8- hydroxyquinoline)aluminum, by Tang and Van Slyke [1]. A typical OLED device is comprised of a cathode and anode along with four organic layers (Figure 1). These organic layers allow for electroluminescence when voltage is passed through the device. The resulting visible light emission can be tailored by using dopants in the emissive layer, creating a display that is brighter, uses less energy, and has a wider viewing angle than current liquid crystal displays. Figure 1. Schematic of an organic light-emitting diode Some of the organic components in an OLED device will degrade when exposed to water. To protect the OLED layers, displays are encapsulated with a glass front and a glass or metal back, joined together with an appropriate sealant. Over time , however, water vapor in air will permeate the encapsulation components resulting in a degradation of device performance. One method of extending the life of an OLED display is to place a desiccant inside the display, so Copyright ©JCPDS - International Centre for Diffraction Data 2005, Advances in X-ray Analysis, Volume 48. 45 ISSN 1097-0002
Transcript of QUANTITATIVE ANALYSIS OF CALCIUM OXIDE DESICCANT CONVERSION TO
QUANTITATIVE ANALYSIS OF CALCIUM OXIDE DESICCANT CONVERSION TO CALCIUM HYDROXIDE USING X-RAY
DIFFRACTION
Thomas N. Blanton and Craig L. Barnes
Eastman Kodak Company, Research & Development Laboratories, Rochester, NY 14650-2106
ABSTRACT
Calcium oxide (calcia, CaO) can be used as a desiccant in electronic displays. When exposed to water, CaO converts to Ca(OH)2. X-ray diffraction techniques have been developed to study the conversion process and quantify the amount of CaO/Ca(OH)2 in powder and dispersed samples using the reference intensity ratio (RIR) method. To incorporate CaO in an electronic device the powder is dispersed in a polymeric binder. X-ray diffraction was also used to conduct in situ humidity studies to evaluate the water uptake of calcia dispersed in different polymeric binders. The time required to convert 50 percent of the CaO to Ca(OH)2 was selected as the criteria for rating the best polymers to be used in this application.
INTRODUCTION
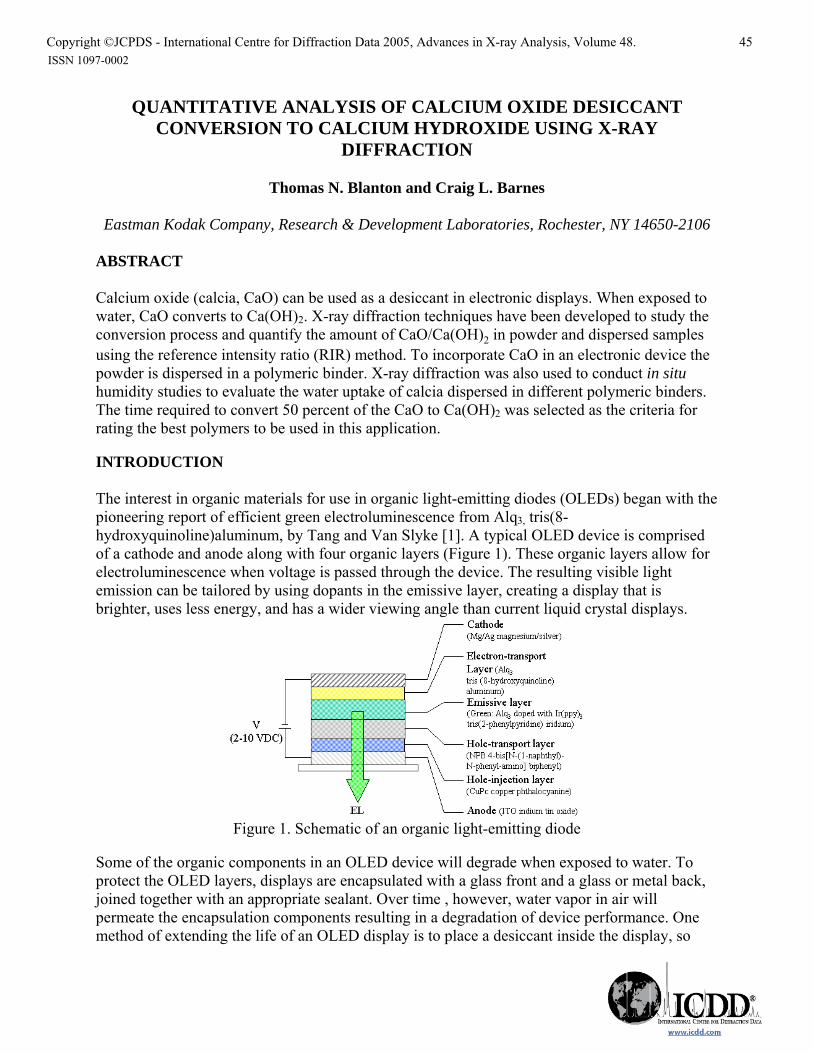
The interest in organic materials for use in organic light-emitting diodes (OLEDs) began with the pioneering report of efficient green electroluminescence from Alq3, tris(8-hydroxyquinoline)aluminum, by Tang and Van Slyke [1]. A typical OLED device is comprised of a cathode and anode along with four organic layers (Figure 1). These organic layers allow for electroluminescence when voltage is passed through the device. The resulting visible light emission can be tailored by using dopants in the emissive layer, creating a display that is brighter, uses less energy, and has a wider viewing angle than current liquid crystal displays.
Figure 1. Schematic of an organic light-emitting diode
Some of the organic components in an OLED device will degrade when exposed to water. To protect the OLED layers, displays are encapsulated with a glass front and a glass or metal back, joined together with an appropriate sealant. Over time , however, water vapor in air will permeate the encapsulation components resulting in a degradation of device performance. One method of extending the life of an OLED display is to place a desiccant inside the display, so
Copyright ©JCPDS - International Centre for Diffraction Data 2005, Advances in X-ray Analysis, Volume 48. 45 ISSN 1097-0002

This document was presented at the Denver X-ray Conference (DXC) on Applications of X-ray Analysis. Sponsored by the International Centre for Diffraction Data (ICDD). This document is provided by ICDD in cooperation with the authors and presenters of the DXC for the express purpose of educating the scientific community. All copyrights for the document are retained by ICDD. Usage is restricted for the purposes of education and scientific research. DXC Website – www.dxcicdd.com
ICDD Website - www.icdd.com
ISSN 1097-0002
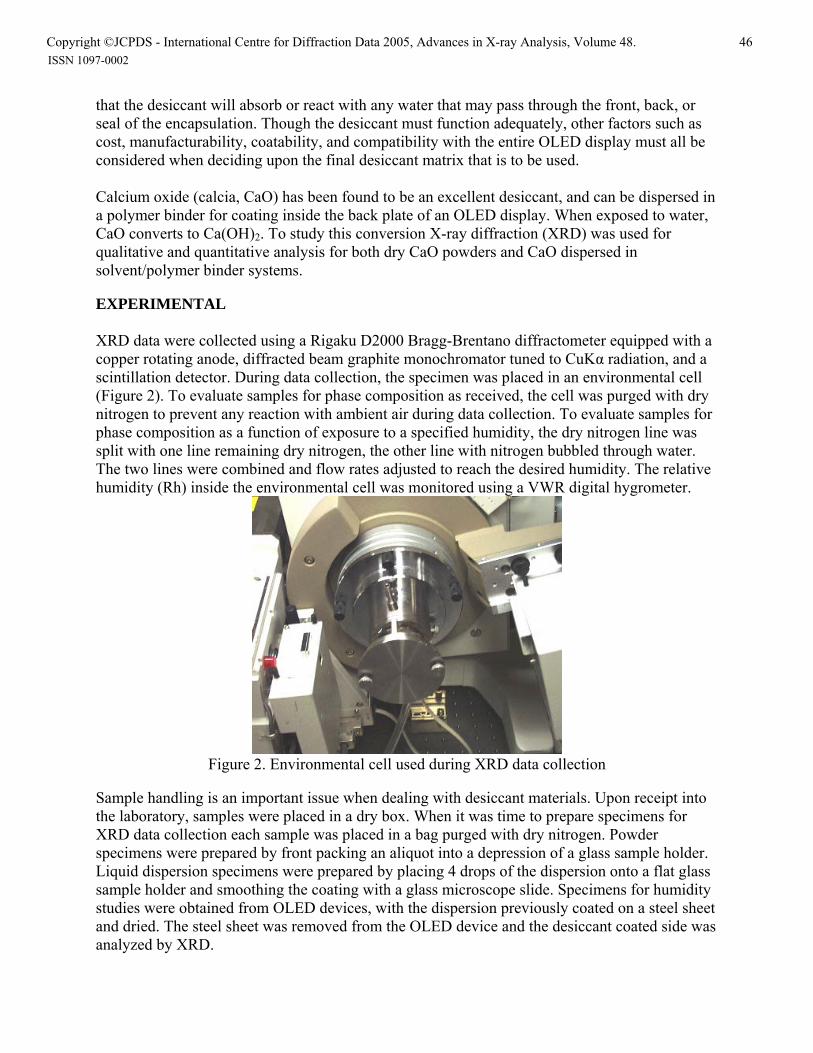
that the desiccant will absorb or react with any water that may pass through the front, back, or seal of the encapsulation. Though the desiccant must function adequately, other factors such as cost, manufacturability, coatability, and compatibility with the entire OLED display must all be considered when deciding upon the final desiccant matrix that is to be used. Calcium oxide (calcia, CaO) has been found to be an excellent desiccant, and can be dispersed in a polymer binder for coating inside the back plate of an OLED display. When exposed to water, CaO converts to Ca(OH)2. To study this conversion X-ray diffraction (XRD) was used for qualitative and quantitative analysis for both dry CaO powders and CaO dispersed in solvent/polymer binder systems. EXPERIMENTAL XRD data were collected using a Rigaku D2000 Bragg-Brentano diffractometer equipped with a copper rotating anode, diffracted beam graphite monochromator tuned to CuKα radiation, and a scintillation detector. During data collection, the specimen was placed in an environmental cell (Figure 2). To evaluate samples for phase composition as received, the cell was purged with dry nitrogen to prevent any reaction with ambient air during data collection. To evaluate samples for phase composition as a function of exposure to a specified humidity, the dry nitrogen line was split with one line remaining dry nitrogen, the other line with nitrogen bubbled through water. The two lines were combined and flow rates adjusted to reach the desired humidity. The relative humidity (Rh) inside the environmental cell was monitored using a VWR digital hygrometer.
Figure 2. Environmental cell used during XRD data collection
Sample handling is an important issue when dealing with desiccant materials. Upon receipt into the laboratory, samples were placed in a dry box. When it was time to prepare specimens for XRD data collection each sample was placed in a bag purged with dry nitrogen. Powder specimens were prepared by front packing an aliquot into a depression of a glass sample holder. Liquid dispersion specimens were prepared by placing 4 drops of the dispersion onto a flat glass sample holder and smoothing the coating with a glass microscope slide. Specimens for humidity studies were obtained from OLED devices, with the dispersion previously coated on a steel sheet and dried. The steel sheet was removed from the OLED device and the desiccant coated side was analyzed by XRD.
Copyright ©JCPDS - International Centre for Diffraction Data 2005, Advances in X-ray Analysis, Volume 48. 46 ISSN 1097-0002

Diffraction patterns were collected in the range of 10 - 40˚ 2θ, 0.02˚/step, 10˚/min as continuous scans. After data collection, all patterns were processed using background subtraction to remove any contribution from the substrate and/or polymer binder/solvent, followed by profile fitting (Pearson VII) to obtain integrated peak intensities. MDI Jade Easy Quant XRD software [2] was used for quantitative analysis. The method of quantitative analysis used was the reference intensity (RIR), or matrix flushing, technique developed by Chung [3]. For quantitating CaO/Ca(OH)2 we used Equation 1:
XCaO=(ICaO/(RIRCaOIrelCaO))[1/(ICa(OH)2/(RIRCa(OH)2IrelCa(OH)2))] (1) where: XCaO – weight fraction of CaO phase
I – measured intensity of a specified diffraction plane peak, (hkl), for CaO or Ca(OH)2 (integrated intensity)
Irel – relative intensity of the (hkl) peak measured RIR – I/Ic value for CaO (4.52) or Ca(OH)2 (3.01), determined experimentally
using 50:50 w:w mixtures In order for the RIR method to be used as a quantitative method, two important points must be noted. All phases in the sample being analyzed must be known, otherwise the method is at best semi quantitative. Second, to improve the accuracy of the results, as many of the variables as possible (the RIRs and the Irel values) should be determined with the experimental set up used for specimen analysis. RESULTS To observe the effect of CaO exposure to ambient air, a specimen of CaO powder was prepared for XRD analysis and exposed to air (32% Rh) for 0, 4, 18, and 24 hours. In Figure 3, the diffraction patterns collected after these exposure times are shown.
Figure 3. Selected range XRD patterns for CaO powder after exposure for 0 – 24 hours.
Copyright ©JCPDS - International Centre for Diffraction Data 2005, Advances in X-ray Analysis, Volume 48. 47 ISSN 1097-0002
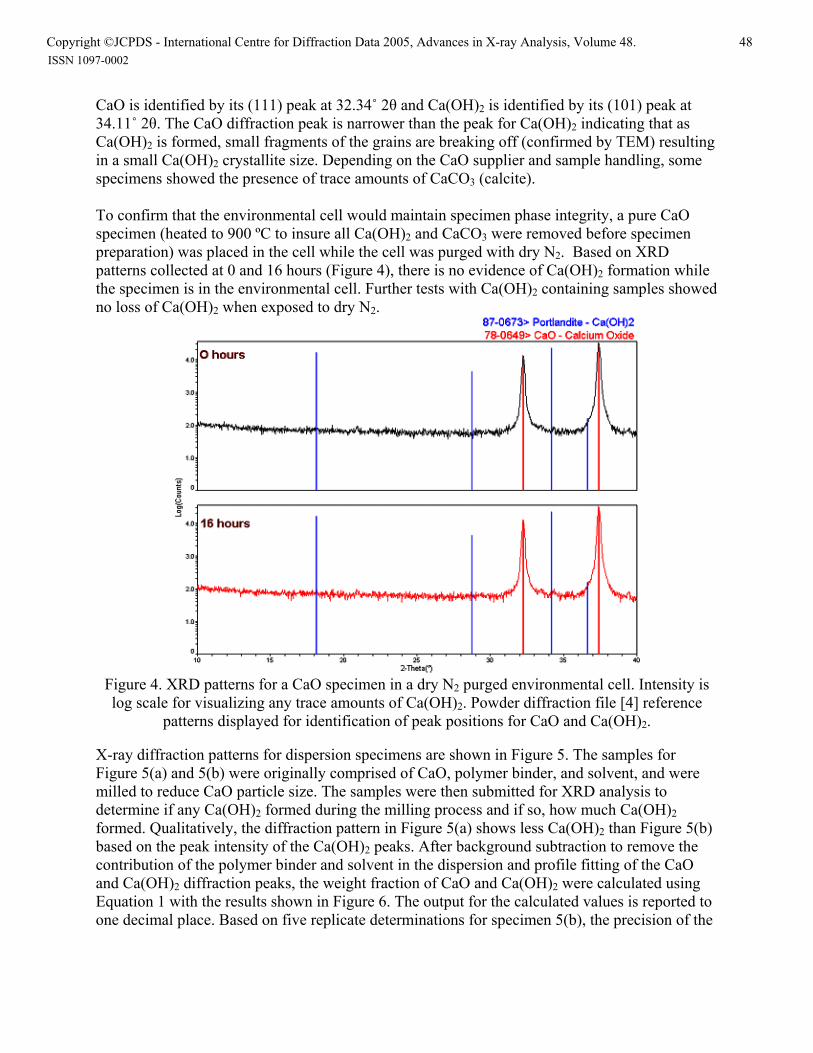
CaO is identified by its (111) peak at 32.34˚ 2θ and Ca(OH)2 is identified by its (101) peak at 34.11˚ 2θ. The CaO diffraction peak is narrower than the peak for Ca(OH)2 indicating that as Ca(OH)2 is formed, small fragments of the grains are breaking off (confirmed by TEM) resulting in a small Ca(OH)2 crystallite size. Depending on the CaO supplier and sample handling, some specimens showed the presence of trace amounts of CaCO3 (calcite). To confirm that the environmental cell would maintain specimen phase integrity, a pure CaO specimen (heated to 900 ºC to insure all Ca(OH)2 and CaCO3 were removed before specimen preparation) was placed in the cell while the cell was purged with dry N2. Based on XRD patterns collected at 0 and 16 hours (Figure 4), there is no evidence of Ca(OH)2 formation while the specimen is in the environmental cell. Further tests with Ca(OH)2 containing samples showed no loss of Ca(OH)2 when exposed to dry N2.
Figure 4. XRD patterns for a CaO specimen in a dry N2 purged environmental cell. Intensity is log scale for visualizing any trace amounts of Ca(OH)2. Powder diffraction file [4] reference
patterns displayed for identification of peak positions for CaO and Ca(OH)2.
X-ray diffraction patterns for dispersion specimens are shown in Figure 5. The samples for Figure 5(a) and 5(b) were originally comprised of CaO, polymer binder, and solvent, and were milled to reduce CaO particle size. The samples were then submitted for XRD analysis to determine if any Ca(OH)2 formed during the milling process and if so, how much Ca(OH)2 formed. Qualitatively, the diffraction pattern in Figure 5(a) shows less Ca(OH)2 than Figure 5(b) based on the peak intensity of the Ca(OH)2 peaks. After background subtraction to remove the contribution of the polymer binder and solvent in the dispersion and profile fitting of the CaO and Ca(OH)2 diffraction peaks, the weight fraction of CaO and Ca(OH)2 were calculated using Equation 1 with the results shown in Figure 6. The output for the calculated values is reported to one decimal place. Based on five replicate determinations for specimen 5(b), the precision of the
Copyright ©JCPDS - International Centre for Diffraction Data 2005, Advances in X-ray Analysis, Volume 48. 48 ISSN 1097-0002

process used in this study was found to be +/- 2%. Therefore when a report is generated for the customer all quantitative values are recorded as whole percent, with the stated precision.
Figure 5. XRD patterns of CaO containing dispersions after milling.
Figure 6. Results from quantitative analysis calculations based on X-ray diffraction patterns in
(a) Figure 5(a) and (b) Figure 5(b). An important aspect in understanding the effect of polymer binder composition in a dispersion on the efficacy of a desiccant is to be able to measure the CaO to Ca(OH)2 conversion rate as a function of humidity. To perform this measurement, the environmental cell was purged with
Copyright ©JCPDS - International Centre for Diffraction Data 2005, Advances in X-ray Analysis, Volume 48. 49 ISSN 1097-0002

humidified N2. Figure 7 shows an example of a dried CaO dispersion coated on stainless steel, exposed to a 30% Rh humidified N2 ambient.
Figure 7. XRD patterns for a CaO dispersion exposed to 30% Rh humidified N2.
During the exposure of 20 hours, the intensity of the CaO diffraction peaks is observed to decrease while the Ca(OH)2 diffraction peaks show an increase in intensity. Using the quantitative analysis method described in this study, it is possible to compare different dispersion samples and determine a binder or class of binders that are best suited for allowing water to permeate the binder and react with the CaO desiccant. Figure 8 shows a conversion comparison
Figure 8. Weight fractions of CaO
of CaO dispersed in two binders.
and Ca(OH)2 as a function of time when exposed to 30% Rh humidified N2.
Copyright ©JCPDS - International Centre for Diffraction Data 2005, Advances in X-ray Analysis, Volume 48. 50 ISSN 1097-0002

Bconvert 50 percent of the CaO to Ca(OH) s the criteria for rating the best
curs the
on methods were developed allowing for the analysis of moisture-sensitive esiccant materials. An environmental cell was added to an X-ray diffractometer allowing for
raction y
EDGEMENTS
k Moi Leong, John Mammano, Kristine Herrington, and Mike oscato all of Eastman Kodak Company, for their collaborations in this study.
an Slyke, S. A., Appl. Phys. Lett., 1987, 51, 913–915. ] Materials Data Incorporated, 1224 Concannon Blvd., Livermore, California 94550, USA.
ased on cost of analysis, turnaround time, and customer requirements, the time required to 2 was selected a
polymers to be used in desiccant dispersions. In Figure 8, the 50 percent conversion point ocat 3 hours 11 minutes for the sample identified as Desiccant 2, and 1 hour 38 minutes forsample identified as Desiccant 3. The polymer used in Desiccant 3 would be the preferred binder in this side-by-side comparison. SUMMARY X-ray diffractidcontrol of the ambient around a specimen. A quantitative analysis method using X-ray diffwas developed for CaO/Ca(OH)2 utilizing reference intensity ratio calculations. In situ humiditstudies were used to demonstrate the effect of polymer binder on the rate of CaO to Ca(OH)2 conversion ACKNOWL The authors would like to thanM REFERENCES [1] Tang, C. W.; V[2[3] Chung, F.H., 1974, J. of Appl. Cryst., 1974, 7, 519-525. [4] Powder diffraction file, International Centre for Diffraction Data, 12 Campus Blvd., Newtown Square, PA 19073, USA.
Copyright ©JCPDS - International Centre for Diffraction Data 2005, Advances in X-ray Analysis, Volume 48. 51 ISSN 1097-0002


