Quantitation of Glucocorticoid Receptor DNA-Binding ... · Quantitation of Glucocorticoid Receptor...
12
Quantitation of Glucocorticoid Receptor DNA-Binding Dynamics by Single-Molecule Microscopy and FRAP Femke L. Groeneweg 1 , Martin E. van Royen 2 , Susanne Fenz 3,4 , Veer I. P. Keizer 5 , Bart Geverts 2 , Jurrien Prins 1,5 , E. Ron de Kloet 1 , Adriaan B. Houtsmuller 2 , Thomas S. Schmidt 3 , Marcel J. M. Schaaf 5 * 1 Department of Medical Pharmacology, Leiden University/LUMC, Leiden, The Netherlands, 2 Department of Pathology, Erasmus MC, Rotterdam, The Netherlands, 3 Physics of Life Processes, Institute of Physics (LION), Leiden University, Leiden, The Netherlands, 4 Cell & Developmental Biology, Biocenter, Wu ¨ rzburg University, Wu ¨ rzburg, Germany, 5 Molecular Cell Biology, Institute of Biology, Leiden University, Leiden, The Netherlands Abstract Recent advances in live cell imaging have provided a wealth of data on the dynamics of transcription factors. However, a consistent quantitative description of these dynamics, explaining how transcription factors find their target sequences in the vast amount of DNA inside the nucleus, is still lacking. In the present study, we have combined two quantitative imaging methods, single-molecule microscopy and fluorescence recovery after photobleaching, to determine the mobility pattern of the glucocorticoid receptor (GR) and the mineralocorticoid receptor (MR), two ligand-activated transcription factors. For dexamethasone-activated GR, both techniques showed that approximately half of the population is freely diffusing, while the remaining population is bound to DNA. Of this DNA-bound population about half the GRs appeared to be bound for short periods of time (,0.7 s) and the other half for longer time periods (,2.3 s). A similar pattern of mobility was seen for the MR activated by aldosterone. Inactive receptors (mutant or antagonist-bound receptors) show a decreased DNA binding frequency and duration, but also a higher mobility for the diffusing population. Likely, very brief (#1 ms) interactions with DNA induced by the agonists underlie this difference in diffusion behavior. Surprisingly, different agonists also induce different mobilities of both receptors, presumably due to differences in ligand-induced conformational changes and receptor complex formation. In summary, our data provide a consistent quantitative model of the dynamics of GR and MR, indicating three types of interactions with DNA, which fit into a model in which frequent low-affinity DNA binding facilitates the search for high-affinity target sequences. Citation: Groeneweg FL, van Royen ME, Fenz S, Keizer VIP, Geverts B, et al. (2014) Quantitation of Glucocorticoid Receptor DNA-Binding Dynamics by Single- Molecule Microscopy and FRAP. PLoS ONE 9(3): e90532. doi:10.1371/journal.pone.0090532 Editor: Jan Peter Tuckermann, University of Ulm, Germany Received September 23, 2013; Accepted February 2, 2014; Published March 14, 2014 Copyright: ß 2014 Groeneweg et al. This is an open-access article distributed under the terms of the Creative Commons Attribution License, which permits unrestricted use, distribution, and reproduction in any medium, provided the original author and source are credited. Funding: FLG and ERdK are supported by the Royal Netherlands Academy for Arts and Sciences, MvR by the Netherlands Organization for Scientific Research (NWO-STW), VIPK by the Foundation for Fundamental Research on Matter (FOM), and MJMS by the SmartMix Program of The Netherlands Ministry of Economic Affairs and the Ministry of Education, Culture and Science. The funders had no role in study design, data collection and analysis, decision to publish, or preparation of the manuscript. Competing Interests: The authors have declared that no competing interests exist. * E-mail: [email protected] Introduction In the past decade, imaging studies of fluorescently tagged proteins inside living cells have enormously increased our understanding of transcription factor dynamics [1,2,3,4,5,6,7,8,9]. These studies have shown that transcription factors display a remarkably high mobility in the nucleus. Even in its most activated state a typical transcription factor appears to be able to diffuse through the entire nucleus, and to be immobilized only transiently [7,10,11]. One often-studied transcription factor is the glucocorticoid receptor (GR). This cytoplasmically localized receptor translocates to the nucleus upon binding of naturally occurring glucocorticoids (corticosterone and cortisol) or their synthetic analogs. In the nucleus the steroid-GR complexes can bind either directly or indirectly (through interactions with other transcription factors) to DNA and alter transcription rates of responsive genes [12,13,14]. Like other transcription factors, ligand-activated GRs display a high mobility within the nucleus in fluorescence recovery after photobleaching (FRAP) studies [3,4,8,15,16]. Using GR mutants with reduced DNA-binding capacity or antagonist-bound GR, a correlation was shown between GR immobilization time and the capacity to initiate transcription [3,8,17]. In the last decade many new imaging techniques have become available that open possibilities for more detailed quantifications of protein dynamics [18,19,20,21,22]. One such approach is single- molecule microscopy (SMM). In SMM, conventional wide-field fluorescent microscopy is combined with a fast, ultra-sensitive CCD camera to enable the visualization of single fluorescent molecules with high temporal (,5 ms) and spatial (positional accuracy of ,40 nm) resolution [21,23]. Initially, SMM was used to study the mobility patterns of membrane proteins [24,25,26,27,28], and it has now been adapted for studies of nuclear proteins [29,30] and transcription factors [19,22,31,32], including a recent study on the GR [18]. Importantly, the analysis of single-molecule displacement patterns gives a very direct and unbiased picture of protein dynamics [33,34]. For the more conventional population-based approaches, the correct control for confounding factors such as laser irregularities and the require- ment of many a priori assumptions and independent variables introduce bias in the outcomes and have been a major challenge for the field [6,9,15,35]. To control for any confounding factors PLOS ONE | www.plosone.org 1 March 2014 | Volume 9 | Issue 3 | e90532
Transcript of Quantitation of Glucocorticoid Receptor DNA-Binding ... · Quantitation of Glucocorticoid Receptor...

Quantitation of Glucocorticoid Receptor DNA-BindingDynamics by Single-Molecule Microscopy and FRAPFemke L. Groeneweg1, Martin E. van Royen2, Susanne Fenz3,4, Veer I. P. Keizer5, Bart Geverts2,
Jurrien Prins1,5, E. Ron de Kloet1, Adriaan B. Houtsmuller2, Thomas S. Schmidt3, Marcel J. M. Schaaf5*
1 Department of Medical Pharmacology, Leiden University/LUMC, Leiden, The Netherlands, 2 Department of Pathology, Erasmus MC, Rotterdam, The Netherlands,
3 Physics of Life Processes, Institute of Physics (LION), Leiden University, Leiden, The Netherlands, 4 Cell & Developmental Biology, Biocenter, Wurzburg University,
Wurzburg, Germany, 5 Molecular Cell Biology, Institute of Biology, Leiden University, Leiden, The Netherlands
Abstract
Recent advances in live cell imaging have provided a wealth of data on the dynamics of transcription factors. However, aconsistent quantitative description of these dynamics, explaining how transcription factors find their target sequences inthe vast amount of DNA inside the nucleus, is still lacking. In the present study, we have combined two quantitativeimaging methods, single-molecule microscopy and fluorescence recovery after photobleaching, to determine the mobilitypattern of the glucocorticoid receptor (GR) and the mineralocorticoid receptor (MR), two ligand-activated transcriptionfactors. For dexamethasone-activated GR, both techniques showed that approximately half of the population is freelydiffusing, while the remaining population is bound to DNA. Of this DNA-bound population about half the GRs appeared tobe bound for short periods of time (,0.7 s) and the other half for longer time periods (,2.3 s). A similar pattern of mobilitywas seen for the MR activated by aldosterone. Inactive receptors (mutant or antagonist-bound receptors) show a decreasedDNA binding frequency and duration, but also a higher mobility for the diffusing population. Likely, very brief (#1 ms)interactions with DNA induced by the agonists underlie this difference in diffusion behavior. Surprisingly, different agonistsalso induce different mobilities of both receptors, presumably due to differences in ligand-induced conformational changesand receptor complex formation. In summary, our data provide a consistent quantitative model of the dynamics of GR andMR, indicating three types of interactions with DNA, which fit into a model in which frequent low-affinity DNA bindingfacilitates the search for high-affinity target sequences.
Citation: Groeneweg FL, van Royen ME, Fenz S, Keizer VIP, Geverts B, et al. (2014) Quantitation of Glucocorticoid Receptor DNA-Binding Dynamics by Single-Molecule Microscopy and FRAP. PLoS ONE 9(3): e90532. doi:10.1371/journal.pone.0090532
Editor: Jan Peter Tuckermann, University of Ulm, Germany
Received September 23, 2013; Accepted February 2, 2014; Published March 14, 2014
Copyright: � 2014 Groeneweg et al. This is an open-access article distributed under the terms of the Creative Commons Attribution License, which permitsunrestricted use, distribution, and reproduction in any medium, provided the original author and source are credited.
Funding: FLG and ERdK are supported by the Royal Netherlands Academy for Arts and Sciences, MvR by the Netherlands Organization for Scientific Research(NWO-STW), VIPK by the Foundation for Fundamental Research on Matter (FOM), and MJMS by the SmartMix Program of The Netherlands Ministry of EconomicAffairs and the Ministry of Education, Culture and Science. The funders had no role in study design, data collection and analysis, decision to publish, or preparationof the manuscript.
Competing Interests: The authors have declared that no competing interests exist.
* E-mail: [email protected]
Introduction
In the past decade, imaging studies of fluorescently tagged
proteins inside living cells have enormously increased our
understanding of transcription factor dynamics
[1,2,3,4,5,6,7,8,9]. These studies have shown that transcription
factors display a remarkably high mobility in the nucleus. Even in
its most activated state a typical transcription factor appears to be
able to diffuse through the entire nucleus, and to be immobilized
only transiently [7,10,11]. One often-studied transcription factor is
the glucocorticoid receptor (GR). This cytoplasmically localized
receptor translocates to the nucleus upon binding of naturally
occurring glucocorticoids (corticosterone and cortisol) or their
synthetic analogs. In the nucleus the steroid-GR complexes can
bind either directly or indirectly (through interactions with other
transcription factors) to DNA and alter transcription rates of
responsive genes [12,13,14]. Like other transcription factors,
ligand-activated GRs display a high mobility within the nucleus in
fluorescence recovery after photobleaching (FRAP) studies
[3,4,8,15,16]. Using GR mutants with reduced DNA-binding
capacity or antagonist-bound GR, a correlation was shown
between GR immobilization time and the capacity to initiate
transcription [3,8,17].
In the last decade many new imaging techniques have become
available that open possibilities for more detailed quantifications of
protein dynamics [18,19,20,21,22]. One such approach is single-
molecule microscopy (SMM). In SMM, conventional wide-field
fluorescent microscopy is combined with a fast, ultra-sensitive
CCD camera to enable the visualization of single fluorescent
molecules with high temporal (,5 ms) and spatial (positional
accuracy of ,40 nm) resolution [21,23]. Initially, SMM was used
to study the mobility patterns of membrane proteins
[24,25,26,27,28], and it has now been adapted for studies of
nuclear proteins [29,30] and transcription factors [19,22,31,32],
including a recent study on the GR [18]. Importantly, the analysis
of single-molecule displacement patterns gives a very direct and
unbiased picture of protein dynamics [33,34]. For the more
conventional population-based approaches, the correct control for
confounding factors such as laser irregularities and the require-
ment of many a priori assumptions and independent variables
introduce bias in the outcomes and have been a major challenge
for the field [6,9,15,35]. To control for any confounding factors
PLOS ONE | www.plosone.org 1 March 2014 | Volume 9 | Issue 3 | e90532
that might still exist in the SMM analysis, we combine SMM
analysis with an established Monte Carlo quantification approach
of FRAP imaging [6,36]. The combination with FRAP not only
gives independent cross-validation of the SMM predictions, but
also enables a quantification of protein kinetics over a longer time
frame than SMM.
Our data show that this combination of techniques provides a
very consistent quantitative analysis of GR dynamics. Based on
our data, we can distinguish three states of agonist-activated GR
molecules; one diffusing state and two DNA-bound states, one
with short (,1 sec) and one with a longer (2-4 sec) binding
duration. Transcriptionally inactive GR variants show a reduction
in the frequency and in the duration of both DNA binding events,
and an increase in the diffusion rate of the diffusing population.
This suggests that within this diffusing population an additional
very brief DNA-binding event is hidden, resulting in a lower
effective diffusion rate. Finally, similar effects are observed for a
different steroid receptor: the mineralocorticoid receptor (MR),
indicating that these data are representative for steroid receptors in
general.
Materials and Methods
Cell line and plasmidsIn most experiments, COS-1 cells were used, transiently
transfected using the TransIT-COS kit (Mirus), according to the
manufacturer’s instructions (500 ng DNA/10 cm2). Transfected
cells were used in experiments 2–5 days after transfection. For one
experiment, Hep3B cells were used, stably transfected with the
pEYFP-hGR expression vector [3]. The generation of the pEYFP-
GR plasmid, the three deletion mutants of this vector (pEYFP-GR
D9-385, pEYFP-GR D428-490, and pEYFP-GR D551-777, and
the point mutant (pEYFP-GR F623A) has been described
previously [3,4]. The plasmid pEYFP-hMR was generated by
PCR amplification (Phusion HF polymerase, Finnzymes) of the
human MR gene from a pRSV human MR template (kindly
provided by Dr. R. Evans (gene expression laboratory and HHMI,
The Salk Institute for Biological Studies, La Jolla, CA).
Single molecule microscopyBefore SMM recordings, cells were exposed to 1 mM of
corresponding hormones for 3–6 h. For SMM measurements,
this medium was replaced by serum- and phenol red-free D-MEM
medium, supplemented with 1 mM of the corresponding hormone.
Subsequently, cells were transferred to the SMM setup and
imaged for up to 90 min at 35uC. A wide-field fluorescence
microscope (Axiovert 100TV, Zeiss) was used, equipped with a
100x/1.4NA oil-immersion objective (Zeiss). A region-of-interest
(ROI) of 50650 pixels (pixel size of 220 nm) was selected. The
sample was illuminated by an 514 nm argon laser at an intensity of
2 kW/cm2 (measured at the object). The pulse length of 3 ms was
controlled by an acusto-optical tunable filter (AA optoelectronics,
France). The EYFP fluorescence signal was detected through a
combination of filters (DCLP530, HQ570/80 (Chroma Technol-
ogy, Brattleboro, VT) and OG530-3 (Schott, Mainz, Germany)),
by a liquid-nitrogen cooled CCD camera (Princeton Instruments,
Trenton, NJ), camera read out and AOTF timing were tightly
controlled. Nuclei with a regular ellipsoidal appearance showing a
moderate level of fluorescence were selected and photobleached
until single fluorescence intensity peaks could be distinguished.
The position of each individual molecule was fitted with the
intensity profile of a 2D Gaussian model of EYFP peaks [37]. Our
peaks were identified with a signal to noise ratio of ,8 (peak
fluorescent intensity divided by the variation of the background),
which resulted in a positional accuracy of ,40 nm in the X- and
Y-direction (determined by the quotient of the full-width-at-half-
maximum of the Gaussian fit and the square root of the number of
photons detected [38]). On average, each picture contained ,1.5
peaks. Image sequences were recorded in series of 8 subsequent
images with a time lag of either 6.25 ms or 12.5 ms (Figure 1C).
Data on molecular dynamics were obtained for multiple step sizes.
We used all time lags from 6.25 to 37.5 ms in our analysis. From
each cell 180 series of 8 images were taken and data from 20
independent cells (imaged on at least 3 different days) was
combined for the analysis. We used the Particle Image Correlation
Spectroscopy (PICS) method to determine peak displacement over
time [33]; explained in detail in Methods S1. PICS generates a
cumulative probability function (Pcum) of diffusion steps (charac-
terized by l) for each time lag. Pcum can subsequently be fitted with
a two population model:
Pcum(l,Dt)~
1{ a: exp {l2
MSD1: Dtð Þ
� �z 1{að Þ: exp {
l2
MSD2: Dtð Þ
� �� �
where MSD1 and MSD2 denote the mean square displacement of
the first (fast) and the second (slow) fractions respectively, and a is
the fraction size of the first (fast) fraction (Figure 1D). Although
diffusion happens in 3D, we measure only the 2D projection, and
to prevent distortion of the data due to molecules ‘escaping’ in 3D
space, we restrict ourselves to only small time lags (up to 37.5 ms).
This analysis was repeated for each time lag and a, MSD1 and
MSD2 were plotted over time (Dt). All analyses were first
performed on all data from each treatment group pooled together
(n = 20). Subsequently, all analyses were run again in 3 fractions
(n = 6/7) and these 3 separate analyses are used to generate
standard errors of the mean [33]. Finally, OriginPro software was
used to obtain weighted, linear fits, to calculate Dfast and Dslow.
FRAPBefore FRAP recordings, cells were exposed to 1 mM of the
appropriate ligand for 3-6 hours in normal growth medium. For
each experiment, a coverglass with transfected COS-1 cells was
placed in a preheated ring and medium was replaced for empty D-
MEM without phenol red, supplemented with 1 mM of the
corresponding ligand. Cells were used for no longer than 90
minutes and kept at 37uC and 5% CO2. We used a Zeiss LSM510
META confocal laser scanning microscope equipped with a 40x/
1.3NA oil-immersion objective, an argon laser (30 mW) and an
AOTF. For FRAP analysis a narrow strip spanning the entire
width of the nucleus was scanned at 514 nm excitation with short
intervals (100 ms) at low laser power (0.2%). Fluorescence intensity
was recorded using a 560-nm longpass filter. After 40 scans, a high
intensity (100% laser power), 100 ms-bleach pulse at 514 nm was
applied over the whole strip. Subsequently, the recovery of the
fluorescence intensity in the strip was followed for another 55
seconds at 100 ms intervals. For each treatment group 30 cells
were measured by FRAP on two separate days. All curves were
normalized to baseline fluorescent intensity and combined. The
FRAP data was quantitatively analyzed by comparing the
experimental data to curves generated using a previously described
Monte Carlo approach [6]. In short, the generated curve fitting
best to the experimental curve (by ordinary least squares) was
picked from a large set of computer simulated FRAP curves with a
3-population model, containing a diffusing fraction and two bound
(immobile) fractions (Figure 1E). We take the Dfast obtained from
SMM analysis as a fixed parameter in these simulation, leaving 4
DNA Binding Dynamics of GR
PLOS ONE | www.plosone.org 2 March 2014 | Volume 9 | Issue 3 | e90532

parameters as variables: short bound fraction, long bound fraction
(both ranging from 0–90%), and time spent in short and long
bound state (ranging from 0.1 s to 1 s and from 1 s to 300 s
respectively) (see also Methods S1). The parameters of the top 10
best fitting Monte Carlo curves were averaged to represent the
properties of the fractions in the experimental data.
Results
We first investigated the nuclear dynamics of the GR by SMM.
We used COS-1 cells, transiently transfected with EYFP-tagged
human GR (YFP-GR). This YFP-GR fusion protein was
previously shown to retain a good transcriptional activity [3].
Before analysis, cells were exposed for 3 to 6 hours to a saturating
dose (1 mM) of the high affinity GR agonist dexamethasone, which
induces nuclear translocation of YFP-GR (Figure 1A). Nuclei were
photobleached until single diffraction-limited fluorescence inten-
sity peaks could be distinguished (Figure 1B). These peaks are
attributed to single YFP-GR molecules as they had comparable
width and intensity as fluorescence intensity peaks derived from
single EYFP molecules previously observed using the same setup
[37]. In our current approach, EYFP molecules were identified
with a positional accuracy of ,40 nm in one dimension (x or y).
Next, GR mobility was analyzed by assessing molecule displace-
ments over image sequences with short time lags (6.25 and
12.5 ms; Figure 1C), using the Particle Image Correlation
Spectroscopy (PICS) analysis method [33]. We use PICS analysis
instead of single particle tracking, as PICS is less affected by
blinking of YFP or overlapping trajectories of multiple molecules
[33,34]. PICS analysis calculates the cumulative probability
distribution for each displacement, which is subsequently fitted
with multiple-population models (Figure 1D, see material and
Figure 1. SMM and FRAP procedures. (A) Representative confocal images show complete nuclear translocation of YFP-GR after 3 hours of 1 mMdexamethasone treatment. (B) A representative CCD image of single molecules of YFP-GR after background subtraction shows two discernibleGaussian peaks of YFP fluorescence. (C) Regime for single molecule kinetics; images are taken with a time lag of 6.25 ms or 12.5 ms in 300 series of 8per cell. In background-subtracted images, single molecules of YFP fluorescence are easily discernible. (D). PICS analysis of single moleculedisplacements, shown for dexamethasone-bound YFP-GR at time delay of 6.25 ms. The cumulative probability distribution as a function of thesquared distance l (black line) is best fitted with a 2-population model (red dashed line), while a 1-population model gives a suboptimal fit (blue line)(n = 20 cells). (E) FRAP procedure of dexamethasone-bound YFP-GR. At t = 0 s a 100 ms bleach pulse is applied to a strip spanning the nucleus.Subsequently, FRAP recovery curves of 30 cells are recorded, combined and adjusted to baseline fluorescence (black line). Subsequently, Monte Carlosimulations are generated using a 3-population model and fitted to the combined FRAP curve. The top 10 fits are combined (red line) and show agood fit of the experimental data with small residuals (blue line).doi:10.1371/journal.pone.0090532.g001
DNA Binding Dynamics of GR
PLOS ONE | www.plosone.org 3 March 2014 | Volume 9 | Issue 3 | e90532

methods). DNA-bound and thus immobile molecules should show
negligible displacement steps in these models. For YFP-GR, a one-
population model was unable to describe the experimental data
(Figure 1D), while a three-population model did not give consistent
results over different time lags or resulted in two fractions with
similar displacements. A two-population model fitted the observed
displacements consistently, and with high accuracy, and was
chosen for all analyses. Thus, we obtained the relative size and
mean squared displacement (MSD) of two fractions of YFP-GR
molecules that differed in their relative displacements over time.
We plotted the MSDs of the two identified fractions versus the
time lag and calculated the diffusion coefficients (Dfast and Dslow;
Figure 2B). The displacements of the ‘‘slow’’ fraction never
exceeded our detection limit (0.009 mm2) by more than 2-fold and
only increased marginally over time: Dslow of 0.0360.01 mm2/s.
This is very similar to the slow restricted movement of chromatin
[31,39], indicating that this ‘‘slow’’ fraction describes DNA-bound
molecules. In contrast, the remaining fraction showed .40-fold
higher displacements and a Dfast of 1.3160.13 mm2/s, represent-
ing YFP-GR molecules diffusing through the nucleus. The nuclear
GR population is approximately evenly distributed over the two
fractions; 55.162.0% belongs to the diffusing fraction, which
leaves 44.962.0% as bound fraction (Figure 2A, Table 1).
FRAP analysis of dexamethasone-bound YFP-GRSubsequently, we employed a quantitative FRAP approach on
similarly treated YFP-GR expressing COS-1 cells. In selected
nuclei a small strip, spanning the width of the nucleus, was
bleached with a 100 ms pulse of maximal laser power. This
bleached fluorescence within this area to ,30% of baseline levels
(Figure S1). The subsequent recovery of the fluorescence in this
strip was recorded (with 100 ms intervals) for 55 seconds
(Figure 1E). Comparable to previous results [3,4], a complete
recovery of YFP-GR fluorescence was seen well within 30 seconds
(Figure 1E). The obtained recovery curves were quantitatively
analyzed by fitting them to FRAP curves generated using Monte
Carlo simulations [6,35]. Our data was best fitted with a model in
which freely diffusing molecules (diffusion rates as obtained by
SMM were used) show transient binding with two different
durations (‘short’ and ‘long’; Figure 1E). Quantitative FRAP
analysis of dexamethasone-treated GR identified a diffusing
fraction of 4462%, a ‘short’ bound fraction of 3363% (average
binding of 0.760.1 sec) and a ‘long’ bound fraction of 2363%
(average binding of 2.360.3 sec) (Figure 2C and D).
As both bound fractions in FRAP remain bound for much
longer time periods than the time range used in SMM (less than
50 ms), these two fractions could be distinguished using FRAP, but
not by SMM. Indeed, the size of the single bound fraction in
SMM, is similar to the combined size of the two bound fractions
identified in FRAP (compare Figure 2A and 2C). Because we use
the Dfast determined by SMM as a fixed parameter in the Monte
Carlo simulations we wanted to make sure that this coefficient
does not determine the distribution of the remaining fractions.
Therefore, we redid the Monte Carlo modeling with the
Dfast6SEM, and this hardly affected the fraction sizes or
immobilization times of the bound fractions (Figure S2). Thus,
we conclude that the mobility patterns assessed by SMM at the
millisecond range are confirmed with realistic accuracy using an
independent FRAP approach.
YFP-GR mobility is dependent on ligand structureNext we used our combined SMM and FRAP approach to
investigate how binding of different ligands affects GR-DNA
binding dynamics. First, we showed that lowering the concentra-
tion of ligand increases the nuclear mobility of the GR. 1 mM and
100 nM of dexamethasone both induce a relatively immobile GR,
but 10 nM (a concentration nearing the Kd of ,5 nM [40,41])
results in a smaller DNA-bound fraction and faster diffusion
(Figure S3). Most likely this effect is due to an increased fraction of
unbound GR within the nucleus. Without hormone, most of the
GR remains in the cytoplasm. Still, the small fraction of nuclear
GR that can be measured with SMM shows a very high mobility
and an immobile fraction of only 16.665.0% (Figure S3).
Previously, we showed by FRAP that the structure of the ligand
is an important determinant of GR affinity also independent of the
fraction of bound receptor (i.e. at above saturating concentrations)
[3,4]. We identified important roles for the 17-hydroxyl and 9-
Figure 2. SMM and FRAP analyses provide a consistent modelof the intranuclear mobility of the GR. (A) A two-population fit ofSMM analysis for dexamethasone-bound YFP-GR identifies two fractionsof approximately equal size. (B) Both fractions show a linear increase inmean squared displacement (MSD) over time, but with a 40-folddifference in MSD. Diffusion coefficients (Dfast and Dslow) are calculatedfrom a linear fit of the experimental data (dashed lines; D = slope/4).The Dfast of 1.31 mm2/s fits to diffusing molecules, while the Dslow ofonly 0.03 mm2/s best fits to the slow movement of chromatin and themolecules bound to it. (C) A 3-population Monte Carlo simulation of theFRAP curve for dexamethasone-bound YFP-GR shows that half of thenuclear population is diffusing, while the remainder is subdivided intotwo bound fractions that differ in their immobilization times. Thefraction size of the diffusing fraction is similar in size as that obtainedfrom SMM analysis. (D) Both bound fractions are only transientlyimmobilized, with a 3-fold difference in duration. (A and B) Datarepresented as best fit 6 SEM (of 3 separate PICS analyses). (C and D)Data represented as average of top 10% best fits 6 SEM.doi:10.1371/journal.pone.0090532.g002
DNA Binding Dynamics of GR
PLOS ONE | www.plosone.org 4 March 2014 | Volume 9 | Issue 3 | e90532

Table 1. Summary of all SMM and FRAP analyses of YFP-GR, YFP-MR and YFP-GR deletion mutants.
SMM FRAP
Plasmid Treatment Fraction Fraction size (%) D (mm2/s) Fraction size (%) Imm. time (s)
GR wt D-Flu Diffusing 46.362.6 1.3860.11 4362.6 -
Short 53.762.6 0.0560.004 3362.1 0.860.1
Long 2462.2 2.960.5
Dex Diffusing 55.162.0 1.3160.13 4462.2 -
Short 44.962.0 0.0360.009 3362.6 0.760.1
Long 2362.6 2.360.3
Predn Diffusing 60.763.1 2.2060.11 4262.5 -
Short 39.363.1 0.0960.008 3661.6 0.760.1
Long 2262.5 4.060.8
Csol Diffusing 55.663.5 1.7760.10 5862.0 -
Short 44.463.5 0.0460.003 1963.8 0.560.1
Long 2362.6 2.060.0
Cort Diffusing 74.163.3 2.4960.24 6662.2 -
Short 25.963.3 0.0860.024 2663.7 0.660.1
Long 862.5 1.260.3
RU486 Diffusing 69.162.4 2.8660.11 6661.6 -
Short 30.962.4 0.1460.018 2463.1 0.560.1
Long 1062.6 1.460.3
MR wt Aldo Diffusing 54.163.4 1.4360.04 4561.7 -
Short 45.963.4 0.0560.002 3262.0 0.860.1
Long 2362.1 2.960.5
Cort Diffusing 50.761.4 1.3760.13 4762.1 -
Short 49.361.4 0.0860.005 3162.3 0.760.1
Long 2262.5 3.460.8
Csol Diffusing 51.560.8 1.9660.19 4462.2 -
Short 48.560.8 0.0560.002 3262.9 0.660.1
Long 2462.7 2.360.3
DOC Diffusing 60.56 3.6 1.6060.13 5761.5 -
Short 39.563.6 0.0660.003 2363.0 0.660.1
Long 2063.1 2.360.3
Dex Diffusing 64.366.0 1.7460.20 6762.1 -
Short 35.76 6.0 0.0460.003 2264.4 0.760.1
Long 1163.1 1.760.5
Spiro Diffusing 78.862.3 2.7160.05 7163.5 -
Short 21.262.3 0.0660.018 2363.7 0.560.1
Long 661.6 1.260.3
Epler Diffusing 68.266.6 2.4960.12 6661.6 -
Short 31.866.6 0.0660.004 2562.7 0.660.1
Long 962.3 1.760.5
GR DAF-1 Dex Diffusing 46.561.9 0.6160.08 5763.0 -
Short 53.561.9 0.0060.006 1863.6 0.660.1
Long 2563.4 2.160.4
Cort Diffusing 64.762.8 2.6960.08 6262.5 -
Short 35.362.8 0.0560.012 2764.0 0.660.1
Long 1162.3 1.660.3
GR DDBD Dex Diffusing 75.663.4 2.2760.15 6661.6 -
Short 24.463.4 0.0160.006 2562.7 0.560.1
Long 962.3 1.460.3
DNA Binding Dynamics of GR
PLOS ONE | www.plosone.org 5 March 2014 | Volume 9 | Issue 3 | e90532

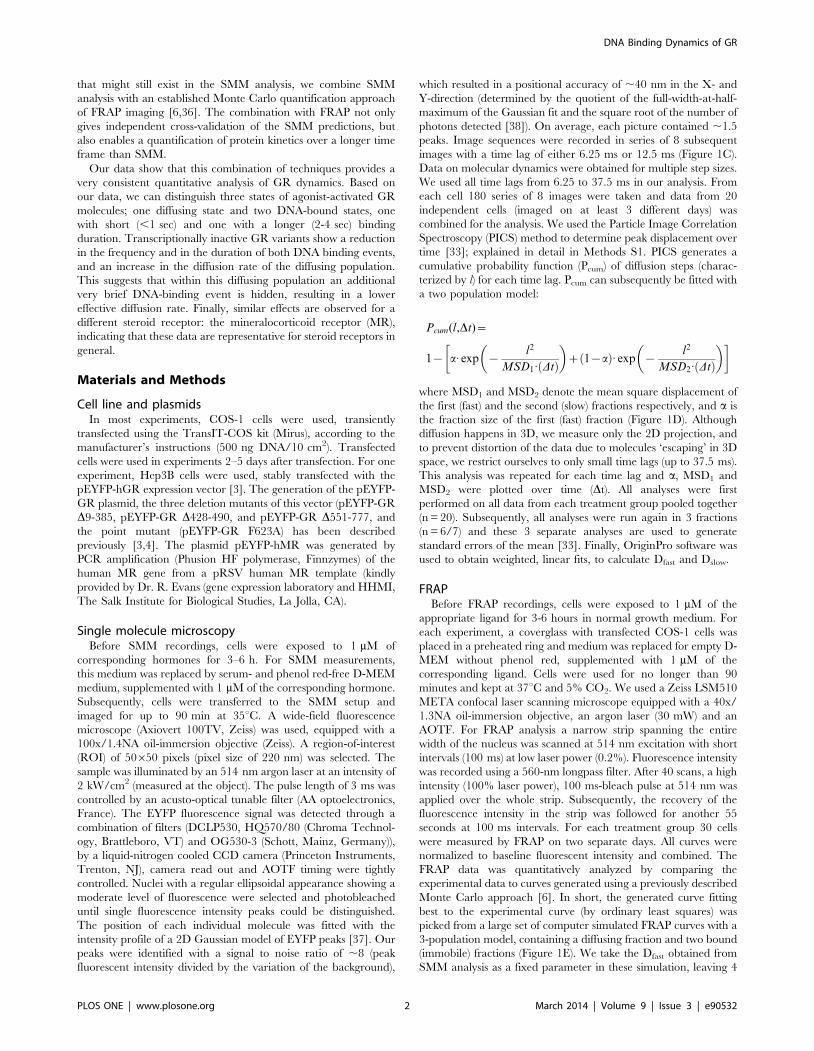
fluoro groups on the steroids, which induce a decrease in GR
mobility. In the present study, this was studied in more detail in
order to investigate which of the mobility parameters were
affected. Therefore, we tested a panel of GR agonists that enabled
us to study the effects of the 17-hydroxyl, 9-fluoro, and 16-methyl
groups and the 1, 4-pregnadien structure of the A ring. We used
dexamethasone (which contains all four structural elements), D-
fludrocortisone (same structure as dexamethasone, but lacking the
16-methyl group), prednisolone (same structure as D-fludrocorti-
sone, but lacking the 9-fluoro group), cortisol (same structure as
prednisolone, but having a 4-pregnen instead of a 1, 4-pregnadien
structure), and corticosterone (same structure as cortisol, but
lacking the 17-hydroxyl group). In addition to this panel of
agonists, the GR antagonist RU486 was used. Importantly, all
hormones were administered at a saturating concentration (1 mM),
thus the fraction of bound receptor should be similar for all ligands
[4,40,42,43].
Again, the two independent experimental approaches gave a
consistent pattern of fraction sizes for all 6 ligands tested. On
average the size of the diffusing fractions identified with SMM and
FRAP differed by only 7.862.6% (Table 1). Although a few
inconsistencies occurred, the data show that the 16-methyl group
does not affect GR mobility, but that the other structural elements
decrease the mobility of the receptor, indicating increased DNA
binding (Figure 3A and B).This decreased mobility was reflected in
changes in one or more parameters measured, but the data
indicate that ligand structure may have effects on all parameters
measured. Both the size of the bound fractions and their respective
binding times were different between ligands, so both on- and off-
rates of DNA binding were altered. In addition, the diffusion
coefficient of the diffusing fraction was affected, indicating that
altered DNA binding is associated with changes in diffusion of the
receptor (Figure 3A and Table 1). Binding of the antagonist
RU486 induces a very mobile nuclear YFP-GR, which is
comparable to the effect of corticosterone (Figure 3A and B).
It is known that the 9-fluoro group (present on D-fludrocorti-
sone and dexamethasone) creates a strong hydrogen bond with
phenylalanine at position 623 of GR’s ligand binding pocket [44],
suggesting that this amino acid is crucial in conferring the effects of
the 9-fluoro group. To test this association, phenylalanine 623 was
mutated to an alanine (F623A). We tested the mobility of F623A
with SMM in the presence of prednisolone and D-fludrocortisone,
which are identical except that D-fludrocortisone contains a 9-
fluoro group and prednisolone does not. In the presence of either
steroid the F623A mutant fully translocates to the nuclear
compartment (Figure 3C). Within the nucleus, no difference in
F623A mobility was observed between D-fludrocortisone and
prednisolone (Figure 3D, compare to data in Figure 3A).
Therefore we conclude that the effect of the 9-fluoro group on
DNA binding dynamics is indeed mediated by phenylalanine 623.
YFP-MR mobility is also dependent on ligand structureThe mineralocorticoid receptor (MR) is a steroid receptor with
high similarity to the GR. Not only is it structurally related to the
GR, but it is also activated by some of the same ligands, with
different affinities [43,45,46,47]. For example, corticosterone is a
high-affinity agonist for the MR, while dexamethasone has only a
moderate affinity for the MR [42,47], and the reverse is true for
the GR. To elucidate whether agonist effects on receptor DNA
binding dynamics result from specific ligand-receptor interaction
or from ligand-specific characteristics, we tested the intranuclear
dynamics of YFP-MR after activation by a selected panel of
agonists and antagonists. A panel was tested that enabled us to
study the effects of the 18-keto, and 11- and 17-hydroxyl groups on
naturally occurring mineralocorticoid receptor agonists. We used
aldosterone (which contains an 18-keto and 11-hydroxyl group),
corticosterone (same structure as aldosterone, but lacking the 18-
keto group), cortisol (same structure as corticosterone, but
containing an additional 17-hydroxyl group), and deoxycortico-
sterone (same structure as corticosterone, but lacking the 11-
hydroxyl group). In addition, the GR agonist dexamethasone and
two MR antagonists, spironolactone and eplerenone were
included. The results are presented in Figure 4.
Upon binding of corticosterone, 50.761.4% (SMM) to 4762%
(FRAP) of nuclear MR molecules belong to the diffusing fraction,
with a Dfast of 1.3760.13 mm2/s. The remaining 53% to 49.3% of
the nuclear MR population is bound to DNA, for 0.760.1 second
(3162.3%) or 3.460.8 seconds (2262.5%, Figure 4). This pattern
closely resembles that of the GR after activation by the agonists
dexamethasone and D-fludrocortisone, and is very different from
the pattern observed for GR in the presence of corticosterone,
confirming that the ligand-receptor interaction determines recep-
tor-DNA binding and not the nature of the ligand. Aldosterone
and cortisol induced a similar mobility of the MR as corticosterone
does, which indicates that the 11- and 17-hydroxyl groups are not
involved in determining MRs DNA binding dynamics. In contrast,
deoxycorticosterone gave a higher nuclear mobility, which
suggests that the presence of the 11-hydroxyl group positively
Table 1. Cont.
SMM FRAP
Plasmid Treatment Fraction Fraction size (%) D (mm2/s) Fraction size (%) Imm. time (s)
Cort Diffusing 81.361.0 2.3760.19 7963.1 -
Short 18.761.0 0.0660.004 1863.9 0.560.1
Long 361.5 0.660.3
GR DLBD Dex Diffusing 86.561.9 2.7160.08 8263.3 -
Short 13.561.9 0.0360.010 1663.1 0.460.1
Long 261.3 0.460.3
Short, ‘short’ bound fraction; long, ‘long’ bound fraction; D, diffusion coefficient; imm. time, average immobilization time; D-Flu, D-Fludrocortisone; dex, dexamethasone;Predn, prednisolone; csol, cortisol; cort, corticosterone; aldo, aldosterone; DOC, deoxycorticosterone; spiro, spironolactone; epler, eplerenone. Fraction size and diffusioncoefficient for immobile fraction in SMM are for both immobile fractions combined. Results are represented as best fit 6 SEM (of three separate fits) for SMM and asaverage 6 SEM of top 10% fits for FRAP.doi:10.1371/journal.pone.0090532.t001
DNA Binding Dynamics of GR
PLOS ONE | www.plosone.org 6 March 2014 | Volume 9 | Issue 3 | e90532
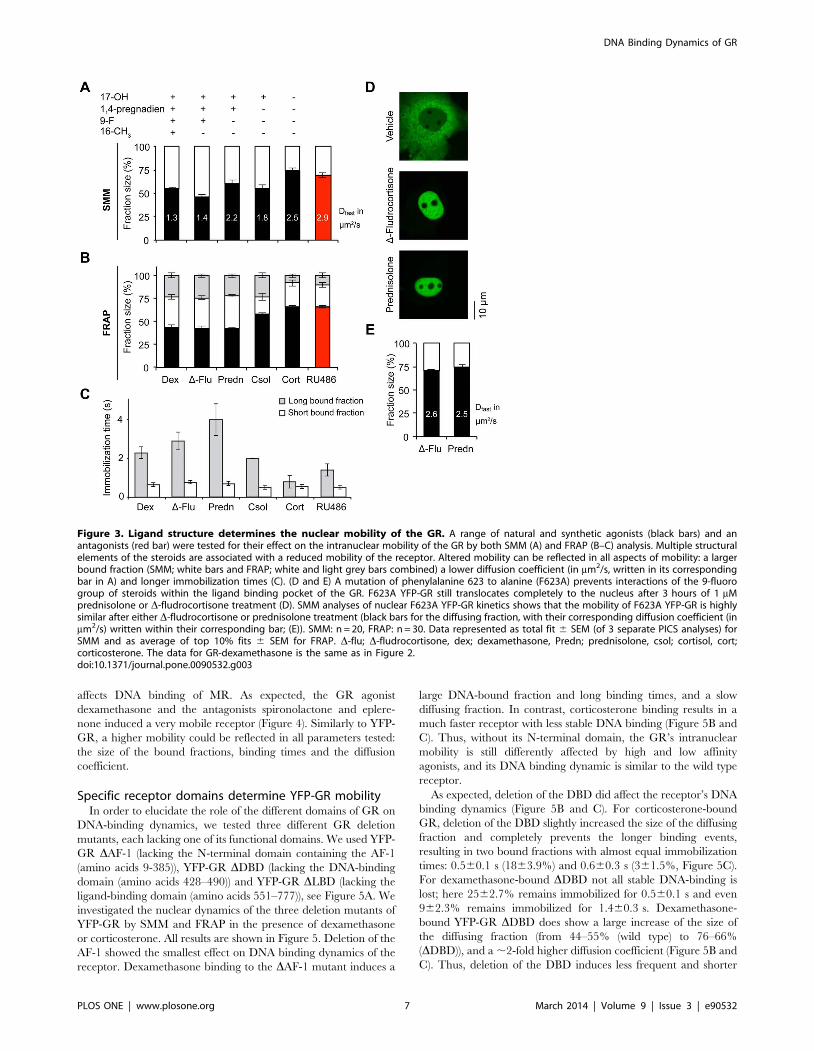
affects DNA binding of MR. As expected, the GR agonist
dexamethasone and the antagonists spironolactone and eplere-
none induced a very mobile receptor (Figure 4). Similarly to YFP-
GR, a higher mobility could be reflected in all parameters tested:
the size of the bound fractions, binding times and the diffusion
coefficient.
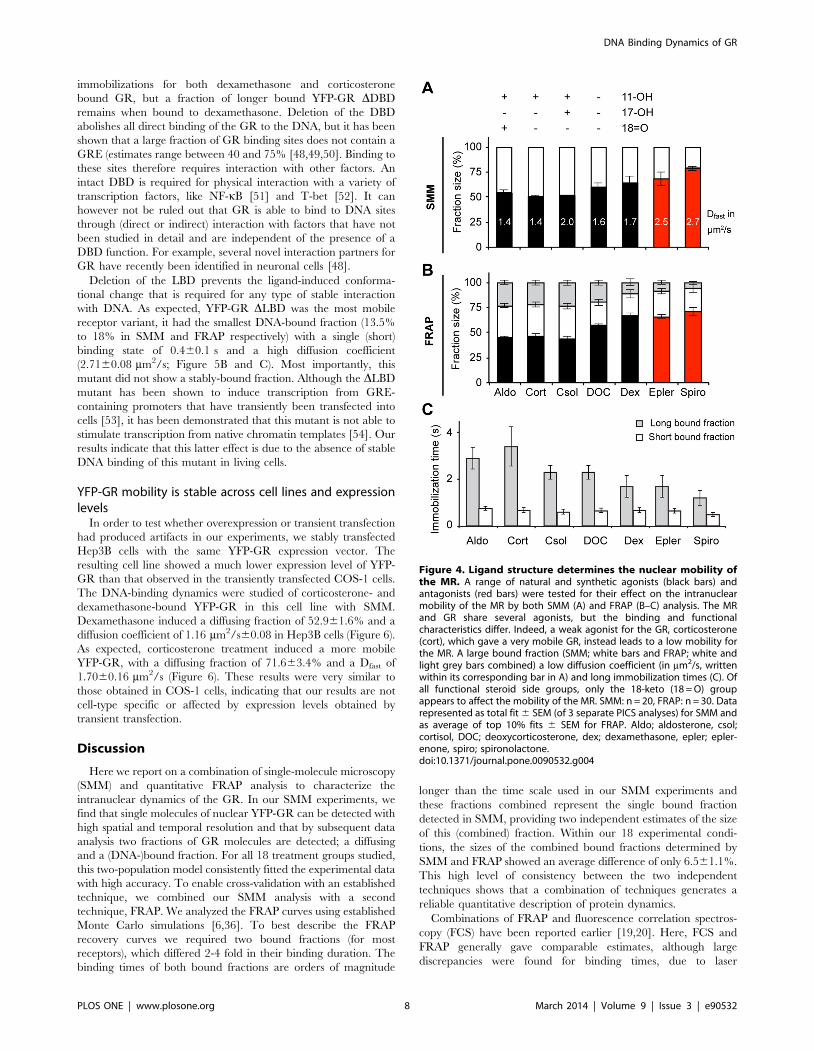
Specific receptor domains determine YFP-GR mobilityIn order to elucidate the role of the different domains of GR on
DNA-binding dynamics, we tested three different GR deletion
mutants, each lacking one of its functional domains. We used YFP-
GR DAF-1 (lacking the N-terminal domain containing the AF-1
(amino acids 9-385)), YFP-GR DDBD (lacking the DNA-binding
domain (amino acids 428–490)) and YFP-GR DLBD (lacking the
ligand-binding domain (amino acids 551–777)), see Figure 5A. We
investigated the nuclear dynamics of the three deletion mutants of
YFP-GR by SMM and FRAP in the presence of dexamethasone
or corticosterone. All results are shown in Figure 5. Deletion of the
AF-1 showed the smallest effect on DNA binding dynamics of the
receptor. Dexamethasone binding to the DAF-1 mutant induces a
large DNA-bound fraction and long binding times, and a slow
diffusing fraction. In contrast, corticosterone binding results in a
much faster receptor with less stable DNA binding (Figure 5B and
C). Thus, without its N-terminal domain, the GR’s intranuclear
mobility is still differently affected by high and low affinity
agonists, and its DNA binding dynamic is similar to the wild type
receptor.
As expected, deletion of the DBD did affect the receptor’s DNA
binding dynamics (Figure 5B and C). For corticosterone-bound
GR, deletion of the DBD slightly increased the size of the diffusing
fraction and completely prevents the longer binding events,
resulting in two bound fractions with almost equal immobilization
times: 0.560.1 s (1863.9%) and 0.660.3 s (361.5%, Figure 5C).
For dexamethasone-bound DDBD not all stable DNA-binding is
lost; here 2562.7% remains immobilized for 0.560.1 s and even
962.3% remains immobilized for 1.460.3 s. Dexamethasone-
bound YFP-GR DDBD does show a large increase of the size of
the diffusing fraction (from 44–55% (wild type) to 76–66%
(DDBD)), and a ,2-fold higher diffusion coefficient (Figure 5B and
C). Thus, deletion of the DBD induces less frequent and shorter
Figure 3. Ligand structure determines the nuclear mobility of the GR. A range of natural and synthetic agonists (black bars) and anantagonists (red bar) were tested for their effect on the intranuclear mobility of the GR by both SMM (A) and FRAP (B–C) analysis. Multiple structuralelements of the steroids are associated with a reduced mobility of the receptor. Altered mobility can be reflected in all aspects of mobility: a largerbound fraction (SMM; white bars and FRAP; white and light grey bars combined) a lower diffusion coefficient (in mm2/s, written in its correspondingbar in A) and longer immobilization times (C). (D and E) A mutation of phenylalanine 623 to alanine (F623A) prevents interactions of the 9-fluorogroup of steroids within the ligand binding pocket of the GR. F623A YFP-GR still translocates completely to the nucleus after 3 hours of 1 mMprednisolone or D-fludrocortisone treatment (D). SMM analyses of nuclear F623A YFP-GR kinetics shows that the mobility of F623A YFP-GR is highlysimilar after either D-fludrocortisone or prednisolone treatment (black bars for the diffusing fraction, with their corresponding diffusion coefficient (inmm2/s) written within their corresponding bar; (E)). SMM: n = 20, FRAP: n = 30. Data represented as total fit 6 SEM (of 3 separate PICS analyses) forSMM and as average of top 10% fits 6 SEM for FRAP. D-flu; D-fludrocortisone, dex; dexamethasone, Predn; prednisolone, csol; cortisol, cort;corticosterone. The data for GR-dexamethasone is the same as in Figure 2.doi:10.1371/journal.pone.0090532.g003
DNA Binding Dynamics of GR
PLOS ONE | www.plosone.org 7 March 2014 | Volume 9 | Issue 3 | e90532
immobilizations for both dexamethasone and corticosterone
bound GR, but a fraction of longer bound YFP-GR DDBD
remains when bound to dexamethasone. Deletion of the DBD
abolishes all direct binding of the GR to the DNA, but it has been
shown that a large fraction of GR binding sites does not contain a
GRE (estimates range between 40 and 75% [48,49,50]. Binding to
these sites therefore requires interaction with other factors. An
intact DBD is required for physical interaction with a variety of
transcription factors, like NF-kB [51] and T-bet [52]. It can
however not be ruled out that GR is able to bind to DNA sites
through (direct or indirect) interaction with factors that have not
been studied in detail and are independent of the presence of a
DBD function. For example, several novel interaction partners for
GR have recently been identified in neuronal cells [48].
Deletion of the LBD prevents the ligand-induced conforma-
tional change that is required for any type of stable interaction
with DNA. As expected, YFP-GR DLBD was the most mobile
receptor variant, it had the smallest DNA-bound fraction (13.5%
to 18% in SMM and FRAP respectively) with a single (short)
binding state of 0.460.1 s and a high diffusion coefficient
(2.7160.08 mm2/s; Figure 5B and C). Most importantly, this
mutant did not show a stably-bound fraction. Although the DLBD
mutant has been shown to induce transcription from GRE-
containing promoters that have transiently been transfected into
cells [53], it has been demonstrated that this mutant is not able to
stimulate transcription from native chromatin templates [54]. Our
results indicate that this latter effect is due to the absence of stable
DNA binding of this mutant in living cells.
YFP-GR mobility is stable across cell lines and expressionlevels
In order to test whether overexpression or transient transfection
had produced artifacts in our experiments, we stably transfected
Hep3B cells with the same YFP-GR expression vector. The
resulting cell line showed a much lower expression level of YFP-
GR than that observed in the transiently transfected COS-1 cells.
The DNA-binding dynamics were studied of corticosterone- and
dexamethasone-bound YFP-GR in this cell line with SMM.
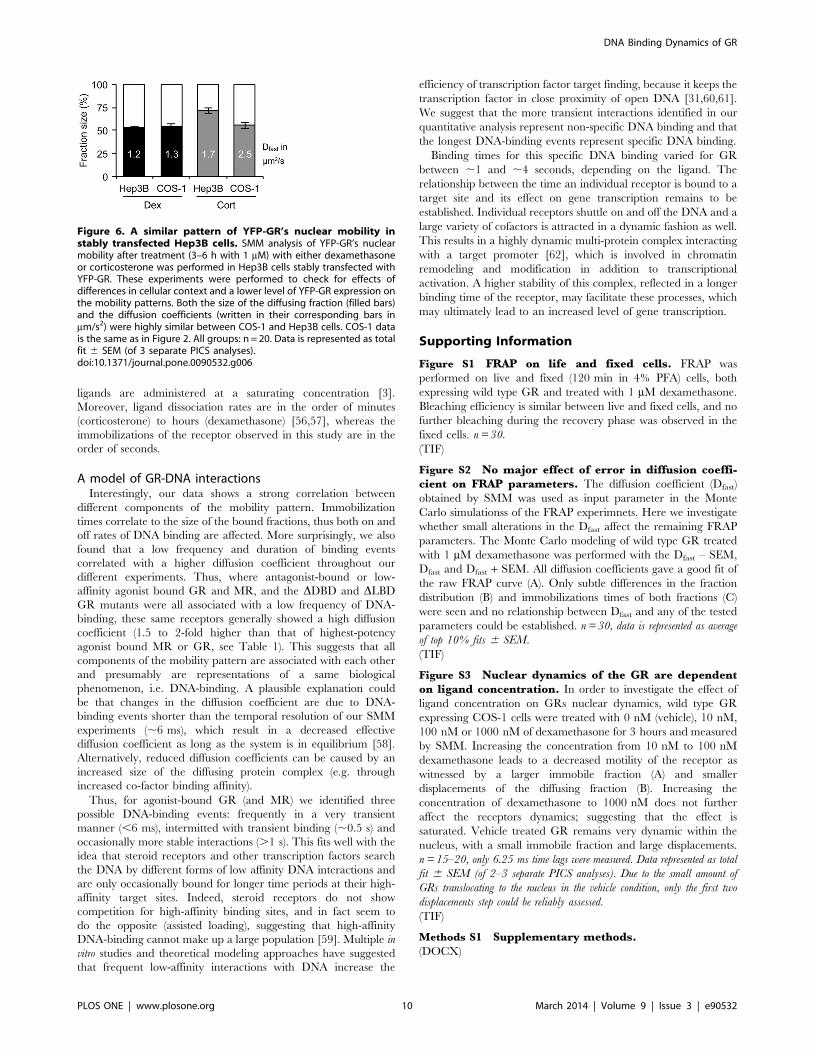
Dexamethasone induced a diffusing fraction of 52.961.6% and a
diffusion coefficient of 1.16 mm2/s60.08 in Hep3B cells (Figure 6).
As expected, corticosterone treatment induced a more mobile
YFP-GR, with a diffusing fraction of 71.663.4% and a Dfast of
1.7060.16 mm2/s (Figure 6). These results were very similar to
those obtained in COS-1 cells, indicating that our results are not
cell-type specific or affected by expression levels obtained by
transient transfection.
Discussion
Here we report on a combination of single-molecule microscopy
(SMM) and quantitative FRAP analysis to characterize the
intranuclear dynamics of the GR. In our SMM experiments, we
find that single molecules of nuclear YFP-GR can be detected with
high spatial and temporal resolution and that by subsequent data
analysis two fractions of GR molecules are detected; a diffusing
and a (DNA-)bound fraction. For all 18 treatment groups studied,
this two-population model consistently fitted the experimental data
with high accuracy. To enable cross-validation with an established
technique, we combined our SMM analysis with a second
technique, FRAP. We analyzed the FRAP curves using established
Monte Carlo simulations [6,36]. To best describe the FRAP
recovery curves we required two bound fractions (for most
receptors), which differed 2-4 fold in their binding duration. The
binding times of both bound fractions are orders of magnitude
longer than the time scale used in our SMM experiments and
these fractions combined represent the single bound fraction
detected in SMM, providing two independent estimates of the size
of this (combined) fraction. Within our 18 experimental condi-
tions, the sizes of the combined bound fractions determined by
SMM and FRAP showed an average difference of only 6.561.1%.
This high level of consistency between the two independent
techniques shows that a combination of techniques generates a
reliable quantitative description of protein dynamics.
Combinations of FRAP and fluorescence correlation spectros-
copy (FCS) have been reported earlier [19,20]. Here, FCS and
FRAP generally gave comparable estimates, although large
discrepancies were found for binding times, due to laser
Figure 4. Ligand structure determines the nuclear mobility ofthe MR. A range of natural and synthetic agonists (black bars) andantagonists (red bars) were tested for their effect on the intranuclearmobility of the MR by both SMM (A) and FRAP (B–C) analysis. The MRand GR share several agonists, but the binding and functionalcharacteristics differ. Indeed, a weak agonist for the GR, corticosterone(cort), which gave a very mobile GR, instead leads to a low mobility forthe MR. A large bound fraction (SMM; white bars and FRAP; white andlight grey bars combined) a low diffusion coefficient (in mm2/s, writtenwithin its corresponding bar in A) and long immobilization times (C). Ofall functional steroid side groups, only the 18-keto (18 = O) groupappears to affect the mobility of the MR. SMM: n = 20, FRAP: n = 30. Datarepresented as total fit 6 SEM (of 3 separate PICS analyses) for SMM andas average of top 10% fits 6 SEM for FRAP. Aldo; aldosterone, csol;cortisol, DOC; deoxycorticosterone, dex; dexamethasone, epler; epler-enone, spiro; spironolactone.doi:10.1371/journal.pone.0090532.g004
DNA Binding Dynamics of GR
PLOS ONE | www.plosone.org 8 March 2014 | Volume 9 | Issue 3 | e90532
irregularities. Recently, Mazza and colleagues reported on a
similar combinational approach with FRAP and single-molecule
microscopy, in their case also combined with FCS [19]. In this
study the mobility of p53, a well-known transcription factor was
assessed and single-molecule tracking was used to guide the
choices in models used for FRAP and FCS quantitation. Wild type
p53 showed a much smaller DNA-bound fraction (,20%) than
agonist-activated GR does in our study, but in both studies
mutations in the DNA-binding domains give a large reduction in
size and residence time of the DNA-bound fractions [19].
Similarly, another study investigated the nuclear dynamics of the
transcription factor STAT1 by single-molecule tracking [22].
Activation of STAT1 by its activator (interferon-c) resulted in a
large increase in both the size of the bound fraction and binding
duration. In a third study, Gebhardt et al. [18] applied SMM on
the GR, using reflected light sheet microscopy technology with a
temporal resolution and positional accuracy comparable to our
study. In this study unbound and dexamethasone-bound GR and
the DDBD mutant were analyzed. Their data are well in line with
ours, in particular the obtained values for the sizes of the diffusing
and bound fractions and of binding times [18]. Discrepancies exist
in the analysis of the diffusing fraction. Gebhardt et al. studied
displacements during a fixed time interval of 10 ms, and could fit
the distribution of these displacements using a model with two
freely diffusing fractions. In the present study, displacements were
investigated using a series of eight increasing time intervals.
Although at some time intervals a third intermediate fraction
could be distinguished, the size and diffusion rate of this fraction
were not consistent between time intervals. We therefore fitted our
data to a model containing only one freely diffusing fraction. As
shown by Mazza et al. [19], it is likely that any diffusion coefficient
is a simple representation of the more complex nature of
transcription factor diffusion on a continuous scale. Importantly,
Mazza et al. [19] also showed that since the DNA-bound fraction
and the freely diffusing fraction are in general well separated, the
determination of the size of the DNA-bound fraction and its
binding time is not very sensitive to details of the method used for
analysis of the freely diffusing fraction.
Ligand structure affects the DNA-binding profile ofnuclear GR
We observed profound differences in the nuclear dynamics of
the GR and MR depending on the ligand it was bound to
(Figures 3 and 4), even among agonists. For example, the synthetic
GR agonists dexamethasone and D-fludrocortisone induce a larger
DNA-bound fraction with longer residence times than the
naturally occurring agonists cortisol and corticosterone. Struc-
ture-function studies showed that the 17-hydroxyl, and 9-fluoro
groups and the 1,4-pregnadien structure of the A ring of these
steroids were involved in the increased DNA binding of GR. For
MR, different structural elements appear to play a role (the 11-
hydroxyl group increases the frequency and duration of DNA
binding of MR), which demonstrates that it is the interaction
between the steroid and the receptor that determines its mobility.
To confirm this, we showed that the effect of the 9-fluoro group
depends on the presence of phenylalanine at position 623 of the
GR LBD, the amino acid it is known to interact with [44]. This
phenylalanine residue, like the glutamine residue at position 642
which interacts with 17-hydroxyl group, is located in a region of
the LBD that has been shown to be involved in receptor
dimerization [44]. It may therefore be suggested that these specific
interactions shape the receptor into a conformation that favors
receptor dimerization, and that these dimers have higher DNA
binding affinity. We have previously suggested a similar model for
AR dimerization and DNA binding [2].
Many of these structural elements also affect the affinity of the
ligand and it could therefore be argued that the affinity of the
ligand determines the receptor mobility. However, affinity and
mobility are not always correlated. In the present study, we show
that the 11-hydroxyl group affects the mobility of the MR (there is
a difference between the effects of corticosterone and deoxycor-
ticosterone), but it has been shown not to alter the receptor
binding affinity [55]. In addition, in a previous study we have
shown that the 16-hydroxyl group of triamcinolone dramatically
decreases the binding affinity for GR, but leaves GR mobility
unaffected [3,4]. Furthermore, mechanistically it is unlikely that
ligand affinity is a determinant of receptor mobility since all
Figure 5. Loss of either the DNA-binding or the ligand-bindingdomain results in a high GR mobility. (A) Schematic representationof three functional YFP-GR deletion mutants tested. (B and C) Fractiondistributions as analyzed by SMM (B) and FRAP (C). Diffusion coefficientsare written within the corresponding bars in B (in mm2/s). (D)Immobilization times of both bound fractions in FRAP. While loss ofthe AF-1 domain hardly affects GR’s nuclear mobility, deletion of theDBD and especially the LBD leads to a very mobile receptor withreduced frequency and average duration of DNA-binding and a higherdiffusion coefficient. SMM: n = 20, FRAP: n = 30. Data represented astotal fit 6 SEM (of 3 separate PICS analyses) for B and as average of top10% fits 6 SEM for C and D. The data for wild type GR is the same as inFigure 3.doi:10.1371/journal.pone.0090532.g005
DNA Binding Dynamics of GR
PLOS ONE | www.plosone.org 9 March 2014 | Volume 9 | Issue 3 | e90532
ligands are administered at a saturating concentration [3].
Moreover, ligand dissociation rates are in the order of minutes
(corticosterone) to hours (dexamethasone) [56,57], whereas the
immobilizations of the receptor observed in this study are in the
order of seconds.
A model of GR-DNA interactionsInterestingly, our data shows a strong correlation between
different components of the mobility pattern. Immobilization
times correlate to the size of the bound fractions, thus both on and
off rates of DNA binding are affected. More surprisingly, we also
found that a low frequency and duration of binding events
correlated with a higher diffusion coefficient throughout our
different experiments. Thus, where antagonist-bound or low-
affinity agonist bound GR and MR, and the DDBD and DLBD
GR mutants were all associated with a low frequency of DNA-
binding, these same receptors generally showed a high diffusion
coefficient (1.5 to 2-fold higher than that of highest-potency
agonist bound MR or GR, see Table 1). This suggests that all
components of the mobility pattern are associated with each other
and presumably are representations of a same biological
phenomenon, i.e. DNA-binding. A plausible explanation could
be that changes in the diffusion coefficient are due to DNA-
binding events shorter than the temporal resolution of our SMM
experiments (,6 ms), which result in a decreased effective
diffusion coefficient as long as the system is in equilibrium [58].
Alternatively, reduced diffusion coefficients can be caused by an
increased size of the diffusing protein complex (e.g. through
increased co-factor binding affinity).
Thus, for agonist-bound GR (and MR) we identified three
possible DNA-binding events: frequently in a very transient
manner (,6 ms), intermitted with transient binding (,0.5 s) and
occasionally more stable interactions (.1 s). This fits well with the
idea that steroid receptors and other transcription factors search
the DNA by different forms of low affinity DNA interactions and
are only occasionally bound for longer time periods at their high-
affinity target sites. Indeed, steroid receptors do not show
competition for high-affinity binding sites, and in fact seem to
do the opposite (assisted loading), suggesting that high-affinity
DNA-binding cannot make up a large population [59]. Multiple in
vitro studies and theoretical modeling approaches have suggested
that frequent low-affinity interactions with DNA increase the
efficiency of transcription factor target finding, because it keeps the
transcription factor in close proximity of open DNA [31,60,61].
We suggest that the more transient interactions identified in our
quantitative analysis represent non-specific DNA binding and that
the longest DNA-binding events represent specific DNA binding.
Binding times for this specific DNA binding varied for GR
between ,1 and ,4 seconds, depending on the ligand. The
relationship between the time an individual receptor is bound to a
target site and its effect on gene transcription remains to be
established. Individual receptors shuttle on and off the DNA and a
large variety of cofactors is attracted in a dynamic fashion as well.
This results in a highly dynamic multi-protein complex interacting
with a target promoter [62], which is involved in chromatin
remodeling and modification in addition to transcriptional
activation. A higher stability of this complex, reflected in a longer
binding time of the receptor, may facilitate these processes, which
may ultimately lead to an increased level of gene transcription.
Supporting Information
Figure S1 FRAP on life and fixed cells. FRAP was
performed on live and fixed (120 min in 4% PFA) cells, both
expressing wild type GR and treated with 1 mM dexamethasone.
Bleaching efficiency is similar between live and fixed cells, and no
further bleaching during the recovery phase was observed in the
fixed cells. n = 30.
(TIF)
Figure S2 No major effect of error in diffusion coeffi-cient on FRAP parameters. The diffusion coefficient (Dfast)
obtained by SMM was used as input parameter in the Monte
Carlo simulationss of the FRAP experimnets. Here we investigate
whether small alterations in the Dfast affect the remaining FRAP
parameters. The Monte Carlo modeling of wild type GR treated
with 1 mM dexamethasone was performed with the Dfast – SEM,
Dfast and Dfast + SEM. All diffusion coefficients gave a good fit of
the raw FRAP curve (A). Only subtle differences in the fraction
distribution (B) and immobilizations times of both fractions (C)
were seen and no relationship between Dfast and any of the tested
parameters could be established. n = 30, data is represented as average
of top 10% fits 6 SEM.
(TIF)
Figure S3 Nuclear dynamics of the GR are dependenton ligand concentration. In order to investigate the effect of
ligand concentration on GRs nuclear dynamics, wild type GR
expressing COS-1 cells were treated with 0 nM (vehicle), 10 nM,
100 nM or 1000 nM of dexamethasone for 3 hours and measured
by SMM. Increasing the concentration from 10 nM to 100 nM
dexamethasone leads to a decreased motility of the receptor as
witnessed by a larger immobile fraction (A) and smaller
displacements of the diffusing fraction (B). Increasing the
concentration of dexamethasone to 1000 nM does not further
affect the receptors dynamics; suggesting that the effect is
saturated. Vehicle treated GR remains very dynamic within the
nucleus, with a small immobile fraction and large displacements.
n = 15–20, only 6.25 ms time lags were measured. Data represented as total
fit 6 SEM (of 2–3 separate PICS analyses). Due to the small amount of
GRs translocating to the nucleus in the vehicle condition, only the first two
displacements step could be reliably assessed.
(TIF)
Methods S1 Supplementary methods.
(DOCX)
Figure 6. A similar pattern of YFP-GR’s nuclear mobility instably transfected Hep3B cells. SMM analysis of YFP-GR’s nuclearmobility after treatment (3–6 h with 1 mM) with either dexamethasoneor corticosterone was performed in Hep3B cells stably transfected withYFP-GR. These experiments were performed to check for effects ofdifferences in cellular context and a lower level of YFP-GR expression onthe mobility patterns. Both the size of the diffusing fraction (filled bars)and the diffusion coefficients (written in their corresponding bars inmm/s2) were highly similar between COS-1 and Hep3B cells. COS-1 datais the same as in Figure 2. All groups: n = 20. Data is represented as totalfit 6 SEM (of 3 separate PICS analyses).doi:10.1371/journal.pone.0090532.g006
DNA Binding Dynamics of GR
PLOS ONE | www.plosone.org 10 March 2014 | Volume 9 | Issue 3 | e90532
Author Contributions
Conceived and designed the experiments: FLG MEvR ERdK ABH TSS
MJMS. Performed the experiments: FLG MEvR SF JP MJMS VIPK.
Analyzed the data: FLG MEvR SF BG MJMS VIPK. Wrote the paper:
FLG MJMS.
References
1. Stenoien DL, Patel K, Mancini MG, Dutertre M, Smith CL, et al. (2001) FRAPreveals that mobility of oestrogen receptor-alpha is ligand- and proteasome-
dependent. Nat Cell Biol 3: 15–23.
2. van Royen ME, van Cappellen WA, de Vos C, Houtsmuller AB, Trapman J
(2012) Stepwise androgen receptor dimerization. J Cell Science 125: 1970–1979.
3. Schaaf MJ, Cidlowski JA (2003) Molecular determinants of glucocorticoidreceptor mobility in living cells: the importance of ligand affinity. Mol Cell Biol
23: 1922–1934.
4. Schaaf MJ, Lewis-Tuffin LJ, Cidlowski JA (2005) Ligand-selective targeting of
the glucocorticoid receptor to nuclear subdomains is associated with decreasedreceptor mobility. Mol Endocrinol 19: 1501–1515.
5. Schaaf MJ, Willetts L, Hayes BP, Maschera B, Stylianou E, et al. (2006) The
relationship between intranuclear mobility of the NF-kappaB subunit p65 and its
DNA binding affinity. J Biol Chem 281: 22409–22420.
6. van Royen ME, Farla P, Mattern KA, Geverts B, Trapman J, et al. (2009)Fluorescence recovery after photobleaching (FRAP) to study nuclear protein
dynamics in living cells. Methods Mol Biol 464: 363–385.
7. Hager GL, McNally JG, Misteli T (2009) Transcription dynamics. Mol Cell 35:741–753.
8. Stavreva DA, Muller WG, Hager GL, Smith CL, McNally JG (2004) Rapidglucocorticoid receptor exchange at a promoter is coupled to transcription and
regulated by chaperones and proteasomes. Mol Cell Biol 24: 2682–2697.
9. Mueller F, Mazza D, Stasevich TJ, McNally JG (2010) FRAP and kineticmodeling in the analysis of nuclear protein dynamics: what do we really know?
Curr Opin Cell Biol 22: 403–411.
10. Biddie SC, Hager GL (2009) Glucocorticoid receptor dynamics and gene
regulation. Stress 12: 193–205.
11. Gorski SA, Dundr M, Misteli T (2006) The road much traveled: trafficking inthe cell nucleus. Curr Opin Cell Biol 18: 284–290.
12. Beato M, Sanchez-Pacheco A (1996) Interaction of steroid hormone receptors
with the transcription initiation complex. Endocr Rev 17: 587–609.
13. Heitzer MD, Wolf IM, Sanchez ER, Witchel SF, DeFranco DB (2007)
Glucocorticoid receptor physiology. Rev Endocr Metab Disord 8: 321–330.
14. Datson NA, Morsink MC, Meijer OC, de Kloet ER (2008) Centralcorticosteroid actions: Search for gene targets. Eur J Pharmacol 583: 272–289.
15. Mueller F, Wach P, McNally JG (2008) Evidence for a common mode oftranscription factor interaction with chromatin as revealed by improved
quantitative fluorescence recovery after photobleaching. Biophys J 94: 3323–3339.
16. McNally JG, Muller WG, Walker D, Wolford R, Hager GL (2000) The
glucocorticoid receptor: rapid exchange with regulatory sites in living cells.
Science 287: 1262–1265.
17. Elbi C, Walker DA, Romero G, Sullivan WP, Toft DO, et al. (2004) Molecularchaperones function as steroid receptor nuclear mobility factors. Proc Natl Acad
Sci USA 101: 2876–2881.
18. Gebhardt JC, Suter DM, Roy R, Zhao ZW, Chapman AR, et al. (2013) Single-molecule imaging of transcription factor binding to DNA in live mammalian
cells. Nature Methods 10: 421–426.
19. Mazza D, Stasevich TJ, Karpova TS, McNally JG (2012) Monitoring dynamic
binding of chromatin proteins in vivo by fluorescence correlation spectroscopyand temporal image correlation spectroscopy. Methods Mol Biol 833: 177–200.
20. Stasevich TJ, Mueller F, Michelman-Ribeiro A, Rosales T, Knutson JR, et al.
(2010) Cross-validating FRAP and FCS to quantify the impact of photobleach-
ing on in vivo binding estimates. Biophys J 99: 3093–3101.
21. Li GW, Xie XS (2011) Central dogma at the single-molecule level in living cells.Nature 475: 308–315.
22. Speil J, Baumgart E, Siebrasse JP, Veith R, Vinkemeier U, et al. (2011)
Activated STAT1 transcription factors conduct distinct saltatory movements in
the cell nucleus. Biophys J 101: 2592–2600.
23. Lord SJ, Lee HL, Moerner WE (2010) Single-molecule spectroscopy andimaging of biomolecules in living cells. Anal Chem 82: 2192–2203.
24. Lommerse PH, Blab GA, Cognet L, Harms GS, Snaar-Jagalska BE, et al. (2004)
Single-molecule imaging of the H-ras membrane-anchor reveals domains in thecytoplasmic leaflet of the cell membrane. Biophys J 86: 609–616.
25. Schaaf MJ, Koopmans WJ, Meckel T, van Noort J, Snaar-Jagalska BE, et al.(2009) Single-molecule microscopy reveals membrane microdomain organiza-
tion of cells in a living vertebrate. Biophys J 97: 1206–1214.
26. Serge A, de Keijzer S, Van Hemert F, Hickman MR, Hereld D, et al. (2011)Quantification of GPCR internalization by single-molecule microscopy in living
cells. Integr Biol (Camb) 3: 675–683.
27. Kasai RS, Suzuki KG, Prossnitz ER, Koyama-Honda I, Nakada C, et al. (2011)
Full characterization of GPCR monomer-dimer dynamic equilibrium by singlemolecule imaging. J Cell Biol 192: 463–480.
28. Suzuki K, Ritchie K, Kajikawa E, Fujiwara T, Kusumi A (2005) Rapid hop
diffusion of a G-protein-coupled receptor in the plasma membrane as revealed
by single-molecule techniques. Biophys J 88: 3659–3680.
29. Yang W, Gelles J, Musser SM (2004) Imaging of single-molecule translocation
through nuclear pore complexes. Proc Natl Acad Sci USA 101: 12887–12892.
30. Yang W, Musser SM (2006) Visualizing single molecules interacting with nuclear
pore complexes by narrow-field epifluorescence microscopy. Methods 39: 316–
328.
31. Elf J, Li GW, Xie XS (2007) Probing transcription factor dynamics at the single-
molecule level in a living cell. Science 316: 1191–1194.
32. Li GW, Elf J (2009) Single molecule approaches to transcription factor kinetics in
living cells. FEBS Lett 583: 3979–3983.
33. Semrau S, Schmidt T (2007) Particle image correlation spectroscopy (PICS):
retrieving nanometer-scale correlations from high-density single-molecule
position data. Biophys J 92: 613–621.
34. Schutz GJ, Schindler H, Schmidt T (1997) Single-molecule microscopy on
model membranes reveals anomalous diffusion. Biophys J 73: 1073–1080.
35. van Royen ME, Dinant C, Farla P, Trapman J, Houtsmuller AB (2009) FRAP
and FRET methods to study nuclear receptors in living cells. Methods Mol
Biology 505: 69–96.
36. Farla P, Hersmus R, Geverts B, Mari PO, Nigg AL, et al. (2004) The androgen
receptor ligand-binding domain stabilizes DNA binding in living cells. J Struct
Biol 147: 50–61.
37. Harms GS, Cognet L, Lommerse PH, Blab GA, Schmidt T (2001)
Autofluorescent proteins in single-molecule research: applications to live cell
imaging microscopy. Biophys J 80: 2396–2408.
38. Bobroff N (1986) Position measurement with a resolution and noise-limited
instrument. Rev Sci Instrum 57: 1152.
39. Blainey PC, van Oijen AM, Banerjee A, Verdine GL, Xie XS (2006) A base-
excision DNA-repair protein finds intrahelical lesion bases by fast sliding in
contact with DNA. Proc Natl Acad Sci USA 103: 5752–5757.
40. Rupprecht R, Reul JM, van Steensel B, Spengler D, Soder M, et al. (1993)
Pharmacological and functional characterization of human mineralocorticoid
and glucocorticoid receptor ligands. Eur J Pharmacol 247: 145–154.
41. Lind U, Greenidge P, Gillner M, Koehler KF, Wright A, et al. (2000) Functional
probing of the human glucocorticoid receptor steroid-interacting surface by site-
directed mutagenesis. Gln-642 plays an important role in steroid recognition and
binding. J Biol Chem 275: 19041–19049.
42. Hellal-Levy C, Couette B, Fagart J, Souque A, Gomez-Sanchez C, et al. (1999)
Specific hydroxylations determine selective corticosteroid recognition by human
glucocorticoid and mineralocorticoid receptors. FEBS Lett 464: 9–13.
43. Grossmann C, Scholz T, Rochel M, Bumke-Vogt C, Oelkers W, et al. (2004)
Transactivation via the human glucocorticoid and mineralocorticoid receptor by
therapeutically used steroids in CV-1 cells: a comparison of their glucocorticoid
and mineralocorticoid properties. Eur J Endocrinol 151: 397–406.
44. Bledsoe RK, Montana VG, Stanley TB, Delves CJ, Apolito CJ, et al. (2002)
Crystal structure of the glucocorticoid receptor ligand binding domain reveals a
novel mode of receptor dimerization and coactivator recognition. Cell 110: 93–
105.
45. Gomez-Sanchez EP (2010) The mammalian mineralocorticoid receptor: tying
down a promiscuous receptor. Exp Physiol 95: 13–18.
46. de Kloet ER, Rots NY, van den Berg DT, Oitzl MS (1994) Brain
mineralocorticoid receptor function. Ann N Y Acad Sci 746: 8–20; discussion
20–21, 64–27.
47. Arriza JL, Weinberger C, Cerelli G, Glaser TM, Handelin BL, et al. (1987)
Cloning of human mineralocorticoid receptor complementary DNA: structural
and functional kinship with the glucocorticoid receptor. Science 237: 268–275.
48. Polman JA, Welten JE, Bosch DS, de Jonge RT, Balog J, et al. (2012) A genome-
wide signature of glucocorticoid receptor binding in neuronal PC12 cells. BMC
Neurosc 13: 118.
49. Reddy TE, Pauli F, Sprouse RO, Neff NF, Newberry KM, et al. (2009) Genomic
determination of the glucocorticoid response reveals unexpected mechanisms of
gene regulation. Genome Res 19: 2163–2171.
50. Rao NA, McCalman MT, Moulos P, Francoijs KJ, Chatziioannou A, et al.
(2011) Coactivation of GR and NFKB alters the repertoire of their binding sites
and target genes. Genome Res 21: 1404–1416.
51. Nissen RM, Yamamoto KR (2000) The glucocorticoid receptor inhibits
NFkappaB by interfering with serine-2 phosphorylation of the RNA polymerase
II carboxy-terminal domain. Genes & development 14: 2314–2329.
52. Liberman AC, Refojo D, Druker J, Toscano M, Rein T, et al. (2007) The
activated glucocorticoid receptor inhibits the transcription factor T-bet by direct
protein-protein interaction. FASEB J: 21: 1177–1188.
53. Godowski PJ, Rusconi S, Miesfeld R, Yamamoto KR (1987) Glucocorticoid
receptor mutants that are constitutive activators of transcriptional enhancement.
Nature 325: 365–368.
54. Archer TK, Lee HL, Cordingley MG, Mymryk JS, Fragoso G, et al. (1994)
Differential steroid hormone induction of transcription from the mouse
mammary tumor virus promoter. Mol Endocrinol 8: 568–576.
DNA Binding Dynamics of GR
PLOS ONE | www.plosone.org 11 March 2014 | Volume 9 | Issue 3 | e90532

55. Quinkler M, Meyer B, Bumke-Vogt C, Grossmann C, Gruber U, et al. (2002)
Agonistic and antagonistic properties of progesterone metabolites at the human
mineralocorticoid receptor. Eur J Endocrinol 146: 789–799.
56. Meijsing SH, Elbi C, Luecke HF, Hager GL, Yamamoto KR (2007) The ligand
binding domain controls glucocorticoid receptor dynamics independent of
ligand release. Mol Cell Biol 27: 2442–2451.
57. Munck A, Foley R (1976) Kinetics of glucocorticoid-receptor complexes in rat
thymus cells. J Steroid Biochem 7: 1117–1122.
58. Saxton MJ (2007) Modeling 2D and 3D diffusion. Methods Mol Biol 400: 295–
321.
59. Voss TC, Schiltz RL, Sung MH, Yen PM, Stamatoyannopoulos JA, et al. (2011)
Dynamic exchange at regulatory elements during chromatin remodelingunderlies assisted loading mechanism. Cell 146: 544–554.
60. van den Broek B, Lomholt MA, Kalisch SM, Metzler R, Wuite GJ (2008) How
DNA coiling enhances target localization by proteins. Proc Natl Acad Sci USA105: 15738–15742.
61. Gowers DM, Wilson GG, Halford SE (2005) Measurement of the contributionsof 1D and 3D pathways to the translocation of a protein along DNA. Proc Natl
Acad Sci USA 102: 15883–15888.
62. Voss TC, Hager GL (2014) Dynamic regulation of transcriptional states bychromatin and transcription factors. Nat Rev Genet 15: 69–81.
DNA Binding Dynamics of GR
PLOS ONE | www.plosone.org 12 March 2014 | Volume 9 | Issue 3 | e90532