Quantifying the RetuRn on investment (Roi) The...
16
QUANTIFYING THE RETURN ON INVESTMENT (ROI) The Business Case for Machine-to-Machine Initiatives white paper
Transcript of Quantifying the RetuRn on investment (Roi) The...

Quantifying the RetuRn on investment (Roi)
The Business Case for Machine-to-Machine Initiatives
white paper

executive summaRy
ROI Redefinedif someone asked you to create an Roi model for an investment in machine to machine connectivity, where would you start?
Organizations today are under tremendous pressure from management and customers to deliver a higher quality of products and services at lower costs, and to do so using existing resources. Any expenditure companies do make to help them achieve this goal is expected to deliver a measurable, hard-dollar ROI – and to deliver it quickly. For product manufacturers in particular, ROI has traditionally translated to “reduce costs.” However, cost is just one piece of the ROI equation.
Today’s market leaders understand that ROI is multidimensional and that, in many cases, the cost-savings component can be secondary to other returns, such as improving customer satisfaction, brand differentiation, and the collection of accurate data, all of which can also drive increased revenues.
As companies do everything they can to retain and expand relationships with existing customers – their most valuable assets – new business models and value-added services are coming to the forefront, and bringing with them significant new opportunities for the enterprise. Machine-to-machine (M2M) technology and the Internet of Things is creating new opportunities for companies to enhance their services, gain business insights, improve business processes, and differentiate their offerings. In fact, connecting machines is bringing companies closer to their customers while delivering real ROI and payback.
In this white paper, Axeda presents examples of M2M value propositions and defines an ROI model for building a business case and tracking results related to M2M initiatives. This paper uses real-world customer results and a set of key metrics to help executives and managers understand the return they should expect when investing in M2M.
2 / / The Business Case for Machine-to-Machine Initiatives
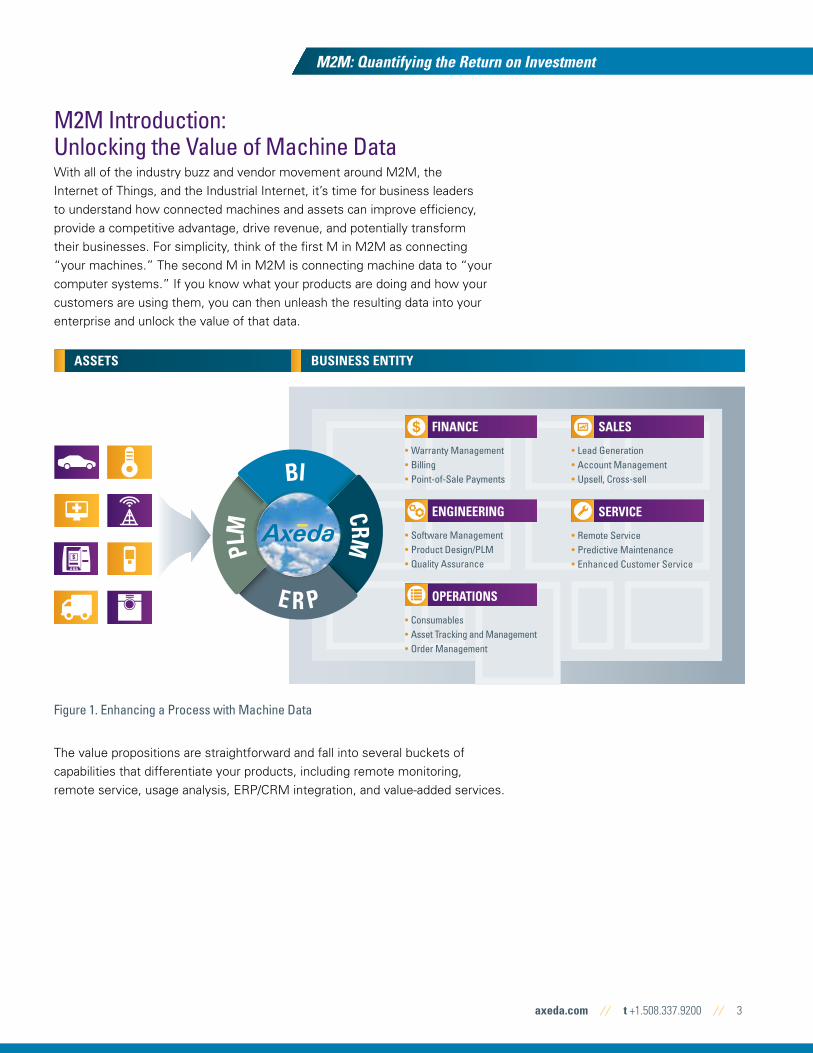
M2M Introduction: Unlocking the Value of Machine DataWith all of the industry buzz and vendor movement around M2M, the
Internet of Things, and the Industrial Internet, it’s time for business leaders
to understand how connected machines and assets can improve efficiency,
provide a competitive advantage, drive revenue, and potentially transform
their businesses. For simplicity, think of the first M in M2M as connecting
“your machines.” The second M in M2M is connecting machine data to “your
computer systems.” If you know what your products are doing and how your
customers are using them, you can then unleash the resulting data into your
enterprise and unlock the value of that data.
Figure 1. Enhancing a Process with Machine Data
The value propositions are straightforward and fall into several buckets of
capabilities that differentiate your products, including remote monitoring,
remote service, usage analysis, ERP/CRM integration, and value-added services.
axeda.com / / t +1.508.337.9200 / / 3
M2M: Quantifying the Return on Investment
ASSETS BUSINESS ENTITY
BI CRM
P
LM
E R P
OPERATIONS
• Consumables• Asset Tracking and Management• Order Management
SALES
• Lead Generation• Account Management• Upsell, Cross-sell
SERVICE
• Remote Service• Predictive Maintenance• Enhanced Customer Service
FINANCE
• Warranty Management• Billing• Point-of-Sale Payments
ENGINEERING
• Software Management• Product Design/PLM• Quality Assurance
fÑ

4 / / The Business Case for Machine-to-Machine Initiatives
Connected machines enable remote monitoring and remote service that drive
both a reduction in the costs of services and an improvement in the level of
service. Analysis of machine data can improve business decisions, product
design, and manufacturing processes. Core business processes like billing, field
service, product registration, compliance, consumable management, recalls, and
warranty management can all be improved with machine data. And, finally, the
selling and marketing of connected products, which include new applications for
end users, can deliver a competitive advantage and drive revenue growth.
Figure 2. Connected Product Value Curve
The future with M2M embraces the reality that no product or asset will be an
island. All products, devices, facilities, systems, equipment, delivered goods,
processes, workflows, and people will coexist in a connected world, interacting
and being interdependent. M2M systems will act like social networks,
socializing machine data to foster unparalleled knowledge and collaboration.
Axeda has interviewed customers, analyzed results, and found top- and bottom-
line impacts that executives need to understand. The following sections share
these finding and discuss what they mean for the enterprise. You will find an
overview of the business metrics for M2M and the description of a framework
to quantify the return on investment.
Reinvent the Product Experience
Integrate
Service
Analyze
LEVEL 1UNCONNECTED
• Fight fires• Limited product feedback• High cost of service
LEVEL 2CONNECTED
• Remote access as allowed• Fragmented information• Reactive response to issues
LEVEL 3SERVICEABLE
• Remote access as needed• Some proactive monitoring• Service cost avoidance • Electronic software delivery
LEVEL 4INTELLIGENT
• Predictive maintenance• Monitor and report on services• View and analyze product data• Leverage usage data for new product enhancements
LEVEL 5OPTIMIZED
• Enterprise integration• Configuration and warranty management• Pay-per-use models/billing integration• Track and locate/inventory management
LEVEL 6+DIFFERENTIATED
• New revenue- generating capabilities• Cloud-delivered customer applications• Replenishment management• Remotely control products• Compliance and audit reporting• Mobile integration• Cloud-to- cloud-to-mobile mashups
INNOVATE
MANAGE
CONNECT
customeR success stoRy
varian medical systems Varian Medical Systems is engaged in the design, manufacture, sale, and service of equipment and software products for treating cancer with radiotherapy, stereotactic radiosurgery, and brachytherapy. It also designs, manufactures, sells, and services x-ray tubes for original equipment manufacturers, as well as replacement x-ray tubes and flat-panel digital image detectors for filmless x-ray imaging in medical, dental, veterinary, scientific, and industrial applications. It designs, manufactures, sells, and services linear accelerators, digital image detectors, image processing software, and image detection products for security and inspection purposes.
metRics
ċċ Reduced MTTR by 50%
ċċ Average of 700 calls resolved remotely per month
ċċ Saved four hours of travel time for each call
ċċ Reduced service costs by $2,000 for each problem resolved remotely

Figure 3: ROI at Each Level of the Value Curve
The Metrics of Machine to MachineWhat is a metRic?A metric is a measure of quality – a success story that describes a quantifiable
benefit. It can represent reduced time to market, improved productivity,
increased market share, lowered or avoided costs, or higher profitability overall
– any result that is valuable to you and your company and that can be translated
into a monetary gain or savings. Metrics are an extremely effective way to
quantify and compare a project’s contribution and to highlight how that work has
positively influenced the company’s bottom line.
What aRe you measuRing?Your goals, and the goals of your company, dictate where the best metrics can
be found. What is most important to you and your company? Some connected
product-related goals that can be converted into metrics include:
axeda.com / / t +1.508.337.9200 / / 5
Axeda Product or Service Name M2M: Quantifying the Return on Investment
LEVEL 3
COSTS• Decrease Field Visits• Increase First-Time Fix Rates• Shorten Support Calls• Reduce Software-Update Costs
REVENUE• Reduce Churn• Increase Customer Sat• Reduce Downtime and Mean Time Between Failure
LEVEL 4
COSTS• Predictive Maintenance• Identify Design Flaws• Identify Part Supplier Issues• Identify Manufacturing-Process Issues
REVENUE• Increase Uptime (Premium SLA Pricing)• Increase Market Share via Superior Product Design
LEVEL 5
COSTS• Reduce Call Times with Integrated CRM• Reduce Warranty Claims• Drive Efficient Recalls
REVENUE• Enable Pay-per-Use Billing• Drive More Consumable Sales
LEVEL 6
COSTS• Enable Self-Service Support to Reduce Calls/Visits
REVENUE• Increase Market Share• Increase Average Selling Price• Drive Product Registration to Enable Cross-Selling, Upselling, Consumable Sales
World-Class Service Business Insights Improved Business Processes Highly Differentiated Offering
Reducing incReasing
Time to market Market share
Service costs (number and length of visits) Revenue
Customer downtime/SLA penalties Profitability/margins
Mean time between failure (MTBF) Average selling price
IT infrastructure costs First time fix rate (FTFR)
Mean time to repair (MTTR) Customer satisfaction/loyalty
Time to innovation Share of wallet
Product recalls and returns System uptimes
Call volume in service center Product registrations
Warranty claims Competitive advantage; win ratio

Which inteRnal oRganizations can pRovide data to develop youR metRics? • Service and Support
• Engineering
• Operations
• Finance
• Sales and Marketing
When do you collect data?It is important to remember that collecting metrics is an ongoing process.
Metrics for individual projects can be combined to quantify bottom-line goals
such as profitability, market share, and time to market. Each time a workweek is
finished or a project is completed, you gather metrics. Metrics are not static, so
you need to be aware of these dynamic changes and their impact.
Begin collecting metrics before you begin a project. Work with a representative
cross-functional team to document your existing processes and workflows.
Be as detailed as possible, listing each step in each process, the associated
deliverables, and relevant quantitative data.
foR example:Process: Software update
Step: Remote product at customer-site installation
Data to collect: Time to fix; cost to complete update; customer satisfaction
When evaluating a new process using M2M, compare your results with the
results you gathered on a similar process when using your previous methods.
The Value of Improved ServiceEvery product requires some level of service and support. To provide world-
class service, organizations are increasingly adopting service solutions that
identify, diagnose, and resolve issues remotely. A connected product strategy
helps to deliver proactive services that improve uptime and decrease the
number of field visits or the length of support calls. At the same time, it
increases the first-time fix rate (FTFR) and slashes service costs, paving the
way for value-added services to be developed based on the data that is being
returned from the devices. These are the key value propositions:
Diagnose problems remotely. An expert on a service call can use a remote
access and service application to access directly the diagnostic parameters and
log files, as well as live and historic operational information about the troubled
device. Even if the user has reset the device, the expert can mine captured data
about what the machine was doing at the time of failure or compare snapshots
of the device state at selected times, and then use this data to diagnose
problems without user intervention.
6 / / The Business Case for Machine-to-Machine Initiatives
customeR success stoRy
leica microsystems Leica Microsystems is a leading global designer and producer of innovative, high-tech precision optical systems for the analysis of microstructures as well as a broad product portfolio for histopathology. It is one of the market leaders in the business areas of microscopy, confocal laser-scanning microscopy with corresponding imaging systems, specimen preparation, and medical equipment.
metRics
ċċ Reduced unscheduled downtime by 40%
ċċ Cut field service visits by 33%
ċċ Improved service productivity by 5%
ċċ Fixed 30% of detected problems remotely
ċċ Improved time-to-repair fulfillment from 75% to 87%
ċċ Saved more than $500,000 (U.S.) annually by avoiding 400 on-site visits

Reduce on-site travel with remote repair. Experts can remotely repair,
adjust, or administer devices without traveling to the site. If they determine the
cause of problem was user error, they can monitor how the operator is using
the device and offer training or advice on how to use it better or differently.
When they find a problem they can fix remotely, the experts can adjust
system parameters, manage files, download software fixes on demand, or
proactively update software across a whole range of devices. The proactive fault
notification, remote problem diagnosis, and remote repair features translate into
quantifiable dollar savings.
Utilize service resources more effectively. Because monitoring, diagnosis,
and repair can be done from anywhere in the world, companies can intelligently
utilize service experts located worldwide and put the best people on the right
job, while reducing time and travel expenses. Experts can troubleshoot and
resolve problems from their desktops using a standard Web browser and
collaborate with each other and with on-site support personnel or device
operators.
Reduce software installation, distribution, and upgrade costs. With
remote software-management capabilities, individual devices or whole device
populations can be updated using a secure mechanism, without costly software
duplication and shipping. The solution can maintain in-depth information on each
device configuration, so specific software releases can be correctly mapped
to a given device installation while avoiding customer errors. This reduces
distribution costs and helps reduce costly call-center calls from customers who
are struggling with upgrade procedures or using obsolete software.
TABLE 2. KEy BEnEFITS AnD METRICS OF REMOTE SERVICE
Benefit Key metRic
Reduced call volume through proactive notification Number of calls
Shortened call-handling time Length of calls
Fewer emergency repair visits Number of field repair visits
Improved troubleshooting Number of second or return visits
Less travel for on-site support Number of maintenance visits
Fast delivery electronically of software upgrades Number of field upgrades/patches
axeda.com / / t +1.508.337.9200 / / 7
M2M: Quantifying the Return on Investment
customeR success stoRy
gerber technology Gerber Technology, a business unit of Gerber Scientific, Inc., develops and manufactures the world’s leading brands of integrated software and hardware automation systems for the sewn products and flexible materials industries. These systems automate and significantly improve the efficiency of information management, product design and development, and pre-production and production processes.
metRics
ċċ Reduced field service visits in Australia, China, Europe, and the United States
ċċ Improved first-time fix rate by 5%
ċċ Resolved issues to avoid downtime before customer was even aware
ċċ Regionalized and reduced overall inventory levels
ċċ Addressed the aging workforce issue by increasing the product knowledge base within technical support
ċċ Monitoring machine conditions to check if warranty conditions are being met

hoW do you tRanslate the data you have collected into value? Once you have obtained the raw information, you will need to perform some
calculations to quantify your achievements. For the purpose of our example, we
have chosen to adopt the following standard assumptions:
• Fifty workweeks per year
• Four weeks per month
• Five days per week
• Forty hours per week
• Eight hours per day
Employee burden rate: This is computed by adding insurance and other
benefits to the hourly wages of an employee. This rate will enable you to
translate time savings into labor cost savings.
Average weekly sales of products/services in units: This is computed for
your company’s fiscal year.
Profit margin of the products/services: This is income derived from the units
sold less all operating expenses divided by sales.
examples:
labor cost savingsCompany XYZ estimated that each field service technician deployed in the field
has a capacity of ten on-site customer visits per week. The expected results
for implementing remote service would be a reduction in total on-site visits by
30%. The burden rate for a field service technician is $100 per hour.
• StEP 1: Determine the number of visits per week, assuming that an average
field-service visit at a customer location is four hours long. Example: 40
hours per week/4 hours per visit = 10 ten calls on average per field service
technician per week.
• StEP 2: Determine the man-hours saved by using M2M to remotely diagnose
and repair 30% fewer issues without an on-site visit. Example: 10 calls x 30%
x 4 hours = 12 man-hours saved per week.
• StEP 3: Develop a quantifiable metric. Subtract the amount of time required
per workweek times the burden rate for a field service technician to
determine labor cost savings. Example: 12 hours per week x $100 per hour =
$1200 in savings per workweek.
• StEP 4: Determine the impact across the entire field service organization.
Example: assuming 100 technicians x 50 workweeks x $1200 per workweek
= $6,000,000.
8 / / The Business Case for Machine-to-Machine Initiatives
customeR success stoRy
diebold Diebold, Incorporated, is engaged in providing integrated self-service delivery and security systems and services primarily to the financial, commercial, government, and retail markets. The company operates two lines of business, Self-Service Solutions and Security Solutions, and the company’s sales personnel, manufacturers’ representatives, and global distributors sell systems and equipment directly to the customers.
metRics
ċċ Approximately 17% of all issues are resolved remotely
ċċ Overall downtime for the product line reduced by 15%
ċċ Turnaround time for problem resolution reduced from an average of one to three hours to fewer than 30 minutes when remote corrective action is successful
increased product RevenueCompany XYZ estimates that, based on value-added services enabled by
Axeda, a connected product line could generate an additional revenue stream.
Assuming customers will subscribe to these services within the first year of
product ownership, here is a sample calculation of increased revenue.
• StEP 1: Determine the value of connected product services for each product
unit assuming the average selling price of a connected application is $50 per
year per user, and the average number of users per connected product is 20.
Example: $50 x 20 users per product = $1,000 per product.
• StEP 2: Estimate the total product revenue increase. Assuming a 25%
attach rate on a total product unit volume of 100,000, the increase in product
revenue for the new connected application would be 100,000 units x 25% x
$1,000 = $25,000,000.
The Value of Analytics and Better DecisionsTo get greater value from the data beyond improved service, you need to
analyze the data and utilize the tools and applications that provide insights into
the devices providing the machine data. The value of analyzing this data comes
from three areas:
Identification of Quality Issues. By looking at the trends across multiple
systems, you can reduce costs by identifying any quality issues or design flaws
in parts supplied by third parties or within your own manufacturing processes,
allowing you to understand what is causing downtime for customers.
Understanding the relationships between problems and specific batches
or production runs can identify a bad batch early and streamline the recall
process. It is also possible the problems are more serious and still in the current
manufacturing process. In this case, the data may trigger the need to change
the current manufacturing process.
Predictive Maintenance. (Schedule maintenance only when required.)
By analyzing historical data, you can begin to predict more accurately
the maintenance cycle of your devices and machines and their discreet
components. Analysis of machine data, including sensor data, will uncover
patterns in machine data readings that are early indicators of failures.
Rather than performing preventive maintenance on a calendar basis when
it may not be needed, companies can track exactly how much a device has
been used and if it’s truly time for service – thereby eliminating unnecessary
preventive maintenance calls and premature repairs or component replacement.
Service reps can also perform preventive maintenance during scheduled calls,
reducing unplanned and planned downtime and customer interruption. This
predictive maintenance knowledge can then feed increased revenues by
providing increased uptime with premium SLA pricing.
axeda.com / / t +1.508.337.9200 / / 9
M2M: Quantifying the Return on Investment
“With Axeda remote service technology, we can start diagnosing problems at the time of failure, and in some cases actually correct the failure without waiting for a technician to go on site, and that could be within minutes.”– Paul Mercina, Director, Service Product
Management/Operations Planning, Diebold

Improved Product Design. The understanding gained from real end-user
behavior and usage patterns also allows product managers and engineers to
design better products and prioritize new features, as well as drive an increased
market share by offering a superior product design. Product management can
utilize this usage data to define next-generation product requirements and
ensure that companies design a product that takes into consideration real-world
customer feedback.
TABLE 3. KEy BEnEFITS AnD METRICS OF MACHInE DATA AnALyTICS
The Value of Machine Data Integration and Business Process EfficiencyOrganizations that were early in bringing their products online are now realizing
that the real “gold” in M2M is taking that data and integrating it with enterprise
systems such as CRM, ERP, PLM or data warehouses – optimizing critical
business processes, reducing service call times and warranty claims, and
enabling an efficient product recall process.
M2M data from connected assets, in collaboration with other enterprise
systems, can provide not previously possible visibility and automation across
organizations. For example, product data flowing through a CRM system can
also be sent to billing or into a supply chain management system – helping to
eliminate error-prone manual steps and providing new sales opportunities for
things such as consumable replenishment or warranty renewals. Additionally,
integration with quality assurance or product lifecycle management (PLM) can
help enhance product features based on real-world data that shows usage
patterns or equipment issues – helping to improve customer satisfaction and
streamlining beta programs.
10 / / The Business Case for Machine-to-Machine Initiatives
Benefit Key metRic
Predictive instead of scheduled maintenance Number of maintenance visits
Ability to identify design flaws Number of recalls
Ability to identify part supplier issues Number of recalls; mean time between failure (MTBF)
Ability to identify manufacturing process issues
Number of recalls; cost of warranty services
Ability to charge more for higher SLAs Average selling price
Superior product design based on improved understanding of usage behavior
Win ratio; market share; customer satisfaction
customeR success stoRy
agilent technologies Agilent Technologies is the world’s premier measurement company, offering the broadest range of innovative measurement solutions in the industry. The company’s three business units – chemical analysis, life sciences, and electronic measurement – provide customers with products and services that make a real difference in the lives of people everywhere. It manufactures a range of scientific instruments, including oscilloscopes, chromatography, spectrometers, signal sources, signal and network analyzers, atomic force microscopes, and nuclear magnetic resonance spectrometers.
metRics
ċċ Reduced onsite repairs with no parts by 20%
ċċ Ramped up deployments from 2007 to 2009 by 450%
ċċ Determined 40% of "Push for Help" requests could potentially be resolved remotely
ċċ Tied their initiative to SLAs
ċċ Used customer feedback to measure and improve the initiative
By monitoring consumable levels in machines, operations can resupply in
advance to avoid downtime. Service and sales and marketing can observe
consumption over time and deliver the right service at the right time to avoid
costly delays to a client. Measuring critical data points in a device allows for
notification to the service team if there is a risk of failure, and, simultaneously,
the finance department can be informed when warranty guidelines are not
being upheld.
One example of machine data integration is the implementation of a usage-
based insurance strategy, which is revolutionizing the auto insurance industry.
Operations and finance teams can track speeds, idling times, parking locations,
distances traveled, hard stops, and more, leading to decreased premiums
for consumers and providing a point of differentiation for those companies
providing the service.
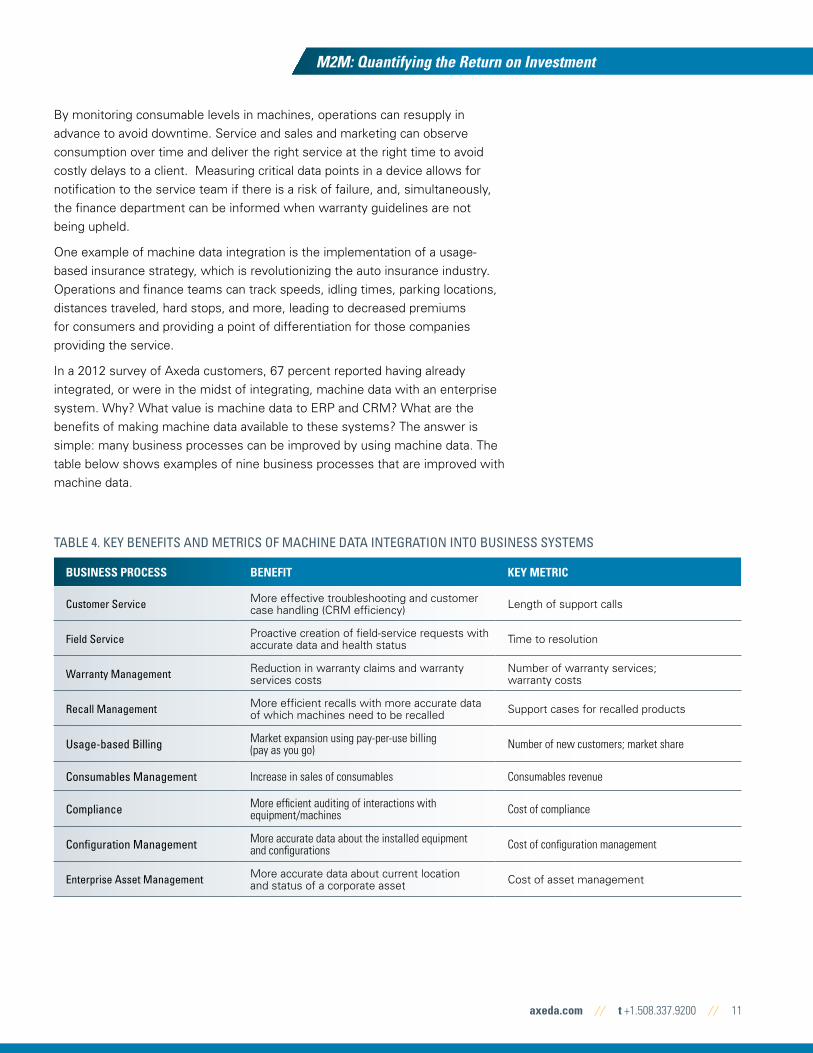
In a 2012 survey of Axeda customers, 67 percent reported having already
integrated, or were in the midst of integrating, machine data with an enterprise
system. Why? What value is machine data to ERP and CRM? What are the
benefits of making machine data available to these systems? The answer is
simple: many business processes can be improved by using machine data. The
table below shows examples of nine business processes that are improved with
machine data.
axeda.com / / t +1.508.337.9200 / / 11
M2M: Quantifying the Return on Investment
Business pRocess Benefit Key metRic
Customer Service More effective troubleshooting and customer case handling (CRM efficiency) Length of support calls
Field Service Proactive creation of field-service requests with accurate data and health status Time to resolution
Warranty Management Reduction in warranty claims and warranty services costs
Number of warranty services; warranty costs
Recall Management More efficient recalls with more accurate data of which machines need to be recalled Support cases for recalled products
Usage-based Billing Market expansion using pay-per-use billing (pay as you go) Number of new customers; market share
Consumables Management Increase in sales of consumables Consumables revenue
Compliance More efficient auditing of interactions with equipment/machines Cost of compliance
Configuration Management More accurate data about the installed equipment and configurations Cost of configuration management
Enterprise Asset Management More accurate data about current location and status of a corporate asset Cost of asset management
TABLE 4. KEy BEnEFITS AnD METRICS OF MACHInE DATA InTEGRATIOn InTO BUSInESS SySTEMS
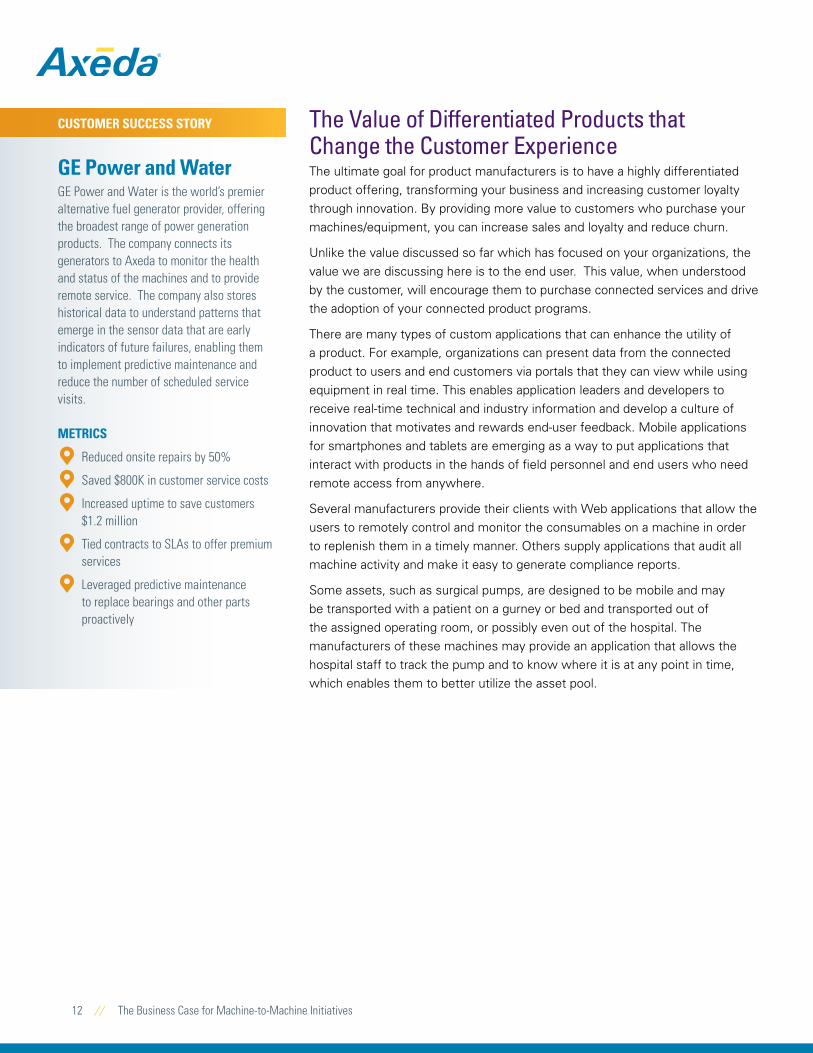
The Value of Differentiated Products that Change the Customer ExperienceThe ultimate goal for product manufacturers is to have a highly differentiated
product offering, transforming your business and increasing customer loyalty
through innovation. By providing more value to customers who purchase your
machines/equipment, you can increase sales and loyalty and reduce churn.
Unlike the value discussed so far which has focused on your organizations, the
value we are discussing here is to the end user. This value, when understood
by the customer, will encourage them to purchase connected services and drive
the adoption of your connected product programs.
There are many types of custom applications that can enhance the utility of
a product. For example, organizations can present data from the connected
product to users and end customers via portals that they can view while using
equipment in real time. This enables application leaders and developers to
receive real-time technical and industry information and develop a culture of
innovation that motivates and rewards end-user feedback. Mobile applications
for smartphones and tablets are emerging as a way to put applications that
interact with products in the hands of field personnel and end users who need
remote access from anywhere.
Several manufacturers provide their clients with Web applications that allow the
users to remotely control and monitor the consumables on a machine in order
to replenish them in a timely manner. Others supply applications that audit all
machine activity and make it easy to generate compliance reports.
Some assets, such as surgical pumps, are designed to be mobile and may
be transported with a patient on a gurney or bed and transported out of
the assigned operating room, or possibly even out of the hospital. The
manufacturers of these machines may provide an application that allows the
hospital staff to track the pump and to know where it is at any point in time,
which enables them to better utilize the asset pool.
12 / / The Business Case for Machine-to-Machine Initiatives
customeR success stoRy
ge power and Water GE Power and Water is the world’s premier alternative fuel generator provider, offering the broadest range of power generation products. The company connects its generators to Axeda to monitor the health and status of the machines and to provide remote service. The company also stores historical data to understand patterns that emerge in the sensor data that are early indicators of future failures, enabling them to implement predictive maintenance and reduce the number of scheduled service visits.
metRics
ċċ Reduced onsite repairs by 50%
ċċ Saved $800K in customer service costs
ċċ Increased uptime to save customers $1.2 million
ċċ Tied contracts to SLAs to offer premium services
ċċ Leveraged predictive maintenance to replace bearings and other parts proactively

A final example of giving customers a seamless experience when managing
their assets is the provision of a Web portal to complement equipment that
provides a mashup of machine data and other customer account information,
including service history. Moreover, all of this connectivity enables automated
product registrations, which in turn enables cross-selling, upselling, and greater
sales of consumables.
These value-added applications deliver product differentiation that can not only
increase your market share, but also provide new business services that can
increase the average selling price.
TABLE 5. KEy BEnEFITS AnD METRICS OF VALUE-ADDED M2M APPLICATIOnS
axeda.com / / t +1.508.337.9200 / / 13
M2M: Quantifying the Return on Investment
value-added seRvice customeR Benefit (value to the end useR) metRics (value to the manufactuReR)
Self-service customer Web portal Immediate access to machine operating information
Portal logins (customer use and satisfaction); connected services adoption
Machine information and health status mobile app Increased productivity Number of calls; win ratio; connected services
adoption
Usage reporting and compliance app Lower cost of compliance; lower risk of violation Cost of compliance
Asset tracker app to locate machines across a campus Increased machine usage efficiency Average selling price; win ratio; connected
services adoption
Warranty registration app Streamlined service and warranty handling Upsell revenue; cross-sell revenue
Scheduling app to reserve a machine Increased employee productivity Average selling price; win ratio; connected services
adoption
Peer analysis app to compare one machine to a population More efficient use of equipment Average selling price; win ratio; connected services
adoption; consumable upsell
14 / / The Business Case for Machine-to-Machine Initiatives
Conclusion: Why it is Time to Connect your Products nowThe bottom line is that connected products offer companies the ability to
provide better service at a lower cost, minimize response time, and maximize
the use and reach of their resources. At the same time, they are looking to
improve revenue, margins, market share, and most important, customer
satisfaction. Connected products can be the key to providing world-class
service, gaining business insights, improving business processes, and
differentiating your offerings.
graphic title for section here
Morper suconsequat. lor in hscipit lobortis nisl ut aliquip ex ea commodo consequat lor in heuis.
Morper suconsequat. lor in hscipit lobortis nisl ut aliquip ex ea commodo consequat lor in heuis.
additional content forgraphic here.
Main Chart Title Here
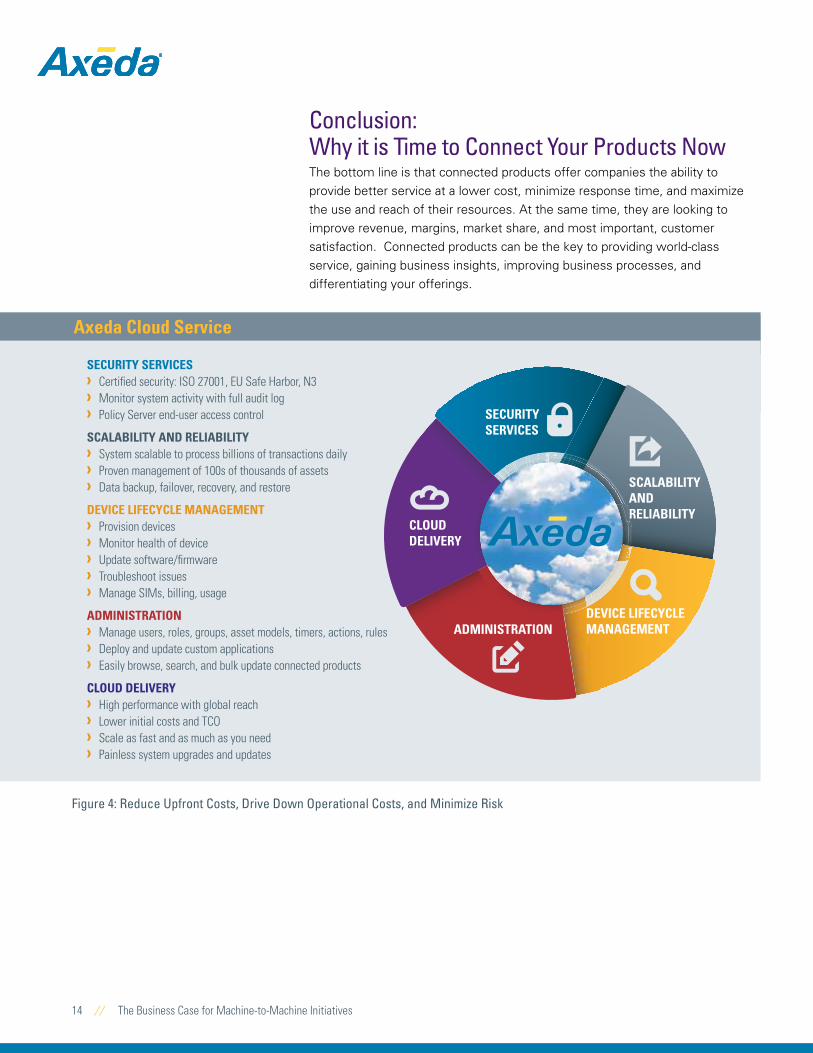
axeda cloud service
secuRity seRvices › Certified security: ISO 27001, EU Safe Harbor, N3 › Monitor system activity with full audit log › Policy Server end-user access control
scalaBility and ReliaBility › System scalable to process billions of transactions daily › Proven management of 100s of thousands of assets › Data backup, failover, recovery, and restore
device lifecycle management › Provision devices › Monitor health of device › Update software/firmware › Troubleshoot issues › Manage SIMs, billing, usage
administRation › Manage users, roles, groups, asset models, timers, actions, rules › Deploy and update custom applications › Easily browse, search, and bulk update connected products
cloud deliveRy › High performance with global reach › Lower initial costs and TCO › Scale as fast and as much as you need › Painless system upgrades and updates
ADMINISTRATION
CLOUD DELIVERY
SCALABILITY AND RELIABILITY
DEVICE LIFECYCLE MANAGEMENT
�W
SECURITY SERVICES �
:w
Figure 4: Reduce Upfront Costs, Drive Down Operational Costs, and Minimize Risk
axeda.com / / t +1.508.337.9200 / / 15
Axeda Product or Service Name M2M: Quantifying the Return on Investment
Leading companies consider M2M and use of the Internet for remote
monitoring important or essential to business operations and as key enablers
to increasing customer satisfaction. Furthermore, they demonstrate a strong
understanding of what M2M is, have succinct expectations for the delivery of
business benefits and ROI, and are well on their way to adoption.
Every company, depending on its applications and types of devices, will have
different pain points and business needs for implementing M2M and different
expectations for where and how they expect a return on their investment.
The reality is that high, measurable cost savings, topline growth and increased
customer satisfaction – which ultimately translate into increased market share
– are being realized today by companies across industries that are using M2M,
with payback being measured in just months.

M2M: Quantifying the Return on Investment
www.axeda.com / / 25 Forbes Blvd. Suite 3 / / Foxboro, MA 02035 USA / / t +1.508.337.9200 / / f +1.508.337.9201
follow us online:
axeda provides cloud-based software for managing connected products and implementing innovative M2M applications. Our customers use our M2M cloud service to deliver innovative M2M solutions and optimize their business processes with data from their connected products. Visit the Axeda Developer Connection at http://developer.axeda.com to get started building your M2M solution for connected products.
© 2013 Axeda Corporation. Axeda is a registered trademark of Axeda Corporation. Adaptive Machine Message Protocol, Axeda Agents, Axeda Connected Access, Axeda Connected Asset Management, Axeda Connected Configuration, Axeda Connected Content, Axeda Connected Machine Management Applications, Axeda Connected Service, Machine Cloud, Machine Streams, and Firewall-Friendly are either trademarks or registered trademarks of Axeda Corporation. All other trademarks are either the property of Axeda Corporation or of their respective owners.