Quantifying Auxin Metabolites in Young Root Tissue of ... · levels in plant tissue, ... extraction...
10
http://www.bio-protocol.org/e1843 Vol 6, Iss 12, Jun 20, 2016 Copyright © 2016 The Authors; exclusive licensee Bio-protocol LLC. 1 Quantifying Auxin Metabolites in Young Root Tissue of Medicago truncatula by Liquid Chromatography Electrospray-ionisation Quadrupole Time-of-flight (LC-ESI-QTOF) Tandem Mass Spectrometry Jason Liang Pin Ng 1 , Thy T. Truong 2 , Charles H. Hocart 2 and Ulrike Mathesius 1* 1 Division of Plant Science, Research School of Biology, The Australian National University, Canberra, Australia; 2 Mass Spectrometry Facility, Research School of Biology, The Australian National University, Canberra, Australia * For correspondence: [email protected] [Abstract] Auxins represent a major group of phytohormones controlling plant development. The spatio-temporal regulation of auxin gradients is essential for the initiation, growth and correct development of plant organs. Because auxins and their metabolites occur at trace levels in plant tissue, experiments requiring identification plus their selective and specific quantification can be most conveniently achieved using mass spectrometry (MS) and the associated chromatographic methods. With the advent of appropriate liquid-based ionisation techniques, emphasis has moved from the use of gas chromatography as the sample interface to the MS (GC/MS), with its concomitant need for derivatisation, to the more sensitive liquid chromatography tandem mass spectrometry (LC-MS/MS). We describe an optimized liquid chromatography electrospray-ionisation quadrupole time-of-flight (LC-ESI-QTOF) methodology for the quantification of auxins. While the solvent extraction of young Medicago truncatula (M. truncatula) roots, as described herein, is relatively straightforward, older, woody or oily plant tissues may also be analyzed with appropriate modification to remove interferences and/or enhance extraction efficiency. In our hands, the analytical assay has proved sufficiently sensitive for the quantification of auxins to investigate their roles in various organogenic events, such as root nodulation in M. truncatula. Further increases in sensitivity can be expected with the use of the latest generation of instruments. Materials and Reagents 1. Stainless steel balls, 3 mm diameter, sequentially washed with detergent, rinsed with tap water, Milli-Q water, and then sterilized in ethanol overnight prior to being air dried before use (AussieSapphire) 2. 2 ml sterile non-autoclaved Eppendorf tubes (Sigma-Aldrich, catalog number: T2795) 3. 1.5 ml sterile non-autoclaved microtubes (Sigma-Aldrich, catalog number: SIAL311NZ1.5C) 4. Nanosep ® MF GHP 0.45 μm filter (Pall Life Sciences, catalog number: ODGHPC35) Note: Currently, it is “VWR International, catalog number: ODGHPC35”.
Transcript of Quantifying Auxin Metabolites in Young Root Tissue of ... · levels in plant tissue, ... extraction...

http://www.bio-protocol.org/e1843 Vol 6, Iss 12, Jun 20, 2016
Copyright © 2016 The Authors; exclusive licensee Bio-protocol LLC. 1
Quantifying Auxin Metabolites in Young Root Tissue of Medicago truncatula by Liquid
Chromatography Electrospray-ionisation Quadrupole Time-of-flight (LC-ESI-QTOF) Tandem Mass Spectrometry
Jason Liang Pin Ng1, Thy T. Truong2, Charles H. Hocart2 and Ulrike Mathesius1*
1Division of Plant Science, Research School of Biology, The Australian National University,
Canberra, Australia; 2Mass Spectrometry Facility, Research School of Biology, The Australian
National University, Canberra, Australia *For correspondence: [email protected]
[Abstract] Auxins represent a major group of phytohormones controlling plant development.
The spatio-temporal regulation of auxin gradients is essential for the initiation, growth and
correct development of plant organs. Because auxins and their metabolites occur at trace
levels in plant tissue, experiments requiring identification plus their selective and specific
quantification can be most conveniently achieved using mass spectrometry (MS) and the
associated chromatographic methods. With the advent of appropriate liquid-based ionisation
techniques, emphasis has moved from the use of gas chromatography as the sample interface
to the MS (GC/MS), with its concomitant need for derivatisation, to the more sensitive liquid
chromatography tandem mass spectrometry (LC-MS/MS). We describe an optimized liquid
chromatography electrospray-ionisation quadrupole time-of-flight (LC-ESI-QTOF)
methodology for the quantification of auxins. While the solvent extraction of young Medicago
truncatula (M. truncatula) roots, as described herein, is relatively straightforward, older, woody
or oily plant tissues may also be analyzed with appropriate modification to remove
interferences and/or enhance extraction efficiency. In our hands, the analytical assay has
proved sufficiently sensitive for the quantification of auxins to investigate their roles in various
organogenic events, such as root nodulation in M. truncatula. Further increases in sensitivity
can be expected with the use of the latest generation of instruments.
Materials and Reagents
1. Stainless steel balls, 3 mm diameter, sequentially washed with detergent, rinsed with
tap water, Milli-Q water, and then sterilized in ethanol overnight prior to being air dried
before use (AussieSapphire)
2. 2 ml sterile non-autoclaved Eppendorf tubes (Sigma-Aldrich, catalog number: T2795)
3. 1.5 ml sterile non-autoclaved microtubes (Sigma-Aldrich, catalog number:
SIAL311NZ1.5C)
4. Nanosep® MF GHP 0.45 μm filter (Pall Life Sciences, catalog number: ODGHPC35)
Note: Currently, it is “VWR International, catalog number: ODGHPC35”.

http://www.bio-protocol.org/e1843 Vol 6, Iss 12, Jun 20, 2016
Copyright © 2016 The Authors; exclusive licensee Bio-protocol LLC. 2
5. 2 ml amber glass autosampler vials (Pacific lab, catalog number: SV11AW)
6. 250 μl inserts (Pacific lab, catalog number: IST0925N)
7. 1 L Schott bottles (acid washed)
8. Medicago truncatula seeds
9. Liquid N2
10. Methanol (99.8%) HPLC grade (Thermo Fisher Scientific, ACROS Organics™, catalog
number: 413770025)
11. Propanol, HPLC grade (Fisher Scientific, catalog number: A461-212)
12. Glacial acetic acid, HPLC grade (Fisher Scientific, catalog number: A113-50)
13. Formic acid, HPLC grade (Fisher Scientific, catalog number: A117-50)
14. Milli-Q water
15. Ultra high purity N2 gas
16. Indole-2, 4, 5, 6, 7-d5-3-acetic acid, D5-IAA (Cambridge Isotope Laboratories, catalog
number: DLM-2926)
Note: It is also named “Indole-3-acetic acid (indole-D5, 97-98%)” on Cambridge
Isotope Laboratories website.
17. Indole-3-acetic acid, IAA (Sigma-Aldrich, catalog number: I3750)
18. Indole-3-butyric acid, IBA (Sigma-Aldrich, catalog number: I5386)
19. 4-chloro-indole-3-acetic acid, 4-Cl-IAA (OlChemIm Ltd., catalog number: 0031131)
20. Phenylacetic acid, PAA (Sigma-Aldrich, catalog number: P16621)
21. N-(3-indolylacetyl)-L-alanine, IAA-Ala (Sigma-Aldrich, catalog number: 345911)
22. N-(3-indolylacetyl)-DL-aspartate, IAA-Asp (Sigma-Aldrich, catalog number: 345938)
23. N-(3-indolylacetyl)-L-isoleucine, IAA-Ile (Sigma-Aldrich, catalog number: 347914)
Note: This product has been discontinued.
24. N-(3-indolylacetyl)-L-leucine, IALeu (OlChemIm Ltd., catalog number: 0031611)
25. N-(3-Indolylacetyl)-L-phenylalanine, IAPhe (OlChemIm Ltd., catalog number:
0031623)
26. N-(3-indolylacetyl)-L-tryptophan, IATrp (OlChemIm Ltd., catalog number: 0031631)
27. N-(3-indolylacetyl)-L-valine, IAVal (OlChemIm Ltd., catalog number: 0031641)
Notes:
a. Solvents and chemicals should be of the highest available purity.
b. Auxin standards and internal standards are prepared in HPLC grade methanol.
1,000 mg/L stock solutions are prepared using acid washed volumetric flasks and
aliquoted (1 ml) into 2 ml amber glass vials with crimped caps and stored at -80 °C
until use.

http://www.bio-protocol.org/e1843 Vol 6, Iss 12, Jun 20, 2016
Copyright © 2016 The Authors; exclusive licensee Bio-protocol LLC. 3
Equipment
1. TissueLyser LT (QIAGEN, catalog number:69980)
2. Sonicator bath (Cole-Parmer Instrument Company, model: 8545-4)
3. SpeedVac vacuum centrifuge (LabConco)
4. Agilent 6530 High Resolution Accurate Mass LC-MS Q-TOF with Agilent Jetstream
(AJS) ESI ion source interface
5. Agilent Zorbax Eclipse high resolution XDB-C18 2.1 x 50 mm, 1.8 μm LC column
Software
1. Agilent MassHunter software version B.05.00 for data acquisition and data analysis
Procedure
1. This analytical assay can be applied to fresh frozen root tissue grown on plate media
or soil. For our experiments, germinated M. truncatula seedlings (previously
germinated overnight on water agar in a Petri dish) are grown on Fåhraeus media in
Petri dishes for four days (Ng et al., 2015). Subsequently several analyses can thus be
undertaken:
a. To investigate the early stages of nodulation, a 4 mm segment around the
inoculation site (not including the tip) is harvested.
b. To determine auxin concentrations in nodules, whole root nodules are harvested.
c. To measure the total root auxin concentration to compare between plant
genotypes, species, etc., whole root tissues are harvested.
2. M. truncatula roots are excised, collected in sterile, non-autoclaved 2 ml Eppendorf
tubes and immediately snap-frozen in liquid N2. For auxin quantification in
M. truncatula roots, 50-100 mg of tissue is sufficient. Frozen root tissues are crushed
with stainless steel balls in a TissueLyser LT with a pre-cooled sample holder (stored
at -20 °C).
Notes:
a. The stainless steel balls are left in the 2 ml Eppendorf tubes throughout the
solvent extraction protocol.
b. The TissueLyser LT frequency is set no higher than 40-45 Hz and for one min to
sufficiently grind the young root tissue. Extended time may be necessary for
tougher and/or older tissue.
c. It is pertinent that the tissue is completely ground to maximize the solvent
extraction efficiency for auxins (Figure 1).

http://www.bio-protocol.org/e1843 Vol 6, Iss 12, Jun 20, 2016
Copyright © 2016 The Authors; exclusive licensee Bio-protocol LLC. 4
Figure 1. An example of Medicago truncatula root tissue before and after grinding by a stainless steel ball in a TissueLyser LT. Complete grinding of the
tissue is essential for optimal metabolite extraction (i.e., tissue should be of a powder
consistency).
3. 20 ng of the internal standard (D5-IAA) is aliquoted to each sample and allowed to be
absorbed by the root sample matrix (samples are always kept on dry ice).
Notes:
a. To add 20 ng internal standard, accurately pipette 20 μl of 1 mg/L internal standard
stock solution to each sample.
b. If dry ice is not available, keep samples on ice. The same applies to step 4.
4. Next, 600 μl of the extraction solvent comprising of 20:79:1 methanol:propanol:glacial
acetic acid (v/v/v) is aliquoted to each sample (samples still kept on dry ice or ice) and
then vortexed vigorously for 5 sec.
Note: The extraction solvent is prepared by measuring volumes of the specified
organic solvents above using an acid-washed 100 ml measuring cylinder. The solution
is then transferred to an acid-washed 100 ml Schott bottle for safer storage. It is
recommended that the extraction solution is made fresh prior to any new batch
extraction to eliminate possible cross contamination.
5. Auxin metabolites are extracted in an ultrasonic bath for 30 min at 4 °C.
6. Samples are centrifuged at 16,100 x g for 15 min at 4 °C.
7. The supernatant from each sample is transferred into new, sterile, non-autoclaved
1.5 ml microtubes.
8. Repeat steps 4-6 and combine the supernatant from this second extraction with the
first. The combined extract is reduced to dryness in a vacuum centrifuge (30 °C,
~20 min; Figure 2A).
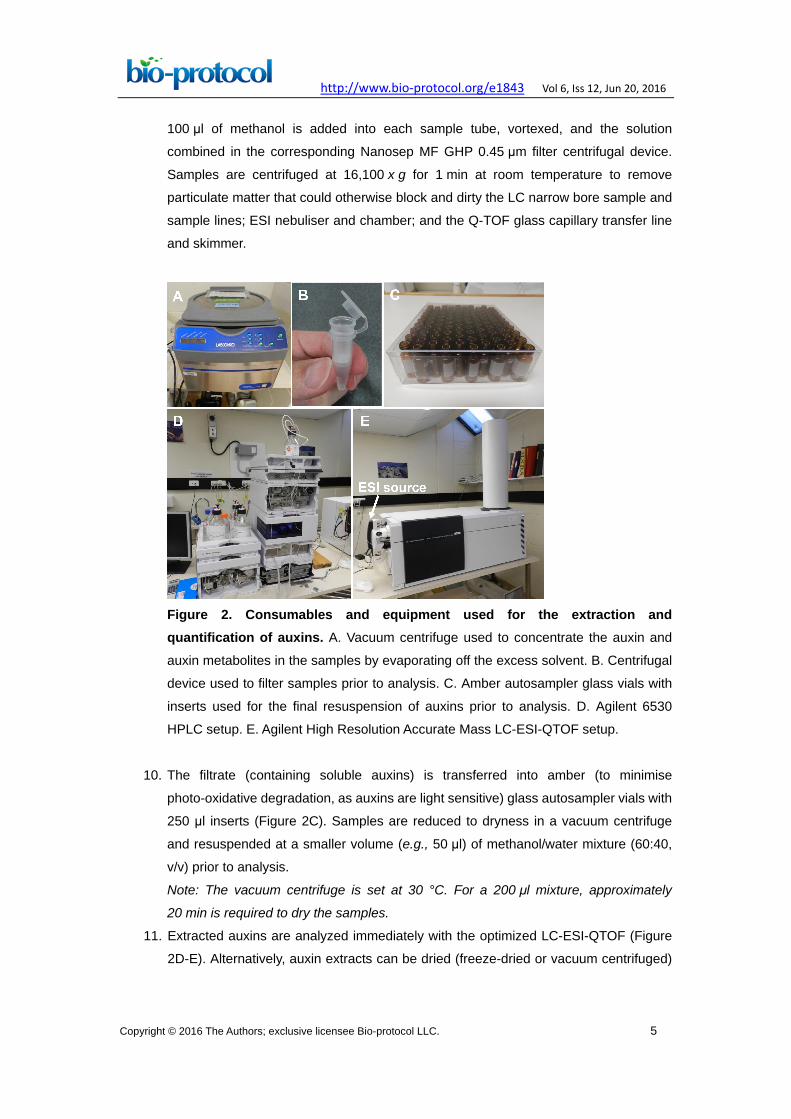
9. Add 100 μl of methanol to each sample tube and then vortex vigorously, ensuring that
the methanol comes into contact with the entire inner wall of the tube so that the auxin
extract is adequately resuspended prior to transferring the solution to a Nanosep MF
GHP 0.45 μm filter centrifugal device (Figure 2B) for sample filtration. An additional
http://www.bio-protocol.org/e1843 Vol 6, Iss 12, Jun 20, 2016
Copyright © 2016 The Authors; exclusive licensee Bio-protocol LLC. 5
100 μl of methanol is added into each sample tube, vortexed, and the solution
combined in the corresponding Nanosep MF GHP 0.45 μm filter centrifugal device.
Samples are centrifuged at 16,100 x g for 1 min at room temperature to remove
particulate matter that could otherwise block and dirty the LC narrow bore sample and
sample lines; ESI nebuliser and chamber; and the Q-TOF glass capillary transfer line
and skimmer.
Figure 2. Consumables and equipment used for the extraction and quantification of auxins. A. Vacuum centrifuge used to concentrate the auxin and
auxin metabolites in the samples by evaporating off the excess solvent. B. Centrifugal
device used to filter samples prior to analysis. C. Amber autosampler glass vials with
inserts used for the final resuspension of auxins prior to analysis. D. Agilent 6530
HPLC setup. E. Agilent High Resolution Accurate Mass LC-ESI-QTOF setup.
10. The filtrate (containing soluble auxins) is transferred into amber (to minimise
photo-oxidative degradation, as auxins are light sensitive) glass autosampler vials with
250 μl inserts (Figure 2C). Samples are reduced to dryness in a vacuum centrifuge
and resuspended at a smaller volume (e.g., 50 μl) of methanol/water mixture (60:40,
v/v) prior to analysis.
Note: The vacuum centrifuge is set at 30 °C. For a 200 μl mixture, approximately
20 min is required to dry the samples.
11. Extracted auxins are analyzed immediately with the optimized LC-ESI-QTOF (Figure
2D-E). Alternatively, auxin extracts can be dried (freeze-dried or vacuum centrifuged)
http://www.bio-protocol.org/e1843 Vol 6, Iss 12, Jun 20, 2016
Copyright © 2016 The Authors; exclusive licensee Bio-protocol LLC. 6
and stored for up to two weeks at -80 °C under an inert atmosphere (high purity N2 or
Ar gas) prior to analysis.
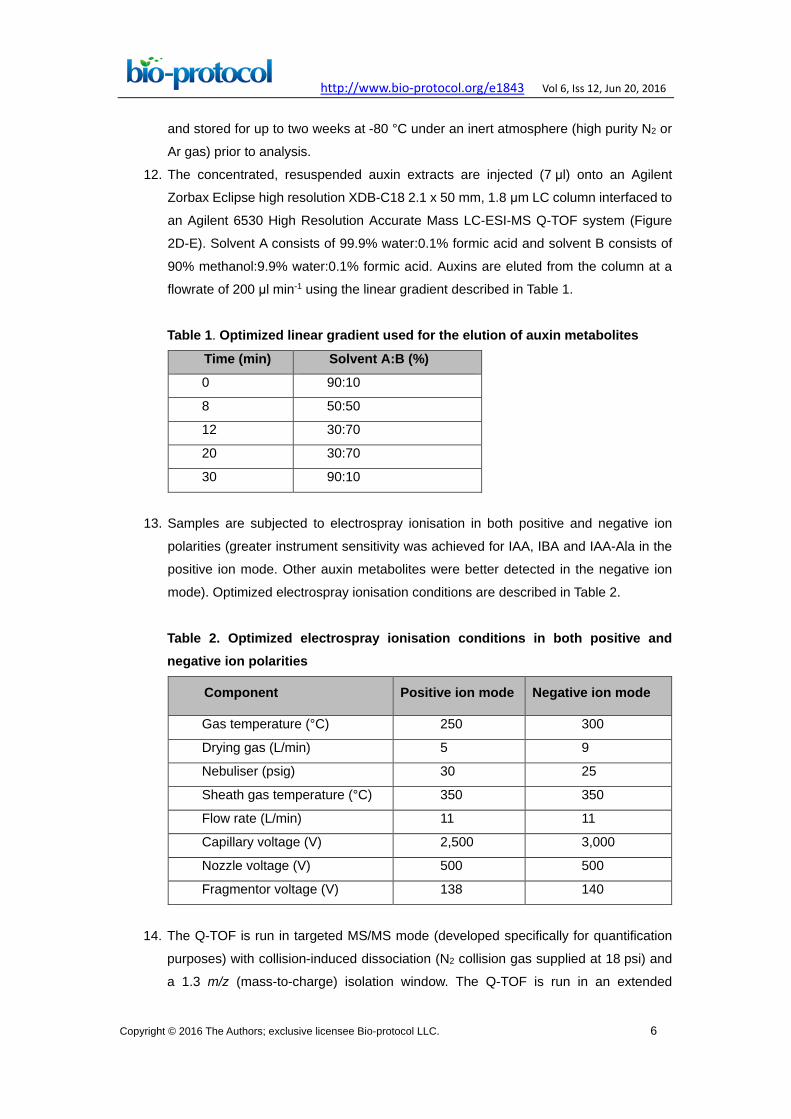
12. The concentrated, resuspended auxin extracts are injected (7 μl) onto an Agilent
Zorbax Eclipse high resolution XDB-C18 2.1 x 50 mm, 1.8 μm LC column interfaced to
an Agilent 6530 High Resolution Accurate Mass LC-ESI-MS Q-TOF system (Figure
2D-E). Solvent A consists of 99.9% water:0.1% formic acid and solvent B consists of
90% methanol:9.9% water:0.1% formic acid. Auxins are eluted from the column at a
flowrate of 200 μl min-1 using the linear gradient described in Table 1.
Table 1. Optimized linear gradient used for the elution of auxin metabolites
Time (min) Solvent A:B (%) 0 90:10
8 50:50
12 30:70
20 30:70
30 90:10
13. Samples are subjected to electrospray ionisation in both positive and negative ion
polarities (greater instrument sensitivity was achieved for IAA, IBA and IAA-Ala in the
positive ion mode. Other auxin metabolites were better detected in the negative ion
mode). Optimized electrospray ionisation conditions are described in Table 2.
Table 2. Optimized electrospray ionisation conditions in both positive and negative ion polarities
Component Positive ion mode Negative ion mode
Gas temperature (°C) 250 300
Drying gas (L/min) 5 9
Nebuliser (psig) 30 25
Sheath gas temperature (°C) 350 350
Flow rate (L/min) 11 11
Capillary voltage (V) 2,500 3,000
Nozzle voltage (V) 500 500
Fragmentor voltage (V) 138 140
14. The Q-TOF is run in targeted MS/MS mode (developed specifically for quantification
purposes) with collision-induced dissociation (N2 collision gas supplied at 18 psi) and
a 1.3 m/z (mass-to-charge) isolation window. The Q-TOF is run in an extended

http://www.bio-protocol.org/e1843 Vol 6, Iss 12, Jun 20, 2016
Copyright © 2016 The Authors; exclusive licensee Bio-protocol LLC. 7
dynamic range (2 Hz) with the MS mode set at 100-1,000 m/z at an acquisition rate of
3 spectra s-1, whereas the MS/MS mode at 50-1,000 m/z and at an acquisition rate of
3 spectra s-1 (Ng et al., 2015). Optimized collision energies and signature product ions
for individual auxin analytes are listed in Table 3. Note that these auxin metabolites are
targeted in our experiments because they were hypothesized to be present in
M. truncatula. For the quantification of auxins in other plant tissues, species or to
answer other biological questions, additional auxin or auxin-like compounds could also
be targeted using this MS/MS acquisition method.
Table 3. Optimized collision energy and signature product ions for individual analytes in the positive (upper panel) and negative (lower panel) ion modes. Extracted from Ng et al. (2015).
Analyte Parent Ion [M+H]+
Collision energy (eV)
Product ions (most intense to least)
D5-IAA 181.1014 12 134.0892 133.0826 135.0961
IAA 176.0710 10 130.0643 131.0663 103.0567
IBA 204.1033 12 186.0890 130.0624 168.0787
IAA-Ala 247.1095 10 130.0651 90.0553 131.0686
Analyte Parent Ion [M-H]-
Collision energy (eV)
Product ions (most intense to least)
D5-IAA 179.0874 10 135.0960 90.9979 159.6305
PAA 135.0452 3 91.0526 72.0207 117.4564
4-Cl-IAA 208.0171 8 164.0287 165.0275 128.0468
IAA-Asp 289.0830 17 88.0423 132.0311 115.0051
IAA-Ile 287.1361 15 130.0854 131.0887 156.0425
IALeu 287.1385 10 130.0854 131.0887 156.0425
IAPhe 321.1245 15 164.0718 165.0749 147.0453
IATrp 360.1354 17 203.0829 204.0864 74.0254
IAVal 273.1243 15 116.0739 117.0765 156.0478
15. Data are analyzed with the Agilent MassHunter software version B.05.00. For each
run, authentic calibration and quality control (QC) reference standards with internal
standard (D5-IAA) are used for unbiased identification and quantification of auxin
metabolites in real samples. The retention time, precursor and signature product ions
of authentic standards are used to confirm putative positive hits in real samples.
An example is given below in Figure 2 (using Extracted Ion Chromatogram (EIC) in the
MassHunter software). Authentic standards are always run in conjunction with real
samples as a quality control check for system performance and to account for any
http://www.bio-protocol.org/e1843 Vol 6, Iss 12, Jun 20, 2016
Copyright © 2016 The Authors; exclusive licensee Bio-protocol LLC. 8
minor change in parameters (e.g., retention time shifts) that might occur between
experiments resulting from possible HPLC column batch variation, dirty LC-MS and/or
mobile phase preparation.
Note: The auxin QC standard mixture is prepared with all auxin compounds at 1 mg/L
and internal standard at 0.4 mg/L.
16. The auxins and auxin metabolites would ideally be quantified against their own stable
isotope (e.g., 13C- or 2H-labelled internal standard). However, these are often either
not available or prohibitively expensive. While not yielding ideal, absolute quantitative
values, the use of a related internal standard (in this case 2H5-IAA), will readily enable
quantitative comparisons between different samples.
17. The auxins and auxin metabolites are validated over a calibration range (Ng et al.,
2015) with the internal standard fixed at a known concentration. Calibration curves are
graphed for each analyte to derive linear regression equations and correlation
coefficients for quantification, and to ascertain their respective limits of detection
(LODs) and lower limits of quantification (LLOQs).
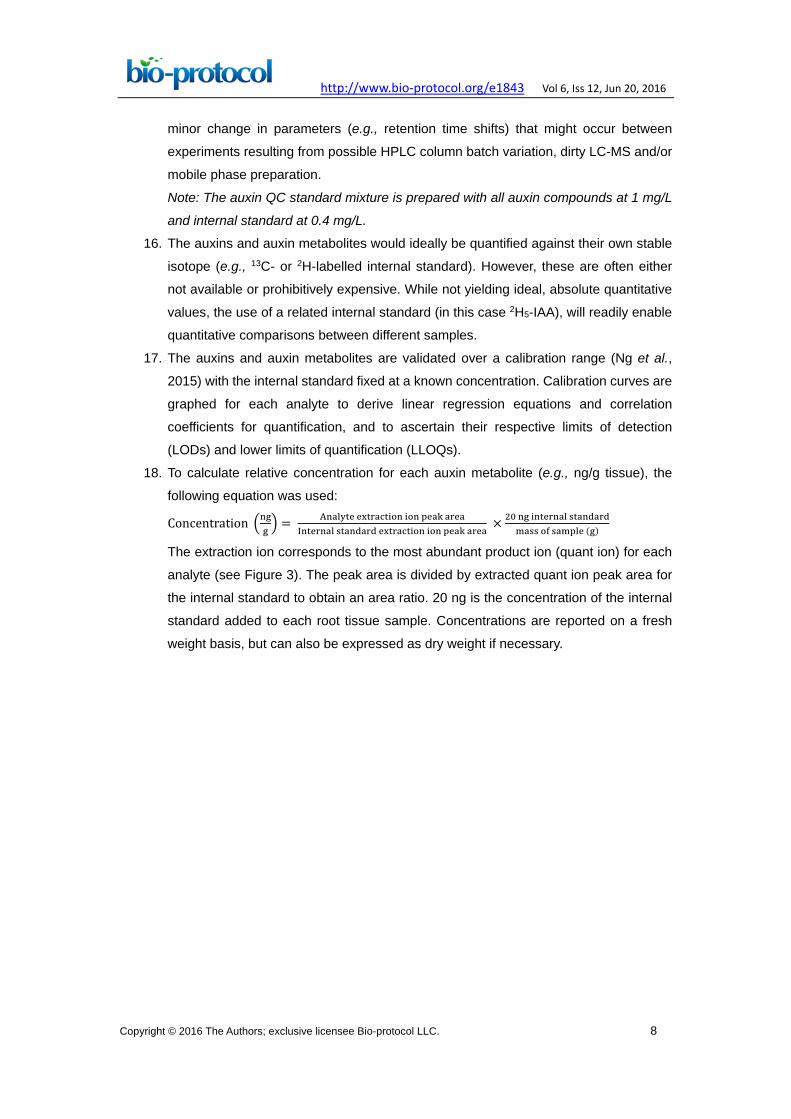
18. To calculate relative concentration for each auxin metabolite (e.g., ng/g tissue), the
following equation was used:
Concentration �ngg� = Analyte extraction ion peak area
Internal standard extraction ion peak area × 20 ng internal standard
mass of sample (g)
The extraction ion corresponds to the most abundant product ion (quant ion) for each
analyte (see Figure 3). The peak area is divided by extracted quant ion peak area for
the internal standard to obtain an area ratio. 20 ng is the concentration of the internal
standard added to each root tissue sample. Concentrations are reported on a fresh
weight basis, but can also be expressed as dry weight if necessary.
http://www.bio-protocol.org/e1843 Vol 6, Iss 12, Jun 20, 2016
Copyright © 2016 The Authors; exclusive licensee Bio-protocol LLC. 9
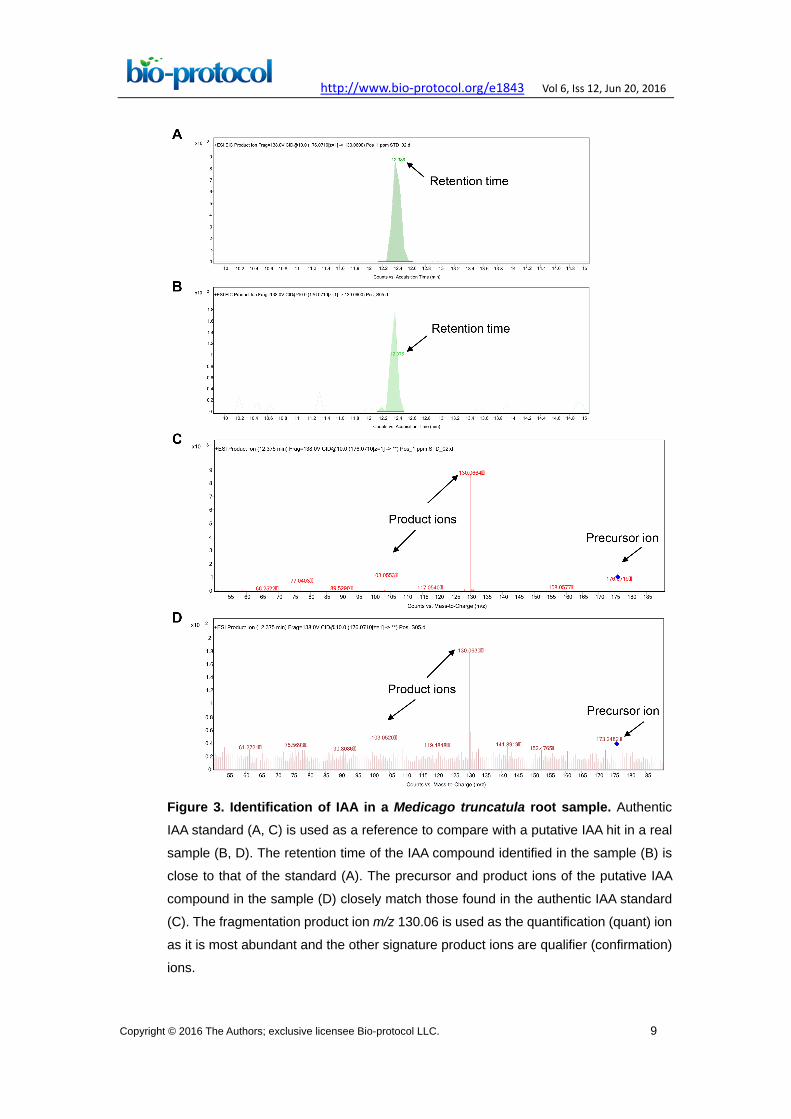
Figure 3. Identification of IAA in a Medicago truncatula root sample. Authentic
IAA standard (A, C) is used as a reference to compare with a putative IAA hit in a real
sample (B, D). The retention time of the IAA compound identified in the sample (B) is
close to that of the standard (A). The precursor and product ions of the putative IAA
compound in the sample (D) closely match those found in the authentic IAA standard
(C). The fragmentation product ion m/z 130.06 is used as the quantification (quant) ion
as it is most abundant and the other signature product ions are qualifier (confirmation)
ions.

http://www.bio-protocol.org/e1843 Vol 6, Iss 12, Jun 20, 2016
Copyright © 2016 The Authors; exclusive licensee Bio-protocol LLC. 10
Acknowledgments
This protocol was adapted from Müller and Munné-Bosch (2011) and Buer et al. (2013)
and was performed by Ng et al. (2015). This work was supported by an Australian
Research Council Future Fellowship awarded to Ulrike Mathesius (FT100100669).
References
1. Buer, C. S., Kordbacheh, F., Truong, T. T., Hocart, C. H. and Djordjevic, M. A. (2013).
Alteration of flavonoid accumulation patterns in transparent testa mutants disturbs
auxin transport, gravity responses, and imparts long-term effects on root and shoot
architecture. Planta 238 (1): 171-189.
2. Muller, M. and Munné-Bosch, S. (2011). Rapid and sensitive hormonal profiling of
complex plant samples by liquid chromatography coupled to electrospray ionization
tandem mass spectrometry. Plant Methods 7: 37.
3. Ng, J. L., Hassan, S., Truong, T. T., Hocart, C. H., Laffont, C., Frugier, F. and
Mathesius, U. (2015). Flavonoids and auxin transport inhibitors rescue symbiotic
nodulation in the Medicago truncatula cytokinin perception mutant cre1. Plant Cell
27(8): 2210-2226.