Quantification of methane emissions
27
1 Quantification of methane emissions MARCOGAZ Assessment and development of the CEN Technical Report”.
Transcript of Quantification of methane emissions

1
Quantification of methane emissions
MARCOGAZ Assessment and development of the CEN Technical Report”.

2
Remarks✓ Results valid at global European level and not for an individual country.✓ (*) 553,000 with 95% confidence level as mentioned in the report.
4,700 ton CH4
0.002 % compared to the EU28 sales
0.003% of anthropogenic CO2eqLNG
38,000 ton CH4
0.01% compared to the EU28 sales
0.02% of anthropogenic CO2eqUGS
133,000 ton CH4
0.05% compared to the EU28 sales
0.08% of anthropogenic CO2eqTSO
339,000* ton CH4
0.12% compared to the EU28 sales
0.21% of anthropogenic CO2eqDSO
Marcogaz Results

3
Marcogaz Framework Assessment report
(includes ones of the actions identified)
• Prescription of identification of methane emission sources• Quantification strategy
• Gives an overview of available measurement methods• Prescription of estimation and calculation methods
• Reporting• Verification according existing standards• Uncertainty assessment
• Bottom-up approach based on Tier III approach.• Definitions from available CEN / ISO standard are used• Further work has to be done to establish a knowledge base with emission factors

4
Primary Scope: EU DSOs and TSOs network
Facility in scope
Measurement reduction station
City gateReduction station
Houses
Compressor station
Industry
Blending station
Valve staion

5
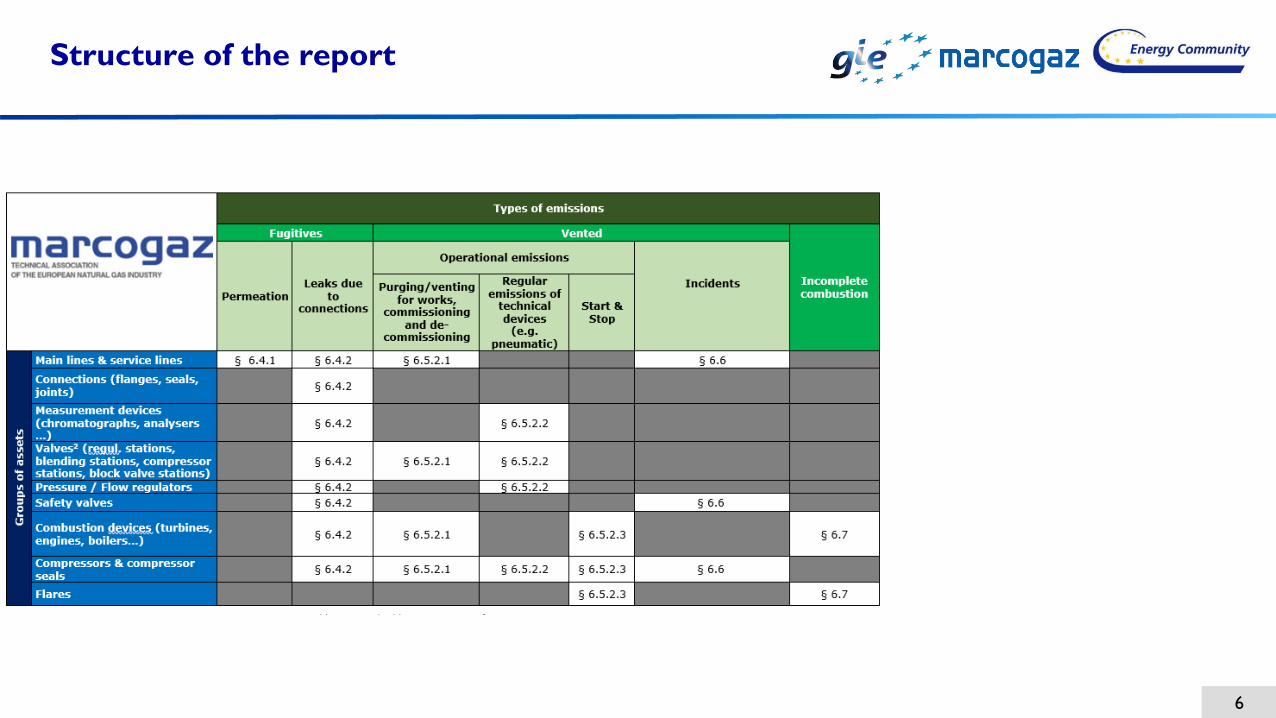
Types of emissions
Methane emissions
Types of emissions Examples
Fugitives Leaks due to connexions Tightness failure
Permeation
Vented
Operational emissions
Purging/venting for works, commissioning and decommissioning
Works, maintenance
Regular emissions of
technical devices
Pneumatic emissions actuators, flow control
valves, …
Starts & stops Emissions from start and
stops of compressors, …
Incidents
Third party, corrosion, construction
defect/material failure, ground movement, failure of installation
Incomplete combustion
Unburned methane in exhaust gases from
combustion installations.
6
Structure of the report

7
Identification

8
𝑞𝑉 = 𝑃𝐶𝐶𝐻4 ∙ 𝜋 ∙ 𝑆𝐷𝑅 ∙ 𝑝𝐶𝐻4
Permeation Coefficient
(original) Unit
Value Material, temperature
0.019 PE100, 20°C cm³CH4/(m∙bar∙d)
0.056 HDPE, 20°C cm³CH4/(m∙bar∙d)
34.1 PE100, 20°C (ml∙mm)/(m²∙bar∙d)
1.11E-09 PE80, 8°C cm2CH4/(bar∙s)
0.006 PE100, 8°C cm³CH4/(m∙bar∙d)
0.29 Plastic, 8°C m³CH4/(km∙bar∙yr)

9
Identification

10
Methods applied
• Direct measurement
• Emission factors• estimate of average emission flowrate via surveys
• average duration
• number of leaks

11
Identification

12
Vented emissions: Operational emissions
Operational emissions𝐸𝑣enting
𝐸𝑝𝑢𝑟𝑔𝑖𝑛𝑔
𝐸technical 𝑑𝑒𝑣𝑖𝑐𝑒𝑠
𝐸𝑠𝑡𝑎𝑟𝑡/𝑠𝑡𝑜𝑝

13
Identification

14
Emissions from incidents
External interference (i.e. third-party damage)
Corrosion
Construction defect / material failure
Hot tap made by error
Ground movements
Venting caused by system failure
Incident causes•Volume
•Diameter
• Length
•pressure
•Duration
•Geometry of leak
TSO Individual
based
•Average flow rate
•Average duration
•Average number of incidents
DSO Grouping

15
Identification

16
Measurement / Detectors
• The operation is based on the ionization of the detected gas in the hydrogen flame that is generated inside the FID. It enables to detect the methane concentrations from very low levels, but reacts not only to methane, but to other hydrocarbons as well.
Flame ionisation detection
• In the presence of the detected gas, the semiconductor’s resistance decreases due to the oxidation, or reduction, of the gas on the metal oxide surface. Optical gas imaging
Semiconductor based detection
• OGI infrared cameras are equipped with sensors to detect hydrocarbons. The equipment may be hand-held or remotely operated from ground-mounted installations or through mobile deployment (vehicular & aerial). Hand-held units are a recommended solution for a broad range of components.
Optical gas imaging
• Acoustic leak detectors capture the acoustic signal of pressurized gas escaping from a valve plug or gate that is not tightly sealed. They can detect either low or high frequency audio signals and are useful for detecting internal through valve leaks or ultrasonic signals from blowdown valves and pressure
Acoustic leak detection
• A popular detector is the Remote Methane Leak Detector (RMLD), which uses a tunable diode-infrared laser that is tuned to a frequency which is specifically absorbed by methane. As the laser beam from an RMLD device passes through a gas plume (and is reflected back to the camera) it will detect if methane is present in the beam path by comparing the strength of the outgoing and reflected beams.
Laser leak detection
• When gas that is aimed to be detected goes through the catalyst it is combusted what heats up the catalyst and changes the resistance, which subsequently enables detecting of the searched gas. The catalyst poisoning may be an issue decreasing its reliability.
Combustible gas detection
• Gas leak rate is estimated based on the size of the cloud observed from thermograms. The amount of gas released depends of the upstream pressures and leak sizes.
Thermal dispersion
• Electrochemical detectors use the porous membrane through which the detected gas goes to the electrode on which it is either oxidized or reduced, resulting in the change of the electric current.
Electrochemical detection
• It is easy, quick and low cost to detect leaks with a soap solution. Soap bubble screening consists to spray all the junctions with a mixture of water and soap (or with a specific commercial foaming product). All the junctions (even the junctions inserted in a coating) are targeted (the actuator of the valves, flanges, fitting, caps, insulating joints,
Soap Bubble Screening

17
DetectionOptical Gas Imaging and IR Camera
17
InfraRed Camera
✓ Operator can scan awide potential emissionarea in real time.
✓ It is probably the fastestway to detect methaneemissions
✓ Detection threshold isdependent onatmospheric conditions.

18
DetectionOptical Gas Imaging and IR Camera
18

19
✓ The gas distribution network is monitored
throughout the year by a systematic leakage
search, divided into two distinct methods,
Pedestrian and Vehicular (depending on the
accessibility of the area).
✓ ~100 000 km checked every year
✓ Measurements are taken at ground level by sampling tubes mounted on a suction ramp.
The vehicle, equipped with a GPS, transmits to an embedded software the necessary
information to track the detected leaks.
✓ Every leak detected is reported and considered in GRDF methane emission
quantification.
✓ If immediate action is needed, the emergency security office sends a specialized team
for intervention. For the other leaks (lower severity) a repair program is set.
Systematic leakage search on distribution grid
(GRDF example)

20
DetectionSoap Bubble Screening
20
Soap bubble screening
✓ This technology can be used for an efficient and fast leak detection and repair campaign, operational team are familiar with that well know historical methodology.
✓ Not effective on large openings.
✓ Accessibility can be an issue

21
Uncertainty calculation
E =
𝑖
𝑛
𝐸𝑖 Basic formula to evaluate
JCGM-100. Evaluation of measurement data - Guide to the expression of uncertainty in measurement. s.l. : Committee for Guides in Metrology (JCGM/WG 1), 2008.
Using ref
To calculate uncertainty is difficult.
MARCOGAZ proposes to use some simpel equations to derive uncertainty:
Therefore:
✓ Quadratic model is used or Monte Carlo simulation
✓ Standard deviation 𝐸𝑖 must be knowm
JGCM-101. Evaluation of measurement data — Supplement 1 to the “Guide to the expression of uncertainty in measurement” Propagation of distributions using a Monte Carlo method. s.l. : JCGM, 2008.

22
CEN
TC234 : WG14

23
European standard
CEN TC234 WG14 Technical Report
▪ Creation of CEN TC234 WG14 “Methane Emissions” 09/2020,
✓ 26 committee members, 12 member states
▪ Adoption of a New Work Item for a CEN Technical Report :
“TC234 WI 00234094 Assessment of methane emissions for gas transmission and distribution systems”
▪ 1st Draft based on the MARCOGAZ assessment document (equivalent scope, limited to TSO and DSO)
▪ Existing Liaison with IOGP and MARCOGAZ
▪ LNG and storage Operator experts to be included in the WG
▪ Comments on 1st Draft adressed, 2nd Draft was issued in December 2020 :
✓ with a scope enlarged to LNG and Storage
✓ with reference to the OGMP2.0 Frame Work (level 4)
▪ Final document to be proposed for formal vote next June, to be available 3rd Q 2021

24
Status CEN TC234/WG14 Methane (01-03-2021)
• 2nd working draft
• Two request that will require decisions from CEN/TC 234.
• Title and scope: extend the title and scope from transmission and distribution to UGS and LNG terminals.• new title: Methodology for methane emissions quantification for gas transmission, distribution and storage systems
and LNG terminals
• New scope: This document describes a methodology to identify different types of methane emissions from the gas
infrastructure and it explains, step by step, how to quantify each type of emission in a gas transmission, distribution
and/or storage system and in an LNG terminal. Gas is considered any product with a high methane content that is in
gaseous form inside the respective gas infrastructure (e.g. natural gas, biogas or mixtures thereof with each other or
with hydrogen). Methane emission from utilisation, CNG/LNG fuelling stations, biomethane production and upgrading
plants and LNG liquefaction and transport are not covered in this document, except if they are inside the covered
asset (see Annex I on granularity).
• Type of deliverable : CEN/TR to CEN/TS (we asked for a decision on the plenary meeting of 22nd April 2021)

25
OGMP 2.0 allows companies to categorize asset-level reporting by 5 categories
Site Level• Emissions allocated to individual source types• Reporting based on site-level measurements to reconcile source and site level emission estimates
Emission Source Level• Emissions allocated to individual source types• Estimates based on specific EFs and direct measurement
Venture/Asset Reporting• Single, consolidated emissions number• Only applicable where company has very limited information sharing
Emissions Category• Report emissions based on 5 IOGP emissions categories• Estimates based on emissions factors
Emission Source Level• Emissions allocated to individual source types• Estimates based on emissions factors
Level 1
Level 2
Level 3
Level 4
Level 5
25

26
2nd draft CEN and OGMP template DSO,TSO,LNG UGS
2nd Draftwith scope enlarged to LNG and Storagewith reference to the OGMP2.0 Frame Work (level 4)

27
End of presentation.
Questions?