Quantification of Hedge Fund Default Risk of Hedge Fund Default Risk ... two statistical methods in...
20
Quantification of Hedge Fund Default Risk January 2007 Corentin Christory Quantitative Analyst with Olympia Capital Management and former Quant Trainee with E.I.M. S.A Stéphane Daul Senior Researcher, RiskMetrics Group, Research Associate with the EDHEC Risk and Asset Management Research Centre and former Senior Quant Analyst with E.I.M. S.A Jean-René Giraud Director of Development and Research Associate with the EDHEC Risk and Asset Management Research Centre EDHEC RISK AND ASSET MANAGEMENT RESEARCH CENTRE 393-400 promenade des Anglais 06202 Nice Cedex 3 Tel.: +33 (0)4 93 18 78 24 Fax: +33 (0)4 93 18 78 41 E-mail: [email protected] Web: www.edhec-risk.com
Transcript of Quantification of Hedge Fund Default Risk of Hedge Fund Default Risk ... two statistical methods in...
Quantification of Hedge Fund Default Risk January 2007
Corentin Christory Quantitative Analyst with Olympia Capital Management and former Quant Trainee with E.I.M. S.A
Stéphane Daul Senior Researcher, RiskMetrics Group, Research Associate withthe EDHEC Risk and Asset Management Research Centre and former Senior Quant Analyst with E.I.M. S.A
Jean-René Giraud Director of Development and Research Associate with the EDHEC Risk and Asset Management Research Centre
EDHEC RISK AND ASSET MANAGEMENT RESEARCH CENTRE
393-400 promenade des Anglais06202 Nice Cedex 3 Tel.: +33 (0)4 93 18 78 24Fax: +33 (0)4 93 18 78 41E-mail: [email protected]: www.edhec-risk.com

After collecting all available information on 109 hedge fund defaults between 1994 and 2005, we investigated two statistical methods in order to shed some light on the risk profile of hedge funds. In an initial stage, we explore the mechanisms behind a hedge fund failure in detail and propose a causal model that could explain the various scenarios that can occur when hedge funds default. A second stochastic analysis of the sample database allows us to propose a loss model for operational failures and to better understand the limitations of a naïve diversification aimed at reducing the loss from a single event by reducing its share of the overall portfolio.
Abstract
2
Corentin Christory and Stéphane Daul were with EIM S.A. at the time this research was carried out. The contents of this paper do not necessarily reflect opinions shared by EIM S.A. or EDHEC Business School.
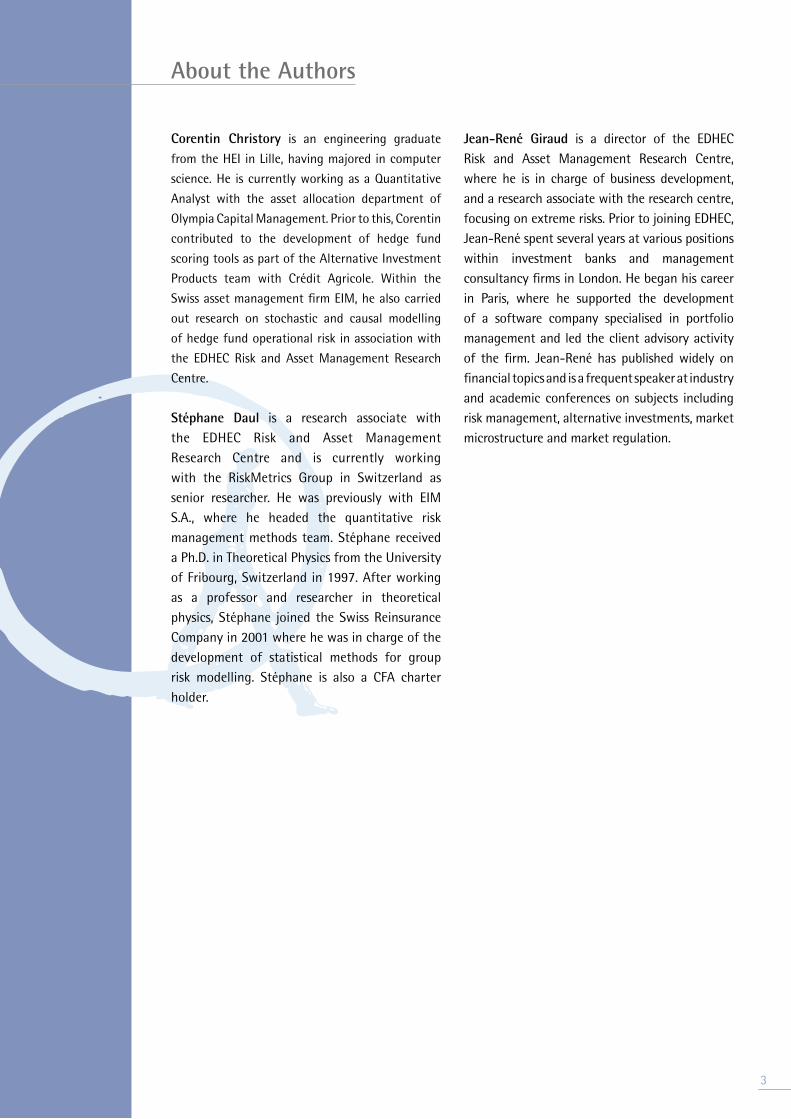
Corentin Christory is an engineering graduate
from the HEI in Lille, having majored in computer
science. He is currently working as a Quantitative
Analyst with the asset allocation department of
Olympia Capital Management. Prior to this, Corentin
contributed to the development of hedge fund
scoring tools as part of the Alternative Investment
Products team with Crédit Agricole. Within the
Swiss asset management firm EIM, he also carried
out research on stochastic and causal modelling
of hedge fund operational risk in association with
the EDHEC Risk and Asset Management Research
Centre.
Stéphane Daul is a research associate with the EDHEC Risk and Asset Management Research Centre and is currently working with the RiskMetrics Group in Switzerland as senior researcher. He was previously with EIM S.A., where he headed the quantitative risk management methods team. Stéphane received a Ph.D. in Theoretical Physics from the University of Fribourg, Switzerland in 1997. After working as a professor and researcher in theoretical physics, Stéphane joined the Swiss Reinsurance Company in 2001 where he was in charge of the development of statistical methods for group risk modelling. Stéphane is also a CFA charter holder.
Jean-René Giraud is a director of the EDHEC Risk and Asset Management Research Centre, where he is in charge of business development, and a research associate with the research centre, focusing on extreme risks. Prior to joining EDHEC, Jean-René spent several years at various positions within investment banks and management consultancy firms in London. He began his career in Paris, where he supported the development of a software company specialised in portfolio management and led the client advisory activity of the firm. Jean-René has published widely on financial topics and is a frequent speaker at industry and academic conferences on subjects including risk management, alternative investments, market microstructure and market regulation.
About the Authors
�

�
By their very nature, hedge funds allow the investor to be exposed to different risk factors such as volatility, counterparty or liquidity risk. Exposure to these risk factors is not only a source of superior risk-return trade-off but also the very essence of hedge funds’ extensive diversification possibilities compared with traditional investments (see Agarwal and Naik [2000] or Schneeweis and Spurgin [2000]). More importantly, it is interesting to note that the exposure to these risk factors is also a diversifiable risk, as it has been demonstrated that hedge funds exhibit low correlations amongst themselves (see Peskin et al. [2000] and Amenc et al. [2003]).
These advantages do not come without a downside. Gaining exposure to alternative risk factors usually requires trading activities that can be considered less conventional than in the long only universe. These include high leverage, investments in illiquid instruments, potentially high portfolio turnover and non-vanilla OTC contracts. While these technicalities do not represent an issue in themselves (the trading techniques of hedge funds usually originate at the desks of proprietary trading dealing rooms which have been operating under such constraints for years), they do however carry a level of operational risk for which the investor receives no premium.
In addition to the very specific nature of their trading activity, hedge funds have developed as a new industry segment at a very significant pace over the last decade and the regulatory environment in which they operate is being updated accordingly. Nevertheless, hedge funds, by their very entrepreneurial nature, remain relatively small financial organisations where issues such as independent risk control, governance or the four eyes principle are not yet the norm.
It is interesting to note that the reporting on hedge fund risk exposure focuses on financial risks, when it is not limited to volatility only. Recent studies such as the one conducted by the EDHEC Risk and Asset Management Research Centre (see Giraud
[2003]) show interesting results on the importance of non-financial risks within hedge funds. A key finding of that study is that in the case of blow-ups, operational risk greatly exceeds the risk related to the investment strategy, with more than half of hedge fund collapses (i.e. funds that have ceased operations with or without returning the capital to their shareholders) directly related to a failure of one or several operational processes.
Finally, hedge fund operational risk has attracted enormous attention from the public, probably because of several fraudulent and high profile cases that the financial press has highlighted over time. Not only does involvement in a hedge fund scandal result in possibly significant financial losses, the reputation aspect of the event may carry even greater weight for investors and third parties such as administrators, auditors and prime brokers involved directly or indirectly in the cases.
All studies available today on hedge fund failures have in common that they are limited to a macroanalysis of the most widely publicized cases, allowing an estimate of the overall level of risk supported by investors to be assessed. While a good estimation of that risk has confirmed the need for improving due diligence processes, governance principles and the interest of some forms of managed accounts, it does not however help the investor in correctly taking into consideration a quantitative measure of the likelihood of a fund defaulting in the portfolio construction process.
The objective of this working paper is to investigate the statistical properties of hedge fund failures further and attempt to identify essential risk factors that can tentatively explain why one fund is more likely to default on its investors and lenders than another. This attempt to quantify hedge fund operational risk will allow the reader to better assess the importance of extreme non-financial risks and understand what mitigation techniques beyond naïve diversification could be of use. The development of a full quantitative model is far beyond the scope of this paper. As the reader will
Introduction
notice, requirements in terms of data to perform a relevant analysis on all possible factors are simply beyond reach.
This paper will investigate two statistical methods in order to shed some light on the risk profile of hedge funds. In an initial stage, the paper will explore the mechanisms behind a hedge fund failure in more detail and propose a causal model that could explain the various scenarios that can occur when a hedge fund defaults. Feeding back the historical information will allow a first level of analysis to be performed through the calculation of conditional probability of failures for some factors where information is available.
A second stochastic analysis of a sample database of 100+ fund failures will allow a loss model for operational failures to be proposed. This model will allow us to better understand the limitations of a naïve diversification that aims to reduce the loss of a single event by reducing its share of the overall portfolio.
The paper will then provide some conclusions that should be useful to portfolio managers when constructing a portfolio of funds of hedge funds by allowing them to better factor the various operational risks into their portfolio construction phase.
Introduction
�

�
The first phase in any analytical process is to collect data. In order to model and measure default risk, we need to construct two distinct databases: the first one includes hedge fund defaults; the second one contains the full universe of hedge funds.
1.1 Hedge fund defaultsWe define a default as a loss large enough to stop the manager from investing. Such defaults are usually widely publicized and are different from dissolutions where funds return all money to investors because of poor or absent performance.
We constructed this database exclusively using publicly available information (such as Bloomberg news, regulator’s websites or press articles). We obtained a database that included 109 defaults between 1994 and 2005. To ensure that all defaults were recorded, we cross-checked our data with various reports such as the SEC filings.
Our hedge fund defaults database tentatively contains the following information: fund name, year of collapse, year of inception, loss, assets under management, investment style, location of the management company, reason for default and complexity of instruments.
We assume that hedge fund defaults that do not belong to our database were not disclosed or publicized. They surely ended in an arrangement without significant losses and can therefore not be traced.
1.2 Full universe of hedge fundsIn order to get a full picture we need to assess the full universe of available hedge funds. We aggregated the information from six commercial sources1 and the EIM proprietary database.
Juxtaposing each database would yield a set of 40,000 entries with a significant number of duplicates. To obtain a consolidated database
summarizing each fund in a unique way we need to clean the dataset. Series or classes of a hedge fund are considered as a unique fund, and funds of hedge funds are disregarded. Managers can report to more than one database or can be listed several times in the same database for their onshore and offshore versions.
We have developed an algorithm that detects similar funds and aggregates them. We performed several tests using their name and track record before reaching a conclusion about the identity of two funds. First, we compared names which are cleaned beforehand. Providers do not use exactly the same name for the same fund and all terms concerning currencies, classes or series are dropped. Second, we evaluated the distance between track records, and third, we looked at the correlation coefficient. This last test is relevant in several situations generating duplicates such as fees reported gross or net, or different currencies.
We finally obtained a database that included the aggregated hedge fund universe as described above. To each fund we associated a consolidated track record and other attributes such as location of the management company, investment style and assets under management.
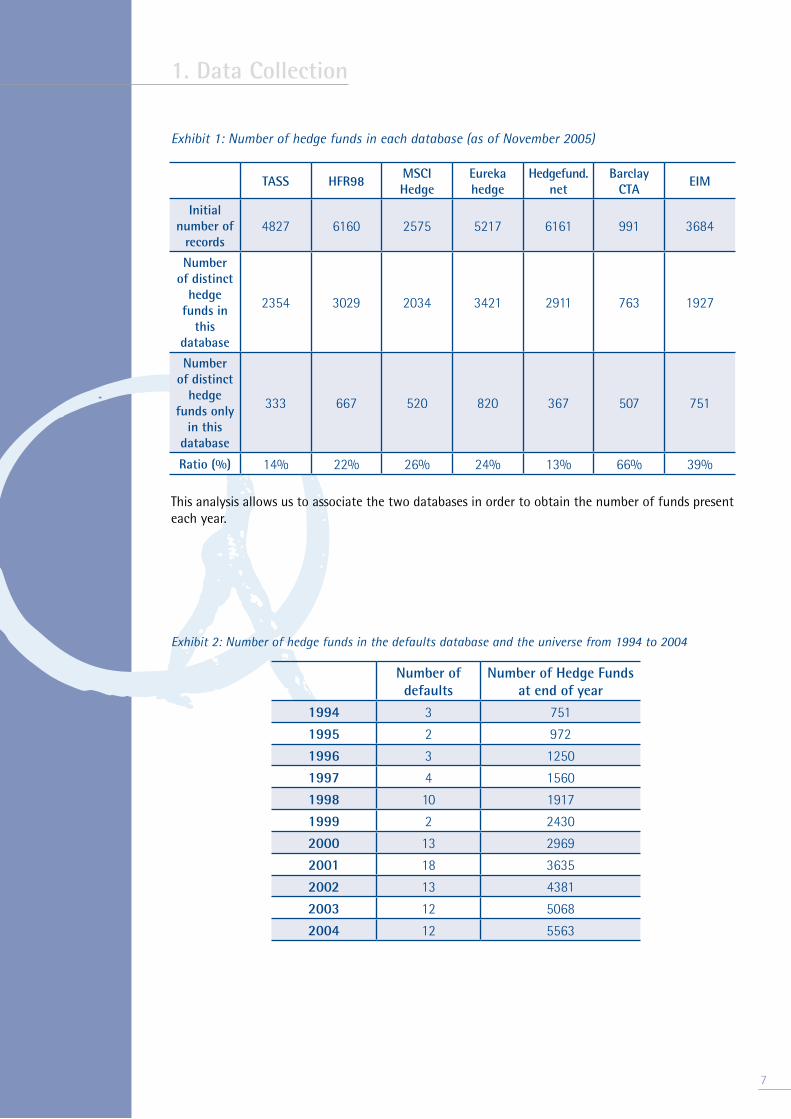
Exhibit 1 below shows how many funds are in only one unique commercial database. We see that all databases have about 15–25% of unique funds except the specialized Barclay CTA database. As an indicator of completion we compared the list of names from two additional databases2 and identified approximately 10% new funds for 2005 representing only about 15% of the list provided. These two providers were quite young and should not significantly distort the conclusions for the 1994–2004 period.
1. Data Collection
1. Data Collection
TASS HFR98MSCI Hedge
Eurekahedge
Hedgefund.net
Barclay CTA
EIM
Initial number of
records�827 �1�0 2�7� �217 �1�1 991 ��8�
Number of distinct
hedge funds in
this database
2��� �029 20�� ��21 2911 7�� 1927
Number of distinct
hedge funds only
in this database
��� ��7 �20 820 ��7 �07 7�1
Ratio (%) 1�% 22% 2�% 2�% 1�% ��% �9%
Exhibit 1: Number of hedge funds in each database (as of November 2005)
This analysis allows us to associate the two databases in order to obtain the number of funds present each year.
Exhibit 2: Number of hedge funds in the defaults database and the universe from 1994 to 2004
Number of defaults
Number of Hedge Funds at end of year
1994 � 7�1
1995 2 972
1996 � 12�0
1997 � 1��0
1998 10 1917
1999 2 2��0
2000 1� 29�9
2001 18 ����
2002 1� ��81
2003 12 �0�8
2004 12 ����
7

2. Causal Model
8
A causal model is an advanced form of dependency model that allows the various scenarios that can lead to a defined state to be modelled. In our case, the scenario is the winding down of a hedge fund. Causal models are built on the basis of a bottom-up historical qualitative analysis of actual failures and attempt to identify the various situations and events that can lead to bankruptcy.
The causal model will allow both causal drivers and correlations between these drivers to be analysed in a second step in order to allow for better consideration of these factors in the portfolio construction model.
The reader might want to refer to Marshall [2000] for a broader description of the usage of causal models in operational risk analysis.
Marshall identifies three steps in developing a causal model, steps we have followed:• Identify the high-risk events• Identify the events and factors that affect the high-risk events• Quantify the relation between the independent events/risk factors and dependent events
When correctly defined, causal models can be utilized to compute the likelihood of implied events given the likelihood of causality related events. In our case we have restricted the third step to an empirical analysis of the results.
Candidate risk factors can be grouped according to the following typology:General fund information• Number of principals/staff• Age of operations• Nature of the legal entity• Location of operations• Assets under management/number of direct investors• Nature of manager’s remuneration
Investment strategy• Management style• Complexity of instruments traded• Leverage
Operational environment• Independence of valuation• Independence of reporting• Independence of administration• Nature of managed account/segregation of assets
Given the difficulty of sourcing all candidate risk factors, not all of them will be analysed in this paper and this will be the topic of a further research programme.
In order to gain a better understanding of the drivers of hedge fund failures, the analysis of the causal model has been structured into three sections. In an initial step we will introduce a causal model that will allow us to factor information for the following steps. Secondly, we will analyse the overall breakdown of risk factors given defined default scenarios. This analysis will allow us to identify criteria that can easily be assessed prior to investing in the funds. In a third step, we will compute conditional probabilities based on certain realizations of risk factors in order to understand whether a given factor may lead to some specific scenarios.
2.1 Dynamics of defaultBased on the analysis of our 109 actual cases, we have identified six different routes that lead to bankruptcy and summarized these in a causal model that remains sufficiently simple to allow for statistical information on the various scenarios to be factored.
It is important to stress that the overall simplicity of the model is deliberate in order to allow specific risk factors to be clearly identified and, if possible, quantified in order to compute an overall likelihood of default.

More complex specific models can be built within this framework, for example a detailed causal model could easily be established to model operational problems. The main issue would then be to collect sufficient data on individual funds and on the entire universe in order to obtain representative information. Our experience shows that this requirement is beyond reach, as the retroactive collection of such granular data for loosely documented funds is impossible.
The dynamics of a default can be summarized in six different scenarios which we have identified:• Straight fraud leading to collapse• Straight fraud revealed by the authorities leading to forced liquidation• Undisclosed operational loss leading to collapse• Undisclosed financial loss leading to collapse• Disclosed operational loss leading to managed liquidation• Disclosed financial loss leading to managed liquidation
The most obvious analysis to perform is to understand the distribution of failures across the various scenarios we have identified and validate these scenarios to cover all cases encountered. We have therefore analysed each of the 109 cases and assessed whether the dynamics of the winding down did fit one of the six scenarios. This has proven to be the case each time. The distribution of defaults across scenarios is described in Exhibit 4.
Exhibit 4: Distribution of defaults: % of defaults for each scenario
2. Causal Model
9
Operationalproblem Financial loss
Unexpected and brutal loss
Investors’loss of confidence
Asset -Liabilitymismatch
NO YES
Misrepresentation
CollapseFraudulentNon fraudulent
Disclosure of the underlying issue?
Redemptions
Forced or managedliquidation
Misappropriation Frauds revealed by authorities
Exhibit 3: Causal model for operational default of hedge funds
10
2.2 Tentative segregation of candidate risk factorsActually quantifying the likelihood of each scenario for a fund does require the risk factors/events that are likely to trigger the various situations to be identified and, possibly, quantified.
Based on an extensive analysis of historical cases, we have highlighted a number of elements that are likely to provide an appropriate level of explanation as risk factors, or proxies for risk factors. Three factors have been qualified with a sufficient level of confidence on the 109 cases analysed:• location of the management company• assets under management• complexity of instruments (proxy: management style)
2.2.1 Distribution of risk factors conditioned to a defaultAnalysing the distribution of risk factors according to several scenarios does allow several possible risk factors that one should consider when preparing the due diligence process to be identified.
Location of the management companyThe location of the management company is considered as a potentially significant risk factor for several reasons. First of all, the location of the management company can be considered to provide a good reflection of the level of regulation applied to the fund/company. Secondly, the location of the management company is a reflection of the level of visibility the manager is ready to accept, ranging from full transparency, similar to traditional fund management companies, down to more obscure offshore structures. The distribution of defaults across countries in our sample is provided in Exhibit 5.
Exhibit 5: Distribution of defaults: % of defaults by location of the management company
CountryPercentage
of defaults
US 88%
United Kingdom 4%
Canada 2%
France 1%
Germany 1%
Switzerland 1%
Japan 1%
Singapore 1%
Bahamas 1%
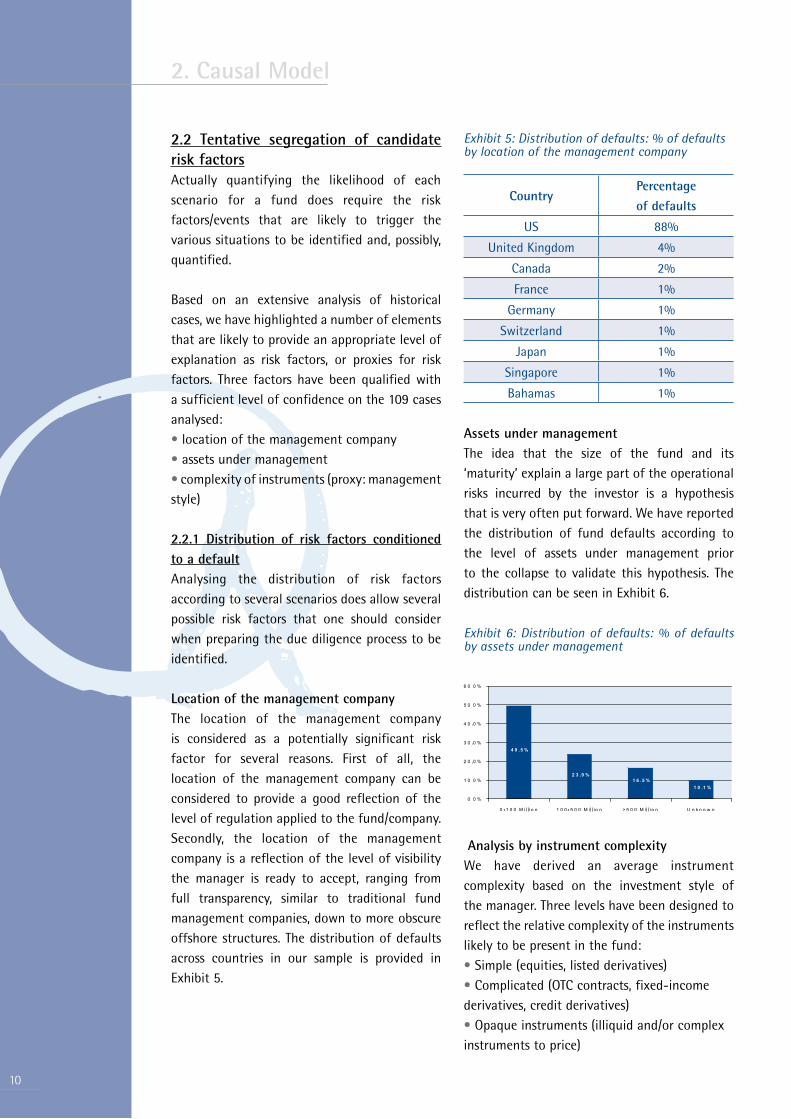
Assets under managementThe idea that the size of the fund and its ‘maturity’ explain a large part of the operational risks incurred by the investor is a hypothesis that is very often put forward. We have reported the distribution of fund defaults according to the level of assets under management prior to the collapse to validate this hypothesis. The distribution can be seen in Exhibit 6.
Exhibit 6: Distribution of defaults: % of defaults by assets under management
Analysis by instrument complexityWe have derived an average instrument complexity based on the investment style of the manager. Three levels have been designed to reflect the relative complexity of the instruments likely to be present in the fund:• Simple (equities, listed derivatives)• Complicated (OTC contracts, fixed-income derivatives, credit derivatives)• Opaque instruments (illiquid and/or complex instruments to price)
2. Causal Model
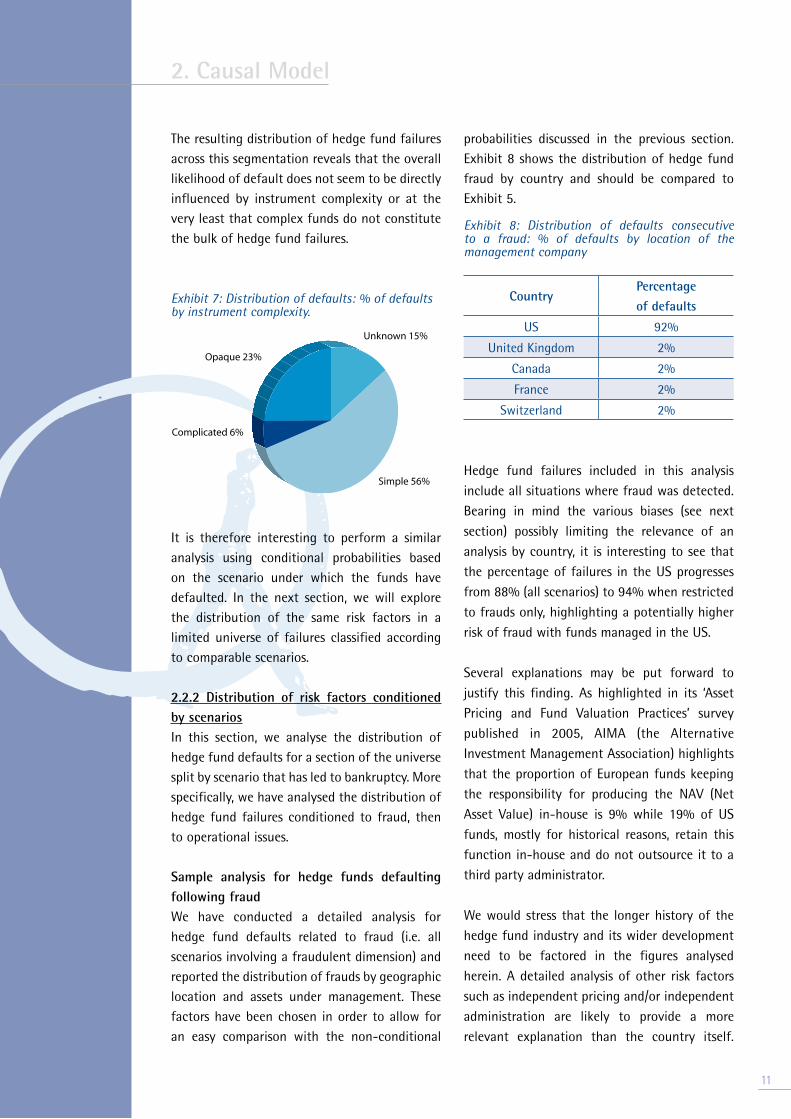
The resulting distribution of hedge fund failures across this segmentation reveals that the overall likelihood of default does not seem to be directly influenced by instrument complexity or at the very least that complex funds do not constitute the bulk of hedge fund failures.
Exhibit 7: Distribution of defaults: % of defaults by instrument complexity.
It is therefore interesting to perform a similar analysis using conditional probabilities based on the scenario under which the funds have defaulted. In the next section, we will explore the distribution of the same risk factors in a limited universe of failures classified according to comparable scenarios. 2.2.2 Distribution of risk factors conditioned by scenariosIn this section, we analyse the distribution of hedge fund defaults for a section of the universe split by scenario that has led to bankruptcy. More specifically, we have analysed the distribution of hedge fund failures conditioned to fraud, then to operational issues.
Sample analysis for hedge funds defaulting following fraudWe have conducted a detailed analysis for hedge fund defaults related to fraud (i.e. all scenarios involving a fraudulent dimension) and reported the distribution of frauds by geographic location and assets under management. These factors have been chosen in order to allow for an easy comparison with the non-conditional
probabilities discussed in the previous section. Exhibit 8 shows the distribution of hedge fund fraud by country and should be compared to Exhibit 5.
Exhibit 8: Distribution of defaults consecutive to a fraud: % of defaults by location of the management company
CountryPercentage
of defaults
US 92%
United Kingdom 2%
Canada 2%
France 2%
Switzerland 2%
Hedge fund failures included in this analysis include all situations where fraud was detected. Bearing in mind the various biases (see next section) possibly limiting the relevance of an analysis by country, it is interesting to see that the percentage of failures in the US progresses from 88% (all scenarios) to 94% when restricted to frauds only, highlighting a potentially higher risk of fraud with funds managed in the US.
Several explanations may be put forward to justify this finding. As highlighted in its ‘Asset Pricing and Fund Valuation Practices’ survey published in 2005, AIMA (the Alternative Investment Management Association) highlights that the proportion of European funds keeping the responsibility for producing the NAV (Net Asset Value) in-house is 9% while 19% of US funds, mostly for historical reasons, retain this function in-house and do not outsource it to a third party administrator.
We would stress that the longer history of the hedge fund industry and its wider development need to be factored in the figures analysed herein. A detailed analysis of other risk factors such as independent pricing and/or independent administration are likely to provide a more relevant explanation than the country itself.
2. Causal Model
11
Unknown 15%
Simple 56%
Opaque 23%
Complicated 6%
12
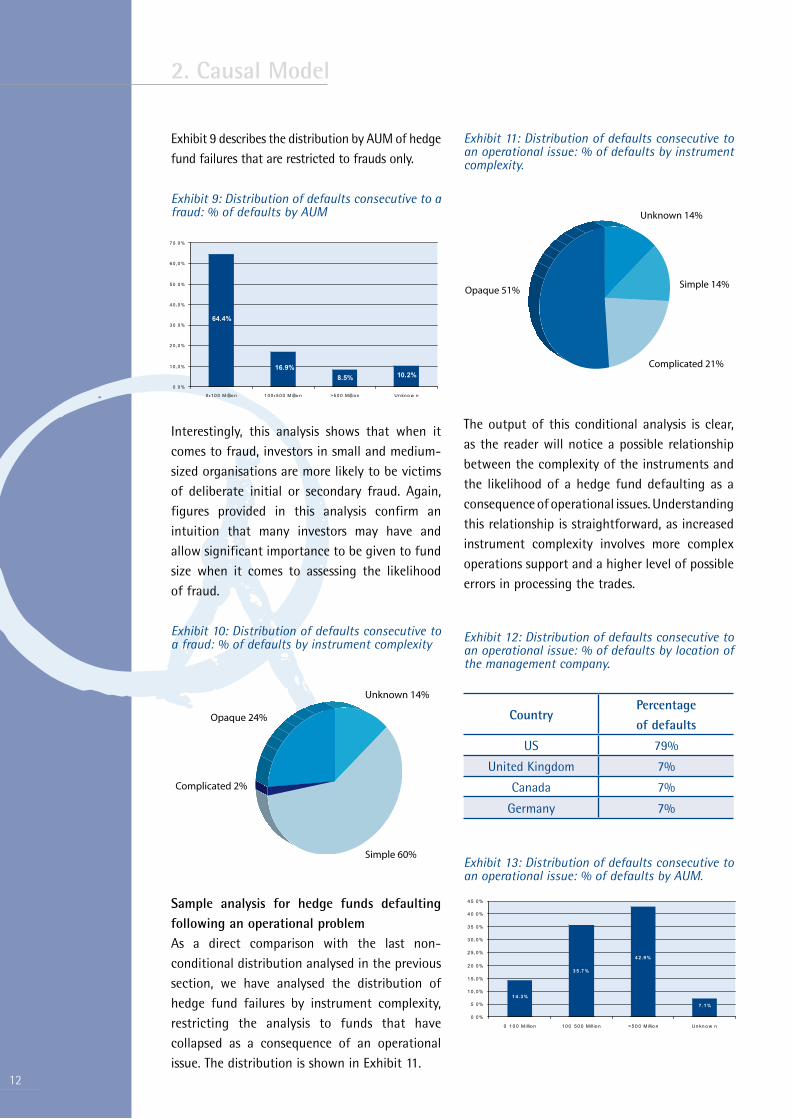
Exhibit 9 describes the distribution by AUM of hedge fund failures that are restricted to frauds only.
Exhibit 9: Distribution of defaults consecutive to a fraud: % of defaults by AUM
Interestingly, this analysis shows that when it comes to fraud, investors in small and medium-sized organisations are more likely to be victims of deliberate initial or secondary fraud. Again, figures provided in this analysis confirm an intuition that many investors may have and allow significant importance to be given to fund size when it comes to assessing the likelihood of fraud.
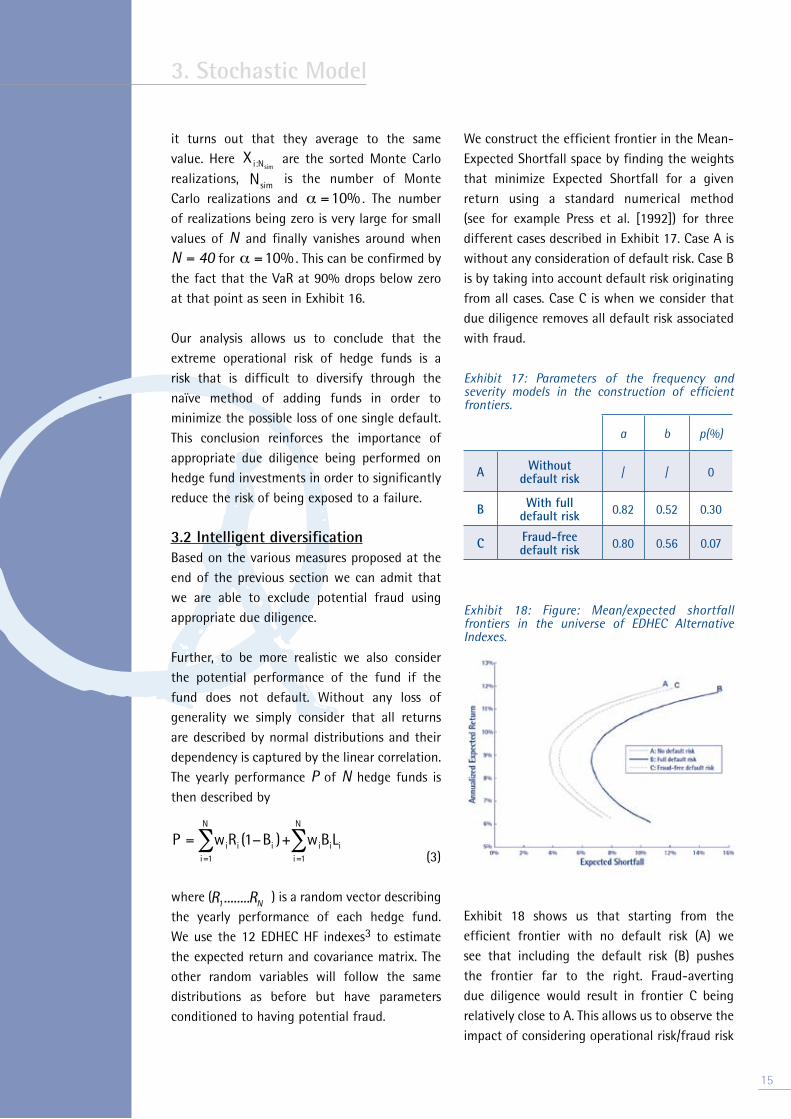
Exhibit 10: Distribution of defaults consecutive to a fraud: % of defaults by instrument complexity
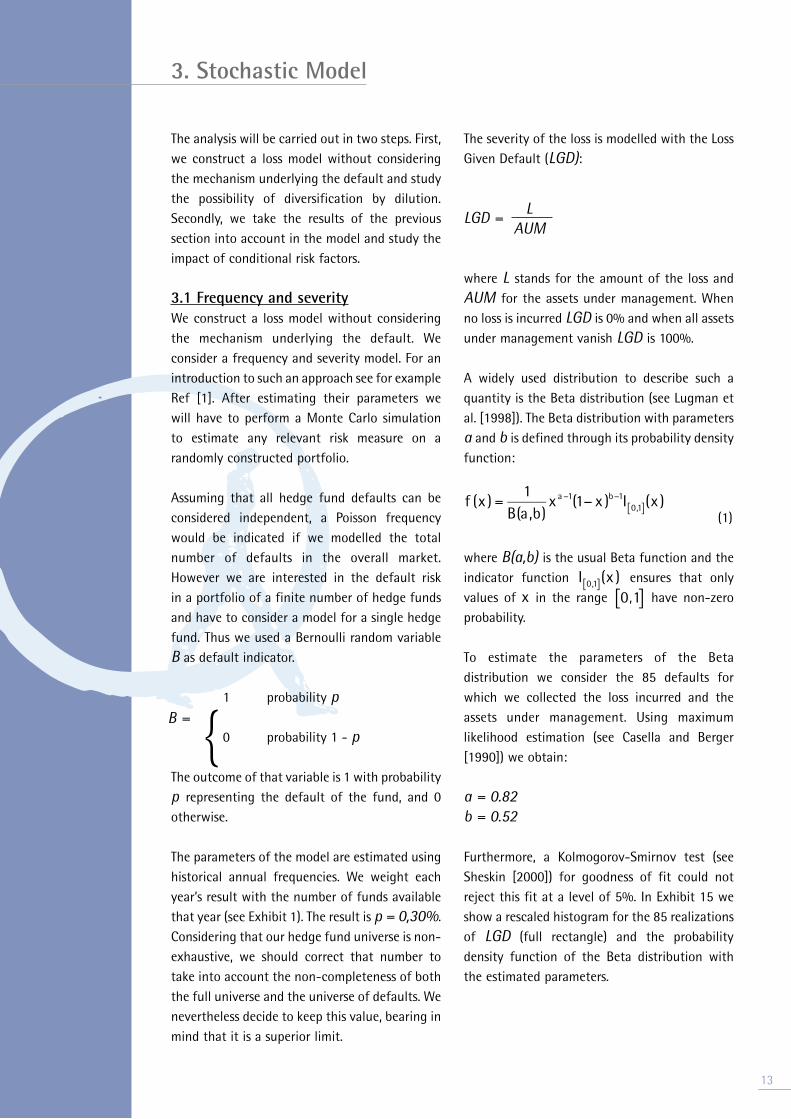
Sample analysis for hedge funds defaulting following an operational problemAs a direct comparison with the last non-conditional distribution analysed in the previous section, we have analysed the distribution of hedge fund failures by instrument complexity, restricting the analysis to funds that have collapsed as a consequence of an operational issue. The distribution is shown in Exhibit 11.
Exhibit 11: Distribution of defaults consecutive to an operational issue: % of defaults by instrument complexity.
The output of this conditional analysis is clear, as the reader will notice a possible relationship between the complexity of the instruments and the likelihood of a hedge fund defaulting as a consequence of operational issues. Understanding this relationship is straightforward, as increased instrument complexity involves more complex operations support and a higher level of possible errors in processing the trades.
Exhibit 12: Distribution of defaults consecutive to an operational issue: % of defaults by location of the management company.
CountryPercentage
of defaults
US 79%
United Kingdom 7%
Canada 7%
Germany 7%
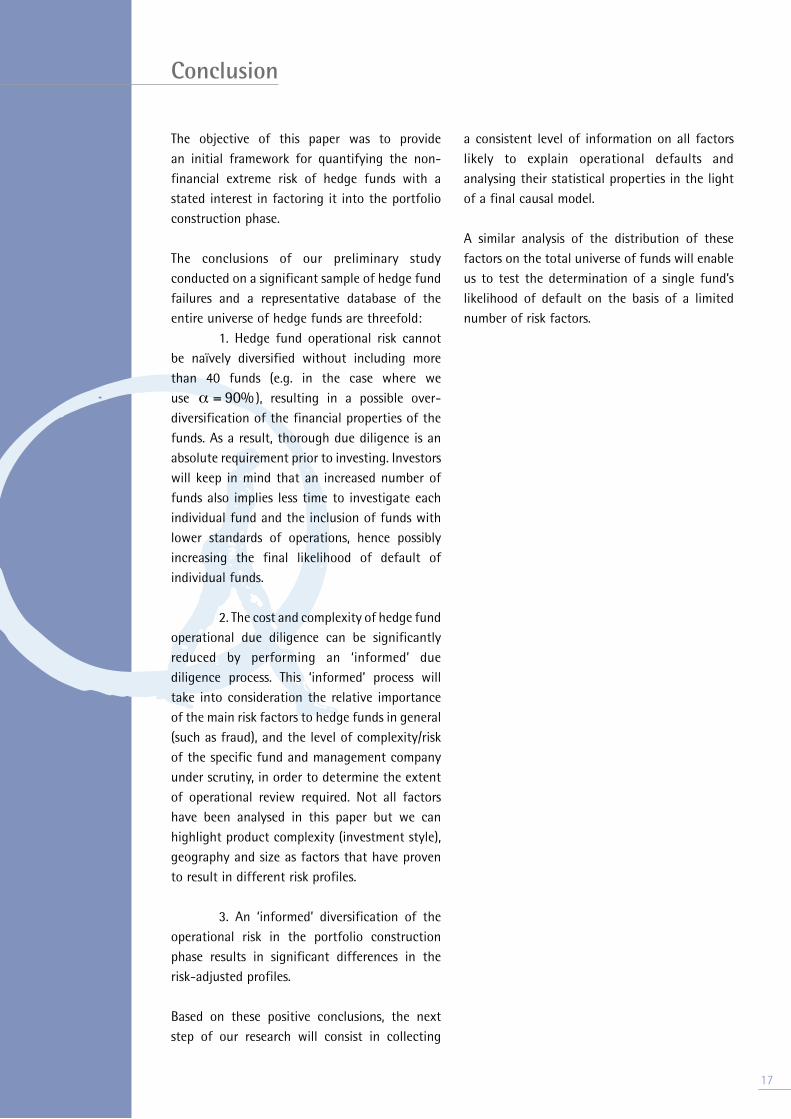
Exhibit 13: Distribution of defaults consecutive to an operational issue: % of defaults by AUM.
2. Causal Model
Unknown 14%
Simple 60%
Complicated 2%
Opaque 24%
Unknown 14%
Simple 14%
Complicated 21%
Opaque 51%
The analysis will be carried out in two steps. First, we construct a loss model without considering the mechanism underlying the default and study the possibility of diversification by dilution. Secondly, we take the results of the previous section into account in the model and study the impact of conditional risk factors.
3.1 Frequency and severityWe construct a loss model without considering the mechanism underlying the default. We consider a frequency and severity model. For an introduction to such an approach see for example Ref [1]. After estimating their parameters we will have to perform a Monte Carlo simulation to estimate any relevant risk measure on a randomly constructed portfolio.
Assuming that all hedge fund defaults can be considered independent, a Poisson frequency would be indicated if we modelled the total number of defaults in the overall market. However we are interested in the default risk in a portfolio of a finite number of hedge funds and have to consider a model for a single hedge fund. Thus we used a Bernoulli random variable B as default indicator.
1 probability p 0 probability 1 - p
The outcome of that variable is 1 with probability p representing the default of the fund, and 0 otherwise.
The parameters of the model are estimated using historical annual frequencies. We weight each year’s result with the number of funds available that year (see Exhibit 1). The result is p = 0,30%. Considering that our hedge fund universe is non-exhaustive, we should correct that number to take into account the non-completeness of both the full universe and the universe of defaults. We nevertheless decide to keep this value, bearing in mind that it is a superior limit.
The severity of the loss is modelled with the Loss Given Default (LGD):
LGD = L AUM where L stands for the amount of the loss and AUM for the assets under management. When no loss is incurred LGD is 0% and when all assets under management vanish LGD is 100%.
A widely used distribution to describe such a quantity is the Beta distribution (see Lugman et al. [1998]). The Beta distribution with parameters a and b is defined through its probability density function:
€
f (x ) =1
B(a,b)x a −1(1− x )b−1I 0,1[ ](x )
(1)
where B(a,b) is the usual Beta function and the indicator function
€
I 0,1[ ](x ) ensures that only values of x in the range
€
0[ ,
€
1] have non-zero probability.
To estimate the parameters of the Beta distribution we consider the 85 defaults for which we collected the loss incurred and the assets under management. Using maximum likelihood estimation (see Casella and Berger [1990]) we obtain:
a = 0.82b = 0.52
Furthermore, a Kolmogorov-Smirnov test (see Sheskin [2000]) for goodness of fit could not reject this fit at a level of 5%. In Exhibit 15 we show a rescaled histogram for the 85 realizations of LGD (full rectangle) and the probability density function of the Beta distribution with the estimated parameters.
3. Stochastic Model
1�
B = {

1�
Exhibit 15: Real count vs. Beta fit (note: data is normalized).
To study the impact of default risk on a portfolio of hedge funds we consider an equally weighted portfolio of N hedge funds. The loss due to defaults DL is described by the random variable:
€
DL = wii=1
N
∑ BiLi
(2)
where
€
wi is the weight of fund i,
€
Bi its default indicator and
€
Li its LGD. For an equally weighted portfolio
€
wi =1N
. All
€
Bi and
€
Li are considered independent and are distributed following the above model.
We consider as risk measures, the standard deviation, the value at risk and the Expected Shortfall (see Artzner et al. [1999]) at level
€
α = 90%. Assuming each year is independent
€
α = 90% would represent the worst year out of 10 years.
To construct the distribution of DL and evaluate these risk measures we run a Monte Carlo simulation using importance sampling. The risk measures are plotted as a function of N in Exhibit 16.
Exhibit 16: Two risk measures for the default loss of the portfolio.
Considering only the standard deviation as a risk measure we would conclude that the default risk is easily reduced by taking more than 20 hedge funds. However, since the losses are potentially extreme, the risk measure that takes this tail risk into account correctly is the Expected Shortfall. This risk measure has been proven to be the correct one to use in cases of discontinuous distribution functions, as is the case here.
We see that the Expected Shortfall is not sensitive to the number of funds for portfolios with fewer than 40 funds. In fact, for all these portfolios the VaR at 90% is exactly 0. By using the estimator (see Acerbi and Tasche [2002]):
€
ES=limNsim →∞
Xi:Nsim
i=1
αNsim
∑αNsim
3. Stochastic Model
it turns out that they average to the same value. Here
€
Xi:Nsim are the sorted Monte Carlo
realizations,
€
Nsim is the number of Monte Carlo realizations and
€
α =10%. The number of realizations being zero is very large for small values of N and finally vanishes around when N = 40 for
€
α =10%. This can be confirmed by the fact that the VaR at 90% drops below zero at that point as seen in Exhibit 16.
Our analysis allows us to conclude that the extreme operational risk of hedge funds is a risk that is difficult to diversify through the naïve method of adding funds in order to minimize the possible loss of one single default. This conclusion reinforces the importance of appropriate due diligence being performed on hedge fund investments in order to significantly reduce the risk of being exposed to a failure.
3.2 Intelligent diversificationBased on the various measures proposed at the end of the previous section we can admit that we are able to exclude potential fraud using appropriate due diligence.
Further, to be more realistic we also consider the potential performance of the fund if the fund does not default. Without any loss of generality we simply consider that all returns are described by normal distributions and their dependency is captured by the linear correlation. The yearly performance P of N hedge funds is then described by
€
P = wiRi (1−Bi )+i=1
N
∑ wii=1
N
∑ BiLi (3)
where (
€
R1........RN ) is a random vector describing the yearly performance of each hedge fund. We use the 12 EDHEC HF indexes3 to estimate the expected return and covariance matrix. The other random variables will follow the same distributions as before but have parameters conditioned to having potential fraud.
We construct the efficient frontier in the Mean-Expected Shortfall space by finding the weights that minimize Expected Shortfall for a given return using a standard numerical method (see for example Press et al. [1992]) for three different cases described in Exhibit 17. Case A is without any consideration of default risk. Case B is by taking into account default risk originating from all cases. Case C is when we consider that due diligence removes all default risk associated with fraud.
Exhibit 17: Parameters of the frequency and severity models in the construction of efficient frontiers.
a b p(%)
A Without default risk / / 0
B With full default risk 0.82 0.52 0.30
C Fraud-free default risk 0.80 0.56 0.07
Exhibit 18: Figure: Mean/expected shortfall frontiers in the universe of EDHEC Alternative Indexes.
Exhibit 18 shows us that starting from the efficient frontier with no default risk (A) we see that including the default risk (B) pushes the frontier far to the right. Fraud-averting due diligence would result in frontier C being relatively close to A. This allows us to observe the impact of considering operational risk/fraud risk
3. Stochastic Model
1�

1�
or not in the construction of efficient portfolios, highlighting the importance of carefully imposing measures that enable to reduce these forms of risk that do not come with a premium to the investor.
3. Stochastic Model
The objective of this paper was to provide an initial framework for quantifying the non-financial extreme risk of hedge funds with a stated interest in factoring it into the portfolio construction phase.
The conclusions of our preliminary study conducted on a significant sample of hedge fund failures and a representative database of the entire universe of hedge funds are threefold: 1. Hedge fund operational risk cannot be naïvely diversified without including more than 40 funds (e.g. in the case where we use
€
α = 90%), resulting in a possible over-diversification of the financial properties of the funds. As a result, thorough due diligence is an absolute requirement prior to investing. Investors will keep in mind that an increased number of funds also implies less time to investigate each individual fund and the inclusion of funds with lower standards of operations, hence possibly increasing the final likelihood of default of individual funds.
2. The cost and complexity of hedge fund operational due diligence can be significantly reduced by performing an ‘informed’ due diligence process. This ‘informed’ process will take into consideration the relative importance of the main risk factors to hedge funds in general (such as fraud), and the level of complexity/risk of the specific fund and management company under scrutiny, in order to determine the extent of operational review required. Not all factors have been analysed in this paper but we can highlight product complexity (investment style), geography and size as factors that have proven to result in different risk profiles.
3. An ‘informed’ diversification of the operational risk in the portfolio construction phase results in significant differences in the risk-adjusted profiles.
Based on these positive conclusions, the next step of our research will consist in collecting
a consistent level of information on all factors likely to explain operational defaults and analysing their statistical properties in the light of a final causal model.
A similar analysis of the distribution of these factors on the total universe of funds will enable us to test the determination of a single fund’s likelihood of default on the basis of a limited number of risk factors.
Conclusion
17

18
1 - Tass, HFR 98, Hedgefund.net, Eurekahedge, MSCI Hedge and Barclay CTA.2 - Altvest and Cogent.3 - Indices available at http://www.edhec-risk.com/indexes/pure_style
End notes
• Acerbi, C. and D. Tasche (2002), “On the Coherence of Expected Shortfall”, Journal of Banking and Finance, 26 (7), pp. 1487–1503.
• Agarwal, V. and N. Naik, (2000).
• Amenc, N., L. Martellini and M. Vaissié (2003), “Benefits and Risks of Alternative Investment Strategies”, Journal of Asset Management, Vol. 4, N°2, pp. 96–118.
• Artzner, P., F. Delbaen, J.M. Eber and D. Heath (1999), “Coherent Measures of Risk”, Mathematical Finance, 9(3), pp. 203–228.
• Casella, G. and R.L. Berger (1990), Statistical Inference, Duxbury Press.
• Christory, C., S. Daul and J.-R. Giraud (2006), "Quantification of Hedge Fund Default Risk", Journal of Alternative Investments, fall.
• Cruz, M.G. (2002), Modeling, Measuring and Hedging Operational Risk, John Wiley and Sons.
• Giraud, J.R. (2003), “Managing Hedge Fund Operational Risks”, EDHEC Working Paper.
• Lugman, S., H. Panjer and G. Willmot (1998), Loss Models, Wiley Series in Probability and Statistics.
• Marshall, C.L. (2000), Measuring and Managing Operational Risks, Wiley Finance.
• Peskin, M.W., M.S. Urias, S.I. Anjilvel and B.E. Boudreau (2000), “Why Hedge Funds Make Sense”, Morgan Stanley Dean Witter.
• Press, W.H., S.A. Teukolsky, W.T. Vetterling and B.P. Flannery (1992), Numerical Recipes in C, Cambridge University Press.
• Schneeweis, T., and R. Spurgin (2000).
• Sheskin, D.J. (2000), The Handbook of Parametric and Nonparametric Statistical Procedures, Chapman & Hall/CRC, 2nd edition.
References

................................................................................................................................................................................................................................................................................................................................................................................................................................................................
................................................................................................................................................................................................................................................................................................................................................................................................................................................................
................................................................................................................................................................................................................................................................................................................................................................................................................................................................
................................................................................................................................................................................................................................................................................................................................................................................................................................................................
................................................................................................................................................................................................................................................................................................................................................................................................................................................................
................................................................................................................................................................................................................................................................................................................................................................................................................................................................
................................................................................................................................................................................................................................................................................................................................................................................................................................................................
................................................................................................................................................................................................................................................................................................................................................................................................................................................................
................................................................................................................................................................................................................................................................................................................................................................................................................................................................
................................................................................................................................................................................................................................................................................................................................................................................................................................................................
................................................................................................................................................................................................................................................................................................................................................................................................................................................................
................................................................................................................................................................................................................................................................................................................................................................................................................................................................
................................................................................................................................................................................................................................................................................................................................................................................................................................................................
................................................................................................................................................................................................................................................................................................................................................................................................................................................................
................................................................................................................................................................................................................................................................................................................................................................................................................................................................
................................................................................................................................................................................................................................................................................................................................................................................................................................................................
................................................................................................................................................................................................................................................................................................................................................................................................................................................................
................................................................................................................................................................................................................................................................................................................................................................................................................................................................
................................................................................................................................................................................................................................................................................................................................................................................................................................................................
................................................................................................................................................................................................................................................................................................................................................................................................................................................................
................................................................................................................................................................................................................................................................................................................................................................................................................................................................
Notes
19

EDHEC RISK AND ASSET MANAGEMENT RESEARCH CENTRE
393-400 promenade des Anglais06202 Nice Cedex 3Tel.: +33 (0)4 93 18 78 24Fax: +33 (0)4 93 18 78 41E-mail: [email protected]: www.edhec-risk.com
EDHEC is one of the top five business schools in France owing to the high quality of its academic staff (100 permanent lecturers from France and abroad) and its privileged relationship with pro-fessionals that the school has been developing since its establishment in 1906. EDHEC Business School has decided to draw on its extensive knowledge of the professional environment and has therefore concentrated its research on themes that satisfy the needs of professionals.
EDHEC pursues an active research policy in the field of finance. Its Risk and Asset Management Research Centre carries out numerous research programs in the areas of asset allocation and risk management in both the traditional and alternative investment universes.
Copyright © 2007 EDHEC