Quantification of digestive utilization of dietary fiber ...
166
Graduate eses and Dissertations Iowa State University Capstones, eses and Dissertations 2015 Quantification of digestive utilization of dietary fiber from corn co-products in growing pigs Néstor Augusto Gutiérrez Céspedes Iowa State University Follow this and additional works at: hps://lib.dr.iastate.edu/etd Part of the Agriculture Commons , and the Animal Sciences Commons is Dissertation is brought to you for free and open access by the Iowa State University Capstones, eses and Dissertations at Iowa State University Digital Repository. It has been accepted for inclusion in Graduate eses and Dissertations by an authorized administrator of Iowa State University Digital Repository. For more information, please contact [email protected]. Recommended Citation Gutiérrez Céspedes, Néstor Augusto, "Quantification of digestive utilization of dietary fiber from corn co-products in growing pigs" (2015). Graduate eses and Dissertations. 14410. hps://lib.dr.iastate.edu/etd/14410
Transcript of Quantification of digestive utilization of dietary fiber ...

Graduate Theses and Dissertations Iowa State University Capstones, Theses andDissertations
2015
Quantification of digestive utilization of dietaryfiber from corn co-products in growing pigsNéstor Augusto Gutiérrez CéspedesIowa State University
Follow this and additional works at: https://lib.dr.iastate.edu/etd
Part of the Agriculture Commons, and the Animal Sciences Commons
This Dissertation is brought to you for free and open access by the Iowa State University Capstones, Theses and Dissertations at Iowa State UniversityDigital Repository. It has been accepted for inclusion in Graduate Theses and Dissertations by an authorized administrator of Iowa State UniversityDigital Repository. For more information, please contact [email protected].
Recommended CitationGutiérrez Céspedes, Néstor Augusto, "Quantification of digestive utilization of dietary fiber from corn co-products in growing pigs"(2015). Graduate Theses and Dissertations. 14410.https://lib.dr.iastate.edu/etd/14410

Quantification of digestive utilization of dietary fiber from corn co-products in growing
pigs
by
Néstor Augusto Gutiérrez Céspedes
A dissertation submitted to the graduate faculty
in partial fulfillment of the requirements for the degree of
DOCTOR OF PHILOSOPHY
Major: Nutritional Sciences
Program of Study Committee:
John Francis Patience, Major Professor
Nicholas K. Gabler
Lance H. Baumgard
Brian J. Kerr
Kenneth J. Stalder
Iowa State University
Ames, Iowa
2015
Copyright © Néstor Augusto Gutiérrez Céspedes, 2015. All rights reserved.

ii
DEDICATION
With love to my newborn son, Sebastián.

iii
TABLE OF CONTENTS
LIST OF FIGURES ........................................................................................................................ v
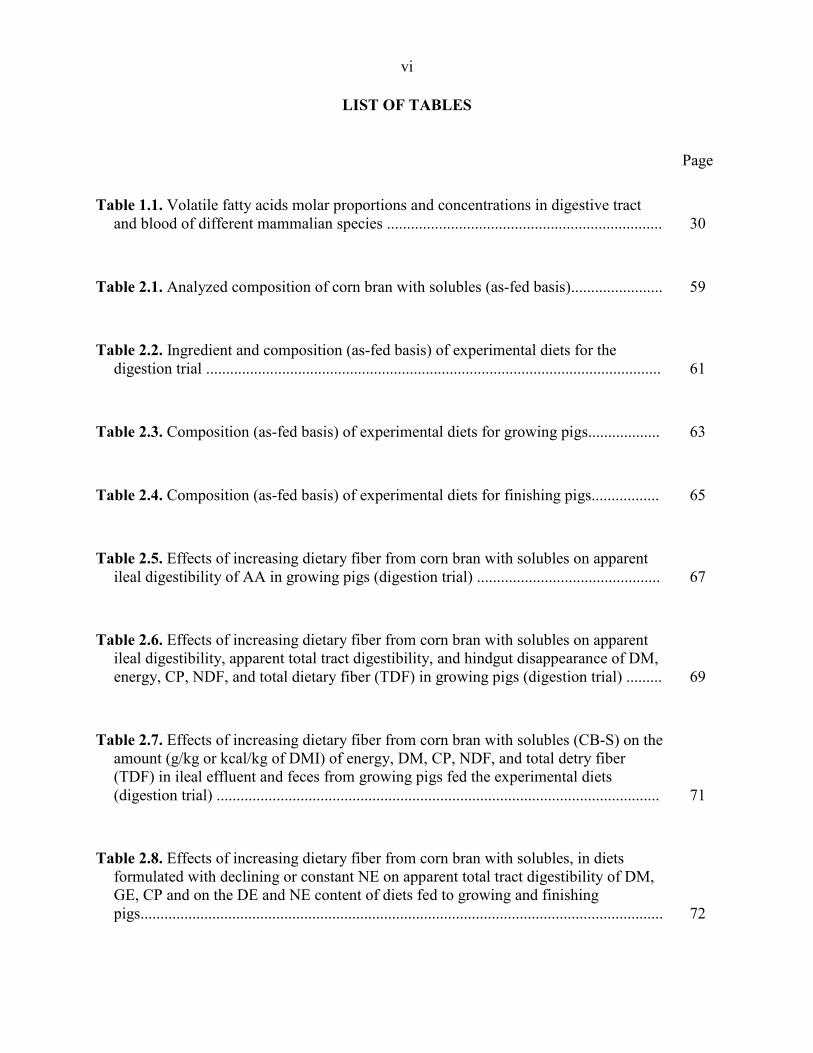
LIST OF TABLES ......................................................................................................................... vi
NOMENCLATURE ...................................................................................................................... ix
ACKNOWLEDGMENTS ............................................................................................................ xii
ABSTRACT ................................................................................................................................. xiv
CHAPTER 1: LITERATURE REVIEW ........................................................................................ 1
LITERATURE CITED ........................................................................................................................... 21
CHAPTER 2: EFFECT OF INSOLUBLE-LOW FERMENTABLE FIBER FROM CORN-
ETHANOL DISTILLATION ORIGIN ON ENERGY, FIBER, AND AMINO ACID
DIGESTIBILITY, HINDGUT DEGRADABILITY OF FIBER, AND GROWTH
PERFORMANCE OF PIGS1 ........................................................................................................ 33
ABSTRACT ........................................................................................................................................... 34
INTRODUCTION .................................................................................................................................. 35
MATERIALS AND METHODS ........................................................................................................... 36
RESULTS ............................................................................................................................................... 42
DISCUSSION ......................................................................................................................................... 44
LITERATURE CITED ........................................................................................................................... 52
CHAPTER 3: EFFECTS OF REDUCED OIL DISTILLERS DRIED GRAINS WITH
SOLUBLES AND SOYBEAN OIL ON DIETARY FAT, FIBER, AND AMINO ACID
DIGESTIBILITY IN CORN BASED DIETS FED TO GROWING PIGS ................................. 76
ABSTRACT ........................................................................................................................................... 77

iv
INTRODUCTION .................................................................................................................................. 79
MATERIALS AND METHODS ........................................................................................................... 80
RESULTS ............................................................................................................................................... 84
DISCUSSION ......................................................................................................................................... 85
LITERATURE CITED ........................................................................................................................... 91
CHAPTER 4: RELATIONSHIPS AMONG DIETARY FIBER COMPONENTS AND THE
DIGESTIBILITY OF ENERGY, DIETARY FIBER, AND AMINO ACIDS, AND ENERGY
CONTENT OF 9 CORN CO-PRODUCTS FED TO GROWING PIGS1 .................................. 106
ABSTRACT ......................................................................................................................................... 107
INTRODUCTION ................................................................................................................................ 109
MATERIALS AND METHODS ......................................................................................................... 110
RESULTS AND DISCUSSION ........................................................................................................... 116
LITERATURE CITED ......................................................................................................................... 127
CHAPTER 5: INTEGRATIVE SUMMARY ............................................................................. 144
LITERATURE CITED ......................................................................................................................... 149

v
LIST OF FIGURES
Page
Figure 1.1 Example of cell wall materials from oats.......................................................... 31
Figure 1.2 Major pathway for propionate metabolism in liver........................................... 32
Figure 3.1 Response surface for the effects of the dietary soybean oil (SBO) and reduced oil distillers dried grains with solubles (DDGS-RO) on the apparent ileal (AID; A) and total tract digestibility (ATTD; B) of acid hydrolyzed ether extract (AEE) in growing pigs (n=9)................................................................................................................................
104
Figure 3.2 Response surface for the effects of the dietary soybean oil (SBO) and reduced oil distillers dried grains with solubles (DDGS-RO) on the apparent ileal (AID; A) and total tract digestibility (ATTD; B) of NDF in growing pigs (n=9)................................................................................................................................
105
vi
LIST OF TABLES
Page
Table 1.1. Volatile fatty acids molar proportions and concentrations in digestive tract and blood of different mammalian species .....................................................................
30
Table 2.1. Analyzed composition of corn bran with solubles (as-fed basis)....................... 59
Table 2.2. Ingredient and composition (as-fed basis) of experimental diets for the digestion trial .................................................................................................................. 61
Table 2.3. Composition (as-fed basis) of experimental diets for growing pigs.................. 63
Table 2.4. Composition (as-fed basis) of experimental diets for finishing pigs................. 65
Table 2.5. Effects of increasing dietary fiber from corn bran with solubles on apparent ileal digestibility of AA in growing pigs (digestion trial) .............................................. 67
Table 2.6. Effects of increasing dietary fiber from corn bran with solubles on apparent ileal digestibility, apparent total tract digestibility, and hindgut disappearance of DM, energy, CP, NDF, and total dietary fiber (TDF) in growing pigs (digestion trial) ......... 69
Table 2.7. Effects of increasing dietary fiber from corn bran with solubles (CB-S) on the amount (g/kg or kcal/kg of DMI) of energy, DM, CP, NDF, and total detry fiber (TDF) in ileal effluent and feces from growing pigs fed the experimental diets (digestion trial) ............................................................................................................... 71
Table 2.8. Effects of increasing dietary fiber from corn bran with solubles, in diets formulated with declining or constant NE on apparent total tract digestibility of DM, GE, CP and on the DE and NE content of diets fed to growing and finishing pigs................................................................................................................................... 72

vii
Table 2.9. Effects of increasing dietary fiber from corn bran with solubles in diets formulated with declining or constant NE on growth performance and energy intake in growing and finishing pigs .........................................................................................
74
Table 3.1. Ingredient composition (%) of the experimental diets (as-fed basis)................. 98
Table 3.2. Analyzed nutrient composition of the experimental diets (as-fed basis)............ 99
Table 3.3. Apparent ileal and total tract digestibility of determined traits in experimental diets ................................................................................................................................. 100
Table 3.4. Digestible and metabolizable energy value of diets........................................... 102
Table 3.5. Regression coefficients of the response surface models for the effects of soybean oil and reduced oil distillers dried grains with solubles on apparent digestibility and energy value of diets ............................................................................ 103
Table 4.1. Ingredient composition (%) of the basal and experimental diets (as-fed basis). 133
Table 4.2. Analyzed nutrient composition of ingredients (as-fed basis)............................. 134
Table 4.3. Analyzed AA concentration (%) of ingredients (as-fed basis)............................ 136
Table 4.4. Apparent ileal and total tract digestibility traits of ingredients.......................... 137
Table 4.5. Digestible and metabolizable energy value of ingredients................................. 139
Table 4.6. Goodness-of-fit ranking of dietary fiber assays by trait..................................... 140

viii
Table 4.7. Goodness-of-fit for the best dietary fiber within category and feed ingredient models across traits .........................................................................................................
141
Table 4.8. Regression coefficients and model fit of the best fitting dietary fiber across traits ...............................................................................................................................
142
Table 4.9. Comparison of model adequacy and effect of ingredient on the residuals from the dietary fiber models ..................................................................................................
143

ix
NOMENCLATURE
AA amino acid(s)
ADF acid detergent fiber
ADFI average daily feed intake
ADG average daily gain
AEE acid hydrolyzed ether extract
AID apparent ileal digestibility
ANOVA analysis of variance
AOAC association of official analytical chemists
Arg arginine
Asp aspartate
ATP adenosine triphosphate
ATTD apparent total tract digestibility
BW body weight
cal calorie
CB corn bran
CB-S corn bran with solubles
CoA coenzyme A
CGmM corn germ meal
CGnM corn gluten meal
CP crude protein
Cu copper
CV coefficient of variation
Cys cysteine
d day(s)
DDG distillers dried grains

x
DDGS distillers dried grains with solubles
DDGS-CV conventional distillers dried grains with solubles
DDGS-RO low fat distillers dried grains with solubles
DDGS-BPX uncooked distillers dried grains with solubles
DE digestible energy
DM dry matter
DMI dry matter intake
EE ether extract
Eq. equation(s)
Exp. experiment
Fe iron
g gram
G:F gain-to-feed ratio
GE gross energy
GLM general linear model
Glu glutamate
Gly glycine
h hour(s)
HCl hydrochloric acid
His histidine
HP-DDG high protein distillers dried grains
Ile isoleucine
Ingred main effect of ingredient
Leu leucine
Lys lysine
ME metabolizable energy

xi
Met methionine
min minute(s)
Mn manganese
n sample size
N Nitrogen
Na sodium
NDF neutral detergent fiber
NE net energy
NRC National Research Council
P probability
PPAR peroxisome proliferator-activated receptor
Pro proline
SAS Statistical Analysis System
SBM soybean meal
SBO soybean oil
SEM standard error of the mean
Ser serine
ST starch
TDF total dietary fiber
Thr threonine
Trp tryptophan
Val valine
VFA volatile fatty acid(s)
wk week(s)
wt weight

xii
ACKNOWLEDGMENTS
I want to express my most sincere gratitude to my Major Professor, Dr. John Patience, who
offered me the opportunity to come to Iowa State University and accomplish my longstanding
dream of starting a PhD in animal nutrition. He has encouraged me to use my limited knowledge
and the scientific method to solve practical problems. Thanks to his mentorship and support I
have been able to work freely, develop my own ideas, and allowed me to pursue scientific
literacy.
I want to extend my appreciation to my graduate committee, because each one of its members
has significantly contributed to my academic growth. Thanks to their help and support the
planning of my PhD program could not have been smoother. I want to thank Dr. Nick Gabler,
who at early stages of my program pressed me to think deeper and study harder, gave me the
privilege to be his teaching assistant, and offered his advice and friendship. Dr. Kenneth Stalder
introduced me to the principles of statistical analysis and software programing, and started my
curiosity for better ways to analyze data. Thanks to Dr. Brian Kerr for collaborating with my
research projects, for always allocating time to discuss data and anecdotes, and help me
strengthen the confidence in my knowledge of applied nutrition. And thanks to Dr. Lance
Baumgard for providing a different point of view to my research, giving me scientific
perspective and advice, and for his friendship.
The greatest appreciation to Dr. Nicola Serao, who collaborated very closely in three of our
projects, for his friendship and immense patience and dedication. With the strategic help of a
clever person as Dr. Serao we were able to interpret and take our data to a higher level.

xiii
I am extremely grateful to all the members of the Patience lab that I have had the pleasure to
work with. It has been 5 years where I have seen many people coming and leaving, but always
found help and friendship when needed. Thanks to my group I had the chance to learn and
assimilate the American culture. I always felt the admiration and appreciation from the members
of our group, and this encouraged me to persevere in spite of the difficulties.
I would also like to acknowledge the Department’s staff that were always there and willing to
help. Specifically Julie, Donna, Peg, and Steve, among others. I also want to thank the extremely
valuable and kind farm staff members: John, Robert, Dan, Jacob and Trey.
I want to thank my friends at the Animal Science Department Dr. Raj Murugesan, Mr. Kevin
Bolek, Dr. Chad Pilcher, Mr. Jesus Acosta, and Dr. Venkatesh Mani for their friendship and
support during tough times.
I finally want to thank my caring mother, Nydia, who is the best example of love and
perseverance, and sacrificed everything she could so I could be here. And my loving wife, Olga,
because she has been my friend and my support in every quest, and her unconditional love gives
me the strength and the motivation to be better every day.

xiv
ABSTRACT
In vivo digestibility experiments using the cannulated pig model were used to study the
digestion of fiber from diets formulated with high concentrations of corn co-products and fed to
growing pigs. Experiment 1 was conducted to measure the effect of increasing levels of
insoluble-low fermentable fiber from corn in the diet, using corn bran with solubles from the
corn-ethanol distillation industry (CB-S), on digestibility of energy, fiber, and AA, and hindgut
fermentation of fiber in diets fed to growing pigs. Results indicated that increasing fiber from
corn lowered (P < 0.01) the apparent ileal digestibility (AID) of GE, DM, CP, and all
indispensable amino acids except Arg, but did not affect (P > 0.05) the AID of neutral detergent
fiber (NDF) or total dietary fiber (TDF). Increased fiber from corn also reduced the apparent
total tract digestibility (ATTD) of GE, DM, CP, NDF, and TDF (P < 0.01). A decrease (P <
0.01) in hindgut fermentability of NDF (19.6 to 6.4%) and TDF (21.9 to 9.7%) was observed
with the dietary inclusion of CB-S. Two subsequent 28-d growth trials were conducted in Exp. 2
to measure the effects of increasing dietary fiber from CB-S in 2 sets of 7 diets formulated either
with declining (growing phase: 2,387 to 2,133 kcal NE/kg; finishing phase: 2,499 to 2,209 kcal
NE/kg) or constant dietary NE (growing phase: approximately 2,390 kcal NE/kg; finishing
phase: approximately 2,500 kcal NE/kg), on growth performance and apparent total tract ATTD
of energy in 70 growing (BW = 48.9 kg; n = 10) and 70 finishing (BW = 102.0 kg; n = 10) pigs.
Results showed that increasing fiber with declining diet NE lowered BW, ADG, and G:F (P <
0.05) in growing and in finishing pigs. When NE was held constant, as fiber increased, BW and
ADG were unaffected (P > 0.05) in growing and finishing pigs, and G:F was unaffected in
finishing pigs but improved in growing pigs (P < 0.05) with increasing dietary fiber. In both
growing and finishing pigs, ADFI was not affected (P > 0.05) by the increased fiber from corn,

xv
regardless of the NE content of diets. Experiment 3 was conducted to determine the effects of
addition of reduced oil distillers dried grains with solubles (DDGS-RO) and soybean oil (SBO)
on dietary Lys, acid hydrolyzed ether extract (AEE), and NDF digestibility in corn-based diets
fed to growing pigs. Results showed that the AID of Lys was not affected by SBO concentration
(P > 0.05), but DDGS-RO inclusion showed a quadratic effect (P < 0.001). An interaction
between DDGS-RO and SBO on the AID (P = 0.003; R2 = 0.68) and ATTD (P = 0.004; R2 =
0.79) of AEE, as well as on the AID (P = 0.037; R2 = 0.53) and ATTD (P = 0.004; R2 = 0.36) of
NDF was observed. It was concluded that DDGS-RO increased the digestibility of AEE, and
decreased the digestibility of NDF, but the effect was modulated by SBO. Soybean oil increased
the digestibility of AEE but the effect was modulated by DDGS-RO, and increased the AID of
NDF in diets without DDGS-RO. The AID of Lys decreased with DDGS-RO and was not
affected by addition of SBO. Experiment 4 was conducted to determine a best fitting dietary
fiber component to estimate the effect of dietary fiber concentration on the digestibility of
energy, fiber, and AA, and energy value of 9 corn co-products. It was observed that the
arabinoxylan and NSP xylose residue were the dietary fiber components that best explained
variation due to dietary fiber concentration and, with the exception of AID of Lys, can be used to
predict the digestibility of energy and dietary fiber, and the DE and ME values in corn co-
products. In conclusion, dietary fiber from corn co-products has an intermediate digestibility and
does not affect digestibility of the other nutrients in the diet. The ability of pigs to digest fiber
from corn origin is modulated by the fat concentration of the diet. The xylose and arabinoxylan
concentrations in corn co-products better explain the variation in digestibility of dietary fiber and
energy than most of the commonly used fiber procedures.
Key words: non-starch polysaccharides, ileal digestibility, cannulated pig, best fit.

1
CHAPTER 1: LITERATURE REVIEW
Dietary fiber from corn co-products in swine feeding
Corn co-products from the biofuel industry: Overview
Several co-products from the bio-ethanol production have been commonly used to feed
animals for over 50 years already (Shurson et al., 2012). The two main types of ethanol
production from maize are dry milling and wet milling. The wide range of co-products that are
produced differ substantially in composition and nutritional values (Gutierrez, et al., 2014). Corn
gluten meal, corn gluten feed, condensed fermented corn extractives, corn germ meal, and corn
oils are co-products from the wet milling process. Co-products from the dry milling process
include wet distillers grains, condensed distillers solubles, modified wet distillers grain, distillers
dried grains (DDG), and distillers dried grains with solubles (DDGS). Advances in the ethanol
industry increase the efficiency of starch and oil extraction from the corn grain, concentrating the
fiber and protein component of the co-product therefore new products such as high protein or
reduced oil distillers dried grains enter the market. Distillers dried grains with solubles are a by-
product of the corn-ethanol distillation process where entire grain kernels are ground, cooked
(premixing at 40-60 °C and cooking at 90-165 °C) and enzymatically hydrolyzed (thermo stable
amylases, at 60 °C, > 30 min), after which yeast are added to ferment sugars to ethanol (de Vries,
2014). After distillation, solids and solubles are separated by centrifugation. Solubles are
concentrated by condensation and added back to the solids, to a maximum of 25% of the total
product. The resulting DDGS is dried using rotary drum driers (250-600 °C, product temperature
approximately 100 °C, typically < 1 h) and in some cases pelleted (de Vries, 2014).
2
Distillers dried grains with solubles may substitute for corn and soybean meal in the diet
because DDGS has similar concentrations of DE and ME as corn, and contains highly digestible
P (Stein and Shurson, 2009). However, one of the main challenges of using DDGS, and many
other corn co-products, is that they often have high concentrations of dietary fiber. Dietary fiber
is mainly composed of sugar polymers that cannot be digested by the pig’s gastrointestinal
enzymes. In spite the impossibility of enzymatic digestion, the pig may obtain energy from
dietary fiber by microbial fermentation in the hindgut, producing volatile fatty acids (VFA) that
can be absorbed and used by the pig to produce ATP or stored as fatty acids in adipose tissue
(Bach Knudsen, 2001). The energy contribution from VFA is not as efficient as the energy
contribution obtained form enzymatic hydrolysis of simple sugars, fat, and proteins in the small
intestine (Black, 1995).
Carbohydrates in plants
A categorization of the carbohydrate constituent of plants is necessary because swine
diets consist almost exclusively of feedstuffs of plant origin, which contain mostly
carbohydrates, and supply the majority of the dietary energy. Plant carbohydrates can be divided
into 2 components: the cell wall and non-cell wall contents (Jaworski, 2012).
The plant non-cell wall carbohydrates include starch, disaccharides, oligosaccharides,
fructan polysaccharides, and resistant starch. The plant cell wall carbohydrates include cellulose,
hemicellulose, β-glucans, pectins and gums, and lignin (Cervantes-Pahm, 2011; NRC, 2012).
Carbohydrates can also be divided into digestible and non-digestible carbohydrates
(Bach Knudsen et al., 2012). Digestible carbohydrates are those that the pig can digest through

3
the secretion of endogenous enzymes and the term refers to sugars (glucose, fructose, sucrose,
lactose, and maltose), certain oligosaccharides, and starch (Bach Knudsen et al., 2012). Non-
digestible carbohydrates are those that are not digested by the end of the small intestine due to
enzymatic action and must be fermented in the hindgut (Bach Knudsen et al., 2012). Non-
digestible carbohydrates consist of non-digestible oligosaccharides, resistant starch, and NSP
(Bach Knudsen et al., 2012). Most non-digestible carbohydrates, as well as plant cell wall
carbohydrates, may also be included in the term dietary fiber, which is commonly defined as “all
plant polysaccharides and lignin that are resistant to hydrolysis by human digestive secretions”
(Trowell, 1976).
The dietary fiber concept
Swine diets consist almost exclusively of feedstuffs of plant origin, which contain
varying levels of plant cell wall material. Seventy to 90% of plant cell walls are non-starch
polysaccharides (NSP), which are interconnected and associated with proteins and lignin via
covalent and non-covalent linkages (Back Knudsen, 2001; de Vries, 2014). Although the
chemical constitution of these cell wall fractions varies widely, they can be considered alike
from a nutritional point o view, as they are not enzymatically digested and exert similar
physiological properties (de Vries, 2014). Hence, often a physiological based definition is used
to describe the fraction of feed resistant to enzymatic digestion (de Vries, 2004). This fraction,
which is mostly constituted of plant cell wall components, is usually referred to as fiber or
dietary fiber.

4
There are numerous definitions of dietary fiber, but most of them either define dietary
fiber as a group of compounds that are identified in analytical methods or as a group of
compounds that have specific physiological functions (Food and Nutrition Board-IOM, 2001;
Urriola, 2010). In the 19th century, the Weende procedure defined crude fiber as the organic
residue that is insoluble in acid and alkaline treatments (Mertens, 2003), became an official
AOAC method in 1980, and was used to measure the indigestible organic matter of food in feed.
This portion of the diet was considered the de facto definition of dietary fiber and without real
value to the animal, because although is a robust method to analytical variation it recovers only
part of the fiber fraction (AACC, 2001; Urriola, 2010).
The concept of dietary fiber was first introduced by Hipsley (1953) to denote non-
digestible constituents that make up the plant cell wall. Burkitt and Dennis adopted the term
dietary fiber in conjunction with a number of health-related benefits, and referred to it as the
“dietary fibre hypotheses” (Bach Knudsen, 2001). These conclusions triggered interest in dietary
fiber, but it became clear that dietary fiber is a heterogeneous group of chemical components
with multiple physiological functions and, therefore, difficult to define (Carpenter, 2003; Urriola,
2010). Trowell (1974) defined dietary fiber as “the skeletal remains of plant cells in the diet,
which are resistant to hydrolysis by the digestive enzymes of man”, but the definition excluded
polysaccharides added to the diet such as food additives (e.g. plant gums, modified cellulose)
and was later expanded to include “all polysaccharides and lignin, which are not digested by the
endogenous secretions of the human digestive tract” (Trowell et al., 1976; Bach Knudsen, 2001).
The definition of dietary fiber has been debated continuously and no universal agreement has yet
been reached, and most researchers use either a physiological or a chemical definition.
According to Theander et al., (1994) the physiological definition of dietary fiber refers to “the

5
dietary components resistant to degradation by mammalian enzymes”, while the chemical
definition of dietary fiber refers to the “sum of NSP and lignin”.
It is now accepted that a more accurate definition of fiber must include the physiological
effects of fiber (IOM, 2006), and that an important part of the definition is that dietary fiber
consists of carbohydrates that are indigestible by mammalian enzymes (AACC, 2001; IOM,
2006). In this line, and as outlined by Urriola (2010), the current definition of dietary fiber from
the American Association of Cereal Chemist includes the following:
1. It is an indigestible portion of the diet.
2. It consists of carbohydrates and lignin.
3. It originates from plants.
a. It has physiological effects that increase laxation and reduce blood cholesterol
and/or blood glucose.
A more chemical definition currently used by AOAC is: “Dietary fiber consists of the
remnants of edible plant cells, polysaccharides, lignin, and associated substances resistant to
digestion by the alimentary enzymes of humans” and includes oligosaccharides, pectic
polysaccharides, hemicellulose, cellulose, lignin, gums, and some minor associated plant cell
wall substances (de Vries, 2014).
The term NSP is related to dietary fiber, but does not cover all components that can be
classified as dietary fiber, because it excludes chemical entities such as oligosaccharides and
lignin, which were included in the definition of dietary fiber by the AOAC and AACC (Urriola,
2010). The use of the term NSP may not be an accurate description of fiber in feed ingredients
because dietary fiber is not limited to NSP or plant cell walls (Cho et al., 1997; Urriola, 2010).
6
Urriola (2010) listed several different issues that need to be addressed in the definition of
dietary fiber, specifically chemical entities from the diet or chemical modifications due to
processing of feed ingredients, that may not be analytically detected by the dietary fiber chemical
assay but is considered part of dietary fiber, or chemical entities that may not be considered part
of the dietary fiber component but are detected analytically in the dietary fiber assay. These
chemical entities include chitosan and mucopolysaccharides, lignin, products of Maillard
reactions, fatty derivates (e.g. cutin), oligosaccharides, and special mono-disaccharides.
Chemical Composition of Dietary Fiber
Dietary fiber derives mostly from plant cell walls, and consists of polysaccharides
associated, or substituted, with proteins and phenolic compounds, together with the phenolic
polymer lignin (Theander et al., 1989; Bach Knudsen, 2001). As cited by Bach Knudsen (2001)
the building blocks of the cell wall polysaccharides are pentoses (arabinose and xylose), hexoses
(glucose, galactose, and mannose), 6-deoxyhexoses (rhamnose and fucose), and uronic acids
(glucoronic and galacturonic acids). The main polysaccharides of plant cell walls are cellulose,
arabinoxylans, and mixed linked D-glucans, xyloglucans, rhamnogalacturonans,
arabinogalactans (Bacic et al., 1998; Selvendran, 1984; Theander et al., 1989). The other major
component of the cell wall is lignin, which can be described as very branched networks build up
by phenylpropane units. Lignin serves two main functions; it cements and anchors the cellulose
microfibrils and other matrix polysaccharides and, as it associates with non-cellulosic
polysaccharides, stiffens the walls thus preventing biochemical degradation and physical damage
of the cell walls (Liyama et al., 1994; Bach Knudsen, 2001).

7
Chemistry societies separate carbohydrates in three groups: monosaccharides,
oligosaccharides (including disaccharides), and polysaccharides (Nelson and Cox, 2008).
Monosaccharides and disaccharides, however, are often grouped together as sugars and
oligosaccharides are defined as compounds between 3 and 9 monosaccharides while
polysaccharides contain more than 10 (Cummings and Stephen, 2007; Urriola, 2010).
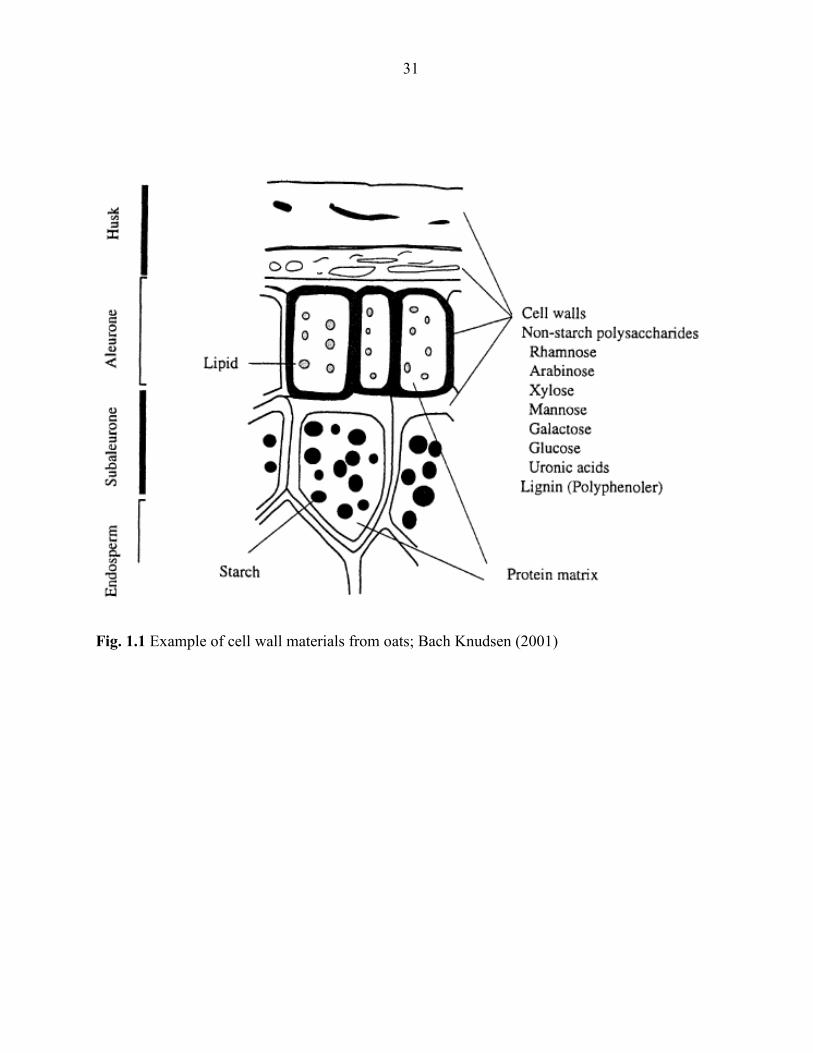
According to Bach Knudsen (2001), the physical and chemical location of
polysaccharides within the plant cell wall has a large influence on the physicochemical
properties of cell wall polysaccharides and on its effects on the gastrointestinal tract. Cellulose
form microfibrils that are highly ordered and form a rigid skeleton, whereas the amorphous
region (constituted of non-cellulosic polysaccharides and glycoproteins) is less ordered (Fig. 1.1;
Bach Knudsen, 2001). While the nature of cellulose varies little between plants, the composition
of the amorphous matrix usually shows considerable variation from tissue e to tissue within the
plant and between plants (Bach Knudsen, 2001). In cereals such as corn and corn co-products the
main cell wall NSP of the whole grain are arabinoxylans, cellulose, and β-glucan with some
variation between the cereals. Cereals are pectin free, but pectin polysaccharides are common in
dicotyledonous plants (Bacic et al., 1988; Selvendran, 1984). The chemical composition of the
plant cell wall varies not only among plant species, but also varies with the maturity of the plant
organ at harvest.
Physicochemical Properties of Dietary Fiber
Dietary fiber can also be classified according to its physicochemical properties, which
includes: 1) hydration properties such as swelling capacity, solubility, water holding capacity,

8
and water binding capacity 2) viscosity 3) cation exchange capacity (Kritchevsky, 1988). Only
hydration properties and viscosity will be considered in the present review. The physicochemical
properties are linked to the type of polymers that make up the cell wall and their intermolecular
association (McDougall et al., 1996).
Prior to the solubilisation of polymers, incoming water swells the dietary fiber to a
variable extent, spreading the macromolecules until they are extended and dispersed for
solubilization (Thibault et al., 1992). The solubility of a polysaccharide depends not on the
monosaccharide, but on the links among them (Cho et al., 1997). Solubilisation is not possible in
the case of polysaccharides that adopt regular ordered structures such as cellulose or
arabinoxylans, where the linear structure increases the strength of the non-covalent bonds,
stabilizing the ordered conformation (Bach Knudsen, 2001). Corn and its co-products are rich in
cellulose and arabinoxylans, therefore its dietary fiber is mostly insoluble. Soluble
polysaccharides such as β(1-6)-glucans are easier to access by microbes, facilitating fermentation
(Oakenfull, 2001). Separation of dietary fiber into soluble and insoluble fractions was the initial
step in understanding fiber (Cho et al., 1997). Soluble fiber influences the absorption of lipids
and glucose, while insoluble influences bowel movement and is less fermented in the large
intestine than soluble fiber (Cho et al., 1997; Serena et al., 2008; Urriola 2010).
The water holding capacity and water binding capacity refer to the ability of a dietary
fiber source to retain water within its matrix (Bach Knudsen, 2001). Although the terms have
been used interchangeably, they are not the same because water binding capacity refers to the
amount of water retained in the dietary fiber matrix after stress (e.g. centrifugation, pH changes,
and particle size reduction) has been applied (Cho et al., 1997). It is therefore that during passage
through the gut, dietary fiber may swell to a variable extent. Although soluble and insoluble fiber

9
can both retain water, the water binding capacity id determined by the physicochemical structure
of the molecules, and by the pH and electrolyte concentration of the surrounding fluid (Bach
Knudsen, 2001). Dietary fiber from cereals tends to have lower water binding capacity than fiber
sources with a high concentration of pectins (Serena and Bach Knudsen, 2007).
When dissolved in water the majority of polysaccharides produce viscous solutions
(Morris, 1992; Bach Knudsen, 2001). Viscosity is the relationship between the flow of matter
and the force that moves it (Dikeman and Fahey, 2006). The viscosity is dependent on the
molecular weight of the polymer and the concentration, and large molecules increase the
viscosity of a diluted solution because of the volume they occupy (Bach Knudsen, 2001).
Absorption of glucose and other nutrients may be reduced by highly viscous dietary fiber
(Nyman, 2003).
Differences in the degree of fermentability by microbes of the gastrointestinal tract exist
between sources of dietary fiber (Gallager, 2006). The available energy from VFA that the pig
obtains from dietary fiber increases with a greater fermentability of dietary fiber (McBurney and
Sauer, 1993). The fermentability of dietary fiber depends on the access of bacterial enzymes to
their substrate, chemical composition of the substrates, solubility, water holding capacity, and
porosity of the dietary fiber (Cho et al., 1997, Gallager, 2006; Guillon et al., 2006; Urriola,
2010).
Analytical Methods to Measure Dietary Fiber
All analytical methods to determine the dietary fiber content of human food, animal feed,
and feed ingredients include two basic steps; first, digestion of carbohydrates and other non-fiber

10
components of the diet (e. g. protein, fat, water, minerals) and, second, quantification of the
undigested residue (Urriola, 2010). The digestion procedure can use chemical compounds (e. g.
alkali, acid, and detergents) or use enzymes (amylase, amyloglucosidases, and proteases)
(Urriola, 2010). Measurement of the indigestible residue can be accomplished y weighing the
residue (gravimetric) of by measuring chemical compounds in the residue using chromatography,
gas liquid chromatography, and high performance liquid chromatography (Urriola, 2010).
The analytical method that is most commonly used to measure fiber in feed ingredients is
the crude fiber method (Bach Knudsen, 2001). It’s a chemical-gravimetric method developed at
the Agricultura Experimental Station in Weende, Germany (Grieshop et al., 2001). It employs
sequential extraction with diluted acid and alkali, followed by gravimetric determination of the
residue after drying (Bach Knudsen, 2001). Because of the solubilisation of the structural
polysaccharides and lignin, this method only measures a small and variable fraction of the fiber
components (Bach Knudsen, 2001). Hence there is no relationship between crude fiber and any
definition of dietary fiber (Mertens, 2003) because the recovery of cellulose (40-100%),
hemicelluloses (15 to 20%), and lignin (5 to 90%) is not complete (Grieshop et al., 2001;
Mertens, 2003; Urriola, 2010).
The detergent methods developed by Van Soest and co-workers is a chemical-gravimetric
procedure that empirically relates the value from the analysis to the physiological properties of
dietary fiber, and measure the fraction of the fiber that is insoluble in neutral detergents (NDF)
and acid detergents (ADF; Van Soest et al., 1991). The NDF measure hemicellulose, cellulose
and lignin, while ADF measure cellulose and lignin, allowing for the calculation of
hemicellulose by difference (Bach Knudsen, 2001). The NDF and ADF, however, do not recover
soluble dietary fiber such as pectins, mucilages, gums, and β-glucans (Grieshop et al., 2001). In

11
cereal grains such as corn and co-products where dietary fiber is mostly insoluble, the lack of
recovery of soluble dietary fiber components are less concerning (Johnston et al., 2003; Urriola
et al., 2010). Other problems with the detergent procedure include the possible contamination of
the residue with starch, and that hemicellulose may be left in the ADF fraction (Mertens, 2003).
The two main approaches used to develop more robust and reproducible dietary fiber
methods have been the enzymatic- or non-enzymatic gravimetric AOAC procedures (Method
985.29; Prosky et al., 1985) and the enzymatic-chemical from Uppsala (Theander et al., 1994). In
the enzymatic-gravimetric approach, often called total dietary fiber (TDF), all non-fiber
components are removed from the sample by extraction of low-molecular weight sugars and
lipids and enzymatic degradation (e.g., amylase, glucoamylase, and protease) of protein and
starch, the residue is weighed and corrected for ash and protein (Bach Knudsen, 2001). The TDF
has been modified to determine soluble and insoluble dietary fiber (AOAC Official Method
991.43; AOAC Int., 2007). The TDF procedure is more time consuming and less reproducible
than the crude fiber and detergent methods (Mertens, 2003).
In the enzymatic-chemical approach, often called Uppsala TDF, the dietary fiber
constituents are determined directly after extraction of low-molecular weight sugars, enzymatic
removal of starch, acid hydrolysis of dietary fiber polysaccharides and determination of their
monosaccharide residues by gas-liquid chromatography, high-performance liquid
chromatography or colorimetry (Bach Knudsen, 2001). The Uppsala method calculates TDF as
the sum of amylase-resistant polysaccharides, uronic acids, and Klason lignin (AOAC Int., 2007;
Grieshop et al., 2001). The enzymatic-chemical methods yield information on the monomeric
composition of the NSP and divide it into soluble and insoluble fractions by 80% ethanol, which
gives a general view of the functional properties of the fiber (Bach Knudsen, 2001).

12
The concentration of dietary fiber of a diet or a feed ingredient can also be estimated
indirectly, or by difference. The underlying assumption of this method are that all other nutrients
have relative low analytical errors and that all values are additive (Urriola, 2012). The dietary
fiber concentration is equivalent to the calculation of indigestible carbohydrates, which is
achieved by analyzing the substrate for starch and sugars along with protein, fat, and water (de
Lange, 2008) as follows, Eq [1]:
Indigestible carbohydrates, g = DM, g – (ash + starch + sugars + protein + fat) [1]
One of the limitations of calculating indigestible carbohydrates by difference is that it
includes the cumulative errors from all other analytical procedures (e. i. protein, fat, ash, DM).
Other dietary components such as polyols, alcohol, and organic acids are not included. It is
therefore that the value is not reliable and should be discouraged (Urriola, 2010).
Fermentability and Utilization of Dietary Fiber by Growing Pigs
The effect of dietary fiber on gastric emptying and has been extensively studied in human
nutrition, and a strong relationship has been established between reduced rate of gastric emptying
and delayed absorption of nutrients, causing a reduction in the post-prandial peripheral glucose
and insulin responses to carbohydrate meals. The importance in pigs is that a reduction in the
rate of gastric emptying may limit intake of nutrients and growth. It is however an advantage for
sows, since it may induce satiety, decreasing the sensation of hunger and improving in turn the
wellbeing of animals in commercial conditions (Vestergaard, 1997; Bach Kndusen, 2001).
Reports of the effects of dietary fiber on gastric emptying in the literature are, however,

13
contradictory and most likely caused by differences among studies in the form in which the
dietary fiber has been included.
As summarized by Urriola (2010), fermentative microorganisms conserve energy by
transferring electrons from redox reactions to part of the substrate from which energy is derived.
During fermentation the substrate is only partially oxidized and only a small amount of energy is
conserved for microbial growth (Müller, 2008). During fermentation of dietary fiber in the pig
intestine, microbes start breaking down polysaccharides into smaller polysaccharides or the
constituent carbohydrates (Müeller, 2008). The monomers then are absorbed into the microbial
cell and channeled into the pathways of central metabolism (White, 2000). The products of
fermentation are excreted from the microbial cell into the intestinal lumen. The products of
microbial fermentation can also be used as substrate for another microbe, excreting in turn a
second product (anaerobic food chain). Finally the pig absorbs some of the end products of
fermentation of carbohydrates, mainly VFA.
Absorption of VFA
Each of the VFA is readily absorbed from all segments of the lower digestive tract, in a
very efficient process that shares similarities with processes occurring in the rumen of
herbivores. The VFA absorption appears to be mostly passive and increases linearly with
corresponding decreases in pH or increases in concentration (Bergman, 1990). However, unlike
the rumen, individual VFA are probably absorbed at comparable rates rather than in the
ascending order of acetate<propionate<butyrate (Bergman, 1990). Absorption is proposed to
occur following 3 main mechanisms: 1) diffusion of protonated VFA 2) anion exchange (Wong

14
et al., 2006), and 3) transporter mediated (Kirat and Kato, 2006). Diffusion of protonated VFA is
likely the least important, because at physiological pH, only 1% of all VFA in the intestinal
lumen is protonated (Cook and Sellin, 1998). If anion exchange is used, VFA are taken up into
the enterocyte and HCO3- is released to the intestinal lumen (Cook and Sellin, 1998). More
recent studies have documented the existence of active transport of VFA. Active transporters of
VFA belong to the monocarboxilate family and MCT-1 is the transporter present in the intestine
of pigs (Welter and Claus, 2008). Another transporter expressed in human colonocytes is the
sodium-coupled nomocarboxylate transporter or SLC5A8 that may be implicated in absorption
of VFA, especially butyrate (Thangaraju et al., 2008). The MCT1 transporter has been identified
in pig intestinal cells, but is not clear if the SLC5A8 is also present in pig colonocytes.
Absorption of VFA also facilitates absorption of other nutrients from the diet. Water and
sodium are absorbed along with VFA (Yen, 2001). Plant lignans, diphenolic compounds similar
to endogenous steroid hormones are also co-transported by VFA (Bach Knudsen et al., 2006).
Inulin improves the bioavailability of iron in corn and soybean meal diets in young anemic
piglets (Yasuda et al., 2006). It is not clear if inulin increases absorption of Fe by increasing
production of VFA and thereby VFA increase absorption of Fe, or if SFCA reduce luminal pH
and increase solubility of Fe, or if VFA increase the expression of the Fe transporters (Tako et
al., 2008).
Metabolism of VFA
Approximately 60% of the initial energy is retained in VFA arising from the colonic
fermentation. Colonic microbes use the remaining 40% of the potential energy contained

15
originally in the dietary fiber substrate for growth of is lost as hydrogen and methane (Fleming
and Arce, 1986; Miller and Wolin, 1979). The concentration and molar proportions of VFA in
portal and arterial blood is different from that in intestinal digesta, suggesting that VFA are
metabolized in the intestinal cells and liver (Table 1.1; Argenzio et al., 1974; Bergman, 1990;
Marsono et al., 1993). The typical VFA molar proportions in intestinal content of pigs are
65:25:10 (acetate:propionate:byturate). From Table 1.1 is clear that total VFA concentrations as
well as individual molar proportions in the cecum and colon are close to those found in the
rumen. The concentrations and proportions of VFA in the blood also show some similarities
among the several species. Portal blood has a higher total VFA concentration than hepatic or
arterial blood because of direct absorption of VFA through the gut epithelium and because
hepatic and peripheral metabolism has not yet had a chance to occur (Bergman, 1990). The
molar proportions of the individual VFA in blood do not parallel those found in the rumen or gut
contents. In pigs, a change in the ratio of VFA after absorption and passage through liver to
90:10:0 in hepatic circulation demonstrates selective metabolism of VFA in enterocytes and in
liver (Robertson, 2007). This change clearly indicates that each of the individual VFA is
metabolized to different extents by the gut epithelium. Similar metabolic patterns occur in the
liver, since much lower amounts of propionate and butyrate are found in hepatic, arterial, or
peripheral venous blood than in portal blood. The liver must therefore remove a large proportion
of the remaining propionate and butyrate and a smaller proportion of acetate (Bergman, 1990). In
all species acetate comprises >90% of the VFA in arterial or peripheral blood and is therefore the
main VFA made available for use by muscle or adipose tissue (Bergman, 1990).
Volatile fatty acids are therefore used in 3 ways: 1) by colon cells that use them as an
energy source, 2) by the liver that use propionate for gluconeogenesis, and 3) by adipose tissue

16
and muscle (Wong et al., 2006). Propionate and butyrate are metabolized by the intestinal
epithelium and by the liver. Butyrate, however, is largely removed by the gut epithelium,
whereas the liver takes up most of the propionate. For both VFA only little escapes to peripheral
circulation. In the cecum of rats, approximately 12% of the butyrate is converted to ketone
bodies and free amino acids (Remesy and Demigne, 1976). In addition to ketone bodies, butyrate
is readily oxidized to CO2 in the colonic wall of pigs (Imoto and Namioka, 1978) and thus acts
as an important respiratory fuel or energy source for the colon. Glutamine is also used as a
respiratory fuel for the colon of most animal species, but the evidence indicates that butyrate is
probably preferentially utilized over glutamine and all other metabolites as an energy source for
the colonic epithelial cells (Kritchevsky, 1988; Elia and Cummings, 2007). Butyrate metabolism
by liver involves conversion to butyryl-CoA by the enzyme butyryl-CoA synthetase (Bergman,
1990). After this initial reaction, it is rapidly converted to acetyl-CoA, longer chain fatty acids,
or ketone bodies. Although the vast majority of butyrate is taken up by epithelial tissues of the
gastrointestinal tract and by the liver, trace amounts can enter the general blood circulation
(Bergman, 1990). Nearly all tissues of the body have the ability to metabolize butyrate, where is
rapidly oxidized or used in lipogenesis, and ruminants and non-ruminants share similar pathways
of butyrate metabolism. Butyrate is also effectively removed by the mammary gland mainly for
milk fat synthesis (Annison et al., 1963). Butyrate is not only an energy source; it may also
regulate cell proliferation and differentiation, which in turn may contribute to prevention of
colorectal cancer and other diseases (Cook and Sellin, 1999; Wong et al., 2006).
Propionyl-CoA synthetase activity is high in the liver of rats as well as ruminants, and
greatly exceeds that of acetyl-CoA synthetase (Ash and Baird, 1973; Demigne et al., 1985). As a
result, most of the propionate is removed from the portal blood by the liver. The usual pathway
17
for propionate metabolism thus is to enter the tricarboxylic acid (TCA) cycle as oxaloacetate,
and, in liver, large amounts are converted to glucose (Fig. 1.2; Bergman, 1990). Propionate is the
only VFA that can be a major source of glucose. Acetate, butyrate, or longer chain VFA with
even numbers of carbon atoms cannot contribute to a net synthesis of carbohydrate. This is
because the only pathway for these VFA to be converted to glucose is through acetyl-CoA and
the TCA cycle. When an acetyl-CoA molecule enters the cycle, two carbon atoms are lost as
CO2, no net gain of oxaloacetate occurs, and a net synthesis of glucose is impossible (Bergman,
1990). The glucogenicity of propionate in nonruminant animals is less clear. One study in ponies
using the isotope dilution principle and transfer quotient calculation concluded that
approximately 7% of the total glucose production was derived from propionate produced in the
cecum (Gibson et al., 1976), but further studies in other species need to be made, in spite that
non-ruminants obtain far more glucose from simple sugars in the digestive tract than ruminants
do, and thus do not need to rely on gluconeogenesis from dietary fiber.
Most of the acetate is believed to be transported to the adipose tissue and skeletal muscle
where it is used in the synthesis of fatty acids or oxidized and used for synthesis of ATP (Elia
and Cummings, 2007). However, substantial use of acetate by the gut has been previously
reported in ruminants (Pethick et al., 1981), but is probably used mostly by smooth muscle in the
gut wall and adipose tissue in the omentum rather than by epithelial tissues (Bergman, 1990). In
ruminants, only the liver utilizes a small proportion of absorbed acetate, because acetyl-CoA
synthetase activity is low in the liver compared with adipose tissue or muscle, and similarly
lipogenesis is known to occur almost entirely in adipose tissue rather than in liver (Bergman,
1990).

18
The energy absorbed as VFA accounted for 67 to 74% of the total energy absorbed in the
hindgut of pigs fed high fiber diets (Anguita et al., 2006), and the energy from VFA provided 7.1
to 17.6% of the total available energy. In some cases up to 82% of the energy infused inside the
cecum as VFA was retained as body energy (Jørgensen et al., 1997).
The effects of VFA on metabolism of fatty acids and fat distribution are not fully
understood (Robertson, 2007), but it is suggested that VFA, and especially propionate, may
change adipose tissue lipolysis, change adipocyte size and differentiation, an change body fat
distribution. Especially, VFA appear to stimulate PPARϒ, acetyl-CoA carboxylase, and fatty
acid synthase (Lee and Hossner, 2002).
Effects of dietary fiber in the gastrointestinal tract
The solubility of dietary fiber has been thought to determine the effects of dietary fiber
on processes of digestion and absorption of nutrients. Soluble dietary fiber, for example, has
been associated with a reduction in absorption of nutrients from the small intestine through its
effect on luminal viscosity, which may reduce the rate of nutrient absorption (Rainbird et al.,
1984). In contrast non-viscous insoluble dietary fiber from wheat bran or cellulose affected
glucose absorption only partially (Low et al., 1986).
The effect of dietary fiber in the small intestine has been reported previously, and is
accepted that dietary fiber reduces the digestibility of dry matter and energy because of its
resistance to digestion with endogenous enzymes secreted into the small intestine (Bach Knudsen
and Hansen, 1991; Graham et al., 1986). The effect on dietary nutrients is, however, more
variable and influenced by the type of dietary fiber. Dierick et al. (1983) reported a reduction of
19
the digestibility of nitrogen and amino acids with pectin and sugar beet pulp, but the effect of
cellulose was marginal. In some cases, it has also been found that the cell wall encloses
intracellular protein and fat and prevents their digestion in the small intestine (Bach Knudsen et
al., 1993; Bach Knudsen, 2001). The intake of soluble or insoluble dietary fiber has also been
reported to have no effect on the digestibility of starch (Bach Knudsen, 2001).
The reported average digestibility of dietary fiber at the end of the ileum is 20% (Bach
Knudsen, 2001). However, the digestibility of dietary fiber at the end of the ileum is influence by
the type of dietary fiber. For example, results obtained with cereal diets show a higher
digestibility of soluble ß-glucans, with values in the range of 17 to 73% in oats (Bach Knudsen
and Hansen, 1991; Bach Knudsen et al., 1993) and 70 to 97% in barley (Fadel et al., 1988, 1989;
Graham, 1986; Bach Knudsen, 2001). In contrast, branched-chain arabinoxylans showed ileal
digestibilities ranging from 10 to 12% in wheat products (Bach Knudsen and Hansen, 1991).
The most important difference between fermentation in the small and large intestine of
pigs is the type of digestion and the retention time (Bach Knudsen, 2001). The transit time is
longer through the large intestine (20-40 h) than through the stomach and the small intestine
(Bach Knudsen, 2001). The most active fermentation compartments are the cecum and the
proximal colon, where most of the carbohydrates disappear (Bach Knudsen et al., 1993; Bach
Knudsen, 2001). The types of polysaccharides that reach the hindgut have significant
implications for the site of its degradation. The main NSP degraded in the cecum are soluble
NSP (ß-glucan, pectin, soluble arabinoxylans, etc; Bach Knudsen et al., 1993; Canibe and Bach
Knudsen, 1997). For other soluble NSP, the swelling and high water binding capacity results in
an increased surface area of the cell wall residues to the microflora, which facilitate colonization
and degradation of substrate (Bach Knudsen, 2001). In contrast, cellulose, arabinoxylans, and

20
xylans, when present in lignified tissues are more resistant to degradation in the large intestine
(Glitsø et al., 1999).
An increased intake of dietary fiber influence bowel movement, because of the
stimulation of microbial growth and VFA, but also because of mechanical action and water
holding properties (Bach Knudsen, 2001). The consequence is increased bulk in colon and feces
and a reduction of transit time (Glitsø et al., 1999). The effect of dietary fiber on transit time is
however associated with the type of dietary fiber being offered. Therefore, polysaccharides that
are almost completely degraded in the large intestine will only increase the fecal dry mass due to
microbial matter, while the increase will be much greater with more resistant fiber sources (Bach
Knudsen, 2001).
In conclusion, utilization of dietary fiber is an important issue in swine nutrition because
an increasing amount of high fiber ingredients are being fed to pigs. Current methods to measure
dietary fiber do not measure all components that are defined as dietary fiber, but procedures such
as TDF appear to be the most accurate available. Fermentation of fiber depends on factors
inherent to the diet and factors inherent to the pig. Soluble dietary fiber is much more
fermentable than insoluble dietary fiber, and the energy value of fiber in feed ingredients fed to
pigs increase with the concentration of soluble fiber.
21
LITERATURE CITED
AACC. 2001. The definition of Dietary Fiber. AACC Report. Cereal Foods World. 46:112-126.
AOAC International. 2007. Official methods of analysis of AOAC Int. 18th ed. Assoc. Off. Anal.
Chem. Int., Gaithersburg, MD.
Anguita, M., N. Canibe, J. F. Pérez, and B. B. Jensen. 2006. Influence of the amount of dietary
fiber on the available energy from hindgut fermentation in growing pigs: Use of
cannulated pigs and in vitro fermentation. J. Anim. Sci. 84:2766-2778.
Annison, E. F., R. A. Leng, D. B. Lindsay, and R. R. White. The metabolism of acetic acid,
propionic acid, and butyric acid in sheep. Biochem. J. 88:248-252.
Argenzio, R. A., J. E. Lowe, D. W. Pickard, and C. E. Stevens. 1974. Digesta passage and water
exchange in the equine large intestine. Am. J. Physiol. 226:1035.
Ash, R., and G. D. Baird. 1973. Activation of volatile fatty acids in bovine liver and rumen
epithelium. Evidence for control by auto-regulation. Biochem. J. 136:311-319.
Bach Knudsen, K. E., and I. Hansen. 1991. Gastrointestinal implications in pigs of wheat and oat
fractions 1. Digestibility and bulking properties of polysaccharides and other major
constituents. Br. J. Nutr. 65:217-232.
Bach Knudsen, K. E., B. B. Jensen, and I. Hansen. 1993. Digestion of polysaccharides and other
major components in the small and large intestine of pigs fed diets consisting of oat
fractions rich in ß-D-glucan. Br. J. Nutr. 70:537-556.
Bach Knudsen, K. E. 1997. Carbohydrate and lignin contents of plant materials used in animal
feeding. Anim. Feed Sci. Technol. 67:319-338.
Bach Knudsen, K. E. 2001. The nutritional significance of “dietary fibre” analysis. Anim. Feed
Sci. Technol. 90:3-20.

22
Bach Knudsen, K. E., M. S. Hedemann, and H. N. Laerke. 2012. The role of carbohydrates in
intestinal health of pigs. Anim. Feed. Sci. Technol. 173:41-53.
Bacic, A., P. J. Harris, and B. A. Stone. 1998. Structure and function of plant cell walls.
Biochem. Plants 14:297-371.
Bergman, E. N. 1990. Energy contributions of volatile fatty acids from the gastrointestinal tract
in various species. Physiol. Rev. 70:(2)567-590.
Black, J. L. 1995. Modelling energy metabolism in the pig – critical evaluation of a simple
reference model. Pages 87-102 in Modelling Growth in the Pig. P. J. Moughan, M. W. A.
Verstegen, and M. I. Visser-Reynevel, ed. Wageningen Press, Wageningen, The
Netherlands.
Canibe, N., and K. E. Bach Knudsen. 1997. Apparent digestibility of non-starch polysaccharides
and short-chain fatty acids production in the large intestine of pigs fed dried or toasted
peas. Acta Agric. Scand. 47:106-116.
Carpenter, K. J. 2003. A short story of nutritional science: Part 4 (1945-1985). J. Nutr. 133:3331-
3342.
Cervantes-Pahm, S. F. 2011. In vivo and in vitro disappearance of energy and nutrients in novel
carbohydrates and cereal grains by pigs. PhD Dissertation. University of Illinois, Urbana,
Il, USA.
Cho, S., J. W. de Vries, and L. Prosky. 1997. Dietary fiber analysis and applications. AOAC
International, Gaithersburg, MD.
Cummings, J. H., and A. M. Stephen. 2007. Carbohydrate terminology and classification. Eur. J.
Clin. Nutr. 61(Suppl. 1):S5-S18.

23
de Lange, C. F. M. 2008. Efficiency of utilization of energy from protein and fiber in the pig – A
case for NE systems. Pages 58-72 in Proc. Swine Nutr. Conf. Indianapolis, IN.
de Vries, J. W. 2004. Dietary Fiber: The Influence of Definition and Analysis and Regulation. J
AOAC Int. 87:682-706.
de Vries, S. 2014. Fiber fermentation in pigs and poultry. PhD. Thesis. Wageningen University.
Wageningen. Nl.
Demigne, C., C. Yacoub, C. Remesy, and P. Fafournoux. 1986. Propionate and butyrate
metabolism in rat or sheep hepatocytes. Biochem. Biophys. Acta 875:535-542.
Dierick, N., I. Vervaeke, J. Decuypere, H. K. Hendericks. 1983. Effects of the nature and level of
crude fibre on apparent ileal and faecal digestibility of dry matter, protein and amino
acids on nitrogen retention in pigs. Revue de lAgriculture. 36:1691-1712.
Dikeman, C. L., and G. C. Fahey Jr. 2006. Viscosity as related to dietary fiber. A review. Crit.
Rev. Food Sci. Nutr. 45:649-663.
Elia, M., and J. H. Cummings. 2007. Physiological aspects of energy metabolism and
gastrointestinal effects of carbohydrates. Eur. J. Clin. Nutr. 61(Suppl 1):S40-S74.
Fadel, J. G., C. W. Newman, R. K. Newman, and H. Graham. 1988. Effects of extrusion cooking
of barley on ileal and fecal digestibilities of dietary components in pigs. Can. J. Anim.
Sci. 68:891-897.
Fadel, J. G., R. K. Newman, C. W. Newman, and H. Graham. 1989. Effects of baking hulless
barley on the digestibility of dietary components as measured at the ileum and in feces in
pigs. J. Nutr. 119:722-726.
Food and Nutrition Board-IOM. 2001. Pages 1- 64 in Dietary Reference Intakes: Proposed
Definition of Dietary Fiber. National Academy Press, Washington DC.

24
Fleming, S. E., and D. S. Arce. 1986. Volatile fatty acids: their production, absorption,
utilization, and roles in human health. Clin. Gastroenterol. 15:787-814.
Gallager, D. D. 2006. Dietary fiber. Pages 102-110 in Present Knowledge in Nutrition. ILSI.
Press. Washington, D. C.
Gibson, J. A., G. E. Sladen, and A. M. Dawson. 1976. Protein absorption and ammonia
production: the effects of dietary protein and removal from the colon. Br. J. Nutr. 35:61-
65.
Glitsø, L. V., H. Gruppen, H. A. Schols, S. Højsgaard, B. Sandstrøm, and K. E. Bach Knudsen.
1999. Degradation of rye arabinoxylans in the large intestine of pigs. J. Sci. Food Agric.
79:961-969.
Graham, H., K. Hesselman, and P. Åman. 1986. The influence of wheat bran and sugar-beet pulp
on the digestibility of dietary components in a cereal-based pig diet. J. Nutr. 116:242-
251.
Grieshop, C. M., D. E. Reese, and G. C. Fahey Jr. 2001. Non-starch polysaccharides and
oligosaccharides in swine nutrition. Pages 107-130 in Swine Nutrition. Lewis, A. J. and
L. L. Southern ed. CRC Press, Boca Raton, FL.
Guillon, F., L. Saulnier, P. Robert, J. F. Thibault, and M. Champ. 2006. Chemical structure and
function of cell wall through cereal grains and vegetable samples. Pages 31-64 in Dietary
Fibre Components and Functions. Salovaara H., F. Gates, and M. Tenkanen ed.
Wageningen Academic Publishers, Wageningen, The Netherlands.
Gutierrez, N. A., N. V. L. Serao, B. J. Kerr, R. T. Zijlstra, and J. F. Patience. 2014. Relationships
among dietary fiber components and the digestibility of energy, dietary fiber, and amino

25
acids and energy content of nine corn coproducts fed to growing pigs. J. Anim. Sci.
92:4505-4517.
Hipsley, E. H., 1953. Dietary “fibre” and pregnancy toxaemia. Br. Med. J. 2, 420-422.
IOM. 2006. Pages 340-421 in Dietary Reference Intakes: Dietary, Functional, and Total Dietary
Fiber. National Academies Press, Washington, D. C.
Imoto, S., and S. Namioka. 1978. Volatile fatty acid production in the pig large intestine. J.
Anim. Sci. 47:467-478.
Jaworski, N. 2012. Carbohydrate composition, in vitro digestion, and effects of xylanase and
phytase on nutrient and energy digestibility by pigs in grains and grain coproducts. M.S.
Thesis. Univ. of Illinois, Urbana-Champaign, IL.
Jørgensen, H., T. Larsen, X. Q. Zhao, and B. O. Eggum. 1997. The energy value of short-chain
fatty acids infused into the cecum of pigs. Br. J. Nutr. 77:745-756.
Johnston, L. J., S. Noll, A. Renteria, and G. C. Shurson. 2003. Feeding by-products high in
concentration of fiber to nonruminants, in Third National Symposium on Alternative
Feeds for Livestock and Poultry, Kansas City, MO.
Kritchevsky, D. 1988. Dietary fiber. Ann. Rev. Nutr. 8:301-328.
Lee, S. H., and K. L. Hossner. 2002. Coordinate regulation of the adipose tissue gene expression
by propionate. J. Anim. Sci. 80:2840-2849.
Liyama, K., T. B. Lam, and B. A. Stone. 1994. Covalent cros-links in cell wall. Plant Physiol.
104:315-320.
Low, A. G., T. Zebrowska, L. M. Heppell, and H. A. Smith. 1986. Influence of wheat bran,
cellulose, pectin, and low and high viscosity guar gum or glucose and water absorption
from pig jejunum. Proc. Nutr. Soc. 455, 55A.

26
Marsono Y., R. J. Illman, J. M. Clarke, R. P. Trimble, D. L. Topping. 1993. Plasma lipids and
large bowel volatile fatty acids in pigs fed white rice, brown rice, and rice bran. Br. J.
Nutr. 70:503-513.
McBurney, M. I., and W. C. Sauer. 1993. Fiber and large bowel energy absorption: Validation of
the integrated ileostomy-fermentation model using pigs. J. Nutr. 123:721-727.
McDougall, G. J., I. M. Morrison, D. Stewart, J. R. Hillman. 1996. Plant cell walls as dietary
fiber: range, structure, processing and function. J. Sci. Food Agric. 70:133-150.
Mertens, D. R. 2003. Challenges in measuring insoluble dietary fiber. J. Anim. Sci. 81:3233-
3249.
Miller, T. L., and M. J. Wolin. 1979. Fermentations by saccharolytic intestinal bacteria. Am. J.
Clin. Nutr. 32:164-172.
Morris, E. R. 1992. Physico-chemical properties of food polysaccharides. Page 41-55 in Dietary
fibre: a component of food: nutritional function in health and disease. T. F. Schweizer
and C. A. Edwards, ed. Springer, London, UK.
Müller, V. 2008. Bacterial fermentation In: Encyclopedia of Live Sciences. John Wiley & Sons,
Ltd: Chichester. Available: http://els.net/ [DOI:10.1002/9780470015902.a0001415.pub2]
Nelson D. L., and M. M. Cox. 2008. Carbohydrates and glycobiology. Pages 235-241 in
Lehninger Principles of Biochemistry 5th Ed. W. H. Freeman, New York, NY.
NRC. 2012. Nutrient Requirements of Swine. 11th rev. ed. Natl. Acad. Press, Washington, DC.
Nyman, E. M. G-L. 2003. Importance of processing for physico-chemical and physiological
properties of dietary fiber. Proc. Nutr. Soc. 62:187-192.
Oakenfull, D. 2001. Physical chemistry of dietary fiber. Page 33-47 in Dietary Fiber in Human
Nutrition. 3rd ed. G. A. Spiller, ed. CRC Press, Boca Raton, FL.

27
Pethick, D. W., D. B. Lindsay, P. J. Barker, and A. J. Northrop. Acetate supply and utilization by
the tissues of the sheep. Br. J. Nutr. 46:97-110.
Prosky, L., N. G. Asp, I. Furda, J. W. DeVries, T. F. Schweizer, and B. F. Harland. 1985.
Determination of total dietary fiber in foods and food products: collaborative study. J.
AOAC 68, 677-679.
Rainbird, A. L., A. G. Low, T. Zebrowska. 1984. Effect of guar gum on glucose and water
absorption from isolated loops of jejunum in conscious growing pigs. Br. J. Nutr. 52:489-
498.
Remesy, C., and C. Demigne. 1976. Partition and absorption of volatile fatty acids in the
alimentary canal of the rat. Ann. Rech. Vet. 7:39-55.
Robertson, M. D. 2007. Metabolic cross talk between the colon and the periphery: Implications
for insulin sensitivity. Proc. Nutr. Soc. 66:351-361.
Selvendran, R. R. 1984. The plant cell wall as a source of dietary fibre: chemistry and structure.
Am. J. Clin. Nutr. 39:320-337.
Serena, A., and K. E. Bach Knudsen. 2007. Chemical and physicochemical characterization of
co-products from the vegetable food and agroindustries. Anim. Feed Sci. Technol.
139:109-124.
Serena, A., H. Jørgensen, and K. E. Bach Knudsen. 2008. Absorption of carbohydrate derived
nutrients in sows as influenced by types and contents of dietary fiber. J. Anim. Sci.
87:136-147.
Shurson, G. C., Zijlstra, R. T., Kerr, B. J. and Stein, H. H. 2012. Feeding biofuels co-products to
pigs. In: Makkar, H. P. H. (ed.) Biofuel co-products as livestock feed – Opportunities and
challenges. p. 175-207.

28
Stein, H. H., and G. C. Shurson. 2009. BOARD-INVITED REVIEW: The use and application of
distillers dried grains with solubles in swine diets. J. Anim. Sci. 87:1292-1303.
Theander, O., P. Åman, E. Westerlund, H. Graham. 1989. Plant cell walls and monogastrics
diets. Anim. Feed Sci. Technol. 23, 205-225.
Theander, O., P. Åman, E. Westerlund, and H. Graham. 1994. Enzymatic/chemical analysis of
dietary fiber. J. AOAC Inter. 77:703-709.
Thibault, J. F., M. Lahaye, and F. Guillon. 1992. Physico-chemical properties of food plant cell
walls. Page 21-39 in Dietary fibre: A Component of Food: Nutritional Function in Health
and Disease. Schweizer, T. F., and C. A. Edwards, ed. Springer, London, UK.
Trowell, H. 1974. Definition of fibre. Lancet 503.
Trowell, H. 1976. Definition of dietary fiber and hypotheses that it is a protective factor in
certain diseases. Am. J. Clin. Nutr. 29:417-427.
Trowell, H., D. A. T. Southgate, T. M. S. Wolever, A. R. Leeds, M. A. Gassull, D. J. A. Jenkins.
1976. Dietary fibre redefined. Lancet 967.
Urriola, P. E., G. C. Shurson, and H. H. Stein. 2010. Digestibility of dietary fiber in distillers
coproducts fed to growing pigs. J. Anim. Sci. 88:2373-2381.
Urriola, P. E. 2010. Digestibility of dietary fiber by growing pigs. 2010. PhD Dissertation.
University of Illinois, Urbana, Il, USA.
Van Soest, P. J., J. B. Robertson, and B. A. Lewis. 1991. Symposium: Carbohydrate
methodology, metabolism, and nutritional implications in dairy cattle. Methods for
dietary fiber, neutral dietary fiber, and nonstarch polysaccharides in relation to animal
nutrition. J. Dairy Sci. 74:3583-3597.

29
Vestergaard, E. M. 1997. The effect of dietary fiber on welfare and productivity of sows. PhD
Thesis. The Royal Veterinary and Agricultural University, Copenhagen, DK.
White, D. 2000. The physiology and biochemistry of prokaryotes. 2nd ed Oxford University
Press. New York, NY.
Wong, J. M., R. de Souza, C. W. Kendall, A. Emam, and D. J. Jenkins. 2006. Colonic health:
fermentation and short chain fatty acids. J. Clin. Gastroenterol. 40:235-243.

30
Table 1.1. Volatile fatty acids molar proportions and concentrations in digestive tract and blood
of different mammalian species
Molar Proportions of VFA, % Total VFA, mM Acetic Propionic Butyric Sheep rumen 106 68 19 13
Portal vein 1.60 86 12 2 Hepatic vein 1.39 98 1.4 0.4 Artery 0.77 98 1.5 0.5
Rabbit cecum 74 73 9 18 Portal vein 5.31 74 10 16 Hepatic vein 2.51 91 4 5 Artery 1.77 88 6 6
Pig colon 210 55 34 11 Portal vein 0.75 63 29 8 Artery 0.17 90 6 4
Human colon 124 60 19 21 Portal vein 0.36 69 23 8 Hepatic vein 0.15 78 14 8 Arm vein 0.08 89 6 5
Human portal vein 0.16 73 20 7 Arm vein 0.04 89 5 6 Bergman (1990)
31
Fig. 1.1 Example of cell wall materials from oats; Bach Knudsen (2001)

32
Fig. 1.2 Major pathway for propionate metabolism in liver; Bergman (1990)

33
CHAPTER 2: EFFECT OF INSOLUBLE-LOW FERMENTABLE FIBER FROM CORN-
ETHANOL DISTILLATION ORIGIN ON ENERGY, FIBER, AND AMINO ACID
DIGESTIBILITY, HINDGUT DEGRADABILITY OF FIBER, AND GROWTH
PERFORMANCE OF PIGS1
A paper published in 2013 in the Journal of Animal Science
J. Anim. Sci. 2013.91:5314–5325
doi:10.2527/jas2013-6328
N. Gutierrez, * B. J. Kerr,† and J. F. Patience*2
*Department of Animal Science, Iowa State University, Ames 50011; †USDA-ARS-National
Laboratory for Agricultural and the Environment, Ames, IA 50011
______________________
1Financial support for this research was provided by the National Pork Board (Des
Moines, IA) and Dakota Gold Research Foundation (Sioux Falls, SD). Mention of a trade name,
proprietary product, or specific equipment does not constitute a guarantee or warranty by Iowa
State University or the USDA and does not imply approval to the exclusion of other products
that may be suitable. The USDA is an equal opportunity provider and employer.
2Corresponding author: [email protected]

34
ABSTRACT
Extensive use of corn co-products in swine diets increases the concentration of dietary fiber,
raising concerns on energy and nutrient digestibility and, ultimately, pig performance. A
digestion trial was conducted to determine the effect of increasing levels of insoluble-low
fermentable fiber from corn in the diet, using corn bran with solubles from the corn-ethanol
distillation industry (CB-S), on digestibility of energy, fiber, and AA, and hindgut fermentation
of fiber in diets fed to growing pigs. Fifteen growing pigs (BW = 28.7 kg) arranged in a 3-period
incomplete block design, and fitted with a T-cannula in the distal ileum, were provided 5 diets (n
= 9) containing either a corn-casein basal or the basal diet with 10, 20, 30, or 40% CB-S. Fecal
and ileal digesta samples were collected. Two subsequent 28-d growth trials determined the
effects of increasing dietary fiber from CB-S in 2 sets of 7 diets formulated either with declining
(growing phase: 2,387 to 2,133 kcal NE/kg; finishing phase: 2,499 to 2,209 kcal NE/kg) or
constant dietary NE (growing phase: approximately 2,390 kcal NE/kg; finishing phase:
approximately 2,500 kcal NE/kg), on growth performance and apparent total tract digestibility
(ATTD) of energy in 70 growing (BW = 48.9 kg; n = 10) and 70 finishing (BW = 102.0 kg; n =
10) pigs. Results indicated that increasing fiber from corn lowered (P < 0.01) the apparent ileal
digestibility (AID) of GE, DM, CP, and all indispensable amino acids except Arg, but not NDF
or total dietary fiber (TDF). Increased fiber from corn also reduced ATTD of GE, DM, CP,
NDF, and TDF (P < 0.01). Increasing fiber with declining diet NE lowered BW, ADG, and G:F
(P < 0.05) in growing and in finishing pigs. When NE was held constant, as fiber increased, BW
and ADG were unaffected in growing and finishing pigs, and G:F was unaffected in finishing
pigs but improved in growing pigs (P < 0.05) with increasing dietary fiber. In both growing and
finishing pigs, ADFI was unaffected by the increased fiber from corn, regardless of the NE
35
content of diets. In conclusion, the dietary level of insoluble-low fermentable dietary fiber from
corn origin decreased the digestibility of dietary AA, and the ability of the growing pig to
ferment corn dietary fiber. In spite of the reduction in digestibility of energy and nutrients with
insoluble-low fermentable fiber level from corn, growth performance was not impaired when the
energy supply is adequately balanced in the diet using the NE system.
Key words: amino acids, digestibility, energy, fiber, hindgut fermentation, pig
INTRODUCTION
Corn and its co-products are used extensively in swine diets because of their availability,
cost, and nutrient composition. The inclusion of corn distillers dried grains with solubles
(DDGS) increases the concentration of dietary fiber in corn-soybean diets as a result of its high
fiber content (NRC, 2012). Fiber in corn and its co-products is largely insoluble because of its
content of arabinoxylans, cellulose, and lignin, and is mostly resistant to hindgut fermentation
(Bach Knudsen, 1997; Choct, 2002). Addition of insoluble fiber to swine diets may also decrease
the digestibility of dietary energy, Lys, and fiber (Noblet and Le Goff, 2001; Urriola and Stein,
2010). The inclusion of corn DDGS in commercial swine diets has been reported to decrease
ADG and ADFI, although this may be a reflection of an incorrect nutrient profile used in diet
formulation (Whitney et al., 2006; Linneen et al., 2008).
The apparent ileal digestibility (AID) and apparent total tract digestibility (ATTD) of
fiber is, however, different among sources of corn DDGS (Urriola et al., 2010), which may
contribute to differences in digestibility of energy in DDGS and subsequently in diets containing
DDGS. Corn bran with solubles (CB-S), obtained after adding solubles remaining from the corn-

36
ethanol distillation process to corn bran, is a good research model to evaluate the effects of corn
fiber in swine diets because it has a lower concentration of starch and a greater concentration of
fat and fiber than in whole corn grain (Bach Knudsen, 1997). The first objective of this study
was to test the hypothesis that inclusion of insoluble-low fermentable fiber from corn decreases
the digestibility of energy, fiber, and AA, and reduces the hindgut fermentation of fiber in
growing pigs. A second objective was to test the hypothesis that the increase of dietary fiber
from corn, in diets with declining or constant NE, reduces growth performance and ATTD of
energy in growing and finishing pigs.
MATERIALS AND METHODS
The experimental protocols for the digestion and growth trials were reviewed and
approved by the Institutional Animal Care and Use Committee of Iowa State University.
Digestion Trial
Fifteen growing barrows (progeny of 337 sires × C-22 dams; PIC, Hendersonville, TN)
were housed in individual pens of 1.2 × 1.2 m equipped with a feeder, a cup waterer, and a half
concrete slatted floor surface in an environmentally controlled building. All pigs were surgically
fitted with a T-cannula in the distal ileum following procedures described by Stein et al. (1998).
Pigs were allowed to recover from surgery for 7 d and fed a standard corn-soybean meal diet ad
libitum.
Dietary treatments included a corn-casein basal diet that was formulated to meet the
nutrient requirements of growing pigs, as recommended by the NRC (1998). Four additional
dietary treatments were obtained by replacing the basal diet with CB-S (Table 2.1) in 4 equally

37
spaced steps: 10, 20, 30, and 40% (Table 2.2). Because of the high total dietary fiber (TDF)
concentration in CB-S, the resulting TDF content of dietary treatments was 7.3, 8.7, 9.1, 11.4,
and 14.7% (as-fed basis). Corn or CB-S were the only sources of dietary fiber, and standardized
ileal digestible (SID) Lys:ME was maintained at 2.6 g/Mcal ME across treatments. Diets also
contained TiO2 at 0.45% (as-fed basis) as an inert marker. The portion of the diet including
limestone, monocalcium phosphate, L-Trp, TiO2, vitamin and trace mineral premixes, and zinc
sulfate, and NaCl was maintained constant (3.8%) across all experimental diets.
After recovery from surgery, pigs were weighed (initial BW = 28.7 ± 2.1 kg) and
randomly allotted to 5 dietary treatment groups in a 3-period incomplete block design, totaling 9
experimental units per treatment. Pigs did not repeat dietary treatments across periods. Each
collection period involved 9 d adaptation to dietary treatments followed by 2 d of feces sub-
sample collection and 3 d of ileal digesta sub-sample collection.
All pigs received the same daily amount of feed, which was provided at a level of
approximately 90% of predicted ad libitum intake of the basal diet. Ad libitum intake was
calculated as: DE intake (kcal/d) = 13.162 x (1-e-0.0176BW), where BW was average BW (NRC,
1998).
To convert ad libitum DE intake to ME units, the efficiency of utilization of dietary DE
for ME was assumed to be 0.96 (Noblet et. al., 1994) with the ME of the basal diet estimated to
be 3,411 kcal/kg. Feed intake was then adjusted to 90% of this predicted value, and all pigs were
offered the same daily amount. During the trial, the daily feed allowance was divided into 2
equal meals provided at 0700 and 1600 h. At the end of each collection period, all animals were
weighed and daily feed allowance was adjusted.

38
After 9 d adaptation to the diet, feces were collected via grab sampling on d 10 and 11
and stored at -20°C. On d 12, 13, and 14, ileal digesta samples were collected for 8 h and stored
following the procedures for collection and storage of ileal digesta reported by Cervantes-Pahm
and Stein (2008).
At the conclusion of each experimental period, frozen ileal and fecal samples were
allowed to thaw at room temperature and pooled within animal, with a sub-sample collected for
chemical analysis. Ileal sub-samples were lyophilized prior to chemical analysis. Fecal sub-
samples were oven dried in a convection oven at 65°C to constant weight (Jacobs et al., 2011).
After drying, ileal and fecal sub-samples were ground through a 1-mm screen prior to chemical
analysis.
Samples of CB-S, diets, ileal digesta, and feces were analyzed for DM (Method 930.15;
AOAC Int., 2007), ether extract (EE; Method 920.39; AOAC Int., 2007), starch (ST; Method
996.11; AOAC Int., 2007), ADF (Goering and Van Soest, 1970), NDF (van Soest et al., 1979),
TDF (Method 985.29; AOAC Int., 2007), and N (Method 968.06; AOAC Int., 1990). Crude
protein was calculated as N × 6.25 and Gly was used as the standard for calibration. Samples
were also analyzed for GE by bomb calorimetry (Parr 6200 calorimeter, Parr Instruments Co.,
Moline, IL) and benzoic acid was used as the standard for calibration. Samples of CB-S, diets,
feed ingredients, and ileal digesta were analyzed for AA with an AA analyzer (Model No.
L8800; Hitachi High Technologies America Inc., Pleasanton, CA) using ninhydrin for
postcolumn derivatization and norleucine as the internal standard. Before analysis, samples were
hydrolyzed with 6 N HCl for 24 h at 110°C [Method 982.30 E(a); AOAC Int., 2007]. Methionine
and Cys were determined as Met sulfone and cysteic acid after cold performic acid oxidation
overnight before hydrolysis [Method 982.30 E(c); AOAC Int., 2007]. Tryptophan was

39
determined after NaOH hydrolysis for 22 h at 110°C [Method 982.30 E(c); AOAC Int., 2007].
Titanium dioxide concentrations of diets, ileal digesta, and fecal sub-samples were determined
according to the procedure of Leone (1973).
For each dietary treatment, the AID of GE, DM, N, AA, NDF, and TDF were calculated
following the procedures outlined by Stein et al. (2007). The ATTD of GE, DM, NDF, and TDF
in each diet were calculated following the procedures of Oresanya et al. (2008). The amount of
dietary components reaching the terminal ileum and excreted in feces were calculated relative to
the indigestible marker (TiO2) as described by Urriola and Stein (2010). The net disappearance
of DM, N, NDF, and TDF in the hindgut was calculated by subtracting the amount (g) of ileal
digested dietary component from the amount (g) of total tract digested dietary component.
Fermentation of energy was calculated by subtracting the amount (kcal) of ileal digested energy
from the amount (kcal) of total tract digested energy (Högberg and Lindberg, 2004).
Growth Trials
In two subsequent trials, in both the growing and the finishing phases, 35 barrows and 35
gilts (337 sires × C-22 dams; PIC) were housed individually in pens of 1.2 × 1.2 m equipped
with a feeder, a cup waterer, and half concrete slatted floor surface. The average initial BW was
31.2 ± 1.4 kg for growing and 85.4 ± 4.7 kg for finishing pigs.
In each growth phase, pigs were allotted based on BW to 7 dietary treatments with 10
experimental units per treatment. In the 2 growth phases, treatments included a basal corn-
soybean meal diet, formulated to meet all nutrient requirements as recommended by the NRC
(1998), and 6 experimental diets formulated with 3 levels of added CB-S (7.5, 15, and 22.5%
CB-S for growing pigs or 8, 16, and 24% CB-S for finishing pigs) with added soybean oil (SBO;
40
2, 4, or 6%) or without added SBO, to create a set of treatments with a constant NE and another
set of treatments with a declining NE as CB-S increased (Tables 2.3 and 2.4). The maximum
dietary inclusion level of CB-S was selected to maintain constant NE with a maximum of 6%
added fat. After establishing upper added CB-S and fat levels, equally spaced intermediate levels
were selected for both. The CB-S used to increase the dietary fiber level came from the same
batch as in the digestion trial. Net energy for diets were calculated based on ingredient
composition libraries (Sauvant et al., 2004). Constant SID Lys:NE ratios (3.85 and 2.33 g/Mcal
NE for growing and finishing pigs, respectively) were maintained across treatments. Diets were
formulated to contain TiO2 as an inert marker at 0.40% (as-fed basis). Pigs had free access to
feed and water, and individual BW and ADFI were recorded weekly for a period of 28 d.
Individual fecal samples were collected weekly by grab sampling and stored at -20°C.
Pens were scraped clean prior to collection. Feed samples were also collected weekly and stored
at -20°C. At the conclusion of the experiment, fecal samples were allowed to thaw at room
temperature and pooled within animal with a sub-sample collected for chemical analysis. Fecal
sub-samples were then oven dried in a convection oven at 65°C to constant weight. After drying,
fecal sub-samples were ground through a 1-mm screen prior to chemical analysis. Diets and fecal
sub-samples were subsequently analyzed for GE, DM, N, and TiO2 according to procedures
described previously. Samples of diets were also analyzed for EE, ST, ADF, NDF, and TDF
according to procedures described previously.
For the growing and the finishing phase, ADG, ADFI, and G:F were calculated, and the
ATTD of energy, DM, and N of each dietary treatment were determined following the
procedures outlined by Oresanya et al. (2008). The NE content of diets was estimated using the
following equation:

41
NE (kcal/kg DM) = 0.7 × DE + 1.61 × EE + 0.48 × ST – 0.91 × CP – 0.87 × ADF
where DE was the measured DE content of the diet (kcal/kg DM), and values of EE, ST, CP, and
ADF are expressed as grams per kilogram of DM (Noblet et al., 1994).
Statistical Analyses
For the digestion and growth trials, normality and independence of the error were verified
using the UNIVARIATE procedure of SAS (SAS Inst. Inc., Cary, NC). Homogeneity of the
error was verified using the Levene’s test of the GLM procedure. In the MIXED procedure, the
repeated statement with the group option was used for a model with unequal variances. Outliers
were identified using the boxplot of the UNIVARIATE procedure, and an observation was
considered to be an outlier if the observed value was greater than 3 inter quartile range away
from the error mean. All data were analyzed using the MIXED procedure of SAS with the
individual pig as the experimental unit.
In the digestion trial, dietary treatment was considered a fixed effect. Period and pig were
included in the model as random effects. Linear and quadratic effects of dietary treatments were
determined. In the growth trials, the set of treatments with the constant NE were analyzed
separate from the set of treatments with the declining NE. A repeated measures model with
dietary treatment as fixed effect was used. The interaction of sex and dietary treatment was not
significant and was excluded from the model. Block and sex were included in the model as
random effects, and initial BW as a covariate. Differences among treatments were determined
using ANOVA, and means were separated using the LS means statement and the PDIFF option
with adjustment for the Tukey-Kramer test. An α-value of 0.05 was used to assess significance
among treatment means.

42
RESULTS
Digestion Trial
All pigs were successfully cannulated at the distal ileum and recovered from surgery
without complications. The NDF and TDF content of the CB-S used in this study was 22.74 and
25.15%, respectively. The addition of CB-S increased the dietary content of NDF and TDF from
6.76 to 14.01% and 7.27 to 14.73%, respectively (Table 2.2). Although dietary GE increased, the
calculated ME and NE decreased across diets with CB-S inclusion.
With the exception of Arg, which showed a quadratic decrease (P = 0.03), the AID of all
other indispensable AA decreased linearly (P < 0.001) as CB-S increased from 0 to 40% in the
diet (Table 2.5). Similarly, a decrease in AID of dispensable Asp, Glu, and Tyr (linear, P < 0.01)
was observed. A trend for a quadratic decrease in the AID of His (P = 0.07), Gly (P = 0.06), and
Pro (P = 0.08) was also observed. The mean AID of indispensable AA decreased (linear, P <
0.01) while the mean AID of dispensable AA showed a tendency to decrease (quadratic, P =
0.06) as dietary fiber increased.
Results showed that the AID and ATTD of GE, DM, and CP decreased (linear, P < 0.01)
as dietary fiber level increased (Table 2.6). The AID of NDF and TDF was not affected but the
ATTD digestibility of NDF and TDF declined (linear, P < 0.01), resulting in a linear decline (P
< 0.01) in hindgut fermentation of NDF (19.6, to 5.9%) and TDF (21.9 to 9.7%) as dietary fiber
content increased. Dietary fiber level, however, had no effect on hindgut fermentation of GE,
DM, and CP.

43
The amount of DM, CP, NDF, and TDF reaching the terminal ileum and at the fecal level
showed a linear increase (P < 0.01) in response to increased dietary fiber concentrations (Table
2.7). Similarly, the amount of GE at the terminal ileum (939 to 1,278 kcal/kg DMI) and at the
fecal level (645 to 1,061 kcal/kg DMI) increased (linear, P < 0.01) as the dietary inclusion of
fiber increased.
Growth Trials
In growing and finishing pigs, the dietary NDF and TDF content increased with the
addition of CB-S. The basal diet offered to growing and finishing pigs had less GE and EE than
diets containing CB-S, with GE and EE slightly increasing with the increasing inclusion of CB-
S. The calculated NE in the set of diets with no SBO added declined with inclusion of CB-S, but
the calculated NE content in the set of diets with SBO added remained constant as CB-S
inclusion increased in the diet (Tables 2.3, and 2.4).
In each growth phase, the ATTD of DM, CP, and GE of the diet decreased (linear, P <
0.01) in pigs fed treatments with both increasing levels of CB-S with or without constancy of NE
(Table 2.8). The measured DE content of the set of diets formulated for declining NE, however,
was not affected by CB-S inclusion in both growth phases, but there was a linear tendency to
decrease (P = 0.07) in the DE content of diets fed to finishing pigs. Additionally, the determined
NE content of these diets decreased linearly in the growing (2,382 to 2,317 kcal/kg; P < 0.01)
and the finishing (2,552 to 2,442 kcal/kg; P < 0.01) phase as CB-S was increased in the diets.
Conversely, in both growing and finishing pigs fed diets formulated for constant NE, a linear
increase (P < 0.01) in the dietary content of DE (3,055 to 3,391 kcal/kg in growing and 3,194 to
3,513 kcal/kg in finishing pigs) and NE (2,382 to 2,573 kcal/kg in growing and 2,552 to 2,672

44
kcal/kg in finishing) was observed when CB-S was increased in the diet. In finishing pigs, a
quadratic increase (P < 0.01) of DE and NE content was also observed as CB-S increased in diets
originally formulated for constant NE.
Growth performance results from growing and finishing pigs are presented in Table 2.9.
The set of diets formulated with declining NE, and fed to growing pigs showed a decrease in G:F
(P = 0.01) from 0.46 to 0.43, with a tendency to decrease BW (P = 0.10) and ADG (P = 0.06).
When declining NE diets were fed to finishing pigs, a decrease in BW (from 102.8 to 99.4 kg; P
= 0.03), ADG (from 1.02 to 0.84 kg; P = 0.01), and G:F (from 0.33 to 0.28; P < 0.01) was
observed. Average daily feed intake, daily DE intake, and daily NE intake were not affected by
CB-S inclusion level in diets formulated for declining NE and fed to growing and finishing pigs.
In growing and finishing pigs BW, ADG, ADFI, daily DE intake, and daily NE intake were not
affected 0.05) by CB-S level and constant NE. Gain to feed ratio, however, increased (P < 0.01)
in growing pigs from 0.46 to 0.49 with dietary CB-S level in diets formulated for constant NE,
but was not affected in finishing pigs.
DISCUSSION
Corn bran is composed mainly from the pericarp of the corn grain, which contains a
lower concentration of starch and a greater concentration of insoluble arabinoxylans, cellulose,
and lignin compared to whole corn grain (Bach Knudsen, 1997; Choct, 2002). The concentration
of NDF and TDF in corn bran is, therefore, greater than corn. Because solubles remaining from
the corn-ethanol distillation process were added to the corn bran, the EE content in CB-S is
approximately double, and the NDF or TDF content is half of previously reported values for corn
45
bran without solubles (Sauvant et al., 2004; Anderson et al., 2012). As a result of the addition of
solubles, the TDF content of CB-S is also lower than the TDF content of DDGS (Urriola et al.,
2010; Anderson et al., 2012). The source of CB-S used in this experiment was the same and had
similar chemical composition as reported previously (Anderson et al., 2012).
In the digestion and growth trials, the addition of CB-S to the basal diet resulted in an
increase of the dietary NDF and TDF content. In both experiments, the maximum dietary TDF
content reached with CB-S inclusion was, however, lower than the TDF content of a corn-
soybean meal diet containing 30% of DDGS and fed to growing pigs (Urriola et al., 2010;
Urriola and Stein, 2010). Most of the TDF in dietary treatments is insoluble because corn and
CB-S were the only source of dietary fiber in the digestion trial and the main source in the
growth trials, and the non-starch polysaccharides (NSP) of corn and its co-products have been
previously reported as insoluble (Bach Knudsen, 1997; Choct, 2002).
In the digestion trial, the observed increased amount of CP reaching the terminal ileum
and the reduced AID of CP and most AA, resulting from the dietary increase of insoluble fiber,
has been previously reported (Schultze et al., 1994; Noblet and Le Goff, 2001; Owusu-Asiedu et
al., 2006). Urriola and Stein (2010) observed a decrease in AID of Lys with 30% inclusion of
DDGS in a corn-soybean meal diet fed to growing pigs. The increase in CP reaching the terminal
ileum and reduction of AID of most AA may be the result of a combination of an increased
amount of endogenous N excretion, and a decreased absorption of endogenous and exogenous N
(Libao-Mercado et al., 2006).
Dietary fiber is considered an important contributor to the increase in the excretion and
loss of endogenous protein (Souffrant, 1991, 2001; Moughan, 2003). Endogenous losses of AA

46
can be classified into basal or minimum quantities of AA that are inevitably lost in all diets, and
specific losses influenced by diet ingredient composition (Leterme et al., 1996; Stein et al.,
2007). Low AID of some AA might reflect the effect of higher intestinal specific endogenous
losses, which can increase as insoluble dietary fiber increases in the diet. Langlois et al. (1987)
observed an increase in the secretion of pancreatic juice and protein after pigs were fed diets with
40% wheat bran, a source of insoluble fiber. An increased mucosa enzyme activity and mucin
content has also been observed in pigs fed diets with high insoluble fiber (Hedemann, et al.,
2006). Leterme et al. (2000) reported an increase of ileal endogenous N losses in piglets when
insoluble fiber from barley endosperm increased in the diet. The presence of insoluble fiber in
the diet has also been reported to impair the AID of N (Schulze et al., 1994). Huisman et al.
(1985) observed a decrease in AID of CP and most AA with the inclusion of insoluble dietary
fiber from straw meal. Drying and addition of solubles to corn bran may also reduce the AID of
Lys in CB-S. During DDGS production, the formation of biologically unavailable Maillard
reactions products from excessive heat, and the addition of solubles, have been previously
suggested to lower AID of Lys in DDGS (Pahm et al., 2008; Stein and Shurson, 2009).
Because fiber in corn and its co-products is mostly insoluble, and in the NDF analysis
soluble carbohydrates are not included, the expected values of NDF and TDF content of
ingredients and diets are relatively similar. In growing pigs, Urriola et al. (2010) reported a
strong relationship between the ATTD of TDF and of NDF in corn-soybean meal diets
containing 30% DDGS, a source of insoluble fiber. Corn and CB-S were the only source of fiber
in the dietary treatments, and a similar pattern for digestibility of NDF and TDF was, therefore,
expected. Results showed that insoluble fiber from corn and CB-S have no effect on the ileal
digestion of dietary fiber, which has also been demonstrated previously using different sources of

47
insoluble dietary fiber (Graham et al., 1986; Urriola and Stein, 2010). For all dietary treatments,
approximately 24 and 17% of the ingested NDF and TDF, respectively, was digested before the
end of the ileum. Schulze et al. (1994) observed that level of insoluble fiber did not affect ileal
digestibility of NDF, and 17% of ingested NDF from wheat bran was digested before the end of
the ileum. Similarly, the addition of wheat bran to a basal cereal-based diet did not affect the
AID of NSP, and approximately 11% of the NSP in the wheat bran containing diet were
fermented before reaching the hindgut (Graham et al., 1986). Fermentation of soluble and
insoluble dietary fiber in the small intestine has been previously reported by other researchers
(Jørgensen et al., 1996; Urriola et al., 2010; Urriola and Stein, 2010). Because pigs do not
possess the enzymes necessary to hydrolyze dietary fiber, microbial fermentation is responsible
for the disappearance of dietary fiber before the end of the ileum. Results from the digestion trial
indicated that ileal fermentation of dietary fiber was not affected by level of insoluble dietary
fiber, indicating that microbial fermentation before the end of the ileum was not affected by the
amount of substrate present. In contrast, the amount of soluble dietary fiber in the diet has been
reported to affect the degree of fermentation prior to the end of the ileum, and the importance
and extent of fermentation of dietary fiber in the small intestine is related directly to the
proportion of soluble dietary fiber (Graham et al., 1986).
In pigs, the largest portion of ingested dietary fiber is fermented by the microorganisms
of the hindgut (Noblet and Le Goff, 2001). The ATTD of NDF and TDF, however, decreased
with level of inclusion of insoluble dietary fiber from corn, which agrees with previous reports
that ATTD of NDF and TDF decreases after 30% DDGS is added to a basal corn-soybean meal
diet (Urriola and Stein, 2010). This observation may be attributed to a low ATTD of fiber in corn
bran, because fiber in corn is largely insoluble and composed of cellulose and arabinoxylans,

48
polysaccharides that are partially resistant to microbial degradation (Choct, 2002; Guillon et al.,
2007). The lower degradability of dietary fiber in the hindgut, as a consequence of level of
insoluble fiber in the diet, resulted in an increase in fecal output of dietary fiber. Digestibility in
the hindgut is a function of hydrolysis or fermentation and digesta transit time, and a rapid
passage of digesta may decrease the time that substrates are subjected to fermentation and
decrease degradability in the large intestine (Morel et al., 2006; Wilfart et al., 2007a). In growing
pigs, low digestibility of fiber seems mainly due to the high rate of passage when feeding fiber-
rich diets (Le Goff et al., 2002), but a decrease in the microbial capacity of the hindgut to
ferment the increased flow of ingested insoluble dietary fiber may have also contributed to this
effect.
The amount and the physicochemical composition of dietary fiber present in the diet may
also influence energy and nutrient digestion, and growth performance. The observed increase in
ileal and total tract amounts of GE and DM, and concomitant decrease in AID and ATTD, was a
direct result of gradually replacing highly digestible starch in the diet with low digestible
insoluble dietary fiber from CB-S. Energy digestibility has been previously reported to decrease
linearly with dietary NDF content (Noblet and Perez, 1993; Lindberg and Pedersen, 2003). In
growing pigs, each 1% increase in NDF content of the diet reduces the energy digestibility by
0.9% (Le Goff and Noblet, 2001). Similar effects on ileal and total tract digestibility of DM have
been previously reported after insoluble dietary fiber was included at the expense of a highly
digestible source of carbohydrates (Newton et al., 1983; Graham et al., 1986; Schulze et al.,
1994; Le Goff and Noblet, 2001; Wilfart et al., 2007b). Because fiber has an energy diluting
effect in the diet, the extent of the decline in dietary energy is such that fiber fermentation may
contribute little to the overall energy supply to the animal (Le Goff and Noblet, 2001; van

49
Milgen, 2006). Energy contribution from short chain fatty acids produced during fiber
fermentation in the gastrointestinal tract of the growing pig, however, maybe offset by an
increase in endogenous secretions, or by a reduction in the availability of other dietary nutrients,
so that the net contribution from fermentation of dietary fiber to the overall energy supply is
close to zero (Le Goff and Noblet, 2001; van Milgen, 2006). In diets containing CB-S or DDGS,
the high EE content of the feedstuff, may attenuate the negative effects on dietary energy supply
from dietary fiber content. This advantage may be lost when DDGS is manufactured with
reduced EE content because of better extraction of EE from the solubles, resulting in a more
concentrated fiber and lower NE content.
In the growth trials, calculated NE of diets during formulation of dietary treatments differ
from NE estimated from observed DE and dietary chemical composition (Noblet et al., 1994) in
growing and finishing pigs. This outcome may originate from the underestimation of the NE of
CB-S used for diet formulation, and obtained from feed composition libraries available (Sauvant
et al., 2004). Solubles added back to the corn bran are rich in EE, and may increase the NE
content of corn bran. The rich content of EE in CB-S resulted in the dietary increase of EE with
CB-S level, leading to an increase of observed NE with CB-S level. Dietary treatments intended
for constant NE, therefore, showed an increase (191 and 120 kcal/kg for growing and finishing
pigs, respectively) in the observed NE content, possibly from the underestimation of NE in CB-S
used during formulation.
Surprisingly, in growing and finishing pigs, ADFI was not affected by dietary treatments.
In pigs under thermo-neutral conditions, a decrease in energy density of the diet is commonly
associated with an increase in ADFI, to compensate for required energy intake to support
maintenance and growth (Henry, 1985). Energy density of the diet influences ADFI, but the

50
absence of this adjustment when dietary energy is diluted may be the consequence of physical
factors related to gut fill (Henry, 1985). Gut fill caused by excessive bulkiness of a high-fiber
diet may limit short-term response in feed intake when energy density is low, and in some
extreme cases, may exert a depressive effect in feed intake. During dietary energy dilution, the
ability of the pig to compensate for an increased feed intake may be enhanced, however, after a
period of adaptation to a high-fiber diet (Kyriazakis and Emmans, 1995). In both growth trials,
the underestimation of the NE content of CB-S during formulation of dietary treatments,
resulting in a greater than expected NE density in treatments with high amounts of CB-S, may
have explained the absence of differences in ADFI and average daily energy intake across
treatments, in both growing and finishing pigs.
A reduction in growth performance was expected in both growing and finishing pigs
because of a decreased availability of dietary energy and AA, resulting from the previously
reported negative effects of dietary fiber from corn on digestibility of energy and nutrients. In the
current experiment, decreased growth performance was observed in growing and finishing pigs
fed diets formulated for declining NE. In contrast, growth rate was maintained in growing and
finishing pigs fed diets formulated for constant NE, and in growing pigs actually improved feed
efficiency. Although observed NE increased in diets formulated to remain constant, in growing
and finishing pigs the NE intake of this set of diets was similar, which validates the original
intention of supplying the animal with equal amounts of usable energy, by applying the NE
system. Baird et al. (1975) reported that dietary fiber content has no effect on growth
performance, indicating the pig can tolerate quite a wide range of dietary fiber, provided dietary
energy density is adequate. Beaulieu et al. (2009) confirmed these findings. In pigs fed constant
NE diets, growth performance was maintained by an equal supply of NE from digestion and

51
absorption of starch and lipids (specially in the high-fiber diets), if availability of AA is not a
limiting factor. In pigs fed diets formulated for declining NE, on the other hand, the energy from
fermentation of dietary fiber did not compensate the decrease in energy supply from highly
available carbohydrates replaced by insoluble dietary fiber. Additionally, in diets formulated for
constant NE, dietary energy digestibility at the ileal level may have not been reduced by level of
dietary fiber. This is not uncommon and has been reported in previous experiments, which used
different sources of insoluble dietary fiber, where a minimal effect on ileal digestibility and
absorption of energy and nutrients was reported (Wang et al., 2002; Serena et al., 2008). The
greater content of EE in diets with constant NE may have also reduced digesta transit time and
may improve fiber degradation because high-fat digesta moves slower through the intestinal tract
(Cervantes-Pahm and Stein, 2008), exposing the fiber for microbial fermentation for a longer
period of time.
In conclusion, results of this research indicate that increasing the amounts of insoluble
and low fermentable fiber from corn reaching the hindgut may reduce the ability of growing pigs
to ferment the fiber component of the diet, and may also decrease the digestibility of dietary AA.
In addition, a balanced supply of highly available energy in the form of starch, specially lipids,
overcomes the detrimental effects of increased fiber from corn on growth performance. In spite
of the reduction in digestibility of energy and nutrients with insoluble and low fermentable fiber
level from corn, growth performance was not affected when energy was balanced in the diet.

52
LITERATURE CITED
Anderson, P. V., B. J. Kerr, T. E. Weber, C. J. Ziemer, and G. C. Shurson. 2012. Determination
and prediction of digestible and metabolizable energy from chemical analysis of corn
coproducts fed finishing pigs. J. Anim. Sci. 90:1242-1254.
AOAC. 1990. Official methods of analysis. 15th ed. Assoc. Off. Anal. Chem., Arlington, VA.
AOAC International. 2007. Official methods of analysis of AOAC Int. 18th ed. Assoc. Off. Anal.
Chem. Int., Gaithersburg, MD.
Baird, D. M., H. C. McCampbell, and J. R. Allison. 1975. Effects of levels of crude fiber, protein
and bulk in diets for finishing hogs. J. Anim. Sci. 41:1039-1047.
Bach Knudsen, K. E. 1997. Carbohydrate and lignin contents of plant materials used in animal
feeding. Anim. Feed Sci. Technol. 67:319-338.
Beaulieu, A. D., N. H. Williams, and J. F. Patience. 2009. Response to dietary digestible energy
concentration in growing pigs fed cereal-grain based diets. J. Anim. Sci. 87:965-976.
Cervantes-Pahm, S. K., and H. H. Stein. 2008. Effects of soybean oil and soybean protein
concentration on the concentration of digestible amino acids in soybean products fed to
growing pigs. J. Anim. Sci. 86:1841-1849.
Choct, M. 2002. Non-starch polysaccharides: effect on nutritive value. In: J. M. McNab and K.
N. Boorman, editors, Poultry feedstuffs: supply, composition, and nutritive value. Poult.
Sci. Symp. Series. Vol. 26. CABI Publishing, New York, NY. p. 221-235.
Graham, H., K. Hesselman, and P. Aman. 1986. The influence of wheat bran and sugar-beet pulp
on the digestibility of dietary component in a cereal-based pig diet. J. Nutr. 116:242-251.

53
Goering, H. K., and P. J. Van Soest. 1970. Forage fiber analyses (apparatus, reagents,
procedures, and some applications). In: Handbook No. 379. USDA-ARS, Washington,
DC.
Guillon, F., L. Saulnier, P. Robert, J. F. Thibault, and M. Champ. 2007. Chemical structure and
function of cell wall through cereal grains and vegetable samples. In: H. Salovaara, F.
Gates, and M. Tenkanen, editors, Dietary fibre components and functions. Wageningen
Academic Publishers, Wageningen, the Netherlands. p. 31-64.
Hedemann, M. S., M. Eskidsen, H. N. Lærke, C. Pedersen, J. E. Lindberg, P. Laurinen and K. E.
Bach Knudsen. 2006. Intestinal morphology and enzymatic activity in newly weaned pigs
fed contrasting fiber concentrations and fiber properties. J. Anim. Sci. 84:1375-1386.
Högberg, A., and J. Lindberg. 2004. Influence of cereal non-starch polysaccharides on digestion
site and gut environment in growing pigs. Livest. Prod. Sci. 87:121-130.
Henry, Y. 1985. Dietary factors involved in feed intake regulation in growing pigs: a review.
Livest. Prod. Sci. 12:339-354.
Huisman, J., L. A. den Hartog, H. Boer, E. J. van Weerden, W. J. G. Thielen, 1985. The effect of
various carbohydrate sources on the ileal and faecal digestibility of protein and amino
acids in pigs. In: Proceedings of the 3rd Intl. Seminar on Dig. Physiol. Pigs. Copenhagen,
Denmark. p. 207-210.
Jacobs, B. M., J. F. Patience, W. A. Dozier, III, K. J. Stalder, and B. J. Kerr. 2011. Effects of
drying methods on nitrogen and energy concentrations in pig feces and urine, and
poultry excreta. J. Anim. Sci. 89:2624-2630.

54
Jørgensen, H., X. Q. Zhao, and B. O. Eggum. 1996. The influence of dietary fibre and
environmental temperature on the development of the gastrointestinal tract, digestibility,
degree of fermentation in the hindgut, and energy metabolism in pigs. Br. J. Nutr.
77:745-756.
Kyriazakis, I., and G. C. Emmans. 1995. The voluntary feed intake of pigs given fees based on
wheat bran, dried citrus pulp and grass meal, in relation to measurements of feed bulk.
Br. J. Nutr. 73:191-207.
Langlois, A., T. Corring, and C. Février. 1987. Effect of wheat bran on exocrine pancreas
secretion in the pig. Reprod. Nutr. Dév. 27:929-939.
Le Goff, G., and J. Noblet. 2001. Comparative digestibility of dietary energy and nutrients in
growing pigs and adult sows. J. Anim. Sci. 79:2418-2427.
Le Goff, G., J. van Milgen, and J Noblet. 2002. Influence of dietary fibre on digestive utilization
and rate of passage in growing pigs, finishing pigs and adult sows. Anim. Sci. 74:503-
515.
Leone, J. L. 1973. Collaborative study of the quantitative determination of titanium dioxide in
cheese. J. AOAC. 56:535-537.
Leterme, P., P. van Leeuwen, A. Thewis, and J. Huisman. 1996. Chemical composition of pea
inner fiber isolates and their effect on endogenous digestive secretions in pigs. J. Sci.
Food Agric. 72:127-134.
Leterme, P., W. B. Souffrant, and A. Thèwis. 2000. Effect of barley fibres and barley intake on
the ileal endogenous N losses in piglets. J. Cereal Sci. 31:229-239.

55
Libao-Mercado, A. J., Y. Yin, J. van Eys, and C. F. M. de Lange. 2006. True ileal amino acid
digestibility and endogenous ileal amino acid losses in growing pigs fed wheat shorts- or
casein-based diets. J. Anim. Sci. 84:1351-1361.
Lindberg, J. E., and C. Pedersen. 2003. Predictions of energy digestibility in pig feeds. In: W. B.
Souffrant and C. C. Metges, editors, Progress in research on energy and protein
metabolism held at Rostock-Warnemuende, September, 2003. EEAP publication No.
109. Wageningen Academic, Wageningen, The Netherlands. p. 201-204.
Linneen, S. K., J. M. DeRouchy, S. S. Dritz., R. D. Goodband, M. D. Tokach, and J. L. Nelssen.
2008. Effects of dried distillers grains with solubles on growing and finishing pig
performance in a commercial environment. J. Anim. Sci. 86:1579-1587.
Morel, P. C. H., T. S. Lee, and P. J. Moughan. 2006. Effect of feeding level, live weigh and
genotype on the apparent faecal digestibility of energy an organic matter in the growing
pig. Anim. Feed Sci. Technol. 126:63-74.
Moughan, P. J. 2003. Amino acid digestibility and availability in food and feedstuffs. In: R. O.
Ball, editor, Digestive physiology in pigs. Proc. 9th Intl. Symp. vol. 1. Univ. Alberta,
Alberta, Canada. p. 199-221,
Newton, G. L., O. M. Hale, and C. O. Plank. 1983. Effect of wheat bran in practical diets on
mineral absorption by pigs at two ages. Can. J. Anim. Sci. 63:399-409.
Noblet, J., and J. M. Perez. 1993. Prediction of digestibility of nutrients and energy values of pig
diets from chemical analysis. J. Anim. Sci. 71:3389-3398.

56
Noblet, J., H. Fortune, X. S. Shi, and S. Dubois. 1994. Prediction of net energy value of feeds for
growing pigs. J. Anim. Sci. 72:344-354.
Noblet, J., and G. Le Goff. 2001. Effect of dietary fibre on the energy value of feeds for pigs.
Anim. Feed Sci. Technol. 90:35-52.
NRC. 1998. Nutrient requirements of swine. 10th rev. ed. Natl. Acad. Press, Washington, DC.
NRC. 2012. Nutrient requirements of swine. 11th rev. ed. Natl. Acad. Press, Washington, DC.
Oresanya, T. F., A. D. Beaulieu, and J. F. Patience. 2008. Investigations of energy metabolism in
weanling barrows: The interaction of dietary energy concentration and daily feed
(energy) intake. J. Anim. Sci. 86: 348-363.
Owusu-Asiedu, A., J. F. Patience, B. Laarveld, A. G. Van Kessel, P. H. Simmins, and R. T.
Zijlstra. 2006. Effects of guar gum and cellulose on digesta passage rate, ilea microbial
populations, energy and protein digestibility, and performance of grower pigs. J. Anim.
Sci. 84:843-852.
Pahm, A. A., C. Pedersen, and H. H. Stein. 2008. Application of the reactive lysine procedure to
estimate lysine digestibility in distillers dried grains with solubles fed to growing pigs. J.
Agric. Food Chem. 56:9441–9446.
Sauvant, D., J. M. Perez, and G. Tran. 2004. Tables of Composition and Nutritional Value of
Feed Materials: Pig, poultry, sheep, goats, rabbits, horses, fish. Wageningen Academic
Publishers, Wageningen, The Netherlands and INRA Editions, Paris, France.

57
Schulze, H., P. van Leeuwen, M. W. A. Verstegen, J. Huisman, W. B. Souffrant, and F. Ahrens.
1994. Effect of level of dietary neutral detergent fiber on ileal apparent digestibility and
ileal nitrogen losses in pigs. J. Anim. Sci. 72:2362-2368.
Serena, A., H. Jørgensen, and K. E. Back Knudsen. 2008. Digestion of carbohydrates and
utilization of energy in sows fed diets with contrasting levels and physicochemical
properties of dietary fiber. J. Anim. Sci. 86:2208-2216.
Souffrant, W. B. 1991. Endogenous nitrogen losses during digestion in pigs. In: M. W. A.
Verstegen, J. Huisman, and L. A. den Hartog, editors, Digestive physiology in pigs.
EAAP Publ. No. 54. Pudoc, Wageningen, The Netherlands. p. 147.
Souffrant, W. B. 2001. Effect of dietary fiber on ileal digestibility and endogenous nitrogen
losses in the pig. Anim. Feed Sci. Technol. 90:93-102.
Stein, H. H., C. F. Shipley, and R. A. Easter. 1998. Technical Note: A technique for inserting a
T-cannula into the distal ileum of pregnant sows. J. Anim. Sci. 76:1433-1436.
Stein, H. H., B. Sève, M. F. Fuller, P. J. Moughan, and C. F. M. de Lange. 2007. Invited review:
Amino acid bioavailability and digestibility in pig feed ingredients: Terminology and
application. J. Anim. Sci. 85:172-180.
Stein, H. H., and G. C. Shurson. 2009. Board invited review. The use and application of distillers
dried grains with solubles in swine diets. J. Anim. Sci. 87:1292-1303.
Urriola, P. E., and H. H. Stein. 2010. Effects of distillers dried grains with solubles on amino
acid, energy, and fiber digestibility and on hindgut fermentation of dietary fiber in a corn-
soybean meal diet fed to growing pigs. J. Anim. Sci. 88:1454-1462.

58
Urriola, P. E., G. C. Shurson, and H. H. Stein. 2010. Digestibility of dietary fiber in distillers
coproducts fed to growing pigs. J. Anim. Sci. 88:2373-2381.
van Milgen, J. 2006. Nutrient flow models, energy transactions and energy feed systems. In: R.
M. Gous, T. R. Morris, and C. Fisher, editors, Mechanistic modeling in pig and poultry
production. CABI Publishinhg, Wallingford, Oxfordshire, UK. p. 143-145.
Van Soest, P. J., and J. B. Robertson. 1979. Systems of analysis for evaluating fibrous feeds. In:
Workshop Standardization of Analytical Methodology for Feeds, Int. Dev. Res Center,
Ottawa, ON, Canada. P. 49-60
Whitney, M. H., G. C. Shurson, L. J. Johnson, D. M. Wulf, and B. C. Shanks. 2006. Growth
performance and carcass characteristics of grower-finisher pigs fed high-quality corn
distillers dried grains with soluble originating from a modern Midwestern ethanol plant.
J. Anim. Sci. 84:3356-3363.
Wang, J. F., B. B. Jensen, H. Jørgensen, D. F. Li, and J. E. Lindberg. 2002. Ileal and total tract
digestibility, and protein and fat balance in pigs fed rice with addition of potato starch,
sugar beet pulp or wheat bran. Anim feed Sci. Technol. 102:125-136.
Wilfart, A., L. Montagne, P. H. Simmins, J. Noblet, and J. van Milgen. 2007a. Digesta transit in
different segments of the gastrointestinal tract of pigs as affected by insoluble fibre
supplied by wheat bran. Br. J. Nutr. 98:54-62.
Wilfart, A., L. Montagne, P. H. Simmins, J. van Milgen, and J. Noblet. 2007b. Sites of nutrient
digestion in growing pigs: Effect of dietary fiber. J. Anim. Sci. 85:976-983.

59
Table 2.1. Analyzed composition of corn bran with solubles (as-fed basis)1
Composition Corn bran with solubles
DM, % 95.27
GE, kcal/kg 4,581
Ether extract, % 8.30
Starch, % 24.07
ADF, % 5.89
NDF, % 22.74
TDF, % 25.15
CP, % 13.02
Indispensable AA, %
Arg 0.78
His 0.53
Ile 0.67
Leu 2.00
Lys 0.65
Met 0.31
Phe 0.81
Thr 0.70
Trp 0.12
Val 0.88
Dispensable AA, %
Ala 1.28
Asp 1.19
Cys 0.35
Glu 2.82

60
Table 2.1. (continued)
Gly 0.71
Pro 1.38
Ser 0.83
Tyr 0.61
All AA, % 16.62
1Corn bran with solubles (Poet Nutrition, Glenville, MN). TDF = total dietary fiber.

61
Table 2.2. Ingredient and composition (as-fed basis) of experimental diets for the digestion trial1
CB-S, %
Item 0 10 20 30 40
Ingredient, %
Ground corn 84.00 75.30 66.50 57.80 49.10
Corn bran - 10.00 20.00 30.00 40.00
Casein 10.00 9.00 7.90 6.90 5.80
Soybean oil 2.20 2.00 1.70 1.50 1.30
Limestone 1.24 1.24 1.24 1.24 1.24
Monocalcium phosphate 1.20 1.20 1.20 1.20 1.20
L–Trp 0.01 0.01 0.01 0.01 0.01
Titanium dioxide 0.45 0.45 0.45 0.45 0.45
Vitamin premix2 0.15 0.15 0.15 0.15 0.15
Trace mineral premix3 0.10 0.10 0.10 0.10 0.10
Zinc oxide4 0.05 0.05 0.05 0.05 0.05
NaCl 0.60 0.60 0.60 0.60 0.60
Energy and nutrients5
GE, kcal/kg 3,853 3,884 3,969 4,081 4,140
ME, kcal/kg 3,411 3,229 3,046 2,864 2,681
NE, kcal/kg 2,393 2,273 2,153 2,033 1,914
Ether extract, % 4.04 4.69 4.84 5.50 6.08
Starch, % 57.07 54.11 49.75 46.21 44.07
ADF, % 2.35 2.64 2.93 3.22 3.51
NDF, % 6.76 8.56 10.79 11.32 14.01
TDF, % 7.27 8.69 9.11 11.41 14.73

62
Table 2.2. (continued)
CP, % 15.8 15.7 15.6 15.5 15.3
SID Lys, % 0.91 0.86 0.81 0.76 0.71
Met + Cys, % 0.44 0.41 0.46 0.51 0.53
Thr, % 0.54 0.49 0.55 0.59 0.62
Trp, % 0.16 0.16 0.16 0.17 0.15
1CB-S = corn bran with solubles (Poet Nutrition, Sioux Falls, SD). 0 = basal diet; 10 = diet
containing 10% CB-S; 20 = diet containing 20% CB-S; 30 = diet containing 30% CB-S; and 40
= diet containing 40% CB-S.
2Provided per kilogram of complete diet: 6,614 IU vitamin A; 827 IU vitamin D; 26 IU
vitamin E; 2.6 mg vitamin K; 29.8 mg niacin; 16.5 mg pantothenic acid; 5.0 mg riboflavin; and
0.023 mg vitamin B12.
3Provided per kilogram of complete diet: 165 mg Fe as FeSO4; 39 mg Mn as MnSO4; 17 mg
Cu as CuSO4; 0.3 mg I as Ca(IO3)2; and 0.3 mg Se as Na2SeO3.
4Zinc oxide = 72% Zn.
5TDF = total dietary fiber and SID = standard ileal digestible; values for ME and SID Lys
were calculated from NRC (1998); values for NE of diets were calculated from Sauvant et al.
(2004); all other values were analyzed.

63
Table 2.3. Composition (as-fed basis) of experimental diets for growing pigs1
Basal Declining NE Constant NE
Item CB-S, %: 0 7.5 15 22.5 7.5 15 22.5
Ingredient, %
Ground corn 72.24 67.02 62.06 56.5 63.24 54.29 45.50
Corn bran - 7.50 15.00 22.50 7.50 15.00 22.50
Soybean meal, 46.5% CP 24.00 21.75 19.30 17.54 23.50 23.00 22.29
Soybean oil - - - - 2.00 4.00 6.00
Limestone 1.20 1.20 1.20 1.30 1.20 1.30 1.30
Monocalcium phosphate 1.15 1.10 1.00 0.75 1.15 1.00 1.00
L–Lys≅HCl 0.18 0.19 0.20 0.19 0.18 0.18 0.18
L–Thr 0.03 0.03 0.03 0.01 0.03 0.03 0.03
L–Trp - 0.01 0.01 0.01 - - -
Titanium dioxide 0.40 0.40 0.40 0.40 0.40 0.40 0.40
Vitamin premix2 0.16 0.16 0.16 0.16 0.16 0.16 0.16
Trace mineral premix3 0.14 0.14 0.14 0.14 0.14 0.14 0.14
NaCl 0.50 0.50 0.50 0.50 0.50 0.50 0.50
Energy and nutrients4
GE, kcal/kg 3,719 3,788 3,832 3,918 3,897 4,097 4,270
DE, kcal/kg 3,282 3,161 3,042 3,297 3,253 3,226 3,197
NE, kcal/kg 2,387 2,301 2,218 2,133 2,387 2,388 2,389
Ether extract, % 2.31 2.65 2.91 3.32 4.28 6.79 9.56
Starch, % 42.97 45.68 44.72 39.78 39.59 39.05 33.80
ADF, % 3.56 3.67 3.78 3.91 3.68 3.79 3.90
NDF, % 9.38 10.54 11.71 12.89 10.36 11.34 12.31

64
Table 2.3. (continued)
TDF, % 10.06 10.60 11.54 13.62 10.51 12.07 12.66
CP, % 16.8 14.1 15.3 14.1 16.9 15.7 15.9
SID Lys, % 0.92 0.89 0.86 0.82 0.92 0.92 0.92
Met + Cys, % 0.52 0.51 0.50 0.49 0.52 0.52 0.51
Thr, % 0.57 0.56 0.54 0.51 0.58 0.58 0.58
Trp, % 0.17 0.17 0.16 0.15 0.17 0.17 0.16
Ca, % 0.75 0.74 0.71 0.71 0.75 0.76 0.76
Bioavailable P, % 0.26 0.26 0.25 0.22 0.27 0.25 0.26
1CB-S = corn bran with solubles (Poet Nutrition, Sioux Falls, SD). Basal = basal diet
containing 0% CB-S and 0% soybean oil (SBO); declining NE = diets containing 7.5, 15, or
22.5% of CB-S and no SBO added; and constant NE = diets containing 7.5, 15, or 22.5% of CB-
S and 2, 4, or 6% of SBO.
2Provided per kilogram of complete diet: 6,614 IU vitamin A; 827 IU vitamin D; 26 IU
vitamin E; 2.6 mg vitamin K; 29.8 mg niacin; 16.5 mg pantothenic acid; 5.0 mg riboflavin; and
0.023 mg vitamin B12.
3Provided per kilogram of complete diet: 165 mg as Zn ZnSO4; 165 mg Fe as FeSO4; 39 mg
Mn as MnSO4; 17 mg Cu as CuSO4; 0.3 mg I as Ca(IO3)2; and 0.3 mg Se as Na2SeO3.
4TDF = total dietary fiber and SID = standardized ileal digestible; values for SID Lys, Ca,
and bioavailable P in diets were calculated from NRC (1998); values for NE of diets were
calculated from Sauvant et al. (2004); all other values were analyzed.
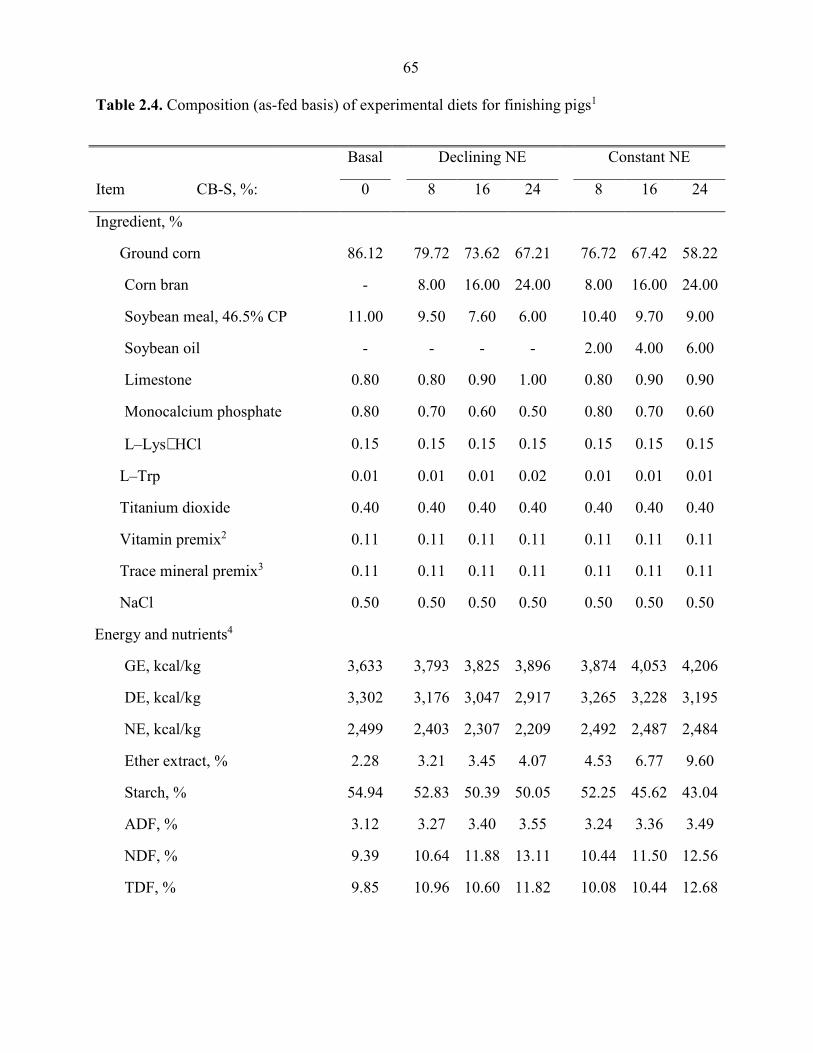
65
Table 2.4. Composition (as-fed basis) of experimental diets for finishing pigs1
Basal Declining NE Constant NE
Item CB-S, %: 0 8 16 24 8 16 24
Ingredient, %
Ground corn 86.12 79.72 73.62 67.21 76.72 67.42 58.22
Corn bran - 8.00 16.00 24.00 8.00 16.00 24.00
Soybean meal, 46.5% CP 11.00 9.50 7.60 6.00 10.40 9.70 9.00
Soybean oil - - - - 2.00 4.00 6.00
Limestone 0.80 0.80 0.90 1.00 0.80 0.90 0.90
Monocalcium phosphate 0.80 0.70 0.60 0.50 0.80 0.70 0.60
L–Lys≅HCl 0.15 0.15 0.15 0.15 0.15 0.15 0.15
L–Trp 0.01 0.01 0.01 0.02 0.01 0.01 0.01
Titanium dioxide 0.40 0.40 0.40 0.40 0.40 0.40 0.40
Vitamin premix2 0.11 0.11 0.11 0.11 0.11 0.11 0.11
Trace mineral premix3 0.11 0.11 0.11 0.11 0.11 0.11 0.11
NaCl 0.50 0.50 0.50 0.50 0.50 0.50 0.50
Energy and nutrients4
GE, kcal/kg 3,633 3,793 3,825 3,896 3,874 4,053 4,206
DE, kcal/kg 3,302 3,176 3,047 2,917 3,265 3,228 3,195
NE, kcal/kg 2,499 2,403 2,307 2,209 2,492 2,487 2,484
Ether extract, % 2.28 3.21 3.45 4.07 4.53 6.77 9.60
Starch, % 54.94 52.83 50.39 50.05 52.25 45.62 43.04
ADF, % 3.12 3.27 3.40 3.55 3.24 3.36 3.49
NDF, % 9.39 10.64 11.88 13.11 10.44 11.50 12.56
TDF, % 9.85 10.96 10.60 11.82 10.08 10.44 12.68

66
Table 2.4. (continued)
CP, % 11.1 10.8 10.1 9.9 10.7 10.8 11.1
SID Lys, % 0.58 0.56 0.54 0.52 0.58 0.58 0.58
Met + Cys, % 0.41 0.40 0.39 0.39 0.40 0.40 0.40
Thr, % 0.38 0.37 0.36 0.36 0.38 0.38 0.38
Trp, % 0.12 0.11 0.10 0.10 0.11 0.11 0.11
Ca, % 0.50 0.48 0.50 0.51 0.50 0.52 0.50
Bioavailable P, % 0.19 0.18 0.17 0.17 0.20 0.19 0.18
1CB-S = corn bran with solubles (Poet Nutrition, Sioux Falls, SD). Basal = basal diet
containing 0% CB-S and 0% soybean oil (SBO); declining NE = diets containing 8, 16, or 24%
of CB-S and no SBO added; and constant NE = diets containing 8, 16, or 24% of CB-S and 2, 4,
or 6% of SBO.
2Provided per kilogram of complete diet: 6,614 IU vitamin A; 827 IU vitamin D; 26 IU
vitamin E; 2.6 mg vitamin K; 29.8 mg niacin; 16.5 mg pantothenic acid; 5.0 mg riboflavin; and
0.023 mg vitamin B12.
3Provided per kilogram of complete diet: 165 mg Zn as ZnSO4; 165 mg Fe as FeSO4; 39 mg
Mn as MnSO4; 17 mg Cu as CuSO4; 0.3 mg I as Ca(IO3)2; and 0.3 mg Se as Na2SeO3.
4TDF = total dietary fiber and SID = standardized ileal digestible; values for SID Lys, Ca,
and bioavailable P of diets were calculated from NRC (1998); Values for NE of diets were
calculated from Sauvant et al. (2004); all other values were analyzed.

67
Table 2.5. Effects of increasing dietary fiber from corn bran with solubles on apparent ileal
digestibility of AA in growing pigs (digestion trial)1,2
CB-S, % P-value3
Item 0 10 20 30 40 SEM L Q
Indispensable AA, %
Arg 83.4 77.9 80.8 79.5 80.6 1.1 0.22 0.03
His 87.0 80.8 82.4 79.0 80.5 1.7 <0.01 0.07
Ile 80.9 78.4 77.3 75.9 75.4 1.1 <0.01 0.35
Leu 88.2 86.6 85.8 84.7 84.4 0.8 <0.01 0.44
Lys 85.2 82.5 79.5 79.8 75.8 2.2 <0.01 0.92
Met 89.7 87.8 86.4 85.3 84.3 0.8 <0.01 0.43
Phe 87. 6 85.7 84.6 83.3 82.6 0.9 <0.01 0.53
Thr 73.3 70.2 69.8 66.6 68.2 1.5 <0.01 0.24
Trp 83.4 82.7 81.1 78.6 75.9 1.3 <0.01 0.27
Val 80.3 77.2 76.2 74.9 74.3 1.2 <0.01 0.29
Mean 84.3 81.5 80.8 79.4 78.9 0.9 <0.01 0.28
Dispensable AA
Ala 76.3 74.7 75.6 74.6 76.5 1.4 0.96 0.33
Asp 77.6 74.1 73.4 69.9 71.1 1.3 <0.01 0.19
Cys 65.0 62.0 62.6 60.7 65.2 2.1 0.86 0.11
Glu 86.4 83.4 83.8 81.4 82.2 0.9 <0.01 0.18
Gly 53.9 49.5 52.2 48.2 53.5 3.1 0.41 0.06
Pro 77.9 55.5 74.8 76. 6 76.2 4.0 0.16 0.08
Ser 73.0 68.7 73.2 68.2 72.0 1.5 0.60 0.24
Tyr 87.4 85.8 85.2 83.8 82.8 0.8 <0.01 0.88

68
Table 2.5. (continued)
Mean 79.6 72.4 77.0 74.9 75.9 1.4 0.25 0.06
All AA 81.8 76.6 78.7 77.0 77.3 1.1 0.02 0.90
1CB-S = corn bran with solubles (Poet Nutrition, Sioux Falls, SD). 0 = basal diet; 10 = diet
containing 90% of the basal diet and 10% of corn bran with solubles (CB-S); 20 = diet
containing 80% of the basal diet and 20% of CB-S; 30 = diet containing 70% of the basal diet
and 30% of CB-S; and 40 = diet containing 60% of the basal diet and 40% CB-S.
2Data are least squares means (n = 9).
3P-values for linear (L) and quadratic (Q) effects.

69
Table 2.6. Effects of increasing dietary fiber from corn bran with solubles on apparent ileal
digestibility, apparent total tract digestibility, and hindgut disappearance of DM, energy, CP,
NDF, and total dietary fiber (TDF) in growing pigs (digestion trial)1,2
CB-S, % P-value3
Item 0 10 20 30 40 SEM L Q
Apparent ileal digestibility, %
DM 79.8 76.1 75.7 71.9 71.2 1.1 <0.01 0.49
GE 78.8 75.1 74.6 72.5 72.2 1.3 <0.01 0.19
CP 77.9 75.5 72.4 69.2 67.9 1.5 <0.01 0.70
NDF 23.0 25.1 24.3 23.3 25.2 3.0 0.76 0.96
TDF 14.9 17.5 16.5 15.9 19.9 2.8 0.15 0.62
Apparent total tract digestibility, %
DM 87.7 85.8 82.7 80.4 79.0 0.7 <0.01 0.33
GE 85.4 83.3 80.6 78.2 76.9 0.9 <0.01 0.36
CP 85.2 82.5 79.7 75.7 74.0 1.4 <0.01 0.87
NDF 42.6 41.6 41.9 29.3 30.5 2.3 <0.01 0.28
TDF 36.6 34.4 33.5 26.4 29.1 2.2 <0.01 0.66
Hindgut disappearance, %
DM 7.8 9.7 7.1 8.4 7.8 1.0 0.68 0.77
GE 6.5 8.1 5.9 5.7 4.8 1.0 0.07 0.43
CP 7.4 7.0 7.5 6.4 5.9 1.9 0.54 0.79
NDF 19.6 16.5 17.8 6.4 5.5 3.5 <0.01 0.52
TDF 21.9 16.4 16.8 10.8 9.7 3.0 <0.01 0.81
1CB-S = corn bran with solubles (Poet Nutrition, Sioux Falls, SD). 0 = basal diet; 10 = diet
containing 90% of the basal diet and 10% of corn bran with solubles (CB-S); 20 = diet
70
containing 80% of the basal diet and 20% of CB-S; 30 = diet containing 70% of the basal diet
and 30% of CB-S; and 40 = diet containing 60% of the basal diet and 40% CB-S.
2Data are least squares means (n = 9).
3P-values for linear (L) and quadratic (Q) effects.
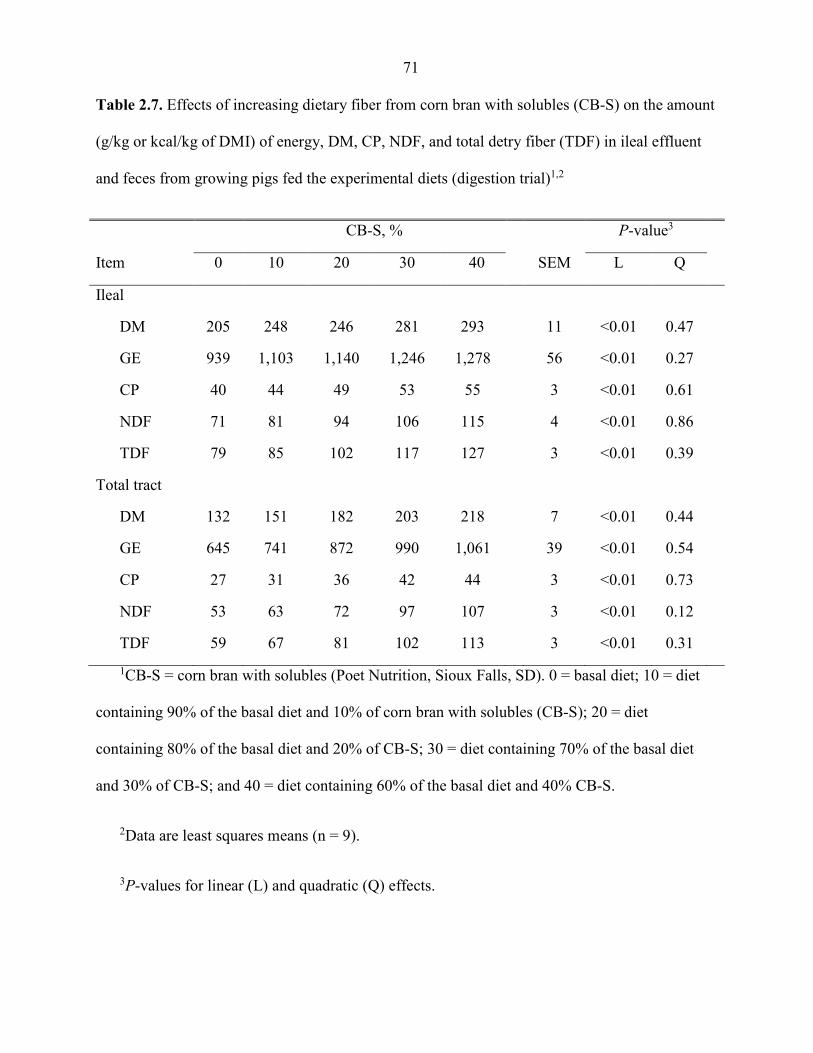
71
Table 2.7. Effects of increasing dietary fiber from corn bran with solubles (CB-S) on the amount
(g/kg or kcal/kg of DMI) of energy, DM, CP, NDF, and total detry fiber (TDF) in ileal effluent
and feces from growing pigs fed the experimental diets (digestion trial)1,2
CB-S, % P-value3
Item 0 10 20 30 40 SEM L Q
Ileal
DM 205 248 246 281 293 11 <0.01 0.47
GE 939 1,103 1,140 1,246 1,278 56 <0.01 0.27
CP 40 44 49 53 55 3 <0.01 0.61
NDF 71 81 94 106 115 4 <0.01 0.86
TDF 79 85 102 117 127 3 <0.01 0.39
Total tract
DM 132 151 182 203 218 7 <0.01 0.44
GE 645 741 872 990 1,061 39 <0.01 0.54
CP 27 31 36 42 44 3 <0.01 0.73
NDF 53 63 72 97 107 3 <0.01 0.12
TDF 59 67 81 102 113 3 <0.01 0.31
1CB-S = corn bran with solubles (Poet Nutrition, Sioux Falls, SD). 0 = basal diet; 10 = diet
containing 90% of the basal diet and 10% of corn bran with solubles (CB-S); 20 = diet
containing 80% of the basal diet and 20% of CB-S; 30 = diet containing 70% of the basal diet
and 30% of CB-S; and 40 = diet containing 60% of the basal diet and 40% CB-S.
2Data are least squares means (n = 9).
3P-values for linear (L) and quadratic (Q) effects.

72
Table 2.8. Effects of increasing dietary fiber from corn bran with solubles, in diets formulated with declining or constant NE on
apparent total tract digestibility of DM, GE, CP and on the DE and NE content of diets fed to growing and finishing pigs1,2,3
Declining NE P–value5 Constant NE P–value6
Item CB-S,4 %:
0 7.5/8 15/16 22.5/24 SEM L Q 0
7.5/8 15/16 22.5/24 SEM L Q
Growing pigs
ATTD of DM,7 % 84.2 81.8 80.7 79.8 0.4 <0.01 0.07 84.2 84.5 80.9 80.2 0.5 <0.01 0.28
ATTD of GE, % 82.2 79.6 78.3 77.7 0.5 <0.01 0.04 82.2 82.7 79.7 79.4 0.5 <0.01 0.41
ATTD of CP, % 79.0 71.5 72.7 69.7 0.7 <0.01 <0.01 79.1 80.3 73.8 74.5 0.9 <0.01 0.71
DE, kcal/kg 3,055 3,014 3,002 3,044 17 0.13 0.83 3,055 3,224 3,266 3,391 22 <0.01 0.31
NE,8 kcal/kg 2,382 2,327 2,300 2,317 13 <0.01 0.07 2,382 2,491 2,504 2,573 16 <0.01 0.23
Finishing pigs
ATTD of DM, % 89.9 88.0 85.9 84.2 0.5 <0.01 0.93 89.9 88.3 87.5 84.2 0.4 <0.01 0.03
ATTD of GE, % 87.9 86.0 83.7 81.8 0.6 <0.01 0.93 87.8 86.5 86.2 83.0 0.5 <0.01 0.04
ATTD of CP, % 84.5 80.1 75.7 72.1 1.0 <0.01 0.70 84.6 81.2 79.5 74.9 0.9 <0.01 0.38

73
Table 2.8 (continued)
DE, kcal/kg 3,194 3,261 3,201 3,189 22 0.07 0.85 3,194 3,353 3,495 3,513 18 <0.01 <0.01
NE, kcal/kg 2,552 2,536 2,465 2,442 17 <0.01 0.86 2,552 2,632 2,719 2,677 15 <0.01 <0.01
1CB-S = corn bran with solubles (Poet Nutrition, Sioux Falls, SD), and ATTD = apparent total tract digestibility. Declining NE =
diets containing CB-S and no soybean oil (SBO) added; and constant NE = diets containing CB-S and 2, 4, or 6% of SBO.
2Data are least squares means (n = 10).
3Dietary treatment x sex, P > 0.05.
4Fed diets containing 0, 7.5, 15, or 22.5% CB-S to growing pigs and diets containing 0, 8, 16, or 24% CB-S to finishing pigs.
5P-values for linear (L) and quadratic (Q) effects are for the effects of declining NE with CB-S inclusion.
6P-values for L and Q effects are for the effects of constant NE with CB-S inclusion.
7ATTD = Apparent total tract digestibility.
8Values of NE of diets were calculated from Noblet et al. (1994) and expressed as-fed basis.

74
Table 2.9. Effects of increasing dietary fiber from corn bran with solubles in diets formulated with declining or constant NE on
growth performance and energy intake in growing and finishing pigs1,2,3
Declining NE Constant NE
Item CB-S,4 %: 0 7.5/8 15/16 22.5/24 SEM P–
value
0 7.5/8 15/16 22.5/24 SEM P–
value
Growing pigs
BW, kg 49.5 49.1 48.8 47.0 0.7 0.10 49.4 49.6 49.5 48.6 0.7 0.78
ADG, kg 1.04 1.02 1.01 0.92 0.04 0.06 1.04 1.07 1.07 1.02 0.03 0.65
G:F 0.46a 0.44b 0.44b 0.43b 0.01 0.01 0.46b 0.47ab 0.48a 0.49a 0.01 <0.01
ADFI, kg 2.29 2.35 2.30 2.15 0.07 0.26 2.29 2.28 2.23 2.09 0.07 0.14
DE intake, kcal/d 6,998 7,092 6,896 6,554 216 0.33 6,988 7,347 7,277 7,078 211 0.61
NE intake, kcal/d 5,456 5,474 5,285 4,990 166 0.16 5,449 5,677 5,578 5,370 163 0.56
Finishing pigs
BW, kg 102.8a 101.7a 101.3ab 99.4b 0.8 0.03 103.0 103.0 102.4 102.5 0.9 0.94
ADG, kg 1.02a 0.97ab 0.94bc 0.84c 0.04 0.01 1.03 1.02 0.99 0.99 0.04 0.90
G:F 0.33a 0.32ab 0.31b 0.28c 0.01 <0.01 0.33 0.34 0.34 0.34 0.01 0.67
ADFI, kg 3.08 3.07 3.02 2.94 0.10 0.70 3.09 2.93 2.89 2.91 0.10 0.43
DE intake, kcal/d 9,847 9,995 9,653 9,412 293 0.53 9,888 9,846 10,113 10,278 309 0.77
NE intake, kcal/d 7,871 7,773 7,433 7,208 227 0.16 7,902 7,728 7,869 7,833 249 0.96

75
a-cWithin a row and declining or constant NE, means without a common superscript differ, P < 0.05.
1CB-S = corn bran with solubles (Poet Nutrition, Sioux Falls, SD). Declining NE = diets containing CB-S and no soybean oil
(SBO) added; and constant NE = diets containing CB-S and 2, 4, or 6% of SBO.
2Data are least squares means (n = 10).
3Effect of week, P < 0.05; dietary treatment x sex, P > 0.05; and dietary treatment and week, P > 0.05.
4Fed diets containing 0, 7.5, 15, or 22.5% CB-S to growing pigs and diets containing 0, 8, 16, or 24% CB-S to finishing pigs.

76
CHAPTER 3: EFFECTS OF REDUCED OIL DISTILLERS DRIED GRAINS WITH
SOLUBLES AND SOYBEAN OIL ON DIETARY FAT, FIBER, AND AMINO ACID
DIGESTIBILITY IN CORN BASED DIETS FED TO GROWING PIGS
A paper to be submitted to the Journal of Animal Science
N. A. Gutierrez,* N. V. L. Serão,* and J. F. Patience*1
*Department of Animal Science, Iowa State University, Ames, IA 50011
_____________________
1 Corresponding author: 201B Kildee Hall, Ames, IA 50011; [email protected]

77
ABSTRACT
The use of corn co-products increases the concentration of fiber and often the use of
supplemental fat in swine diets, which may affect energy and nutrient digestibility. An
experiment was conducted to determine the effects of reduced oil distillers dried grains with
solubles (DDGS-RO) and soybean oil (SBO) on dietary Lys, acid hydrolyzed ether extract
(AEE), and neutral detergent fiber (NDF) digestibility in corn-based diets fed to growing pigs.
Eighteen growing pigs (BW = 33.8 ± 2.2 kg) were surgically fitted with a T-cannula in the distal
ileum and allocated to 1 of 6 dietary treatment groups in a 3-period incomplete latin square
design, with 9 observations per treatment. Six dietary treatments were obtained by adding 0, 20,
and 40% DDGS-RO to corn-casein diets formulated with 2 and 6% SBO. Ileal digesta and fecal
samples were collected and the apparent ileal (AID) and total tract digestibility (ATTD) of AEE
and NDF and the AID of Lys were determined. Results showed that the AID of Lys was not
affected by SBO concentration (P > 0.05), but DDGS-RO inclusion showed a quadratic effect (P
< 0.001). The AID of Lys was highly predictable (R2 = 0.69) from the DDGS-RO and dietary
SBO level. An interaction between DDGS-RO and SBO on the AID (P = 0.003; R2 = 0.68) and
ATTD (P = 0.004; R2 = 0.79) of AEE was observed, where the AID and ATTD of AEE
increased with SBO. The AID (72.5 to 79.1%) and ATTD (62.6 to 71.6%) of AEE increased
with DDGS-RO at 2% SBO, but no effect was observed at 6% SBO. An interaction between
DDGS-RO and SBO on the AID (P = 0.037; R2 = 0.53) and ATTD (P = 0.004; R2 = 0.36) of
NDF was observed, where the AID (46.4 to 22.4%) and ATTD (52.0 to 40.9%) of NDF
decreased with DDGS-RO at 6% SBO, but no effect was observed at 2% SBO. The AID of NDF
increased (32.5 to 46.4%) with SBO at 0% DDGS-RO, but no effect was observed at 20 or 40%
DDGS-RO. In conclusion, DDGS-RO increased the digestibility of AEE, and decreased the

78
digestibility of NDF, but the effect was modulated by SBO. Soybean oil increased the
digestibility of AEE but the effect was modulated by DDGS-RO, and increased the AID of NDF
in diets without DDGS-RO. The AID of Lys decreased with DDGS-RO and was not affected by
addition of SBO.
Keywords: Cannulation, response surface, regression, endogenous losses, pig

79
INTRODUCTION
Corn co-products are rich in dietary fiber and its inclusion in swine diets dilutes the
traditionally starch-based dietary energy. Dietary fiber from corn and its co-products is only
partially fermented in the gastrointestinal tract of pigs because it is rich in insoluble non-starch
polysaccharides, such as cellulose, arabinoxylans, and lignin (Bach Knudsen, 1997; Jaworski,
2012). Dietary energy digestibility declines linearly with fiber content (Noblet and Perez, 1993);
the extent of this decline is such that, due to the limited fermentability of fiber from corn and its
co-products, increasing fiber in the diet may contribute little to the overall energy supply of the
growing pig (Le Goff and Noblet, 2001; van Milgen, 2006). Furthermore, advances in the
ethanol industry increase the efficiency of starch and oil extraction from the corn grain, leading
to a higher concentration of the fiber component of the co-products, resulting in the necessity to
add greater quantities of fat to the diet to maintain an acceptable concentration of energy in the
final diet. Added fat to swine diets typically originate from either intact fat in feed ingredients
such as distillers dried grains with solubles (DDGS) or supplemented extracted fat such as choice
white grease or any number of vegetable oils (Azain, 2001).
The addition to the diet of DDGS with low fat content, and subsequent increase of dietary
fiber, may decrease the digestibility of energy, dietary fiber, and nutrients in swine diets (Farrell,
1973; Noblet and Perez, 1993; Souffrant, 2001). Yet, the effects of fiber rich corn co-products on
the digestion of dietary fiber and of nutrients is not available when fat is added to the diet.
The objective of the present study was to test the hypothesis that the digestibility of AA,
acid hydrolyzed ether extract (AEE), and neutral detergent fiber (NDF) decrease with an
increase in dietary fiber and fat from reduced oil distillers dried grains with solubles (DDGS-
RO) and soybean oil (SBO).

80
MATERIALS AND METHODS
The experimental protocol was reviewed and approved by the Institutional Animal Care
and Use Committee at Iowa State University (12-13-7686-S).
Animals, Housing, and Experimental Design
Eighteen growing barrows (progeny of sire line 337 × dam line C-22, PIC,
Hendersonville, TN) were housed in individual pens (1.2 × 1.2 m) equipped with a feeder, a cup
waterer, and a half-slatted concrete floor in an environmentally controlled building. All pigs
were surgically fitted with a T-cannula in the distal ileum following procedures described by
Stein et al. (1998). After recovery from surgery, pigs were weighed (initial BW = 33.8 ± 2.2 kg)
and randomly allocated to 1 of 6 dietary treatments groups in a 3-period incomplete latin square
design, resulting in 9 observations per treatment. Pigs were not allowed to repeat dietary
treatments across periods. Each collection period involved 9 d of adaptation to dietary treatments
followed by 2 d of feces sub-sample collection and 3 d of ileal digesta sub-sample collection.
Dietary Treatments
Six dietary treatments were obtained by adding 0, 20, and 40% reduced oil distillers dried
grains with solubles (DDGS-RO) to corn-casein diets formulated with 2% and 6% soybean oil
(SBO; Table 3.1). A corn-casein diet with 2% SBO was formulated to meet or exceed the
nutrient requirements of growing pigs (NRC, 2012), and 5 additional dietary treatments were
obtained by adding DDGS-RO and SBO at the expense of corn. Casein and the portion of the
diet including limestone, monocalcium phosphate, salt, vitamin and trace mineral premixes were
maintained constant. Diets also contained 0.5% Cr2O3 as an inert marker. All pigs received the

81
same daily amount of feed, which was provided at a level of approximately 90% of predicted ad
libitum intake of the diet formulated with 2% SBO and no DDGS-RO. The daily feed allowance
was divided into 2 equal meals provided at 0700 and 1600 h. At the end of each collection
period, all pigs were weighed and daily feed allowance for the next collection period was
adjusted.
Sample Collection
After 9 d of adaptation to the diet, feces were collected via grab sampling on d 10 and 11,
and stored at -20°C. On d 12, 13, and 14, ileal digesta samples were collected for 8 h by
attaching a 207-mL plastic bag (Whirl-Pak, Nasco, Fort Atkinson, WI) to the opened cannula
with a cable tie. Bags were removed whenever they were filled with digesta or at least every 30
min, and stored at -20°C to prevent bacterial degradation. At the conclusion of each experimental
period, frozen ileal and fecal samples were allowed to thaw at room temperature and pooled
within animal, with a sub-sample collected for chemical analysis. Ileal sub-samples were
lyophilized before chemical analysis. Fecal sub-samples were oven-dried in a convection oven at
65°C to constant weight (Jacobs et al., 2011). After drying, feed, ileal, and fecal sub-samples
were finely ground in a Wiley Mill (Variable Speed Digital ED-5 Wiley Mill; Thomas Scientific,
Swedesboro, NJ) through a 1-mm screen and stored in desiccators to maintain a constant
percentage of DM.
Chemical Analysis and Calculations
Samples of diets were analyzed for DM (method 930.15; AOAC Int., 2007), GE by a
bomb calorimeter (Model 6200; Parr Instrument Co., Moline, IL) with benzoic acid as a standard
(6,318 kcal GE/kg of benzoic acid; Parr Instrument Co., Moline, IL), acid hydrolyzed ether

82
extract (AEE; Sanderson, 1986; Soxtec 2050, FOSS North America, Eden Prairie, MN), starch
(method 996.11; AOAC Int., 2007), acid detergent fiber (ADF; Goering and Van Soest, 1970),
neutral detergent fiber (NDF; Van Soest and Robertson, 1980), total dietary fiber (TDF; method
985.29; AOAC Int., 2007), and nitrogen using the combustion method (method 990.03: AOAC
International, 2007) with a Trumac apparatus (Leco Corporation, St. Joseph, MI) with EDTA for
calibration (9.58 ± 0.01% nitrogen; Leco Corporation, St. Joseph, MO). Crude protein was
calculated as nitrogen × 6.25. Ileal digesta and fecal samples were also analyzed for DM, GE,
NDF, and AEE. Diets and ileal digesta were analyzed for AA (University of Missouri
Agriculture Experiment Station Chemical Laboratories, Columbia, MO) according to method
982.30 E (a, b, c; AOAC Int., 2007). Chromium was determined in diets, ileal digesta, and fecal
sub-samples using the method of Fenton and Fenton (1979) and absorption was measured at 440
nm using a spectrophotometer (Synergy 4, BioTek, Winooski, VT). Chromic oxide standard
samples were assayed to confirm the accuracy of the analytical procedure, and a recovery of
100.8 ± 1.95% was attained.
For each dietary treatment, the AID and ATTD of DM, GE, NDF, and AEE, and the AID
of AA were calculated using the index method (Oresanya et al., 2008). The DE value was
determined by multiplying the GE by the observed ATTD of GE of the ingredient, and the ME
was estimated from the calculated DE and CP of the ingredient (Noblet and Perez, 1993).
Statistical Analyses
Univariate Analysis and Normality Test. The data were analyzed in a mixed model
including the fixed effects of DDGS-RO, SBO, their interaction and the covariate initial BW,
and the random effects of Period (3 levels) and Group (6 levels with 3 pigs per group).
83
Studentized residuals from each analysis were and used to test normality. Outliers were
removed until the Shapiro-Wilk’s test reached P>0.05 and Studentized residual fell within ±3σ.
Least squares means for DDGS-RO and interaction between DDGS-RO and SBO were
compared using Tukey-Kramer adjustment. Effects and multiple comparison differences were
deemed significant at α≤0.05.
Response Surface Model. Orthogonal polynomial contrasts were used to test the linear
and quadratic effects of DDGS-RO and SBO, when possible. Linear effects tested were: DDGS-
RO (L_DDGS-RO), SBO (L_SBO), and interaction L_SBO*L_DDGS-RO. Quadratic effects
tested were: Q_DDGS-RO and the interaction L_SBO*Q_DDGS-RO.
Depending on the significance (P<0.05) of the contrasts, response surface models were
generated to predict response according to the levels of DDGS-RO and SBO. A hierarchical
model selection was used to construct the response surface models. Models were only
constructed when both DDGS-RO and SBO were significant (P<0.05), regardless of the
orthogonal polynomial effect (linear or quadratic). If the quadratic effect of Q_DDGS-RO was
significant (P<0.05), the linear effect of L_DDGS-RO was kept in the model. Similarly, if the
interaction L_SBO*Q_DDGS-RO was significant (P<0.05), the interaction L_SBO*L_DDGS-
RO was kept in the model, as well as all other effects (L_SBO, L_DDGS-RO, and Q_DDGS-
RO), since these effects are part of the interaction effect of L_SBO*Q_DDGS-RO. Since SBO
had only two levels (2 and 6%), we could only test the linear effect (L_SBO and interactions).

84
RESULTS
All pigs successfully recovered from surgery, remained healthy and readily consumed
their diets throughout the experiment. The NDF and AEE of the DDGS-RO used in the present
study were 39.2% and 7.1%, respectively. The analyzed nutrient composition showed that
dietary inclusion of DDGS-RO increased the dietary AEE in treatments formulated with 2%
SBO (4.4, 5.7, and 6.3% AEE) and 6% SBO (8.4, 9.1, and 10.1% AEE; Table 3.2). The dietary
NDF also increased with DDGS-RO in treatments formulated with 2% SBO (6.9, 11.0, and
14.6% NDF) and 6% SBO (6.8, 9.7, and 14%). Dietary concentrations of GE, CP, and AA also
increased with DDGS-RO at both 2% and 6% SBO. The starch concentration, however,
decreased with DDGS-RO at 2% and 6% SBO.
The AID of GE and DM decreased with dietary inclusion of DDGS-RO (P < 0.001;
Table 3.3). In contrast, the dietary inclusion of SBO increased the AID of GE (P = 0.046), but
did not affect the AID of DM (P = 0.325). The ATTD of GE and DM decreased with DDGS-RO
(P < 0.001) and were not affected by the SBO level (P > 0.05). Results showed that the AID of
all indispensible AA decreased (P < 0.05) with DDGS-RO and, with the exception of the AID of
Ile (P = 0.015) and Met (P = 0.008), were not affected by SBO (P > 0.05).
An interaction between DDGS-RO and SBO on the AID (P = 0.011) and ATTD (P =
0.008) of AEE was observed (Table 3.3), where the AID and ATTD of AEE increased with SBO
across DDGS-RO levels (Fig. 3.1). The AID (72.5, 75.9, and 79.1%) and ATTD (62.6, 67.6, and
71.6%) of AEE increased with DDGS-RO at 2% SBO, but no effect was observed at 6% SBO.
An interaction between DDGS-RO and SBO on the AID (P = 0.002) and ATTD (P = 0.009) of
NDF was observed, where the AID (46.4 to 22.4%) and ATTD (52.0 to 40.9%) of NDF
decreased with DDGS-RO at 6% SBO, but no effect was observed at 2% SBO (Fig. 3.2). The

85
AID of NDF increased (32.5 to 46.4%) with SBO at 0% DDGS-RO, but no effect was observed
at 20 or 40% DDGS-RO.
The observed ME values of diets formulated with 2% and 6% SBO decreased (P < 0.01)
with DDGS-RO from 3.37 to 3.17 Mcal/kg and from 3.57 to 3.35 Mcal/kg, respectively (Table
3.4). In contrast, the DE and ME values of diets increased (P < 0.01) by approximately 0.2
Mcal/kg of ME when SBO increased from 2% to 6% SBO in the diet.
The response surface models (Table 3.5) showed a high predictability of the AID of GE
(R2 = 0.78), DM (R2 = 0.86), and Met (R2 = 0.71) from the SBO and DDGS-RO inclusion. A
high predictability of the AID and ATTD of AEE (R2 = 0.68 and R2 = 0.79, respectively) was
observed, but the predictability of the AID and ATTD of NDF (R2 = 0.53 and R2 = 0.36,
respectively) from the SBO and DDGS-RO inclusion was moderate.
DISCUSSION
Apparent Digestibility of Amino Acids
No interaction was observed between the effects of SBO and DDGS-RO addition on the
AID of AA. The AID of AA was however negatively associated with the concentration of
DDGS-RO. Similar effects from the dietary increase of co-products from the corn-ethanol
distillation industry have been previously reported (Urriola and Stein, 2010; Gutierrez et al.,
2013). In both cases, the decrease in AID of AA was attributed to heating and addition of
solubles during the production of DDGS, which is supported by the fact that the AID of AA,
such as Lys, is less in DDGS than in corn (Stein et al., 2006; Urriola et al., 2009). Although the
increase of dietary fiber may reduce the digestibility of AA (Schulze et al., 1994), the effect of

86
insoluble dietary fiber, such as corn fiber, has only minor effects on the digestibility of dietary
AA (Zhu et al., 2005) and on the basal endogenous losses of AA (Leterme et al., 1996).
Apparent Digestibility of Acid Hydrolyzed Ether Extract
An interaction between the effects of SBO and DDGS-RO addition was observed for the
AID and ATTD of AEE, which was elevated with a dietary increase of extracted fat from SBO,
and increased likewise with intact fat from DDGS-RO added to 2% SBO. The positive
relationship between dietary increase and apparent digestibility of AEE observed in the present
study agree with previously reported data from pigs (Just et al., 1980; Jørgensen et al., 1993; Kil
et al., 2010).
The observed response in apparent digestibility of AEE was modulated by the source of
dietary fat. This was evidenced by the response surface models, where the slopes for the effects
of SBO on AID and ATTD of AEE were greater than those of DDGS-RO. Greater apparent
digestibility of extracted fat than of intact fat has been reported for SBO (Agunbiade et al.,
1992), palm kernel oil (Agunbiade et al., 1999), and sunflower oil (San Juan and Villamide,
2000). Therefore, greater values of AID and ATTD of AEE were observed in diets formulated
with 6% SBO, where most of the AEE content is extracted fat, than in diets formulated with 2%
SBO, where most of the AEE content is intact fat. Values of AID and ATTD of AEE in the
present study fall within the range of values reported by Kil et al. (2010) for diets formulated
with extracted or intact fat, but comparison of results between trials is difficult because diets in
the present study were formulated with varying ratios of extracted to intact fat.
However, the increase in AID and ATTD of AEE with dietary intact or extracted fat may
also result from the contribution of endogenous losses of fat (ELF) to the total fat output, which
87
will have a greater impact on the apparent digestibility of AEE at low levels of dietary AEE
(Jørgensen et al., 1993). Fan and Sauer (1997) reported similar effects on the apparent
digestibility of AA from dietary AA concentrations and endogenous AA losses.
Values of apparent digestibility of AEE were greater at the end of the ileum than over the
entire intestinal tract. This observation may be the result of a net synthesis of fat in the hindgut of
pigs, and is in line with previously reported data (Shi and Noblet, 1993; Bakker, 1996). The
dietary fiber concentration may stimulate the synthesis of endogenous microbial fat in the
hindgut of pigs, increasing the ELF in the hindgut and reducing the ATTD of fat. Kil et al.
(2010) reported similar values of AID and ATTD of AEE from semipurified diets formulated
with increasing levels of Solka-Floc as fiber source. Purified fiber, however, may not stimulate
microbial growth and fat synthesis to the same degree as dietary fiber from feed ingredients,
because is largely composed of low fermentable cellulose and lacks the more complex
physicochemical structure of dietary fiber in feed ingredients (Kil et al., 2010). These results
suggest that dietary fat is digested and absorbed before the end of the ileum, and that differences
between values of AID and ATTD of AEE are the product of microbial synthesis of endogenous
fat in the hindgut of pigs (Low, 1980; Drackley, 2000).
Corn and DDGS-RO were the main dietary fiber sources in the present study. Dietary
fiber from corn is rich in cellulose, arabinoxylans, and lignin (Bach Knudsen, 1997), limiting its
fermentability in the terminal ileum (Gutierrez et al., 2013). The majority of dietary fiber from
corn reaches the hindgut where it is partially fermented (Gutierrez et al., 2013). As more
substrate is available ELF are stimulated due to increased microbial activity and fat synthesis
(Eyssen, 1973; Bach Knudsen et al., 1991), resulting in the reduction of the ATTD of AEE

88
relative to AID. Therefore values of AID more accurately reflect the digestibility and availability
of dietary AEE than ATTD values.
In the present study, dietary NDF increased with inclusion of DDGS-RO in diets
containing 2% and 6% SBO. A decrease in the apparent digestibility of fat with a dietary
increase of NDF has been previously reported (Just et al., 1980; Bakker, 1996; Hansen et al.,
2006), but the reduction has been associated with characteristics of dietary fiber such as
solubility and viscosity, rather than its dietary concentration (Fahey et al., 1990; Bach Knudsen
and Hansen, 1991; Smits and Annison, 1996). Fiber in corn and its co-products is highly
insoluble and has a low viscosity (Jaworski, 2012; Gutierrez et al., 2014); therefore, the increase
of dietary fiber from the dietary inclusion of DDGS-RO may not negatively affect the apparent
digestibility of AEE at 2% or 6% SBO. This assumption is in line with data reported by Kil et al.
(2010), who observed no effects from the dietary increase of highly insoluble and low viscous
purified NDF on the apparent digestibility of AEE.
Apparent Digestibility of Fiber
The dietary AEE and NDF increased with the dietary inclusion of SBO and DDGS-RO,
and an interaction between the effects of SBO and DDGS-RO inclusion on the AID and ATTD
of NDF was observed. An interaction between the dietary fat and fiber concentrations on the
apparent digestibility of dietary fat has been previously reported (Dégen et al., 2009). The dietary
increase of DDGS-RO at 2% SBO, and the subsequent increase in dietary insoluble NDF,
showed no effect on the apparent digestibility of NDF at the terminal ileum and over the entire
intestinal tract. Similar results on the AID of insoluble dietary fiber have been previously
reported (Graham et al., 1986; Urriola and Stein, 2010; Gutierrez et al., 2013), and AID of NDF
89
values observed in the present study (≈ 28% AID of NDF at 2% SBO) agree with previously
reported data from corn bran (Gutierrez et al., 2013). Fermentation of dietary fiber at the terminal
ileum is well documented, and the extent varies with the solubility of dietary fiber (Jørgensen et
al., 1996; Noblet and Le Goff, 2001; Urriola and Stein, 2010; Gutierrez et al., 2013). Results of
ATTD of NDF in the present study differ from previous reports where the increase in insoluble
dietary fiber from corn origin decreased the ATTD of dietary fiber (Urriola and Stein, 2010;
Gutierrez et al., 2013).
Conversely, the dietary increase of DDGS-RO at 6% SBO, and the subsequent increase
in dietary insoluble NDF, resulted in a quadratic response of the apparent digestibility of NDF.
The different response to DDGS-RO addition between diets with 2% and 6% SBO is possibly
the consequence of the elevated dietary fat concentration in the latter set of diets, and the ability
of dietary fat to increase the transit time of digesta and the time for fermentation of NDF in the
intestinal tract. This effect maybe visible at 0% DDGS-RO and 6% SBO, where NDF is low but
dietary AEE increased with extracted fat from SBO, and where the AID and ATTD of NDF were
greatest (46.4% and 52.0%, respectively). Dietary fat may increase the transit time of digesta as
previously reported in pigs (Cervantes-Pahm and Stein, 2008) and in laying hens (Mateos et al.,
1982). Degradability of fiber is a function of hydrolysis and transit time of digesta, therefore a
slow passage rate may increase the time that substrates are subjected to fermentation, increasing
in turn the dietary fiber degradability in the terminal ileum or in the hindgut (Morel et al., 2006;
Wilfart et al., 2007). However, in diets with 6% SBO the effect of fat on transit time may be
offset by the increasing levels of NDF from DDGS-RO. Increase of NDF from DDGS-RO may
stimulate bowel movement and reduce the transit time of digesta (Bastianelli et al., 1996;
Schneeman, 1998; Bindelle et al., 2008), which agree with data from pigs fed insoluble dietary

90
fiber from wheat bran where a decrease in retention time of digesta was reported (Wilfart et al.,
2007).
Values of apparent digestibility of NDF were greater over the entire intestinal tract than
at the terminal ileum. This observation suggests that insoluble dietary fiber from corn origin is
fermented to some degree at the terminal ileum but the majority is fermented in the hindgut of
pigs (Urriola and Stein, 2010; Gutierrez et al., 2013). The value of ATTD of dietary fiber
includes both fermentation of dietary fiber in the terminal ileum and in the hindgut, and is
therefore an accurate estimate of the total fermentation of dietary fiber in pigs.
Conclusions
Results from the present experiment showed that the AID of AA was negatively
associated with the concentration of DDGS-RO, and the decrease in AID of AA may be
attributed to the effects of manufacture processes during the production of DDGS rather than the
effect of NDF concentration in DDGS-RO. The apparent digestibility of AEE increased with
dietary addition of extracted and intact fat from SBO and DDGS, respectively, but no increase
was observed with addition of intact fat from DDGS-RO to diets with high concentrations of
extracted dietary fat from SBO. Greater values of apparent digestibility of AEE at the end of the
ileum than over the entire intestinal tract were observed, and are possibly the result of a net
synthesis of endogenous fat by microbes in the hindgut of pigs. Low values of apparent
digestibility of AEE observed in diets with low dietary AEE concentrations are possibly the
result of the weigh of endogenous microbial fat losses on the AEE output of these diets. Addition
of DDGS-RO to diets with high concentrations of extracted fat from SBO resulted in a quadratic
response of the AID of NDF, and in a reduction of the ATTD of NDF. The high concentration of
91
extracted fat in these diets may increase the transit time of digesta, resulting in the increase of
fermentation time of NDF in the gastrointestinal tract. At low concentrations of dietary fat from
SBO the apparent digestibility of NDF at the terminal ileum and over the entire tract was not
affected by the dietary increase of DDGS-RO.
LITERATURE CITED
Agunbiade, J. A., J. Wiseman, and D. J. A. Cole. 1992. Utilization of dietary energy and
nutrients from soybean products by growing pigs. Anim. Feed Sci. Technol. 36:303-318.
Agunbiade, J. A., J. Wiseman, and D. J. A. Cole. 1999. Energy and nutrient use of palm kernels,
palm kernel meal and palm kernel oil in diets for growing pigs. Anim. Feed Sci. Technol.
80:165-181.
AOAC International. 2007. Official methods of analysis of AOAC Int. 18th ed. Assoc. Off. Anal.
Chem. Int., Gaithersburg, MD.
Azain, M. J. 2001. Fat in swine nutrition. Page 95-105. In Swine Nutrition. 2nd ed. A. J. Lewis
and L. L. Southern, ed. CRC Press New York, NY.
Bach Knudsen, K. E., and I. Hansen. 1991. Gastrointestinal implications in pigs of wheat and oat
fractions. 1. Digestibility and bulking properties of polysaccharides and other major
constituents. Br. J. Nutr. 65:217-232.
Bach Knudsen, K. E., B. B. Jensen, J. O. Andersen, and I. Hansen. 1991. Gastrointestinal
implications in pigs of wheat and oat fractions. 2. Microbial activity in the
gastrointestinal tract. Br. J. Nutr. 65:233-248.
Bach Knudsen, K. E. 1997. Carbohydrate and lignin contents of plant materials used in animal
feeding. Anim. Feed Sci. Technol. 67:319-338.
92
Bakker, G. C. M. 1996. Interaction between carbohydrates and fat in pigs: impact on energy
evaluation of feeds. PhD Diss. Wageningen Agric. Univ., Wageningen, The Netherlands.
Bastianelli, D., D. Sauvant, and A. Rerat. 1996. Mathematical modeling of digestion and nutrient
absorption in the pig. J. Anim. Sci. 74:1873-1887.
Bindelle, J., P. Leterme, and A. Buldgen. 2008. Nutritional and environmental consequences of
dietary fibre in pig nutrition: A review. Biotechnol. Agron. Soc. Environ. 12:69-80.
Cervantes-Pahm, S. K., and H. H. Stein. 2008. Effects of soybean oil and soybean protein
concentration on the concentration of digestible amino acids in soybean products fed to
growing pigs. J. Anim. Sci. 86:1841-1849.
Dégen, L., V. Halas, J. Tossenberger, Cs. Szabó, and L. Babinszky. 2009. The impact of dietary
fiber and fat levels on total tract digestibility on energy and nutrients in growing pigs and
its consequence for diet formulation. Acta Agric. Scand. Sect. A. Anim. Sci. 59:150-160.
Drackley, J. K. 2000. Lipid metabolism. Pages 97-119 in Farm animal Metabolism and
Nutrition. J. P. F. D;Mello, ed. CAB Int. Publ., Wallingford, Oxfordshire, UK.
Eyssen, H. 1973. Role of the gut microflora in the metabolism of lipids and sterols. Proc. Nutr.
Soc. 32:59-63.
Fahey, G. C. Jr., N. R. Merchen, J. E. Corbin, A. K. Hamilton, K. A. Serbe, and D. A. Hirakawa.
1990. Dietary fiber for dogs: II. Iso-total dietary fiber (TDF) additions of divergent fiber
sources to dog diets and their effects on nutrient intake, digestibility, metabolizable
energy and digesta mean retention time. J. Anim. Sci. 68:4229-4235.
Fan, M. Z. and W. C. Sauer. 1997. Determination of true ileal amino acid digestibility in
feedstuffs for pigs with the linear relationships between distal ileal outputs and dietary
inputs of amino acids. J. Sci. Food Agric. 73:189-199.

93
Fenton, T. W. and M. Fenton. 1979. An improved procedure for the determination of chromic
oxide in feed and feces. Can. J. Anim. Sci. 59: 631-634.
Goering, H. K. and P. J. Van Soest. 1970. Forage fiber analyses (apparatus, reagents, procedures,
and some applications). In: Handbook No. 379. USDA-ARS, Washington, DC.
Graham, H., K. Hesselman, and P. Åman 1986. The influence of wheat bran and sugar-beet pulp
on the digestibility of dietary components in a cereal-based pig diet. J. Nutr. 116:242-
251.
Gutierrez, N. A., B. J. Kerr, and J. F. Patience. 2013. Effect of insoluble-low fermentable fiber
from corn-ethanol distillation origin on energy, fiber, and amino acid digestibility,
hindgut degradability of fiber, and growth performance of pigs. J. Anim. Sci. 91:5314-
5325.
Gutierrez, N. A., N. V. L. Serao, B. J. Kerr, R. T. Zijlstra, and J. F. Patience. 2014. Relationships
among dietary fiber components and the digestibility of energy, dietary fiber, and amino
acids and energy content of nine corn coproducts fed to growing pigs. J. Anim. Sci.
92:4505-4517.
Farrell, D. J. 1973. Digestibility by pigs of the major chemical components of diets high in plant
cell-wall constituents. Anim. Prod. 16:43-47.
Jacobs, B. M., J. F. Patience, W. A. Dozier III, K. J. Stalder and B. J. Kerr. 2011. Effects of
drying methods on nitrogen and energy concentrations in pig feces and urine, and poultry
excreta. J. Anim. Sci. 89:2624-2630.
Jaworski, N. 2012. Carbohydrate composition, in vitro digestion, and effects of xylanase and
phytase on nutrient and energy digestibility by pigs in grains and grain coproducts. M.S.
Thesis. Univ. of Illinois, Urbana-Champaign, IL.

94
Jørgensen, H., K. Jakobsen, and B. O. Eggum. 1993. Determination of endogenous fat and fatty
acids at the terminal ileum and on faeces in growing pigs. Acta Agric. Scand. Sect. A.
Anim. Sci. 42:177-184.
Jørgensen, H., X. Q. Zaho, and B. O. Eggum. 1996. The influence of dietary fibre and
environmental temperature on the development of the gastrointestinal tract, digestibility,
degree of fermentation in the hindgut, and energy metabolism in pigs. Br. J. Nutr.
75:365-378.
Just, A., J. O. Andersen, and H. Jørgensen. 1980. The influence of diet composition on the
apparent digestibility of crude fat and fatty acids at the terminal ileum and overall in pigs.
Z. Tierphysiol. Tierernaehr. Futtermittelkde. 44:82-92.
Kil, D. J., T. E. Sauber, D. B. Jones, and H. H. Stein. 2010. Effect of the form of dietary fat and
the concentration of dietary neutral detergent fiber on ileal and total tract endogenous
losses and apparent and true digestibility of fat by growing pigs. J. Anim. Sci. 88:2959-
2967.
Le Goff, G., and J. Noblet. 2001. Comparative digestibility of dietary energy and nutrients in
growing pigs and adult sows. J. Anim. Sci. 79:2418-2427.
Leterme, P., P. van Leeuwen, A. Thewis, and J. Huisman. 1996. Chemical composition of pea
inner fiber isolates and their effect on endogenous digestive secretions in pigs. J. Sci.
Food Agric. 72:127-134.
Low, A. G. 1980. Nutrient absorption in pigs. J. Sci. Food Agric. 31:1087-1130.
Mateos, G. G., J. L. Sell, and J. A. Eastwood. 1982. Rate of food passage (transit time) as
influenced by level of supplemental fat. Poult. Sci. 61:94-100.

95
Morel, P. C. H., T. S. Lee, and P. J. Moughan. 2006. Effect of feeding level, live weight and
genotype on the apparent faecal digestibility of energy and organic matter in the growing
pig. Anim. Feed Sci. Technol. 126:63-74.
Noblet, J. and J. M. Perez. 1993. Prediction of digestibility of nutrients and energy values of pig
diets from chemical analysis. J. Anim. Sci. 71:3389-3398.
Noblet, J. and G. Le Goff. 2001. Effect of dietary fibre on the energy value of feeds for pigs.
Anim. Feed Sci. Technol. 90:35-52.
NRC. 2012. Nutrient Requirements of Swine. 11th rev. ed. Natl. Acad. Press, Washington, DC.
Oresanya, T.F., A.D. Beaulieu and J.F. Patience. 2008. Investigations of energy metabolism in
weanling barrows: The interaction of dietary energy concentration and daily feed
(energy) intake. J. Anim. Sci. 86: 348-363.
San Juan, L. D., and M. J. Villamide. 2000. Nutritional evaluation of sunflower seed and
products derived from them. Effect of oil extraction. Br. Poult. Sci. 41:182-192.
Sanderson, P. 1986. A new method of analysis of feedingstuffs for the determination of crude
oils and fats. In W. Haresign and D. J. A. Cole (ed.) Recent Advances in Animal
Nutrition. Butterworths, London, UK. p. 77-81.
Schneeman, B. O. 1998. Dietary fiber and gastrointestinal function. Nutr. Res. 4:625-632.
Schulze, H., P. van Leeuwen, M. W. A. Verstegen, J. Huisman, W. B. Souffrant, and F. Ahrens.
1994. Effect of level of dietary neutral detergent fiber on ileal apparent digestibility and
ileal nitrogen losses in pigs. J. Anim. Sci. 72:2362-2368.
Souffrant, W. B. 2001.Effect of dietary fiber on ileal digestibility and endogenous nitrogen
losses in the pig. Anim. Feed Sci. Technol. 90:93-102.

96
Shi, X. X., and J. Noblet. 1993. Contribution of the hindgut to digestion of diets in growing pigs
and adult sows: Effect of diet composition. Livest. Prod. Sci. 34:237-252.
Smits, C. H. M., and G. Annison. 1996. Non-starch plant polysaccharides in broiler nutrition –
Towards a physiologically valid approach to their determination. World’s Poult. Sci. J.
52:204-221.
Stein, H. H., C. F. Shipley, and R. A. Easter. 1998. Technical Note: A technique for inserting a
T-cannula into the distal ileum of pregnant sows. J. Anim. Sci. 76:1433-1436.
Stein, H. H., M. L. Gibson, C. Pedersen, and M. G. Boersma. 2006. Amino acid and energy
digestibility in ten samples of distillers dried grain with solubles fed to growing pigs. J.
Anim. Sci. 84:853-860.
Urriola, P. E., D. Hoehler, C. Pedersen, H. H. Stein, and G. C. Shurson. 2009. Amino acid
digestibility of distillers dried grains with solubles, produced from sorghum, a sorghum-
corn blend, and corn fed to growing pigs. J. Anim. Sci. 87:2574-2580.
Urriola, P. E., G. C. Shurson, and H. H. Stein. 2010. Digestibility of dietary fiber in distillers
coproducts fed to growing pigs. J. Anim. Sci. 88:2373-2381.
Urriola, P. E. and H. H. Stein. 2010. Effects of distillers dried grains with solubles on amino
acid, energy, andfiber digestibility and hindgut fermentation of dietary fiber in a corn-
soybean meal diet fed to growing pigs. J. Anim. Sci. 88:1454-1462.
Van Milgen, J. 2006. Nutrient flow models, energy transactions and energy feed systems. In: R.
M. Gous, T. R. Morris, and C. Fisher, editors, Mechanistic modeling in pig and poultry
production. CABI Publishing, Wallingford, Oxfordshire, UK. p. 143-145.

97
Van Soest, P. J. and J. B. Robertson. 1980. Systems of analysis for evaluating fibrous feeds. In:
Workshop Standardization of Analytical Methodology for Feeds, Int. Dev. Res Center,
Ottawa, ON, Canada. Pp. 49-60.
Wilfart, A., L. Montagne, P. H. Simmins, J. Noblet, and J. van Milgen. 2007. Digesta transit in
different segments of the gastrointestinal tract of pigs as affected by insoluble fibre
supplied by wheat bran. Br. J. Nutr. 98:54-62.
Zhu, C. L., M. Rademacher, and C. F. M. de Lange. 2005. Increasing dietary pectin level reduces
utilization of digestible threonine intake, but not lysine intake, for body protein
deposition in growing pigs. J. Anim. Sci. 83:1044-1053.

98
Table 3.1. Ingredient composition (%) of the experimental diets (as-fed basis)1
SBO, % 2 6
Item DDGS-RO, % 0 20 40 0 20 40
Ingredient, %
Corn 81.7 61.7 41.7 77.7 57.7 37.7
RO-DDGS 0.0 20.0 40.0 0.0 20.0 40.0
Casein 12.5 12.5 12.5 12.5 12.5 12.5
Soybean oil 2.0 2.0 2.0 6.0 6.0 6.0
Limestone 1.3 1.3 1.3 1.3 1.3 1.3
Monocalcium phosphate 1.0 1.0 1.0 1.0 1.0 1.0
Chromic oxide 0.5 0.5 0.5 0.5 0.5 0.5
Vitamin premix2 0.2 0.2 0.2 0.2 0.2 0.2
Trace mineral premix3 0.2 0.2 0.2 0.2 0.2 0.2
Salt 0.6 0.6 0.6 0.6 0.6 0.6
Energy and nutrients4 ME, Mcal/kg 3.39 3.33 3.27 3.59 3.54 3.48
SID Lys, % 0.98 1.03 1.08 0.98 1.02 1.07
SID Thr, % 0.61 0.71 0.80 0.61 0.70 0.80
SID Met+Cys, % 0.60 0.70 0.80 0.59 0.69 0.78
SID Trp, % 0.20 0.22 0.23 0.20 0.21 0.23 1SBO = soybean oil; DDGS-RO = reduced oil distillers dried grains with solubles.
2Provided per kilogram of complete diet: 6,614 IU of vitamin A; 827 IU of vitamin D; 26 IU
of vitamin E; 2.6 mg of vitamin K; 29.8 mg of niacin; 16.5 mg of pantothenic acid; 5.0 mg of
riboflavin; 0.023 mg of vitamin B12.
3Provided per kilogram of complete diet: Zn, 165 mg as ZnSO4; Fe, 165 mg as FeSO4; Mn,
39 mg as MnSO4; Cu, 17 mg as CuSO4; I, 0.3 mg as Ca(IO3)2; and Se, 0.3 mg as Na2SeO3.
4Values were calculated (NRC, 2012). SID = standardized ileal digestible.

99
Table 3.2. Analyzed nutrient composition of the experimental diets (as-fed basis)1
SBO, % 2 6
Item DDGS-RO, % 0 20 40 0 20 40 DM, % 89.1 88.0 89.5 89.2 89.8 89.5
GE, Mcal/kg 3.98 4.08 4.18 4.18 4.33 4.42
AEE, % 4.4 5.7 6.3 8.4 9.1 10.1
Starch, % 51.1 39.2 27.2 48.6 36.7 24.7
ADF, % 2.4 3.4 4.6 2.2 3.4 4.5
NDF, % 6.9 11.0 14.6 6.8 9.7 14.0
CP 17.9 21.8 25.7 17.5 21.4 25.4
Indispensable AA
Arg 0.7 0.8 1.0 0.6 0.8 1.0
His 0.5 0.6 0.8 0.5 0.6 0.8
Ile 0.9 1.0 1.2 0.9 1.0 1.2
Leu 2.0 2.3 2.8 1.9 2.3 2.9
Lys 1.2 1.3 1.4 1.1 1.2 1.5
Met 0.5 0.5 0.6 0.5 0.5 0.6
Phe 1.0 1.1 1.3 0.9 1.1 1.3
Thr 0.8 0.9 1.0 0.7 0.9 1.1
Trp 0.2 0.2 0.3 0.2 0.2 0.3
Val 1.1 1.3 1.5 1.1 1.2 1.5
Dispensable AA2 Mean 10.1 11.6 13.3 11.2 13.5 10.1
All AA3 18.9 21.7 25.1 21.0 25.6 18.9 1SBO = soybean oil; DDGS-RO = reduced oil distillers dried grains with solubles; AEE =
acid hydrolyzed ether extract; TDF = total dietary fiber.
2Sum of all dispensable AA.
3Sum of all indispensable and dispensable AA.

100
Table 3.3. Apparent ileal and total tract digestibility of determined traits in experimental diets1,2
SBO, % 2 6 P-value
Item DDGS-RO, % 0 20 40 0 20 40
Pooled SEM SBO
DDGS-RO
SBO x DDGS-RO
AID, %
GE 80.6a 73.3cb 70.0c 84.0a 74.3b 70.1c 0.96 0.046 <0.001 0.178
DM 80.2a 71.1b 66.1c 83.4a 71.4b 65.0c 0.96 0.325 <0.001 0.076
NDF 32.5b 26.8b 25.3b 46.4a 21.7b 22.4b 3.12 0.389 <0.001 0.002
AEE 72.5c 75.9bc 79.1b 83.5a 83.4a 83.9a 1.05 <0.001 0.005 0.011
ATTD, %
GE 87.8a 84.0b 80.0c 88.3a 84.3b 80.0c 0.48 0.509 <0.001 0.813
DM 88.3a 83.8b 79.0c 88.7a 83.9b 78.3c 0.46 0.892 <0.001 0.424
NDF 47.3ab 48.7ab 45.5bc 52.0a 45.7abc 40.9c 2.28 0.451 <0.001 0.009
AEE 62.6d 67.6c 71.6b 77.5a 77.0a 80.4a 1.30 <0.001 <0.001 0.008
AID of AA, %
Arg 84.2ab 81.9b 83.2b 87.0a 82.4b 83.2ab 1.06 0.061 0.001 0.145
His 87.1a 82.8b 83.1b 89.5a 82.6b 83.1b 0.99 0.160 <0.001 0.107
Ile 87.6a 82.5b 81.8b 88.9a 82.9b 83.3b 0.67 0.015 <0.001 0.539
Leu 90.1a 87.0b 87.5b 91.3a 86.9b 87.7b 0.73 0.239 <0.001 0.435
Lys 88.9a 85.2b 84.6b 90.2a 84.3b 84.7b 0.82 0.629 <0.001 0.127
Met 92.8b 90.0c 89.6c 93.7a 90.1c 90.1c 0.44 0.008 <0.001 0.223
Phe 90.1a 86.9b 87.3b 91.2a 86.6b 87.3b 0.79 0.588 <0.001 0.390
Thr 81.4a 75.4b 74.6b 82.8a 74.7b 75.6b 1.18 0.371 <0.001 0.434
Trp 89.2a 84.6b 84.4b 90.7a 83.7b 84.4b 1.04 0.754 <0.001 0.242
Val 86.7a 81.7b 81.7b 87.9a 81.8b 82.4b 0.86 0.191 <0.001 0.665
Indispensable3 88.1a 84.0b 84.1b 89.4a 83.9b 84.4b 0.81 0.253 <0.001 0.388

101
Table 3.3 (continued)
Dispensable4 84.9a 80.9b 80.0b 87.5a 81.0b 80.8b 1.02 0.052 <0.001 0.256
All AA5 86.4a 82.4b 82.0b 88.4a 82.4b 82.5b 0.88 0.096 <0.001 0.274 a,b,c,d Means within a row lacking a common superscript letter are different (P < 0.05).
1Least squares means of 9 pigs per diet.
2SBO = soybean oil; DDGS-RO = reduced oil distillers dried grains with solubles; AEE = acid hydrolyzed ether extract.
3Average AID for all indispensable AA.
4Average AID for all dispensable AA.
5Average AID for all AA (indispensable and dispensable).

102
Table 3.4. Digestible and metabolizable energy value of diets1,2
SBO, % 2 6 P-value
Item DDGS-RO, % 0 20 40 0 20 40 Pooled SEM SBO DDGS-RO SBO*DDGS-RO
As-fed basis, Mcal/kg
DE 3.49cb 3.43c 3.34d 3.69a 3.65a 3.53b 0.020 <0.001 <0.001 0.639
ME 3.37b 3.28c 3.17d 3.57a 3.49a 3.35cb 0.019 <0.001 <0.001 0.617 a,b,cMeans within a row lacking a common superscript letter are different (P < 0.05).
1 Least squares means of 9 pigs per diet.
2SBO = soybean oil; DDGS-RO = reduced oil distillers dried grains with solubles.
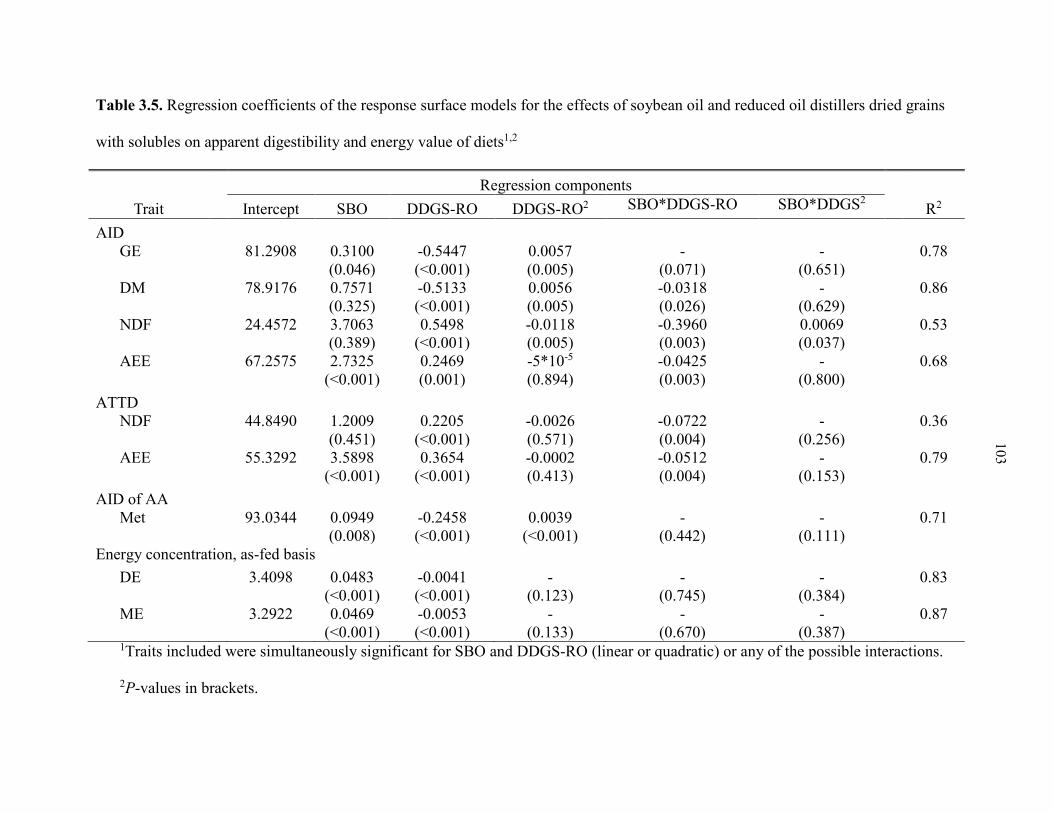
103
Table 3.5. Regression coefficients of the response surface models for the effects of soybean oil and reduced oil distillers dried grains
with solubles on apparent digestibility and energy value of diets1,2
Regression components
Trait Intercept SBO DDGS-RO DDGS-RO2 SBO*DDGS-RO SBO*DDGS2 R2
AID GE
81.2908
0.3100 (0.046)
-0.5447 (<0.001)
0.0057 (0.005)
- (0.071)
- (0.651)
0.78
DM
78.9176
0.7571 (0.325)
-0.5133 (<0.001)
0.0056 (0.005)
-0.0318 (0.026)
- (0.629)
0.86
NDF
24.4572
3.7063 (0.389)
0.5498 (<0.001)
-0.0118 (0.005)
-0.3960 (0.003)
0.0069 (0.037)
0.53
AEE
67.2575
2.7325 (<0.001)
0.2469 (0.001)
-5*10-5 (0.894)
-0.0425 (0.003)
- (0.800)
0.68
ATTD
NDF
44.8490
1.2009 (0.451)
0.2205 (<0.001)
-0.0026 (0.571)
-0.0722 (0.004)
- (0.256)
0.36
AEE
55.3292
3.5898 (<0.001)
0.3654 (<0.001)
-0.0002 (0.413)
-0.0512 (0.004)
- (0.153)
0.79
AID of AA
Met
93.0344
0.0949 (0.008)
-0.2458 (<0.001)
0.0039 (<0.001)
- (0.442)
- (0.111)
0.71
Energy concentration, as-fed basis DE
3.4098
0.0483 (<0.001)
-0.0041 (<0.001)
- (0.123)
- (0.745)
- (0.384)
0.83
ME
3.2922
0.0469 (<0.001)
-0.0053 (<0.001)
- (0.133)
- (0.670)
- (0.387)
0.87
1Traits included were simultaneously significant for SBO and DDGS-RO (linear or quadratic) or any of the possible interactions.
2P-values in brackets.

104
Fig. 3.1 Response surface for the effects of the dietary soybean oil (SBO) and reduced oil
distillers dried grains with solubles (DDGS-RO) on the apparent ileal (AID; A) and total tract
digestibility (ATTD; B) of acid hydrolyzed ether extract (AEE) in growing pigs (n = 9).

105
Fig. 3.2 Response surface for the effects of the dietary soybean oil (SBO) and reduced oil
distillers dried grains with solubles (DDGS-RO) on the apparent ileal (AID; A) and total tract
digestibility (ATTD; B) of NDF in growing pigs (n = 9).

106
CHAPTER 4: RELATIONSHIPS AMONG DIETARY FIBER COMPONENTS AND
THE DIGESTIBILITY OF ENERGY, DIETARY FIBER, AND AMINO ACIDS, AND
ENERGY CONTENT OF 9 CORN CO-PRODUCTS FED TO GROWING PIGS1
A paper published in 2014 in the Journal of Animal Science
J. Anim. Sci. 2014.92:4505–4517
doi:10.2527/jas2013-7265
N. A. Gutierrez,* N. V. L. Serão,* B. J. Kerr,† R. T. Zijlstra,‡ and J. F. Patience*2
*Department of Animal Science, Iowa State University, Ames, IA; †USDA-ARS-National
Laboratory for Agricultural and the Environment, Ames, IA;‡Department of Agriculture, Food
and Nutritional Science, University of Alberta, Edmonton, AB T6G 2P5, Canada.
_____________________
1 Financial support for this research was provided on behalf of the National Pork Board
and Dakota Gold Research Foundation. Mention of a trade name, proprietary product, or specific
equipment does not constitute a guarantee or warranty by Iowa State University, the University
of Alberta, or the USDA and does not imply approval to the exclusion of other products that may
be suitable. The USDA is an equal opportunity provider and employer.
2Corresponding author: [email protected]

107
ABSTRACT
An experiment was conducted to determine a best fitting dietary fiber component to
estimate the effect of dietary fiber concentration on the digestibility of energy, dietary fiber, and
AA, and energy value of 9 corn co-products: corn bran (CB; 37.0% total non-starch
polysaccharides (NSP)), corn bran with solubles (CB-S; 17.1% NSP), cooked corn distillers
dried grains with solubles (DDGS-CV; 20.4% NSP), reduced oil DDGS (DDGS-RO; 25.0%
NSP), uncooked DDGS (DDGS-BPX; 22.0% NSP), high protein distillers dried grains (HP-
DDG; 21.9% NSP), dehulled degermed corn (DDC; 1.1% NSP), corn germ meal (CGmM;
44.4% NSP), and corn gluten meal (CGnM; 4.9% NSP). A total of 20 growing pigs (initial BW:
25.9 ± 2.5 kg) were fitted with a T-cannula in the distal ileum and allotted to 10 dietary treatment
groups in a 4-period incomplete block design with 8 observations per treatment. Treatments
included a corn-soybean meal based basal diet and 9 diets obtained by mixing 70% of the basal
diet with 30% of the test ingredient. In tested ingredients, 11 dietary fiber components were
determined: 1) ADF; 2) NDF; 3) TDF; 4) hemicellulose; 5) total NSP; 6) NSP arabinose; 7) NSP
xylose; 8) NSP mannose; 9) NSP glucose; 10) NSP galactose; 11) arabinoxylan. The apparent
ileal (AID) and total tract digestibility (ATTD) of GE, DM, NDF and the AID of AA of
ingredients were measured. A single best fitting dietary fiber component was assessed and
ranked for each trait, showing that arabinoxylan concentration best explained variance in AID of
GE (R2=0.65; cubic, P<0.01) and DM (R2=0.67; cubic, P<0.01). The NSP xylose residue best
explained variance in ATTD of GE (R2=0.80; cubic, P<0.01), DM (R2=0.78; cubic, P<0.01), and
NDF (R2=0.63; cubic, P<0.01); AID of Met (R2=0.40; cubic, P=0.02), Met+Cys (R2=0.44;
cubic, P=0.04), and Trp (R2=0.11; cubic, P=0.04); and DE (R2=0.66; linear, P=0.02) and ME
(R2=0.71; cubic, P=0.01) values. The AID of Lys was not predictable (P > 0.05) from the dietary

108
fiber concentration. In conclusion, the arabinoxylan and NSP xylose residue were the dietary
fiber components that best explained variation due to dietary fiber concentration and, with the
exception of AID of Lys, can be used to predict the digestibility of energy and dietary fiber, and
the DE and ME values in corn co-products.
Keywords: Corn co-products, dietary fiber, digestibility, energy, pig
109
INTRODUCTION
Corn co-products are typically rich in dietary fiber with widely variable concentrations of
starch, AA, and fat. Knowledge of the concentration and composition of dietary fiber of feed
ingredients is of critical importance, because dietary fiber may reduce AA and energy
digestibility (Farrell, 1973; Noblet and Perez, 1993; Souffrant, 2001). The dietary fiber in corn
and co-products is highly resistant to fermentation, and is largely constituted of insoluble non-
starch polysaccharides, such as cellulose, arabinoxylans, and lignin (Bach Knudsen, 1997;
Jaworski, 2012). These polysaccharides are mainly polymers of hexoses (D-glucose, D-
galactose, D-mannose) and pentoses (L-arabinose, D-xylose) joined through glycosidic linkages.
Common assays to determine the dietary fiber concentration of a feed ingredient include crude
fiber, ADF, and NDF. Classification by differences in solubility in acid and alkali, or in neutral
and acid detergents lacks precision with respect to chemical composition of dietary fiber and
biological function. Therefore, the nutritional relevance of values obtained using these methods
in monogastric nutrition is questionable (Choct, 1997). The analysis for total non-starch
polysaccharides (NSP), and its monosaccharide residues, may be a tool to better explain the
effect of the dietary fiber concentration on the nutritional value of corn co-products.
Advances in the ethanol industry increase the efficiency of starch and oil extraction from
the corn grain, resulting in continuous changes in chemical composition of corn co-products,
which present a challenge to estimate their nutritional value. Fairbairn et al. (1999) reported that
NDF or ADF alone accounted for 68% and 85% of the total variation in DE content of barley,
respectively. However, a comprehensive analysis of the effects of dietary fiber concentration on
the nutrient value of corn co-products is unavailable.

110
In the present study, 9 corn co-products were selected to cover a wide range in dietary
fiber concentration. The objective of the study was to determine a best fitting dietary fiber
component to measure the effect of dietary fiber concentration on the variation in digestibility of
energy, dietary fiber, and AA, and on energy values in corn co-products.
MATERIALS AND METHODS
The experimental protocol was reviewed and approved by the Institutional Animal Care
and Use Committee at Iowa State University (9-10-7024-S).
Animals, Housing, and Experimental Design
Twenty growing barrows (progeny of sire line 337 × dam line C-22, PIC, Hendersonville,
TN) were housed in individual pens (1.2 × 1.2 m) equipped with a feeder, a cup waterer, and a
half-slatted concrete floor in an environmentally controlled building. All pigs were surgically
fitted with a T-cannula in the distal ileum following procedures described by Stein et al. (1998).
After recovery from surgery, pigs were weighed (initial BW = 25.9± 2.5 kg) and randomly
allotted to 10 dietary treatment groups in a 4-period incomplete block design, resulting in 8
experimental units per treatment. Pigs were not allowed to repeat dietary treatments across
periods. Each collection period involved a 9 d of adaptation to dietary treatments followed by 2 d
of feces sub-sample collection and 3 d of ileal digesta sub-sample collection.
Dietary Treatments
Dietary treatments included a corn-soybean meal basal diet (Table 4.1) that was
formulated to meet or exceed the nutrient requirements of growing pigs (NRC, 1998). Nine
additional experimental diets were obtained by mixing 70% of the basal diet and 30% of the corn
co-product to be tested. Corn co-products evaluated in the experiment included corn bran with

111
solubles (CB-S; Poet Nutrition, Glenville, MN), corn bran (CB; Lifeline Foods, St. Joseph, MO),
cooked DDGS (DDGS-CV; Hawkeye Renewables, Iowa Falls, IA), reduced oil DDGS (DDGS-
RO; Hawkeye Renewables, Iowa Falls, IA), uncooked DDGS (DDGS-BPX; Poet Nutrition,
Hanlontown, IA), high protein distillers dried grains (HP-DDG; Poet Nutrition, Glenville, MN),
dehulled-degermed corn (DDC; Bunge North America, Atchison, KS), corn germ meal (CGmM;
Cargill, Eddyville, IA), and corn gluten meal (CGnM; Cargill, Eddyville, IA). Diets also
contained 0.55% Cr2O3 as an inert marker. All pigs received the same daily amount of feed,
which was provided at a level of approximately 90% of predicted ad libitum intake of the basal
diet. The daily feed allowance was divided into 2 equal meals provided at 0700 and 1600 h. At
the end of each collection period, all pigs were weighed and daily feed allowance for the next
collection period was adjusted.
Sample Collection
After 9 d of adaptation to the diet, feces were collected via grab sampling on d 10 and 11,
and stored at -20°C. On d 12, 13, and 14, ileal digesta samples were collected for 8 h by
attaching a 207-mL plastic bag (Whirl-Pak, Nasco, Fort Atkinson, WI) to the opened cannula
with a cable tie. Bags were removed whenever they were filled with digesta or at least every 30
min, and stored at -20°C to prevent bacterial degradation. At the conclusion of each experimental
period, frozen ileal and fecal samples were allowed to thaw at room temperature and pooled
within animal, with a sub-sample collected for chemical analysis. Ileal sub-samples were
lyophilized before chemical analysis. Fecal sub-samples were oven dried in a convection oven at
65°C to constant weight (Jacobs et al., 2011). After drying, feed, ileal, and fecal sub-samples
were ground through a 1 mm screen before chemical analysis.
Chemical Analysis

112
Samples of diets and feed ingredients were analyzed for DM (method 930.15; AOAC
Int., 2007), ether extract (EE; method 920.39; AOAC Int., 2007), starch (method 996.11; AOAC
Int., 2007), ADF (Goering and Van Soest, 1970), NDF (van Soest et al., 1979), total dietary fiber
(TDF; method 985.29; AOAC Int., 2007), and N (method 968.06; AOAC Int., 1990). Crude
protein was calculated as N × 6.25 and Gly was used as the calibration standard (N content
18.7%, Fisher Scientific, Fair Lawn, NJ), and was determined to contain 18.7 ± 0.2% N. The 9
ingredients were analyzed for total constituent monosaccharides in NSP and insoluble NSP by
GLC (Englyst and Hudson, 1987). Ileal digesta and fecal samples were also analyzed for DM,
NDF, and N. The GE of diets, feed ingredients, ileal digesta, and feces was analyzed by bomb
calorimetry (Parr 6200 calorimeter, Parr Instruments Co., Moline, IL). Benzoic acid (6318 kcal
GE/kg; Parr Instruments, Moline, IL) was used as the standard for calibration and was
determined to contain 6324 ± 9.8 kcal GE/kg. Diets, feed ingredients, and ileal digesta were
analyzed for AA (University of Missouri Agriculture Experiment Station Chemical Laboratories,
Columbia, MO) according to method 982.30 E (a, b, c); AOAC, 2007. Chromic oxide was
determined in diets, ileal digesta, and fecal sub-samples using the method of Fenton and Fenton
(1979) and absorption was measured at 440 nm using a spectrophotometer (Synergy 4, BioTek,
Winooski, VT). Chromic oxide standard samples were assayed to confirm the accuracy of the
analytical procedure, and a recovery of 100.8 ± 1.95% was attained.
Calculations
For each dietary treatment, the AID and ATTD of DM, GE, and NDF, and the AID of
AA were calculated using the index method (Oresanya et al., 2008). The difference procedure
was used to calculate the AID and ATTD of DM, GE, and NDF, and the AID of AA of each
ingredient (Adeola 2001). The DE value was determined by multiplying the GE by the observed
113
ATTD of GE of the ingredient, and the ME was estimated from the calculated DE and CP of the
ingredient (Noblet and Perez, 1993).
Effects of dietary fiber concentration in feed ingredients were determined using 11
different dietary fiber components: 1) ADF; 2) NDF; 3) TDF; 4) hemicellulose (Hemi = NDF-
ADF); 5) total NSP; concentrations of 5 monosaccharide residues that can be detected in NSP,
namely: 6) NSP arabinose; 7) NSP xylose; 8) NSP mannose; 9) NSP glucose; 10) NSP galactose;
10) arabinoxylan (Ara + Xyl); and 11) total NSP (sum of monosaccharide residue in NSP).
Traits were grouped into 4 categories to simplify statistical analysis of data as follows: 1)
apparent ileal digestibility (AID), including AID of DM, GE, and NDF; 2) apparent total tract
digestibility (ATTD), including ATTD of DM, GE, and NDF; 3) AID of AA, including AID of
Lys, Thr, Met, Met + Cys, Trp, and average of all dispensable and all indispensable AA; and 4)
energy concentration, including DE and ME values.
Statistical Analyses
Analysis of Ingredient and Normality Test. The data were analyzed in a mixed model
including the fixed effect of Ingredient (Ingred) and the random effects of period and pig,
following the model:
����� = � + � + � + �� + ���(�)� (Eq. 1)
Where Yijkl is the observed values for the trait; µ is the overall mean; τi is the effect of the
ith ingredient (i = 1 to 9); Pj is the effect of the jth period (j = 1 to 4, [0,σp2]); Ak is the effect of the
kth experimental unit (k = 1 to 20, [0,σa2]); and eij(k)l is the random error associated with Yijkl (l = 2
to 4, [0,σe2]).

114
Studentized residuals were generated from Eq. 1 and used to test normality. Outliers were
removed until the Shapiro-Wilk’s test reached P>0.05 and studentized residual fell within ± 3σ.
The effect of Ingred was tested including the Kenward-Roger degrees-of-freedom
approximation. Least squares means for Ingred were estimated and compared using the Tukey-
Kramer adjustment. The effect of Ingred and multiple comparison differences were deemed
significant at P < 0.05.
Analysis of Dietary Fiber Concentration in Ingredients. An alternative method was
proposed by including the effect of dietary fiber concentration of the ingredient in the model.
The eleven different dietary fiber components were evaluated using a modified version of Eq. 1.
In this alternative model the linear, quadratic, and cubic effects of dietary fiber concentration
instead of Ingred were included, following the model:
����� = � + ���� + ����� + ����
� + � + �� + ���(�)� (Eq. 2)
Where Yijkl,µ, Pj, Ak, and eij(k)l are the same as defined in Eq. 1; β1, β2, and β3 are the
linear, quadratic, and cubic effects associated with the dietary fiber concentration terms Xi, Xi2,
and Xi3, respectively.
Comparison between Fiber Models and Ingredient. The goodness-of-fit of Eq. 2 was
assessed for all dietary fiber components to identify the dietary fiber component that best fits the
trait categories, and then compared to the model fit using Ingred (Eq. 1). The Akaike information
criterion (AIC) was used to measure the goodness-of-fit of these models. The AIC values were
calculated using maximum-likelihood estimation in order to compare models with different fixed
effects (Bolker et al., 2009)

115
The best fitting dietary fiber component, i.e. the dietary fiber model that resulted in the
lowest AIC statistics within a trait category, was obtained by ranking the AIC values of each trait
within category. The overall fit of the eleven dietary fiber components within category was
assessed as the average ranking of the assays. The assay showing the best fit within category was
then compared to the goodness-of-fit when using Ingred for each trait.
Regression Equations of the Best Dietary Fiber Component and Loss of Predictability.
The linear, quadratic, and cubic effects of dietary fiber concentration in Eq. 2 were tested for and
kept in the model according to the significance of the highest order term. To assess the loss in
predictability of the dietary fiber concentration models compared to the Ingred, the residuals
obtained from Eq. 2 were further analyzed including only the fixed effect of Ingred in the model
without the intercept. The variance explained by the dietary fiber concentration using the best
fitting dietary fiber component in Eq. 2 was compared to the variance explained by Ingred using
the marginal coefficient of determination (R2) for linear mixed-models (R2LMM(m); Nakagawa and
Schielzeth, 2013), as:
����(�)� =
���
������
��������
� (Eq. 3)
Where σf2 is the variance calculated from the fixed effect (concentration of the best fitting
dietary fiber component) components (Snijders and Bosker, 1999), whereas σp2, σa
2, and σe2 are
the period, experimental unit, and residual variances. For simplicity, R2LMM(m) will hereafter be
referred to as R2fiber. Similarly, the variance due to Ingred (σi
2) was calculated on the residuals of
Eq. 2 and computed an R2 using the same variance components as in Eq. 3 but σf2, as:
��� !"#�"�$� =
�%�
������
����� (Eq. 4)
116
The advantage of this sequential approach is that it measures the variance explained by
Ingred on the portion of the variance not explained by the dietary fiber concentration, allowing
the direct comparison of these two R2. The loss in predictability of the dietary fiber concentration
in place of the Ingred was computed as R2Ingred/(R2
Ingred+ R2fiber). All statistical analyses were
performed using SAS 9.3 (Statistical Analysis System Institute, Inc., Cary, NC).
RESULTS AND DISCUSSION
Nutrient composition of corn co-products
All pigs were successfully cannulated at the distal ileum and recovered from surgery
without complications. Corn co-products came from the same source, but different batches, as in
Anderson et al. (2012), and the analyzed composition was similar (Table 4.2). Extensive
variation in nutrient composition was observed among ingredients, reflecting the diversity of the
selected co-products and the manufacturing processes used.
The NDF and TDF concentration of DDGS was close to values reported in the literature
(Stein et al., 2006; Anderson et al., 2012; NRC, 2012), and was similar to the NDF and TDF
concentration in HP-DDG. The concentration of NDF and TDF in HP-DDG was expected to be
less than in the 3 sources of DDGS, because the bran is separated from the corn kernel during
HP-DDG production. However, the bran may have been added back to the HP-DDG after
production, which is supported by the higher concentration of NSP glucose residue in HP-DDG
than in the 3 sources of DDGS, because bran is rich in cellulose and therefore has a high
concentration of NSP glucose. The NDF concentration in HP-DDDG was similar to values
117
reported in NRC (2012), but have been shown to range from 16 to 41% depending on the
manufacturing process used (Widmer et al., 2007; Robinson et al., 2008; Kim et al., 2011). The
dietary fiber concentration varied among similar co-products such as CB-S and CB. In CB-S,
solubles remaining from the corn-ethanol distillation process were added to the corn bran, and
the NDF and TDF concentration were half of previously reported values for corn bran without
solubles (Sauvant et al., 2004; Anderson et al., 2012). The NDF concentration of CGmM
(46.2%) and CGnM (12.1%) was similar to previously reported values (Almeida et al., 2011;
Anderson et al., 2012; NRC, 2012). The NDF concentration in CGnM was, however, greater
than values reported by Sauvant et al. (2004) and NRC (2012).
In theory, TDF should be higher than NDF because soluble dietary fiber components are
lost in NDF due to solubilisation with the neutral detergents. The TDF to NDF ratio in CB, CB-
S, and DDGS-CV was 1.05, 1.11, and 1.03 respectively, but in the remaining 6 ingredients
ranged from 0.61 in DDC to 0.95 in CGmM. Urriola et al. (2010) reported lesser TDF than NDF
values in 8 sources of corn-DDGS, with TDF to NDF ratios ranging from 0.79 to 0.91. In corn
and co-products, however, most of the dietary fiber is insoluble and a reasonable relative
agreement between NDF and TDF is expected as they are supposed to measure the same
chemical entities. Although only 3 ingredients showed greater TDF than NDF concentrations,
values of TDF and NDF were similar overall in the present study, with the exception of DDC.
Comparable differences between TDF and NDF values have been previously documented. The
TDF to NDF ratios reported by Anderson et al. (2011) for CB (0.94), CB-S (1.06), DDGS (0.79
to 1.07), HP-DDG (0.66 to 0.98), CGnM (0.75), and DDC (0.61), agree with the TDF and NDF
values and variation reported in the present study. Likewise, Campbell et al. (1997) reported
differences between TDF and NDF concentrations in feed ingredients with high concentration of

118
insoluble dietary fiber such as corn bran (0.90), rice bran (0.94), peanut hulls (0.97), and solka
floc (1.07).
Total NSP values were lower but followed the same concentration pattern as NDF and
TDF values, with the exception of CGmM. The NSP to TDF ratio ranged from 0.48 in DDC to
0.87 in CB, but was 1.01for CGmM. Total NSP values were expected to be lower than TDF
values because lignin is included in the latter. However, similar variation in NSP to TDF ratios
was observed in feed ingredients rich in insoluble dietary fiber content, with NSP to TDF ratios
of 0.52, 0.55, 0.61, and 0.75 for solka floc, peanut hulls, corn bran, and rice bran respectively
(Campbell et al., 1997).
The inconsistency between expected and observed NDF, TDF, and NSP ratios reported in
the literature, and in the present study, may be caused by differences in the nature of the
analytical procedures used (acid and neutral detergents, enzymatic-gravimetric, enzymatic-
chemical etc.). For example, TDF values determined in feed ingredients rich in insoluble dietary
fiber by Prosky-TDF (enzymatic-gravimetric; Prosky et al., 1985) or Uppsala-TDF (enzymatic-
chemical; Theander et al., 1994), showed differences between the two TDF values in corn bran
(53.5 vs. 42.8), rice bran (17.2 vs. 21.3), peanut hulls (76 vs. 73.4), or solka floc (96.2 vs. 43;
Campbell et al., 1997). Discrepancies may be exacerbated by low dietary fiber concentration in
the feed ingredient, as observed in DDC.
The analysis of monosaccharide residues of NSP indicated that glucose was the most
prevalent residue, followed by xylose, arabinose, galactose, and mannose. Insoluble
monosaccharide residues composed the majority of total NSP in all 9-corn co-products. In
DDGS-RO, CGmM, and CGnM, however, about a third of total NSP were soluble. The total
NSP, monosaccharide residues of NSP, and insoluble NSP observed for DDGS in the present

119
study agree with the concentrations reported by Widyaratne and Zijlstra (2007). The
monosaccharide composition relates structurally to the polysaccharides forming the NSP of corn
co-products, such as arabinoxylans, cellulose, and galactomannans (Bach Knudsen, 1997; Choct,
2002).
The CP (7.5 to 59.5%) and AA concentrations varied among corn co-products, with
CGnM exhibiting the greatest values for CP and each AA, contrasting with CB-S, CB, and DDC
(Table 4.3). As expected, the AA concentrations in HP-DDG were greater than in DDGS, and in
agreement with data published for HP-DDG (Widmer et al., 2007; Kim et al., 2011; NRC, 2012).
The range in AA composition noted for DDGS was also similar to data published in the literature
(Spiehs et al., 2002; Almeida et al., 2011; NRC, 2012). In CGmM and CGnM, the CP (20.6 and
59.5%, respectively) and AA concentrations were close to expected values (Almeida et al., 2011;
NRC, 2012).
Apparent Ileal Digestibility of Traits and Energy Concentrations
The AID and ATTD of GE and DM differed (P < 0.05) among ingredients (Table 4.4).
Because most of the DM in DDC and in CGnM is starch and protein, respectively, the AID of
GE and DM were the greatest (P < 0.05) among all ingredients. The AID of GE and DM were
similar (P > 0.05) in the 4 sources of DDGS and both corn brans.
As expected, the ATTD of GE in both DDC (99.6%) and CGnM (91.6%) were the
greatest (P < 0.05). In contrast, the ATTD of GE and DM in CB-S and CB were the lowest, but
similar to the observed AID values, meaning that both ingredients were highly resistant to
hindgut fermentation. The observed ATTD of GE and DM of DDGS, CGmM and CGnM are in
agreement with values reported previously (Stein et al., 2006; Rojas and Stein, 2013). The ATTD
of GE and DM of HP-DDG were, however, less than values obtained previously for HP-DDG
120
(Widmer et al., 2007; Kim et al., 2009), which may be explained by the greater dietary fiber
concentration caused by the added bran in the HP-DDG used in this study.
The apparent digestibility of NDF, on the other hand, did not differ at the ileal level (P =
0.11), but differed (P < 0.05) at the total tract level among ingredients. The difference between
AID and ATTD of NDF values observed for the 3 DDGS sources indicated that approximately
18% of the NDF was fermented in the hindgut, which is in agreement with data reported by
Urriola et al. (2010). In CB-S and CB, however, values of ATTD of NDF were lower than AID
values. Unreliable values of AID of TDF have been previously reported in wheat bran (Graham
et al., 1986; Jorgensen et al., 1996) and in low and medium fiber diets (Wilfart et al., 2007),
which was attributed to a combination of sampling or analytical errors and the relatively high
variability of results. Partial separation of dietary fiber components and Cr2O3 as they flow
through the digestive tract may also negatively affect the reliability of estimation of dietary fiber
digestibility (Graham and Åman, 1986). Additionally, the ATTD of NDF in DDC (136.8%)
largely surpassed 100%. It is very difficult to accurately estimate the AID and ATTD of a
nutrient present in low concentrations in the tested ingredient, because the nutrient value is
calculated by difference, and the analytical methods may not be precise enough to determine
small nutrient concentrations.
The observed AID of all indispensable AA differed (P < 0.05) among ingredients. Values
of AID of indispensable AA in DDGS determined in the present experiment were close to
previously published data (Stein et al., 2006; Urriola et al., 2009; NRC, 2012). For CGmM and
CGnM, the AID of indispensable AA concurs with previously published values (Almeida et al.,
2011; NRC, 2012), but are slightly less than European values (Sauvant et al., 2004).
Additionally, the AID of indispensable AA in HP-DDG are less than values reported by Widmer

121
et al. (2007) and Kim et al. (2009), which may be a consequence of the previously reported
variability in nutrient composition of different sources of HP-DDG.
The observed DE and ME values differed (P < 0.05) among ingredients (Table 4.5). The
DE and ME values were greatest (P < 0.05) for DDC and CGnM, because of their low dietary
fiber and high concentrations of starch and CP, respectively. In contrast, the high dietary fiber
concentration in CB, in addition to its low starch and EE, resulted in DE and ME to be less (P <
0.05) than the rest of corn co-products. The high EE concentration in CB-S, on the other hand,
caused its DE and ME content to be greater (P < 0.05) than in CB, and similar to CGmM. The
DE and ME of HP-DDG were similar to the values for DDGS-CV and DDGS-BPX. The lower
EE in DDGS-RO resulted in DE and ME to be less (P < 0.05) than in DDGS-CV. Anderson et
al. (2011) determined the DE and ME content on different batches of the same corn co-product
sources, but values were greater for CB-S, CB, DDGS-RO, HP-DDG, and CGmM. The
discrepancy in DE and ME may originate from the fact that values in Anderson et al. (2011)
were obtained by total collection of urine and feces from finishing gilts, whereas values in the
present study were obtained by grab sampling of feces from growing pigs fed diets formulated
with Cr2O3 as an inert marker. Values of DE and ME observed in the present trial, however,
agree with values available in the literature for CB (Sauvant et al., 2004), DDGS-CV (Stein et
al., 2006; Pedersen et al., 2007), DDGS-BPX, DDC, and CGnM (Anderson et al., 2011), HP-
DDG and CGmM (NRC, 2012).
Best Fitting Fiber Component by Trait Categories
A best fitting dietary fiber component that better explain variation due to dietary fiber
concentration was determined for each trait. The goodness-of-fit of the 11-selected fiber
components for each trait was assessed and ranked, showing that the variation in AID and ATTD

122
traits, DE, and ME of corn co-products was best explained by the concentration of
monosaccharide residues in NSP, predominantly xylose and arabinose, and their polymer
arabinoxylan (Table 4.6). This finding suggests that the monosaccharide composition of dietary
fiber in corn co-products, which is ultimately defined by the polysaccharides they form, is a
better predictor of the nutrient value of the ingredient than commonly used dietary fiber assays
such as ADF, NDF, and TDF.
In corn and its co-products, polymers of glucose and xylose are the most abundant NSP,
organized mainly in the form of cellulose and arabinoxylans, respectively (Bach Knudsen, 1997;
Bach Knudsen, 2001). Cellulose is a glucose polymer, and is the most abundant polysaccharide
in corn cell walls. In spite of its high concentration in NSP, glucose was the best model fit for
ATTD of NDF only. The effect of glucose concentration on ATTD of NDF may be related to the
highly organized structure of the cellulose polymer which is inaccessible to water. Thus,
cellulose is usually less degraded than arabinoxylans in cereals, but with a wide variability of
degradability between structural components of the corn kernel (e.g. cellulose present in the bran
vs. endosperm). Xylose is the backbone residue in arabinoxylan, and to a varying degree
substituted with arabinose. Xylose was a better fit than glucose or hemicellulose for most of the
traits, implying that the xylose content in dietary fiber may relate to the nutrient value of corn co-
products better than cellulose or hemicellulose. Cellulose and hemicellulose have been
previously used to predict the ME of ingredients in pigs (Anderson et al., 2012) and chickens
(Rochell et al., 2011). The microbial degradation of arabinoxylans varies substantially in
different components of the corn kernel; from hardly anything in the pericarp and testa to almost
85-90% in the endosperm (Bach Knudsen, 1997), and may also encapsulate lipids and proteins in
the aleurone layer of corn (Benamrouche et al., 2002), which may explain why NSP xylose and

123
arabinoxylan were the best fit for the digestibility and energy value traits in the tested
ingredients. Galactose was the best fitting NSP monosaccharide for AID of Lys and the average
of dispensable AA, but ranked below NSP xylose for the rest of the AA. Mannose, on the other
hand, forms the backbone of mannans, but they are rarely present in cereal grains (Choct, 1997),
hence its low concentration in corn co-products. The lesser ranking of NSP galactose and NSP
mannose, compared to the other monosaccharides, may be related to the low concentration and
functionality of the polysaccharides they form.
To simplify the estimation of the effect of dietary fiber concentration and its adequacy to
predict the nutrient value of the ingredient, a single best fitting dietary fiber component was
selected for each category (Table 4.7). The arabinoxylan concentration was the best fitting
dietary fiber component for AID of GE, DM, and NDF. The NSP xylose residue was, on the
other hand, the best fitting dietary fiber component for the remaining 3 categories, including
ATTD of GE, DM, and NDF, AID of AA, and on DE and ME. Zijlstra et al. (1999) reported
xylan to be a better predictor than NDF for differences among wheat samples (Zijlstra et al.,
1999). The comparison of the goodness-of-fit between the dietary fiber concentration and Ingred
models showed that Ingred was better than dietary fiber concentration for explaining variation in
most traits. Dietary fiber concentration, however, showed a better fit when used in the model for
AID of GE (550.3) and DM (562.2), when compared to the models using Ingred (555.4 and
570.1, respectively). The effect of Ingred in the model includes the combined effects of other
analytical components such as CP, EE, starch, minerals, and dietary fiber concentrations, which
together can describe the variation in traits better than dietary fiber concentration alone. In
prediction equations of DE and ME values of feed ingredients fed to swine, Noblet and Perez
(1993) reported that the DE and ME values increased with the concentration CP and EE, and

124
decreased with the concentrations of minerals, crude fiber, NDF or hemicellulose. Predictability
usually increased as more chemical components were added to the model. Other prediction
models of digestible nutrients and energy values have also been developed for feed ingredients
based on their chemical composition (Anderson et al., 2012; Urriola et al., 2013).
Although the effect of dietary fiber concentration is not as good as the effect of Ingred to
explain the variation, the dietary fiber concentration showed significant effect on most traits
(Table 4.8). The arabinoxylan concentration, for example, showed a cubic effect on AID of GE
(P = 0.02) and DM (P = 0.04). Similarly, the NSP xylose concentration showed a cubic effect (P
< 0.01) on the ATTD of GE and DM, on the AID (P < 0.05) of Met, Met+Cys, Trp, and average
of indispensable AA and on the ME value (P < 0.01). Additionally, the DE was linearly affected
(P = 0.02) by the NSP xylose concentration. This finding agree with previous data were the
ATTD of energy, DM, and CP of complete diets decreased linearly with dietary increase of
insoluble dietary fiber (Huisman et al., 1985; Noblet and Perez, 1993; Le Goff and Noblet,
2001). The AID of Lys and Thr in the present trial, however, was not affected (P > 0.05) by the
NSP xylose concentration. The NSP xylose concentration affected the AID and ATTD of NDF
differently. The AID of NDF was not affected (P > 0.05), but a cubic effect (P < 0.01) was
observed for ATTD of NDF with NSP xylose concentration.
Interestingly, the R2fiber showed a moderate to high predictability of GE and DM
digestibility, and DE and ME values, from arabinoxylan or NSP xylose residue concentrations in
the feed ingredient. The arabinoxylan concentration explained approximately 66% of the
variance in AID of GE and DM, and the NSP xylose residue explained 80, 78, and 63% of the
variance in ATTD of GE, DM, and NDF, respectively. The NSP xylose residue was able to
explain 66 and 71% of the variability in DE and ME values, respectively. The increase in
125
insoluble and low-fermentable dietary fiber concentration in the ingredient, at the expense of a
highly digestible source of carbohydrates, may explain why NSP and xylose concentration are
good predictors of these traits. Predictability of AID of AA from the NSP xylose residue
concentration was poorer, ranging from 0.11 in AID of Trp to 0.44 in AID of Met + Cys. These
observations coincide with the lack of correlation (r≈0.33) between the NDF content and the SID
of Lys, Met, Thr, or Trp in DDGS reported by Urriola et al. (2013). The lower predictability of
AID of AA maybe caused by the high insoluble to soluble dietary fiber concentration ratio in
ingredients, because insoluble dietary fiber may have a lesser impact on the availability of AA
than the soluble dietary fiber concentration (Urriola et al., 2013). Another contributing factor
may be that some of the ingredients have been processed, therefore reducing the encapsulation of
AA in intact cell structures e.g. aleurone cells.
Assessment of Loss of Predictability
The R2fiber demonstrated that the dietary fiber concentration in corn co-products is an
acceptable predictor for most traits. However, a portion (model residuals) of the total predictable
variance could not be explained by dietary fiber concentration, but can be explained by the effect
of Ingred. For the traits with significant effects of dietary fiber concentration (Table 4.8), the
residuals of these models were tested for the effect of Ingred, and the portion of the variance
explained by Ingred (R2Ingred) was determined (Table 4.9). The loss of predictability is the
proportion of variance from the residuals of dietary fiber models that is explained by the effect of
Ingred (R2Ingred) out of the total explainable variance (R2
fiber + R2Ingred).

126
Ingredient did not affect (P > 0.05) the residuals of dietary fiber concentration models for
AID of GE, DM, and Met + Cys, and thus low R2Ingred (0.01, 0.01, and 0.07, respectively) and
minimum loss of predictability (0.02, 0.01, and 0.13, respectively) values were observed. The
effect of Ingred on these 3 traits did not account for more variation, because the concentration of
arabinoxylan and NSP xylose residue explained the overwhelming majority of the variation in
AID of GE and DM, and AID of Met + Cys, respectively.
In the remaining traits, however, Ingred affected (P < 0.05) the residuals of dietary fiber
concentration models. Therefore, an additional portion of the variance not explained by dietary
fiber concentration was accounted by the effect of Ingred (R2Ingred). In the case of AID of Trp, for
instance, the R2Ingred was greater than the R2
fiber, and dietary fiber concentration showed the
highest loss of predictability (0.59), indicating that dietary fiber concentration is not sufficient to
explain the variation in this trait.
The loss of predictability, however, revealed that the share of the variance explained by
Ingred after accounting for the effect of dietary fiber concentration was lower overall for the
remaining traits, ranging from 0.14 in ATTD of GE to 0.27 in DE value. The fact that the loss of
predictability was overall low, except for AID of Trp, indicates that the concentration of
arabinoxylan or NSP xylose residue explained the majority of the predictable variance and can
be used to predict the AID of GE, DM, Met, and indispensable AA, the ATTD of GE, DM, and
NDF, and DE and ME values, without substantial loss of predictability.
In conclusion, extensive variation was observed in digestibility of energy, dietary fiber,
and indispensable AA, and on DE and ME in a wide variety of corn co-products. Part of the
variation is explained by differences in the dietary fiber concentration in these ingredients. The
arabinoxylan and NSP xylose residue were the dietary fiber components that best explained

127
variation due to dietary fiber concentration, and can therefore be used to explain digestibility of
energy, DM and NDF, and DE and ME values in corn co-products, without substantial loss of
predictability. The AID of Lys and most AA was not predictable from the dietary fiber
concentration in corn co-products.
LITERATURE CITED
Adeola, O. 2001. Digestion and balance techniques in pigs. Pages 903-916. In: Swine Nutrition,
2nd Ed. (Ed. A. J. Lewis and L. L. Southern). CRC Press, Boca Raton, FL.
Almeida, F. N., G. I. Petersen, and H. H. Stein. 2011. Digestibility of amino acids in corn, corn
coproducts, and bakery meal fed to growing pigs. J. Anim. Sci. 89:4109-4115.
Anderson, P. V., B. J. Kerr, T. E. Weber, C. J. Ziemer, and G. C. Shurson. 2012. Determination
and prediction of digestible and metabolizable energy from chemical analysis of corn
coproducts fed finishing pigs. J. Anim. Sci. 90:1242-1254.
AOAC. 1990. Official methods of analysis. 15th ed. Assoc. Off. Anal. Chem., Arlington, VA.
AOAC International. 2007. Official methods of analysis of AOAC Int. 18th ed. Assoc. Off. Anal.
Chem. Int., Gaithersburg, MD.
Bach Knudsen, K. E. 1997. Carbohydrate and lignin contents of plant materials used in animal
feeding. Anim. Feed Sci. Technol. 67:319-338.
Bach Knudsen, K. E. 2001. The nutritional significance of “dietary fibre” analysis. Anim. Feed
Sci. Technol. 90:3-20.
Benamrouche, S., D. Cronier, P. Debeire, and B. Chabbert. 2002. A chemical and histological
study on the effect of (1→4)-β-endo-xylanase treatment on wheat bran. J. Cereal Sci.

128
36:253-260.
Bolker, B. M., M. E. Brooks, C. J. Clark, S. W. Geange, J. R. Poulsen, M. Henry, H. Stevens,
and J. S. White. 2009. Generalized linear mixed models: a practical guide for ecology and
evolution. Trends in ecology and evolution. Vol. 24, p. 127-135.
Campbell, J. M., E. A. Flickinger, and G. C. Fahey Jr. 1997. A comparative study of dietary fiber
methodologies using pulsed electrochemical detection of monosaccharide constituents.
Sem. Food Anal. 2:43-53.
Choct, M. 1997. Feed non-starch polysaccharides: chemical structures and nutritional
significance. Feed Milling Intl. 6:13-26.
Choct, M. 2002. Non-starch polysaccharides: effect on nutritive value. In: J. M. McNab and K.
N. Boorman, editors, Poultry feedstuffs: supply, composition, and nutritive value. Poult.
Sci. Symp. Series. Vol. 26. CABI Publishing, New York, NY. p. 221-235.
Englyst, H. N., and Hudson, G. J. 1987. Colorimetric method for routine measurement of dietary
fibre as non-starch polysaccharides.A comparison with gas-liquid chromatography. Food
Chem. 24:63-76.
Fairbairn, S. L., J. F. Patience, H. L. Classen, and R. T. Zijlstra. 1999. The energy content of
barley fed to growing pigs: characterizing the nature of its variability and developing
prediction equations for its estimation. J. Anim. Sci. 77:1502-1512.
Farrell, D. J. 1973. Digestibility by pigs of the major chemical components of diets high in plant
cell-wall constituents. Anim. Prod. 16:43-47.
Fenton, T. W. and M. Fenton. 1979. An improved procedure for the determination of chromic
oxide in feed and feces. Can. J. Anim. Sci. 59: 631-634.
129
Goering, H. K. and P. J. Van Soest. 1970. Forage fiber analyses (apparatus, reagents, procedures,
and some applications). In: Handbook No. 379. USDA-ARS, Washington, DC.
Graham, H. and P. Åman. 1986. Circadian variation in composition of duodenal and ileal digesta
from pigs fitted with T-Cannulas. Anim. Prod. 43:133-140.
Graham, H. and J. Lindberg. 1986. The influence of wheat bran and sugar-beet pulp on the
digestibility of dietary components in a cereal-based pig diet. J. Nutr. 116:242-251.
Högberg A., and J. Lindberg. 2004. Influence of cereal non-starch polysaccharides on digestion
site and gut environment in growing pigs. Livest. Prod. Sci. 87:121-130.
Jaworski, N. 2012. Carbohydrate composition, in vitro digestion, and effects of xylanase and
phytase on nutrient and energy digestibility by pigs in grains and grain coproducts. M.S.
Thesis. Univ. of Illinois, Urbana-Champaign, IL.
Jacobs, B. M., J. F. Patience, W. A. Dozier III, K. J. Stalder and B. J. Kerr. 2011. Effects of
drying methods on nitrogen and energy concentrations in pig feces and urine, and poultry
excreta. J. Anim. Sci. 89:2624-2630.
Jorgensen, H., X. Q. Zaho, and B. Eggum. 1996 The influence of dietary fibre and environmental
temperature on the development of the gastrointestinal tract, digestibility, degree of
fermentation in the hind-gut and energy metabolism in pigs. Br. J. Nutr. 75:365-378.
Nakagawa, S. and H. Schielzeth. 2013. A general and simple method for obtaining R2 from
generalized linear mixed-effects models. Methods Ecol. Evol. 4:133–142.
Noblet, J. and J. M. Perez. 1993. Prediction of digestibility of nutrients and energy values of pig
diets from chemical analysis. J. Anim. Sci. 71:3389-3398.
NRC. 1998. Nutrient Requirements of Swine. 10th rev. ed. Natl. Acad. Press, Washington, DC.
NRC. 2012. Nutrient Requirements of Swine. 11th rev. ed. Natl. Acad. Press, Washington, DC.
130
Oresanya, T. F., A. D. Beaulieu, and J. F. Patience. 2008. Investigations of energy metabolism in
weanling barrows: The interaction of dietary energy concentration and daily feed
(energy) intake. J. Anim. Sci. 86:348-363.
Pedersen, C., M. G. Boersma, and H. H. Stein. 2007. Digestibility of energy and phosphorus in
ten samples of distillers dried grains with solubles fed to growing pigs. J. Anim. Sci.
85:1168-1176.
Prosky, L., N. G. Asp, I. Furda, J. W. DeVries, T. F. Schweizer, and B. F. Harland. 1985.
Determination of total dietary fiber in foods and food products: collaborative study. J.
AOAC 68, 677-679.
Robinson, P. H., K. Karges, and G. C. Gibson. 2008. Nutritional evaluation of four co-product
feedstuffs from the motor fuel ethanol distillation industry in the Midwestern USA.
Anim. Feed Sci. Technol. 146:345-352.
Rochell, S. J., B. J. Kerr, and W. A. Dozier. 2011. Energy determination of corn co-products fed
to broiler chicks from 15 to 24 days of age, and use of composition analysis to predict
nitrogen-corrected apparent metabolizable energy. Poult. Sci. 90:1999-2007.
Rojas, O. J. and H. H. Stein. 2013. Phosphorus digestibility and concentration of digestible and
metabolizable energy in corn, corn co-products, and bakery meal fed to pigs. J. Anim.
Sci. 91(Suppl.2):122.
Sauvant, D., J. M. Perez, and G. Tran. 2004. Tables of Composition and Nutritional Value of
Feed Materials: Pig, poultry, sheep, goats, rabbits, horses, fish. Wageningen Academic
Publishers, Wageningen, The Netherlands and INRA Editions, Paris, France.
Snijders, T. and R. Bosker. 1999. Multilevel Analysis: An Introduction to Basic and Advanced
Multilevel Modeling. Sage, London, UK.

131
Souffrant, W. B. 2001.Effect of dietary fiber on ileal digestibility and endogenous nitrogen
losses in the pig. Anim. Feed Sci. Technol. 90:93-102.
Spiehs, M. J., M. H. Whitney, and G. C. Shurson. 2002. Nutrient database for distillers dried
grains with solubles produced from new plants in Minnesota and South Dakota. J. Anim.
Sci. 80:2639-2645.
Stein, H. H., C. F. Shipley, and R. A. Easter. 1998. Technical Note: A technique for inserting a
T-cannula into the distal ileum of pregnant sows. J. Anim. Sci. 76:1433-1436.
Stein, H. H., M. L. Gibson, C. Pedersen, and M. G. Boersma. 2006. Amino acid and energy
digestibility in ten samples of distillers dried grain with solubles fed to growing pigs. J.
Anim. Sci. 84:853-860.
Theander, O., P. Åman, E. Westerlund, H. Graham. 1989. Plant cell walls and monogastrics
diets. Anim. Feed Sci. Technol. 23, 205-225.
Urriola, P. E., D. Hoehler, C. Pedersen, H. H. Stein, and G. C. Shurson. 2009. Amino acid
digestibility of distillers dried grains with solubles, produced from sorghum, a sorghum-
corn blend, and corn fed to growing pigs. J. Anim. Sci. 87:2574-2580.
Urriola, P. E., G. C. Shurson, and H. H. Stein. 2010. Digestibility of dietary fiber in distillers
coproducts fed to growing pigs. J. Anim. Sci. 88:2373-2381.
Urriola, P. E., L. J. Johnston, H. H. Stein, and G. C. Shurson. 2013. Prediction of the
concentration of standardized ileal digestible amino acids in distillers dried grains with
solubles. J. Anim. Sci. 2013-6362.
van Soest, P. J. and J.B. Robertson. 1979. Systems of analysis for evaluating fibrous feeds. In:
Workshop Standardization of Analytical Methodology for Feeds, Int. Dev. Res Center,
Ottawa, ON, Canada. Pp. 49-60.
132
Widmer, M. R., L. M. McGinnis, and H. H. Stein. 2007. Energy, phosphorus, and amino acid
digestibility of high-protein distillers dried grains and corn germ fed to growing pigs. J.
Anim. Sci. 85:2994-3003.
Widyaratne, G. P., and R. T. Zijlstra. 2007. Nutritional value of wheat and corn distiller’s dried
grains with solubles: Digestibility and digestible contents of energy, amino acids and
phosphorus, nutrient excretion and growth performance of grower-finisher pigs. Can. J.
Anim. Sci. 87:103-114.
Wilfart, A., L. Montagne, P. H. Simmins, J. van Milgen, and J. Noblet. 2007. Sites of nutrient
digestion in growing pigs: effect of dietary fiber. J. Anim. Sci. 85:976-983.
Zijlstra, R. T., C. F. M. de Lange, and J. F. Patience. 1999. Nutritional value of wheat for
growing pigs: chemical composition and digestible energy content. Can. J. Anim. Sci.
79:187–194.

133
Table 4.1. Ingredient composition (%) of the basal and experimental diets (as-fed basis)1
Item Basal Experimental diets
Ingredient
Corn 65.15 45.60
Soybean meal, 46.5% 29.00 20.30
Corn co-product - 30.00
Soybean oil 2.00 1.40
Limestone 1.10 0.77
Monocalcium phosphate 1.20 0.84
Cr2O3 0.55 0.39
Vitamin premix2 0.20 0.14
Trace mineral premix3 0.20 0.14
Salt 0.60 0.42
Energy and nutrients4
DM, % 90.36 87.94 – 92.87
GE, Mcal/kg 3.89 3.85 – 4.25
CP, % 18.32 13.76 – 30.29
NDF, % 6.97 5.93 – 18.67
Lys, % 0.86 0.66 – 1.04
Thr, % 0.61 0.51 – 1.03
Met, % 0.24 0.21 – 0.64
Met+Cys, % 0.47 0.42 – 1.16
Trp, % 0.23 0.16 – 0.25
Indispensable AA, % 7.13 5.96 – 13.69
Dispensable AA, % 8.37 7.25 – 16.68 1Experimental diets were obtained by mixing 70% of the basal diet and 30% of the corn co-
product tested.
2Provided per kilogram of complete diet: 6,614 IU of vitamin A; 827 IU of vitamin D; 26 IU
of vitamin E; 2.6 mg of vitamin K; 29.8 mg of niacin; 16.5 mg of pantothenic acid; 5.0 mg of
riboflavin; 0.023 mg of vitamin B12.
3Provided per kilogram of complete diet: Zn, 165 mg as ZnSO4; Fe, 165 mg as FeSO4; Mn,
39 mg as MnSO4; Cu, 17 mg as CuSO4; I, 0.3 mg as Ca(IO3)2; and Se, 0.3 mg as Na2SeO3.
4Analyzed values

134
Table 4.2. Analyzed nutrient composition of ingredients (as-fed basis)
Ingredient1
Item CB-S CB DDGS-CV DDGS-RO DDGS-BPX HP-DDG DDC CGmM CGnM DM, % 95.3 80.9 89.4 90.1 91.5 93.9 90.1 91.9 92.1
GE, Mcal/kg 4.58 3.68 4.77 4.72 4.74 4.88 3.86 4.33 5.06
Ether extract, % 7.9 1.2 9.9 8.8 8.3 3.2 1.1 3.1 1.5
Starch, % 19.0 21.1 2.8 2.9 5.2 8.2 68.5 16.4 12.0
ADF, % 5.1 10.5 9.2 14.3 7.9 11.8 0.4 11.5 7.0
NDF, % 22.7 40.6 34.5 38.7 30.8 31.1 3.8 46.2 12.1
Hemicellulose2, % 17.6 30.1 25.3 24.4 22.9 19.3 3.4 34.7 5.1 TDF, % 25.3 42.5 32.6 32.9 29.1 28.9 2.3 44.1 8.8
I-NSP3, %
Arabinose 3.4 8 4.7 4.1 4.4 3.8 0.5 10.4 0.8
Xylose 5.9 14.4 5.9 6.1 6.3 4.9 0.4 9.9 0.7
Mannose 0.1 0.3 0.6 0.5 0.7 1.3 - 0.3 - Glucose 5.3 11.7 6.9 6.6 7.3 8.6 0.2 10.8 1.4
Galactose 1.1 2.4 1.3 1 1.2 0.8 - 2 0.6
Total insoluble 15.7 36.8 19.2 18.2 19.9 19.3 1.1 33.5 3.5 S-NSP4, %
Arabinose 0.1 -0.1 0.2 2.2 0.5 0.3 -0.1 5.4 0.3
Xylose 0.1 -0.2 - 1.9 0.1 0.2 - 3.5 0.2
Mannose 0.6 0.1 0.3 0.4 0.5 0.6 - -0.3 - Glucose 0.4 0.5 0.5 1.7 0.8 1.1 0.1 1.5 0.4
Galactose 0.1 - - 0.5 0.2 0.2 - 0.8 0.5
Total soluble 1.4 0.2 1.2 6.8 2.1 2.6 - 10.9 1.4

135
Table 4.2. (continued) T-NSP5, %
Arabinose 3.5 7.9 4.9 6.3 4.9 4.1 0.4 15.8 1.1 Xylose 6 14.2 5.9 8 6.4 5.1 0.4 13.4 0.9 Mannose 0.7 0.4 0.9 0.9 1.2 1.9 0 0 0.1 Glucose 5.7 12.2 7.4 8.3 8.1 9.7 0.3 12.3 1.8 Galactose 1.2 2.4 1.3 1.5 1.4 1 0 2.8 1.1
Total NSP6, % 17.1 37.0 20.4 25.0 22.0 21.9 1.1 44.4 4.9
Total arabinoxylan7, % 9.5 22.1 10.8 14.3 11.3 9.2 0.8 29.2 2.0 1CB-S = corn bran with solubles; CB = corn bran; DDGS-CV = cooked DDGS; DDGS-RO = reduced oil DDGS; DDGS-BPX =
uncooked DDGS; HP-DDG = high protein distillers dried grains; DDC = dehulled-degermed corn; CGmM = corn germ meal; CGnM
= corn gluten meal.
3Hemicelluose = NDF - ADF
3Insolule monosaccharide residues in NSP, as % of the ingredient.
4Soluble monosaccharide residues in NSP, as % of the ingredient. S-NSP = T-NSP – I-NSP
5Total monosaccharide residues in NSP, as % of the ingredient.
6Total NSP = sum of T-NSP monosaccharide residues.
7Total arabinoxylan = T-NSParabinose + T-NSPxylose.

136
Table 4.3. Analyzed AA concentration (%) of ingredients (as-fed basis)
Ingredient1
Item, % CB-S CB DDGS-CV DDGS-RO DDGS-BPX HP-DDG DDC CGmM CGnM CP 13.0 7.5 25.4 24. 5 25.5 36.5 7.6 20.6 59.5
Indispensable AA
Arg 0.7 0.5 1.3 1.3 1.3 1.5 0.3 1.5 2.2
His 0.4 0.3 0.7 0.8 0.8 1.1 0.2 0.7 1.3
Ile 0.5 0.3 1.0 1.1 1.0 1.8 0.3 0.8 2.6
Leu 1.2 0.9 3.1 3.7 3.1 6.0 1.1 1.8 9.8
Lys 0.6 0.5 1.1 0.9 1.0 1.3 0.2 1.1 1.3
Met 0.2 0.2 0.5 0.6 0.5 0.9 0.1 0.4 1.3
Phe 0.5 0.4 1.4 1.4 1.2 2.2 0.4 0.9 3.8
Thr 0.6 0.4 1.0 1.1 1.0 1.5 0.2 0.8 2.0
Trp 0.1 0.1 0.2 0.2 0.2 0.1 0.1 0.2 0.2
Val 0.7 0.5 1.4 1.6 1.4 2.2 0.3 1.3 2.9
Dispensable AA2 6.9 4.8 13.6 15.8 13.9 22.8 4.3 10.0 35.0
All AA3 12.5 8.6 25.2 28.4 25.3 41.2 7.4 19.4 62.4 1 CB-S = corn bran with solubles; CB = corn bran; DDGS-CV = cooked DDGS; DDGS-RO = reduced oil DDGS; DDGS-BPX =
uncooked DDGS; HP-DDG = high protein distillers dried grains; DDC = dehulled-degermed corn; CGmM = corn germ meal; CGnM
= corn gluten meal.
2Sum of all dispensable AA.
3Sum of all indispensable and dispensable AA.

137
Table 4.4. Apparent ileal and total tract digestibility traits of ingredients1,2
Ingredient
Item CB-S CB DDGS-
CV DDGS-
RO DDGS-
BPX HP-
DDG DDC CGmM CGnM Pooled SEM P-value
AID, %
GE 52.1b 46.7bc 55.1b 48.5bc 53.9b 52.8b 84.4a 30.9c 75.8a 4.00 <0.01
DM 46.5b 41.5b 47.0b 40.7b 45.8b 48.4b 87.8a 29.5c 74.7a 4.45 <0.01
NDF 19.8 19.5 32.4 42.0 28.8 38.7 20.4 28.0 61.0 11.12 0.11
ATTD, %
GE 53.4d 40.3e 72.1b 64.8bc 67.6bc 70.7bc 99.6a 63.2c 91.6a 1.99 <0.01
DM 52.3e 39.9f 68.6cd 61.9d 64.9cd 71.9c 101.7a 67.0cd 91.5b 2.01 <0.01
NDF 8.5d 6.0d 58.2c 50.7c 49.4c 67.7c 136.8a 73.0bc 94.3b 6.19 <0.01
AID of AA, %
Arg 74.4ab 65.6ab 80.0ab 82.4ab 71.5ab 59.6b 67.2ab 79.0ab 86.5a 5.98 0.03
His 61.3bc 56.2c 73.7ab 71.8abc 65.5abc 63.9bc 74.6ab 62.1bc 81.2a 3.74 <0.01
Ile 56.7bc 49.6c 67.7bc 73.2ab 60.4bc 62.9bc 71.1ab 60.9bc 86.6a 4.14 <0.01
Leu 66.7cde 60.8e 80.9ab 79.2ab 77.1bc 75.9bcd 84.6ab 63.2de 90.4a 2.81 <0.01
Lys 35.9ab 35.9ab 51.7ab 51.3ab 40.0ab 44.5ab 20.2b 54.4ab 65.5a 4.46 <0.01
Met 68.8cd 61.7d 78.3bc 81.4ab 75.2bc 73.3bcd 80.1bc 70.5bcd 92.4a 2.55 <0.01
Phe 59.0d 55.6d 75.2abc 76.2abc 68.2cd 70.3bcd 84.0ab 66.0cd 88.5a 3.49 <0.01
Thr 50.3bc 33.3c 66.0ab 66.3ab 54.4bc 54.6bc 62.0ab 46.1bc 79.3a 5.42 <0.01
Trp 35.0bc 16.9c 55.1ab 58.5ab 51.8abc 37.9bc 46.0bc 58.6ab 76.2a 5.67 <0.01
Val 52.1bc 42.2c 67.7ab 70.3ab 60.5bc 60.4bc 67.1ab 61.8bc 85.6a 4.96 <0.01
Indispensable3 58.4cd 50.6d 72.4abc 73.4abc 65.3bcd 65.9bcd 74.7ab 63.3bcd 86.6a 3.54 <0.01
Dispensable4 58.5bc 44.4c 69.0ab 69.9ab 68.1ab 64.2abc 53.9bc 52.4bc 82.0a 6.08 <0.01
All AA5 57.8bc 47.2c 70.6ab 71.6ab 66.9b 65.0b 60.2bc 57.6bc 84.1a 4.39 <0.01

138
1Least squares means of 8 pigs per ingredient.
2CB-S = corn bran with solubles; CB = corn bran; DDGS-CV = cooked DDGS; DDGS-RO = reduced oil DDGS; DDGS-BPX =
uncooked DDGS; HP-DDG = high protein distillers dried grains; DDC = dehulled-degermed corn; CGmM = corn germ meal; CGnM
= corn gluten meal.
3Average AID for all indispensable AA.
4Average AID for all dispensable AA.
5Average AID for all AA (indispensable and dispensable)

139
Table 4.5. Digestible and metabolizable energy value of ingredients1,2
Ingredient Pooled
CB-S CB DDGS-CV DDGS-RO DDGS-BPX HP-DDG DDC CGmM CGnM SEM P-value
As-fed basis, Mcal/kg
DE 2.45e 1.48f 3.58bc 3.19d 3.34cd 3.59bc 3.84b 2.74e 4.64a 0.09 <0.01
ME 2.39d 1.46e 3.40b 3,03c 3,17bc 3.33bc 3.79a 2,63d 4.07a 0.08 <0.01
1 Least squares means of 8 pigs per ingredient.
2CB-S = corn bran with solubles; CB = corn bran; DDGS-CV = cooked DDGS; DDGS-RO = reduced oil DDGS; DDGS-BPX =
uncooked DDGS; HP-DDG = high protein distillers dried grains; DDC = dehulled-degermed corn; CGmM = corn germ meal; CGnM
= corn gluten meal.

140
Table 4.6. Goodness-of-fit ranking of dietary fiber assays by trait
1Monosaccharide residues in NSP: Ara = NSP arabinose; Gal = NSP galactose; Glc = NSP glucose; Man = NSP mannose; Xyl =
NSP Xylose. AraXyl = arabinoxylan. Hemi = hemicellulose. NSP = total NSP.
Ranking of chemical analyses1
Trait Best fit 2nd 3rd 4th 5th 6th 7th 8th 9th 10th Worst fit
AID
GE AraXyl Ara Hemi NSP NDF Xyl TDF Glc Gal ADF Man
DM AraXyl Ara Hemi NSP TDF Xyl NDF Glc Gal ADF Man
NDF TDF Gal ADF NDF NSP Xyl Glc Hemi AraXyl Man Ara
ATTD
GE Xyl AraXyl Glc NSP Ara TDF Hemi Gal NDF ADF Man
DM AraXyl Xyl Ara NSP Glc TDF Hemi Gal NDF Man ADF
NDF Glc Xyl AraXyl TDF Ara Gal NDF Hemi NSP Man ADF
AID of AA
Lys Gal ADF NDF TDF NSP AraXyl Ara Glc Hemi Xyl Man
Thr Xyl Glc NSP AraXyl TDF Gal Ara Hemi NDF ADF Man
Met Xyl NSP Glc AraXyl TDF Ara Hemi Gal NDF ADF Man
Met+Cys Xyl Glc NSP AraXyl TDF Hemi Ara Gal NDF ADF Man
Trp NSP Xyl AraXyl Ara TDF Man NDF Glc Hemi Gal ADF
Indispensable AA Xyl AraXyl NSP Glc TDF Ara Hemi Gal NDF Man ADF
Dispensable AA Gal TDF NSP Xyl Glc AraXyl Ara NDF Hemi ADF Man
Energy concentration, as-fed basis
DE Xyl AraXyl NSP Ara Gal TDF Glc Hemi NDF Man ADF
ME Xyl AraXyl NSP Ara Gal Glc TDF Hemi NDF Man ADF

141
Table 4.7. Goodness-of-fit for the best dietary fiber within category and feed ingredient models
across traits
AIC1 Trait Chemical assay Dietary fiber Ingredient
AID
GE AraXyl 546.9 555.4
DM AraXyl 561.0 570.1
NDF AraXyl 666.1 663.0 ATTD
GE Xylose 504.2 448.9
DM Xylose 513.7 450.1
NDF Xylose 649.8 593.2 AID of AA
Lys Xylose 569.5 556.1
Thr Xylose 592.8 585.9
Met Xylose 504.1 482.9
Met+Cys Xylose 553.4 551.0
Trp Xylose 578.7 561.1
Indispensable AA Xylose 548.7 537.6
Dispensable AA Xylose 574.7 564.4 Energy concentration, as-fed basis
DE Xylose 1093.4 987.5
ME Xylose 1065.2 981.7 1Akaike information criterion. Smaller is better.

142
Table 4.8. Regression coefficients and model fit of the best fitting dietary fiber across traits
Regression components
Trait DF1 Intercept Linear Quadratic Cubic R2fiber P-value2
AID, %
GE AraXyl 88.618 -6.559 0.380 -0.008 0.65 <0.01
DM AraXyl 92.280 -8.336 0.463 -0.009 0.67 <0.01
NDF AraXyl - - - - n/a >0.05
ATTD, %
GE Xylose 106.455 -18.346 2.596 -0.113 0.80 <0.01
DM Xylose 108.411 -19.661 2.721 -0.115 0.78 <0.01
NDF Xylose 147.595 -52.227 7.844 -0.337 0.63 <0.01
AID of AA, %
Lys Xylose - - - - n/a >0.05
Thr Xylose - - - - n/a >0.05
Met Xylose 90.469 -9.020 1.514 -0.072 0.40 0.02
Met+Cys Xylose 87.475 -10.333 1.610 -0.076 0.44 0.04
Trp Xylose 71.795 -20.447 3.874 -0.185 0.11 0.04
Indispensable AA Xylose 86.045 -11.075 1.831 -0.086 0.35 0.02
Dispensable AA Xylose - - - - n/a >0.05
Energy concentration, Mcal/kg (as-fed basis)
DE Xylose 4.464 -0.457 - - 0.66 0.02
ME Xylose 4.215 -0.520 0.078 -0.004 0.71 0.01 1DF = Dietary fiber
2P-value of the highest order regression component.

143
Table 4.9. Comparison of model adequacy and effect of ingredient on the residuals from the
dietary fiber models
Trait Dietary
fiber R2fiber
1 R2Ingred
2 P-value3 Loss of
predictability4
AID
GE AraXyl 0.65 0.01 >0.05 0.02
DM AraXyl 0.67 0.01 >0.05 0.01
ATTD
GE Xylose 0.80 0.13 <0.01 0.14
DM Xylose 0.78 0.15 <0.01 0.16
NDF Xylose 0.63 0.23 <0.01 0.27
AID of AA
Met Xylose 0.40 0.12 <0.01 0.24
Met+Cys Xylose 0.44 0.07 >0.05 0.13
Trp Xylose 0.11 0.17 <0.01 0.59
Indispensable AA Xylose 0.35 0.13 <0.01 0.27
Energy concentration, as-fed basis
DE Xylose 0.66 0.26 <0.01 0.28
ME Xylose 0.71 0.21 <0.01 0.23 1R2 of dietary fiber on the observed values (Eq. 3).
2R2 of Ingred on the residuals of the dietary fiber model (Eq. 4).
3P-value of Ingred on the residuals of the dietary fiber model.
4Loss of predictability = &'()*�+%�(,
�
&'()*�+%�(, � � &�%.�*
�
144
CHAPTER 5: INTEGRATIVE SUMMARY
Typical corn and soybean meal diets offered to pigs in the US are changing because of
cost and competition for corn. The high availability of co-products from the corn-ethanol
distillation industry, such as DDGS, offers an alternative to successfully supply pigs with energy
and AA. However, these feed ingredients are also high in plant derived carbohydrates and lignin
that are undigested by mammalian enzymes, and are commonly known as dietary fiber
(Gutierrez et al., 2014).
Because of its high fiber content, the dietary inclusion of DDGS and most corn co-
products increases the concentration of dietary fiber (NRC, 2012). Therefore, substitution of
highly digestible carbohydrates with dietary fiber suppose a reduction in the dietary energy
supply, which can only be compensated with addition of external fat or using co-products with a
high fat content (DDGS with >10% fat).
Dietary fiber is degraded to a variable degree in the gastrointestinal tract by anaerobic
fermentation, and may contribute to the dietary supply of energy. In pigs, the efficiency of
energy utilization from fibrous feed ingredients is affected by the digestibility of dietary fiber
and the production of VFA (Bindelle et al., 2008). The digestibility of dietary fiber in the
gastrointestinal tract depends on the degree of lignification, solubility, and structure of the
polysaccharides of dietary fiber (Bach Knudsen, 2001). Additionally, corn co-products are also
changing permanently due to technological advances at the production plant, and differences in
AID and ATTD of dietary fiber of DDGS have been previously reported (Guo et al., 2004; Stein
et al., 2009; Urriola et al., 2010). These differences contribute to variation in digestibility of
energy in diets containing DDGS or other corn co-products, and increase the difficulty of
predicting the energy value of the feed ingredient and the supply of dietary energy.

145
The use of co-products from the corn ethanol distillation industry may also decrease the
AA, energy, and fiber digestibility of diets offered to pigs (Noblet and Le Goff, 2001; Urriola
and Stein, 2010). Similarly, the high concentration of fiber in the feed ingredient may have a
negative effect on the nutrient value of the feed ingredient.
Stein and Shurson (2009) reported that the greater concentration of fiber in DDGS
compared with corn might be one of the primary reasons for the decreased digestibility of energy
in DDGS. The reason dietary fiber reduces digestibility of energy and AA is that fiber has less
digestibility, induces and increase in endogenous nutrient losses, and increases the rate of
passage (Grieshop et al., 2001; Souffrant, 2001). Another possibility is that the plant cell wall
may act as a physical barrier to the release of nutrients or may increase the viscosity of the liquid
phase restricting nutrient absorption (Bach Knudsen, 2001). For example, soluble dietary fiber
has been reported to influence the absorption of nutrients from the small intestine through its
effect on luminal viscosity, which may reduce the rate of nutrient absorption (Bach Knudsen,
2001).
The effect of dietary fiber on the availability of dietary nutrients is variable and is mostly
influenced by the physicochemical properties of dietary fiber. These properties of dietary fiber
are associated with the type of polymers that make up the cell wall and their intermolecular
association (Bach Knudsen, 2001). Therefore, knowledge of the polymers and the
monosaccharide residues that constitute fiber may be helpful to better explain the effect of
dietary fiber on the nutritional value of corn co-products. Modern analytical techniques enable
quantification and characterization of the physical and chemical properties of dietary fiber in
plant materials, but understanding of the nutritional significance of these measurements is far
from complete. Specifically, analytical values concerning the degree of lignification and water

146
solubility provide important information about the degradability of dietary fiber over the entire
intestinal tract, but the relationship between dietary fiber and processes of digestion and
absorption in the small intestine is more difficult to establish from the chemical parameters
currently measured.
A quantification of the effects of dietary fiber concentration on the nutrient value of corn
co-products and diets formulated with them is unavailable. We therefore proposed a series of
experiments, using the ileal-cannulated animal model, to determine the digestibility of energy,
nutrients, and dietary fiber at the terminal ileum and over the entire intestinal tract, with the
objective of:
1) Determine the site and extent of digestion of dietary fiber from corn and its co-
products
2) Determine the impact of dietary fiber increase on the utilization of dietary nutrients
3) Identify dietary fiber components to more accurately predict the effect of dietary fiber
concentration in corn co-products on their energy and nutrient value
It was observed that insoluble monosaccharide residues composed the majority of the
dietary fiber in corn co-products. From the total NSP in corn co-products, glucose was the most
prevalent monosaccharide residue followed by xylose, arabinose, galactose, and mannose. The
monosaccharide composition, solubility, and concentration relate structurally to the
polysaccharides forming the NSP of corn co-products, such as arabinoxylans, cellulose, and

147
galactomannans (Bach Knudsen, 1997; Choct, 2002). The implication of this chemical
composition is that a portion of the dietary NDF originated from corn co-products is fermented
by the terminal ileum (approximately 25% AID of NDF) and the fermentability was not affected
by the level of NDF intake. However, increasing the amounts of dietary insoluble and low-
fermentable fiber from corn may reduce the ability of the growing pig to ferment the dietary fiber
in the hindgut, as the ATTD of NDF decreased (from 42.6 to 30.5%) with the dietary increase of
corn fiber. This response, however, appear to be modulated by the dietary fat concentration,
because in diets formulated with high concentrations of extracted fat from soybean oil a
quadratic response of the AID of NDF and a reduction of the ATTD of NDF were observed with
the addition of low fat DDGS. The high concentration of extracted fat in these diets may increase
the transit time of digesta, resulting in the longer exposure of the dietary NDF to the intestinal
microbiota. However, at low concentrations of dietary fat the apparent digestibility of NDF at the
terminal ileum and over the entire tract was not affected by the dietary increase of DDGS.
Results also showed that in spite of the reduction in digestibility of energy with insoluble and
low fermentable fiber level from corn, growth performance was not affected when energy is
correctly balanced in the diet.
It was concluded that the AID of AA was negatively associated with the inclusion of corn
co-products from the corn ethanol distillation industry, but the decrease in AID of AA may be
attributed to the effects of the manufacture processes rather than the effect of NDF concentration
in DDGS. Insoluble fiber has minimal effect on the ileal digestion and absorption of nutrients
and energy, which has been demonstrated in several experiments that used different sources of
insoluble dietary fiber (Wang et al., 2002; Serena et al., 2008b). Similar results were obtained

148
when the AID of AA was measured in nine corn co-products and it was determined that the AID
of Lys and most AA was not predictable from the dietary fiber concentration.
Extensive variation was observed in digestibility of energy, dietary fiber, and
indispensible AA, and on DE and ME in a variety of 9 corn co-products. It was concluded that
part of the variation is explained by the increase in insoluble and low-fermentable fiber
concentration in the feed ingredient, at the expense of starch or fat. It was determined that the
arabinoxylan and NSP xylose residues were the dietary fiber components that best explained
variation due to dietary fiber concentration. The NSP xylose residue, for example, was able to
explain 66 and 71% of the variation in DE and ME values, respectively. Xylose is the backbone
residue in arabinoxylan and the fact that it was the best fit implies that relates better to the
nutrient value of corn co-products than cellulose or hemicellulose.
In conclusion, the present work suggests that the current panorama of high fiber diets is
not so dire since fiber from corn co-products can be fed to pigs without negative effects on the
digestibility of AA, and performance can be maintained as long as energy is correctly balanced
in the diet. However the challenge of a new generation of co-products with a lower fat content
mean that digestibility of dietary fiber need to be improved to maximize the energy supply.

149
LITERATURE CITED
Bach Knudsen, K. E. 1997. Carbohydrate and lignin contents of plant materials used in animal
feeding. Anim. Feed Sci. Technol. 67:319-338.
Bach Knudsen, K. E. 2001. The nutritional significance of “dietary fibre” analysis. Anim. Feed
Sci. Technol. 90:3-20.
Bindelle, J., P. Leterme, and A. Buldgeh. 2008. Nutritional and environmental consequences of
dietary fibre in pig nutrition. A review. Biotechnol. Agron. Soc. Environ. 12:313-324.
Choct, M. 2002. Non-starch polysaccharides: Effect on nutritive value. Page 221-235 in Poultry
feedstuffs: Supply, composition, and nutritive value. McNab J. M., and K. N. Boorman,
ed. Poult. Sci. Symp. Series. Vol. 26. CABI Publishing, New York.
Grieshop, C. M., D. E. Reese, and G. C. Fahey Jr. 2001. Non-starch polysaccharides and
oligosaccharides in swine nutrition. Pages 107-130 in Swine Nutrition. Lewis, A. J. and
L. L. Southern ed. CRC Press, Boca Raton, FL.
Guo, L., X. Piao, D. Li, and S. Li. 2004. The apparent digestibility of corn by-products for
growing-finishing pigs in vivo and in vitro. Asian-australas. J. Anim. Sci. 17:379-385.
Gutierrez, N. A., N. V. L. Serao, B. J. Kerr, R. T. Zijlstra, and J. F. Patience. 2014. Relationships
among dietary fiber components and the digestibility of energy, dietary fiber, and amino
acids and energy content of nine corn coproducts fed to growing pigs. J. Anim. Sci.
92:4505-4517.
Noblet, J. and G. Le Goff. 2001. Effect of dietary fibre on the energy value of feeds for pigs.
Anim. Feed Sci. Technol. 90:35-52.
NRC. 2012. Nutrient Requirements of Swine. 11th rev. ed. Natl. Acad. Press, Washington, DC.

150
Serena, A., H. Jørgensen, and K. E. Bach Knudsen. 2008. Digestion of carbohydrates and
utilization of energy in sows fed diets with contrasting levels and physicochemical
properties of dietary fiber. J. Anim. Sci. 86:2208-2216.
Souffrant, W. B. 2001. Effect of dietary fiber on ileal digestibility and endogenous nitrogen
losses in the pig. Anim. Feed. Sci. Technol. 90:93-102.
Stein, H. H., S. P. Connot, and C. Pedersen. 2009. Energy and nutrient digestibility in four
sources of distillers dried grains with solubles produced from corn grown within a narrow
geographical area and fed to growing pigs. Asian-australas. J. Anim. Sci. 22-1016-1025.
Stein, H. H., and G. C. Shurson. 2009. BOARD-INVITED REVIEW: The use and application of
distillers dried grains with solubles in swine diets. J. Anim. Sci. 87:1292-1303.
Urriola, P. E., and H. H. Stein. 2010. Effects of distillers dried grains with solubles on amino
acid, energy, and fiber digestibility and on hindgut fermentation of dietary fiber in a corn-
soybean meal diet fed to growing pigs. J. Anim. Sci. 88:1454-1462.
Urriola, P. E., G. C. Shurson, and H. H. Stein. 2010. Digestibility of dietary fiber in distillers
coproducts fed to growing pigs. J. Anim. Sci. 88:2373-2381.
Wang, J. F., B. B. Jensen, H. Jørgensen, D. F. Li, and J. E. Lindberg. 2002. Ileal and total tract
digestibility, and protein and fat balance in pigs fed rice with addition of potato starch,
sugar beet pulp or wheat bran. Anim. Feed Sci. Technol. 102:125-136.