Quantification and Analysis of Microplastics in Farmland ...
16
agriculture Article Quantification and Analysis of Microplastics in Farmland Soils: Characterization, Sources, and Pathways Hoda Fakour 1, * , Shang-Lien Lo 2,3 , Nathan Thadeo Yoashi 1 , Angelbetter Marselian Massao 1 , Nelson Naboth Lema 1 , Fezile Bethusile Mkhontfo 1 , Patrick Chris Jomalema 1 , Nasra Shabani Jumanne 1 , Bright Hubert Mbuya 1 , James Travor Mtweve 1 and Moslem Imani 4 Citation: Fakour, H.; Lo, S.-L.; Yoashi, N.T.; Massao, A.M.; Lema, N.N.; Mkhontfo, F.B.; Jomalema, P.C.; Jumanne, N.S.; Mbuya, B.H.; Mtweve, J.T.; et al. Quantification and Analysis of Microplastics in Farmland Soils: Characterization, Sources, and Pathways. Agriculture 2021, 11, 330. https://doi.org/10.3390/ agriculture11040330 Received: 5 March 2021 Accepted: 7 April 2021 Published: 8 April 2021 Publisher’s Note: MDPI stays neutral with regard to jurisdictional claims in published maps and institutional affil- iations. Copyright: © 2021 by the authors. Licensee MDPI, Basel, Switzerland. This article is an open access article distributed under the terms and conditions of the Creative Commons Attribution (CC BY) license (https:// creativecommons.org/licenses/by/ 4.0/). 1 International College of Practice and Education for the Environment, International Program for Sustainable Development, Chang Jung Christian University, No.1, Changda Rd., Gueiren District, Tainan City 71101, Taiwan; [email protected] (N.T.Y.); [email protected] (A.M.M.); [email protected] (N.N.L.); [email protected] (F.B.M.); [email protected] (P.C.J.); [email protected] (N.S.J.); [email protected] (B.H.M.); [email protected] (J.T.M.) 2 Graduate Institute of Environmental Engineering, National Taiwan University, No.1, Sec.4, Roosevelt Rd., Taipei 106, Taiwan; [email protected] 3 Water Innovation, Low-Carbon and Environmental Sustainability Research Center, College of Engineering, National Taiwan University, Taipei 106, Taiwan 4 Department of Geomatics Engineering, National Cheng Kung University, No.1, University Road, Tainan City 701, Taiwan; [email protected] * Correspondence: [email protected]; Tel.: +886-6-2785123 Abstract: While microplastics (MPs) have been identified extensively in aquatic ecosystems, their presence remains largely unexplored in soil ecosystems. Considering the potential effect of MPs on soil biodiversity and function, the present study investigated and analyzed the abundance and characteristics of MPs in soil profile. Taking soil samples from Tainan city farms, as one of the hotspots of agricultural practices in Taiwan, concentrations, types, compositions, pathways, and sources of MPs in farmland soils were quantified. Results showed that MPs were found in all soil samples in different depths ranging from 12–117 items/m 2 and MP abundance in farms adjacent to the suburban roads was about three times more than in enclosed farms separated from roads. Fragment and fibers were the main forms and low-density polyethylene was the dominant polymer of detected MPs. Historical land use, extensive application of plastic mulch, and utilization of fruit protection foams were identified as the main sources of MPs in farmlands. This study identifies the presence of MP emissions in farmland soils and investigates its features, which could serve as a framework for future studies into the ecological effects of MPs in the terrestrial environment. Keywords: microplastics; farmland; soil; polyethylene; fibers; fragments; foams 1. Introduction Plastic products are commonly used in daily life due to their low cost, malleability, and durability. Over the last 50 years, global plastic production has reached 9.1 billion tons, with an average annual growth rate of 8.7% [1]. Owing to massive processing and inefficient management, the plastic waste problem is unquestionably a major environmental concern. Despite the fact that the rate of plastic recycling is increasing and most plastic products and their residues are still released into the environmen; in 2015, for example, an estimated 250 million tons of plastics were released into the ocean [2]. Moreover, UV radiation, wind or water erosion, and other physical, chemical, and biological drivers can degrade plastic litter in the environment, resulting in smaller plastic debris [3]. Meso-, micro-, and nanoplastic particles are generally defined as <25 mm–5 mm, 5 mm–1 μm, and <1 μm, respectively [4], and they can originate from primary or secondary production [5]. Agriculture 2021, 11, 330. https://doi.org/10.3390/agriculture11040330 https://www.mdpi.com/journal/agriculture
Transcript of Quantification and Analysis of Microplastics in Farmland ...
agriculture
Article
Quantification and Analysis of Microplastics in Farmland Soils:Characterization, Sources, and Pathways
Hoda Fakour 1,* , Shang-Lien Lo 2,3, Nathan Thadeo Yoashi 1, Angelbetter Marselian Massao 1,Nelson Naboth Lema 1, Fezile Bethusile Mkhontfo 1, Patrick Chris Jomalema 1, Nasra Shabani Jumanne 1,Bright Hubert Mbuya 1, James Travor Mtweve 1 and Moslem Imani 4
�����������������
Citation: Fakour, H.; Lo, S.-L.;
Yoashi, N.T.; Massao, A.M.; Lema,
N.N.; Mkhontfo, F.B.; Jomalema, P.C.;
Jumanne, N.S.; Mbuya, B.H.; Mtweve,
J.T.; et al. Quantification and Analysis
of Microplastics in Farmland Soils:
Characterization, Sources, and
Pathways. Agriculture 2021, 11, 330.
https://doi.org/10.3390/
agriculture11040330
Received: 5 March 2021
Accepted: 7 April 2021
Published: 8 April 2021
Publisher’s Note: MDPI stays neutral
with regard to jurisdictional claims in
published maps and institutional affil-
iations.
Copyright: © 2021 by the authors.
Licensee MDPI, Basel, Switzerland.
This article is an open access article
distributed under the terms and
conditions of the Creative Commons
Attribution (CC BY) license (https://
creativecommons.org/licenses/by/
4.0/).
1 International College of Practice and Education for the Environment, International Program for SustainableDevelopment, Chang Jung Christian University, No.1, Changda Rd., Gueiren District,Tainan City 71101, Taiwan; [email protected] (N.T.Y.); [email protected] (A.M.M.);[email protected] (N.N.L.); [email protected] (F.B.M.);[email protected] (P.C.J.); [email protected] (N.S.J.);[email protected] (B.H.M.); [email protected] (J.T.M.)
2 Graduate Institute of Environmental Engineering, National Taiwan University, No.1, Sec.4, Roosevelt Rd.,Taipei 106, Taiwan; [email protected]
3 Water Innovation, Low-Carbon and Environmental Sustainability Research Center, College of Engineering,National Taiwan University, Taipei 106, Taiwan
4 Department of Geomatics Engineering, National Cheng Kung University, No.1, University Road,Tainan City 701, Taiwan; [email protected]
* Correspondence: [email protected]; Tel.: +886-6-2785123
Abstract: While microplastics (MPs) have been identified extensively in aquatic ecosystems, theirpresence remains largely unexplored in soil ecosystems. Considering the potential effect of MPson soil biodiversity and function, the present study investigated and analyzed the abundance andcharacteristics of MPs in soil profile. Taking soil samples from Tainan city farms, as one of thehotspots of agricultural practices in Taiwan, concentrations, types, compositions, pathways, andsources of MPs in farmland soils were quantified. Results showed that MPs were found in all soilsamples in different depths ranging from 12–117 items/m2 and MP abundance in farms adjacentto the suburban roads was about three times more than in enclosed farms separated from roads.Fragment and fibers were the main forms and low-density polyethylene was the dominant polymerof detected MPs. Historical land use, extensive application of plastic mulch, and utilization of fruitprotection foams were identified as the main sources of MPs in farmlands. This study identifiesthe presence of MP emissions in farmland soils and investigates its features, which could serve as aframework for future studies into the ecological effects of MPs in the terrestrial environment.
Keywords: microplastics; farmland; soil; polyethylene; fibers; fragments; foams
1. Introduction
Plastic products are commonly used in daily life due to their low cost, malleability, anddurability. Over the last 50 years, global plastic production has reached 9.1 billion tons, withan average annual growth rate of 8.7% [1]. Owing to massive processing and inefficientmanagement, the plastic waste problem is unquestionably a major environmental concern.Despite the fact that the rate of plastic recycling is increasing and most plastic productsand their residues are still released into the environmen; in 2015, for example, an estimated250 million tons of plastics were released into the ocean [2]. Moreover, UV radiation, windor water erosion, and other physical, chemical, and biological drivers can degrade plasticlitter in the environment, resulting in smaller plastic debris [3].
Meso-, micro-, and nanoplastic particles are generally defined as <25 mm–5 mm,5 mm–1 µm, and <1 µm, respectively [4], and they can originate from primary or secondaryproduction [5].
Agriculture 2021, 11, 330. https://doi.org/10.3390/agriculture11040330 https://www.mdpi.com/journal/agriculture

Agriculture 2021, 11, 330 2 of 16
Microplastic (MP) pollution, which consists of wide range of different types and size,was first found in marine environments; as a result, several studies have focused on theorigin, occurrence, and fate of marine MPs and their effects on aquatic life [6,7]. Giventhat most plastic waste is generated and emitted on land, it’s surprising that MP researchhas only recently extended to terrestrial environments, where soils can be a substantiallong-term sink for MP particles [8]. Urban and agricultural soils are considered to beparticularly vulnerable to MP emissions as they are the epicenter of human activities,and consequently, MP input routes [9]. For many organisms, the most common routeof plastic-mediated contaminant uptake is by ingestion. Not only is plastic waste eatenby more than 180 species, but also a positive correlation was found between the massof consumed plastic and the concentration of polychlorinated biphenyls (PCBs) in birds.Since plastics can accumulate PCBs, this correlation suggests that contaminants can betransferred to other species through plastic particles [9]. Moreover, a recent study by Liet al. [10] on the measurement of MPs uptake by plants demonstrated the uptake andtransport of polystyrene (PS) microbeads by plant roots and the in vivo distribution intothe stem and leaves. MP can reach the soil as primary MP from industrial products throughsludge application [11] or as secondary MP from plastic mulch degradation, which is alsoa common practice in agricultural activities in many countries, including Taiwan.
Though the advantages of mulching for enhancing yield and crop growth have longbeen recognized [12], the use of plastic mulch in agriculture has increased dramaticallyglobally in the last ten years. This improvement is due to benefits such as increasedsoil temperature, reduced weed burden, maintained moisture, reduced certain insectpests, increased crop yields, and more productive use of soil nutrients [13]. Conventionalpolyethylene (PE) films are the predominant mulching products consist of low-densitypolyethylene (LDPE), linear low-density polyethylene (LLDPE), and high-density polyethy-lene (HDPE) [14,15].
Plastic goods are a mass product in the economy and in our daily lives due to awide variety of useful attributes [16]. However, the widespread use of plastics, such asin the packaging industry, has led to the widespread distribution of plastics in naturalsinks such as the oceans and soils [17,18]. Furthermore, the use of bio-waste as fertilizer,especially composted organic material, can be a significant route for plastic to enter thesoil. Inefficient waste isolation, such as ignoring plastic labels and packages derived fromfruits and vegetable protection covers in bio-waste processing, may leave some plasticparticles, some of which can end up in compost and degrade to MPs [19]. Furthermore,even biodegradable plastics take longer to decompose and a consistently high temperatureis also required [20].
Another less discussed source of MP with a special application in the packaging indus-try is the fruit package expanded polyethylene (EPE) foam net used for the fruit packageduring the growing season and to shield it from damage. Not only can foam packagingextend the shelf life of organic products by preserving the physicochemical propertiesof the fruit [21], but EPE foam is also inexpensive to manufacture, highly lightweight,damage-resistant, waterproof, and a cost-effective product. In fact, fruit-packing EPE foamnet is a new type of soft packing material called pearl cotton, where the base polymer forEPE foams range from LDPE to HDPE [22]. Because of these characteristics, it is commonlyused in agricultural practices for better aesthetics, efficiency, and hygiene in cultivation,transit, and handling. Fruit-protected foam (e.g., for guava) is used by many Taiwanesefarmers because of its various advantages. Unfortunately, because of these characteristics,it is prone to potential problems in agricultural activities. EPE foam is light and quicklyfragmented and swept away by wind and human activity, and it becomes brittle whenexposed to UV rays in sunlight, where it is burrowed into the soil media by invertebrates,resulting in contamination of farmlands. Furthermore, several farmers will add anotherlayer of transparent plastic to EPE foam to improve its fruit safety quality, and many ofthese items will be left on the farms after harvesting.

Agriculture 2021, 11, 330 3 of 16
In addition, many urban resident farmers cultivate their food on land near the road,along with roads and strips of land. They also make use of the public services for powerlines or rail tracks. While roadside farming has some particular benefits, such as making iteasier for the farm to take crops, fertilizers or water, and making it easier to sell agriculturalproducts, farms situated nearby roads are more likely to experience different environmentalcontamination. In fact, street or road dust is an important pollution source that consists ofa diverse combination of materials consisting of atmospheric deposits, garbage, car tires,and particulate matter that have been contaminated by diffuse sources [23]. Although alarge number of pollutants have been confirmed in roadside soil, there are few records ofMP abundance in such dust, which could be a major transport phase. Preliminary researchin Iran revealed up to 900 MPs in 15 g of street dust samples [24].
Moreover, tire wear particles generated by the abrasion of tire tread against roadsurfaces have recently been recognized to be a major contributor of MP emissions to theenvironment [25]. In a study by Knight et al. [26], the greatest abundance of tire wearparticles in the natural environment was found in the soil beneath the expressway bridgerather than the river or estuary sediment. Several primary pathways such as atmosphericfallout, direct road, stormwater run-off, and treated wastewater effluent assumed to beresponsible for carrying tire wear particles into the natural ecosystem. Sommer et al. [25]demonstrated that tire-derived MPs are composed of not just the original rubber core withits different additives (e.g., Al, Ti, Fe, Zn, Cd, Sb, or Pb), but also potentially hazardousmetals and metalloids found in the attached brake-abrasion particles (e.g., Al, Fe, Cu, Sb,or Ba). The presence of these additional materials in the encrustment increases the risk ofenvironmental harm caused by tire-wear particles [25].
Knowledge of MPs in soils is currently very low and investigating the contaminationproperties of soil MPs is still a big challenge [27]. Soil MP has been recently acknowledgedby research communities and increasing number of researches are being performed toevaluate the potential MP source and pathways in soil and solid mediums. MP accu-mulating in agricultural soils as a result of sewage sludge applications was studied byCorradini et al. [28] indicating that that MP counts increase over time where successivesludge applications are performed. In another study by Berriot et al. [29], the plasticcontamination in agricultural soil in Spain and the ingestion of plastic by sheep was as-sessed where the potential transport of MPs due to a herd of 1000 sheep was estimated tobe ~106 particles ha−1 y−1. Table 1 summarizes the most recent studies on MP contamina-tion in agricultural soil samples.
Table 1. Recent studies on MP identification in agricultural soils.
Region MP Source SamplingDepth
No. of Soil Samples(Excluding Control
Samples)Main Extraction Method Identification
Method Unit Reference
Chile sludge application 0–25 cm 93Centrifuge, density
separation by NaCl andZnCl2
Stereomicroscope
Particles/5g−1 dryweight
[28]
China pig manure ~20 cm 20
Continuous air-flowflotation separation,
Density separation byNaCl
Stereomicroscope,ATR-FTIR,scanningelectron
microscope(SEM)
Particles/kgdry weight [30]
China plastic mulching 20 cm 20 Wet sieving, densityseparation, carbonation
SEM,ATR-FTIR
Numbers/kgdry mass [31]
ChinaLarge traffic flow,
domestic wastes, andagricultural activities
top 5 cm 20 Density separation byZnCl2
Stereomicroscope,
micro-Ramanspectroscopy
Items/kgdry weight [32]
Spain plastic mulching 0–10 cm 9 Centrifuge, ultrasonicbath
Stereomicroscope
Particles/kgdry matter [29]
Germanyapplication of manure,
littering, mulching, andsilage
0–10 cm,10–20 cmand 20–30
cm
540 Wet sievingStereo
microscope,FTIR
MP/kg dryweight [33]
Taiwan
Historical fish farming,fruit protective foam,nearby roads, mulch,
plastic debris
0–5 cm,20–25 cm 150 Density separation by
NaCl
Stereomicroscope,ATR-FTIR
MPitems/m2
Presentstudy

Agriculture 2021, 11, 330 4 of 16
Despite the importance of soil MP in the food chain and public health, authors arenot aware of any legislation on monitoring soil MPs, and since there is no internationallyestablished assessments for health risks and safe quantities, MPs produced from thebreakdown of everyday plastic products are likely entering the human body via the foodchain [34]. It is therefore important to better understand the routes by which MPs accessthe terrestrial ecosystem and to explore their characterization of various categories of landuse. Knowing agriculture as a significant field of Taiwanese life since ages ago and TainanCity as an important supply of agricultural goods, this study aims at quantifying andidentifying MP particles in agricultural soils in Tainan City, Taiwan, and provides usefulinformation for future MP research in terrestrial ecosystems.
2. Materials and Methods2.1. Study Area
The study area is selected as farmlands in Tainan City, Guiren District (Figure 1). Fivefarmlands were selected based on their location and type of farming activities, with areasranging from 177 to 3054 m2 (Table 2).
Agriculture 2021, 10, x FOR PEER REVIEW 5 of 16
(a)
(b)
Figure 1. Location of study area: (a) Tainan City, Guiren district, and (b) farmlands in the present study (A, B, C, D, and E) (Google Earth Pro 7.3.3.7786 (2021)).
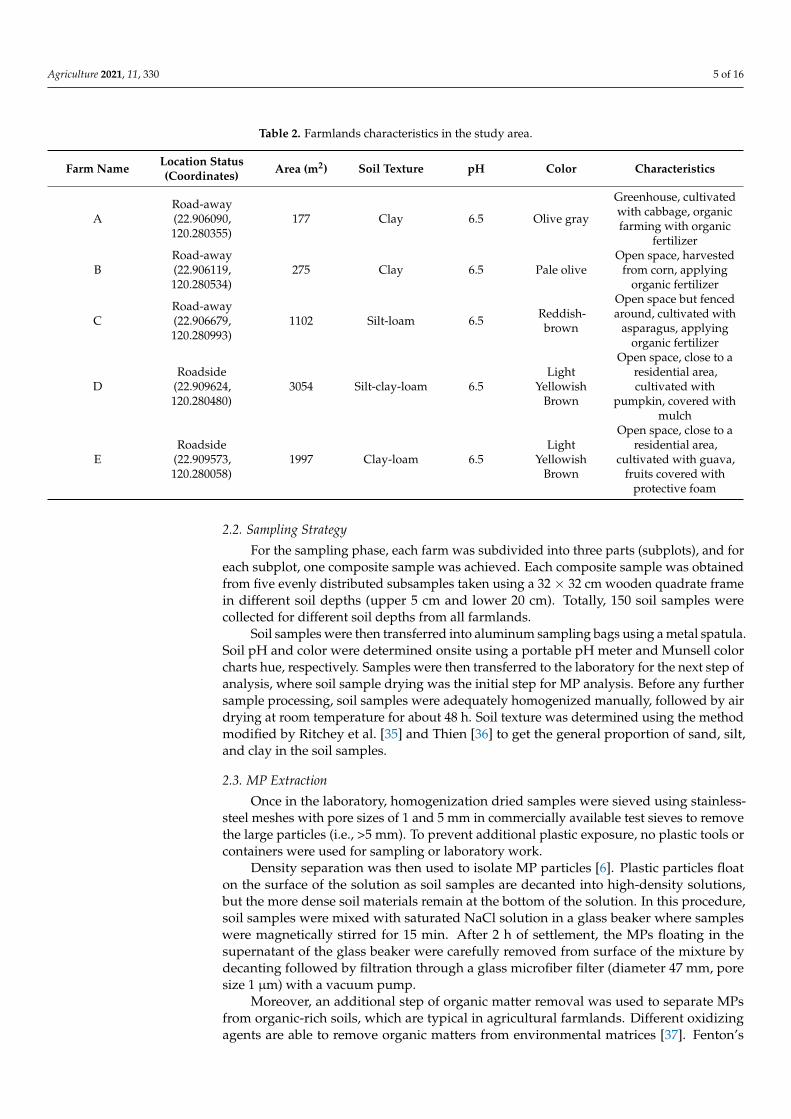
Table 2. Farmlands characteristics in the study area.
Farm Name
Location Status (Coordinates) Area (m2) Soil Texture pH Color Characteristics
A Road-away (22.906090, 120.280355)
177 Clay 6.5 Olive gray Greenhouse, cultivated with cabbage, organic farming with organic fer-
tilizer
B Road-away (22.906119, 120.280534)
275 Clay 6.5 Pale olive Open space, harvested from corn, applying organic fertilizer
C Road-away (22.906679, 120.280993)
1102 Silt-loam 6.5 Reddish-brown Open space but fenced around, cultivated with asparagus, applying or-
ganic fertilizer
D Roadside
(22.909624, 120.280480)
3054 Silt-clay-
loam 6.5 Light Yellowish
Brown Open space, close to a residential area, cultivated with pumpkin, cov-
ered with mulch
E Roadside
(22.909573, 120.280058)
1997 Clay-loam 6.5 Light Yellowish
Brown Open space, close to a residential area, cultivated with guava, fruits
covered with protective foam
Figure 1. Location of study area: (a) Tainan City, Guiren district, and (b) farmlands in the present study (A, B, C, D, and E)(Google Earth Pro 7.3.3.7786 (2021)).
Agriculture 2021, 11, 330 5 of 16
Table 2. Farmlands characteristics in the study area.
Farm Name Location Status(Coordinates) Area (m2) Soil Texture pH Color Characteristics
ARoad-away(22.906090,120.280355)
177 Clay 6.5 Olive gray
Greenhouse, cultivatedwith cabbage, organicfarming with organic
fertilizer
BRoad-away(22.906119,120.280534)
275 Clay 6.5 Pale oliveOpen space, harvested
from corn, applyingorganic fertilizer
CRoad-away(22.906679,120.280993)
1102 Silt-loam 6.5 Reddish-brown
Open space but fencedaround, cultivated with
asparagus, applyingorganic fertilizer
DRoadside
(22.909624,120.280480)
3054 Silt-clay-loam 6.5Light
YellowishBrown
Open space, close to aresidential area,cultivated with
pumpkin, covered withmulch
ERoadside
(22.909573,120.280058)
1997 Clay-loam 6.5Light
YellowishBrown
Open space, close to aresidential area,
cultivated with guava,fruits covered with
protective foam
2.2. Sampling Strategy
For the sampling phase, each farm was subdivided into three parts (subplots), and foreach subplot, one composite sample was achieved. Each composite sample was obtainedfrom five evenly distributed subsamples taken using a 32 × 32 cm wooden quadrate framein different soil depths (upper 5 cm and lower 20 cm). Totally, 150 soil samples werecollected for different soil depths from all farmlands.
Soil samples were then transferred into aluminum sampling bags using a metal spatula.Soil pH and color were determined onsite using a portable pH meter and Munsell colorcharts hue, respectively. Samples were then transferred to the laboratory for the next step ofanalysis, where soil sample drying was the initial step for MP analysis. Before any furthersample processing, soil samples were adequately homogenized manually, followed by airdrying at room temperature for about 48 h. Soil texture was determined using the methodmodified by Ritchey et al. [35] and Thien [36] to get the general proportion of sand, silt,and clay in the soil samples.
2.3. MP Extraction
Once in the laboratory, homogenization dried samples were sieved using stainless-steel meshes with pore sizes of 1 and 5 mm in commercially available test sieves to removethe large particles (i.e., >5 mm). To prevent additional plastic exposure, no plastic tools orcontainers were used for sampling or laboratory work.
Density separation was then used to isolate MP particles [6]. Plastic particles floaton the surface of the solution as soil samples are decanted into high-density solutions,but the more dense soil materials remain at the bottom of the solution. In this procedure,soil samples were mixed with saturated NaCl solution in a glass beaker where sampleswere magnetically stirred for 15 min. After 2 h of settlement, the MPs floating in thesupernatant of the glass beaker were carefully removed from surface of the mixture bydecanting followed by filtration through a glass microfiber filter (diameter 47 mm, poresize 1 µm) with a vacuum pump.
Moreover, an additional step of organic matter removal was used to separate MPsfrom organic-rich soils, which are typical in agricultural farmlands. Different oxidizingagents are able to remove organic matters from environmental matrices [37]. Fenton’s

Agriculture 2021, 11, 330 6 of 16
reagent is considered as an advanced oxidation process using hydrogen peroxide (H2O2) inthe presence of a catalyst (Fe2+). However, since the Fenton reaction is pH sensitive, an ironhydroxide precipitate will form if the pH increases above 5–6. Due to physical obscuration,this precipitate floats out during density separation, preventing visual inspection andchemical characterization. Furthermore, the acidity condition may cause certain polymersto degrade, affecting the calculation of total MPs. Moreover, Corradini et al. [28] found thatthe recovery of nylon and acrylic fibers was significantly reduced when Fenton’s reagentmethod was used. Therefore H2O2 was used as an oxidizing agent in the current studyas overnight or 24 h treatment with only 30% or 35% H2O2 was found not to affect plasticparticles [37].
Soil samples were thus treated with 30% H2O2 overnight to remove natural organicmaterial, followed by filtration and a second drying step. Filter papers were then saved inPetri dishes for further inspection and identification. A schematic diagram of analyticalprocedures for MPs extraction in soil samples is depicted in Figure 2.
Agriculture 2021, 10, x FOR PEER REVIEW 7 of 16
Figure 2. Schematic diagram in analytical procedures for MPs extraction in soil samples.
2.4. MP Identification and Characterization The size, type, and color of MPs can be used to classify them. Under a magnifying
lamp, MP samples were optically sorted and quantified, and then examined under a ste-reomicroscope (model SMZ 745 T coupled with a NI-150 high-intensity illuminator, Ni-kon, Tokyo, Japan) where the MP particles collected on each filter were counted twice. It was considered that MP particles had polished textures, bright colors, and sharp geomet-rical shapes. Synthetic fibers were known to have smooth sides and solid colors, as pointed out by Horton et al. [7]. Particles were classified according to their shapes: fibers, fragments (angular and solid), films (flexible and thin), foams (white and spongy), pellets (disc- or lentil-shaped), or microbeads (rounded and solid).
To identify the polymer composition of MPs, 42 items were picked up to be further analyzed by a Fourier transform infrared (FTIR) spectrometer (Model Spectrum One, Per-kin Elmer) equipped with a platinum ATR single reflection diamond crystal-based mod-ule in the mid IR range (525–4000 cm−1). Sixteen scans and 4 cm−1 resolution were applied and the obtained spectrums were compared with the standard database.
2.5. Statistical Analysis MPs were investigated according to color, size, composition, and type. The abundance
of MPs in the soil samples was expressed as particles/m2. The data are shown as mean ± standard deviation and were recorded and drawn using Microsoft Excel 2016 and SPSS 18.0 software package. The data were subjected to analysis of variance, sample t-test, and one-way ANOVA where differences at p < 0.05 were considered to be statistically significant.
2.6. Quality Assurance (QA) and Quality Control (QC) MP separation and extraction was carried out in a laboratory with no cross-contamina-
tion. To prevent false interpretation, all experiments were performed with deionized water and dustproof clothes. Since a site with zero plastic exposure could not be guaranteed, and there is no standard procedure for MP sampling technique in soil ecosystems, two methods were used for taking control samples. First, the US Department of Agriculture [38] and the US Environmental Protection Agency [39] sampling recommendations were adopted, which proposed taking control samples of the same soil type from a nearby region that was not contaminated by the contaminant of concern. While this could be difficult for MPs that are ubiquitously deposited in soil [40], it allowed for the quantification of MP background levels, the monitoring of contaminants added during sampling, and a greater understand-ing of matrix interferences. To comply with this approach, the control samples of the current study were first obtained from farm “A” and the location that meets the criteria of being far from the road, mulch free, protection foam-free, and fenced the surrounding. Although not completely free of plastics, the control site had the lowest MP count, where results were corrected by subtracting background values. Alternatively, another set of control samples without plastic particles was artificially made based on Corradini et al. [28] to check whether
Figure 2. Schematic diagram in analytical procedures for MPs extraction in soil samples.
2.4. MP Identification and Characterization
The size, type, and color of MPs can be used to classify them. Under a magnifyinglamp, MP samples were optically sorted and quantified, and then examined under a stere-omicroscope (model SMZ 745 T coupled with a NI-150 high-intensity illuminator, Nikon,Tokyo, Japan) where the MP particles collected on each filter were counted twice. It wasconsidered that MP particles had polished textures, bright colors, and sharp geometricalshapes. Synthetic fibers were known to have smooth sides and solid colors, as pointed outby Horton et al. [7]. Particles were classified according to their shapes: fibers, fragments(angular and solid), films (flexible and thin), foams (white and spongy), pellets (disc- orlentil-shaped), or microbeads (rounded and solid).
To identify the polymer composition of MPs, 42 items were picked up to be furtheranalyzed by a Fourier transform infrared (FTIR) spectrometer (Model Spectrum One, PerkinElmer) equipped with a platinum ATR single reflection diamond crystal-based module inthe mid IR range (525–4000 cm−1). Sixteen scans and 4 cm−1 resolution were applied andthe obtained spectrums were compared with the standard database.
2.5. Statistical Analysis
MPs were investigated according to color, size, composition, and type. The abun-dance of MPs in the soil samples was expressed as particles/m2. The data are shownas mean ± standard deviation and were recorded and drawn using Microsoft Excel 2016and SPSS 18.0 software package. The data were subjected to analysis of variance, sam-ple t-test, and one-way ANOVA where differences at p < 0.05 were considered to bestatistically significant.
Agriculture 2021, 11, 330 7 of 16
2.6. Quality Assurance (QA) and Quality Control (QC)
MP separation and extraction was carried out in a laboratory with no cross-contamination. To prevent false interpretation, all experiments were performed with deionized waterand dustproof clothes. Since a site with zero plastic exposure could not be guaranteed, andthere is no standard procedure for MP sampling technique in soil ecosystems, two methodswere used for taking control samples. First, the US Department of Agriculture [38] andthe US Environmental Protection Agency [39] sampling recommendations were adopted,which proposed taking control samples of the same soil type from a nearby region thatwas not contaminated by the contaminant of concern. While this could be difficult forMPs that are ubiquitously deposited in soil [40], it allowed for the quantification of MPbackground levels, the monitoring of contaminants added during sampling, and a greaterunderstanding of matrix interferences. To comply with this approach, the control sam-ples of the current study were first obtained from farm “A” and the location that meetsthe criteria of being far from the road, mulch free, protection foam-free, and fenced thesurrounding. Although not completely free of plastics, the control site had the lowestMP count, where results were corrected by subtracting background values. Alternatively,another set of control samples without plastic particles was artificially made based onCorradini et al. [28] to check whether the transportation and handling polluted the sampleswith plastic, influencing the quality of the analysis. To ensure the removal of all plasticparticles, agricultural soil samples were collected from each farm, dried, sieved, and ig-nited at 500 ◦C for 3 h [41]. To simulate sample transportation to the laboratory, threereplicates (450 g) of the ignited soil were placed in aluminum bags (same as experimentalsamples) and shaken at 120 rpm for 20 min in an orbital shaker. After that, the sampleswere unpacked and tested in the same manner as other samples. The risk of contaminationwas minimized by using non-plastic sampling tools and containers, as well as avoiding theuse of plastic shovels or nitrile gloves.
A recovery experiment was set up using triplicates based on the procedures describedin Section 2.3. Six soil samples were spiked with 15 particles between 1 and 5 mm, includingfive black fragment, five white foams, and five fibers. The average recoveries ranged from85 to 95%, with fibers giving the lowest recoveries.
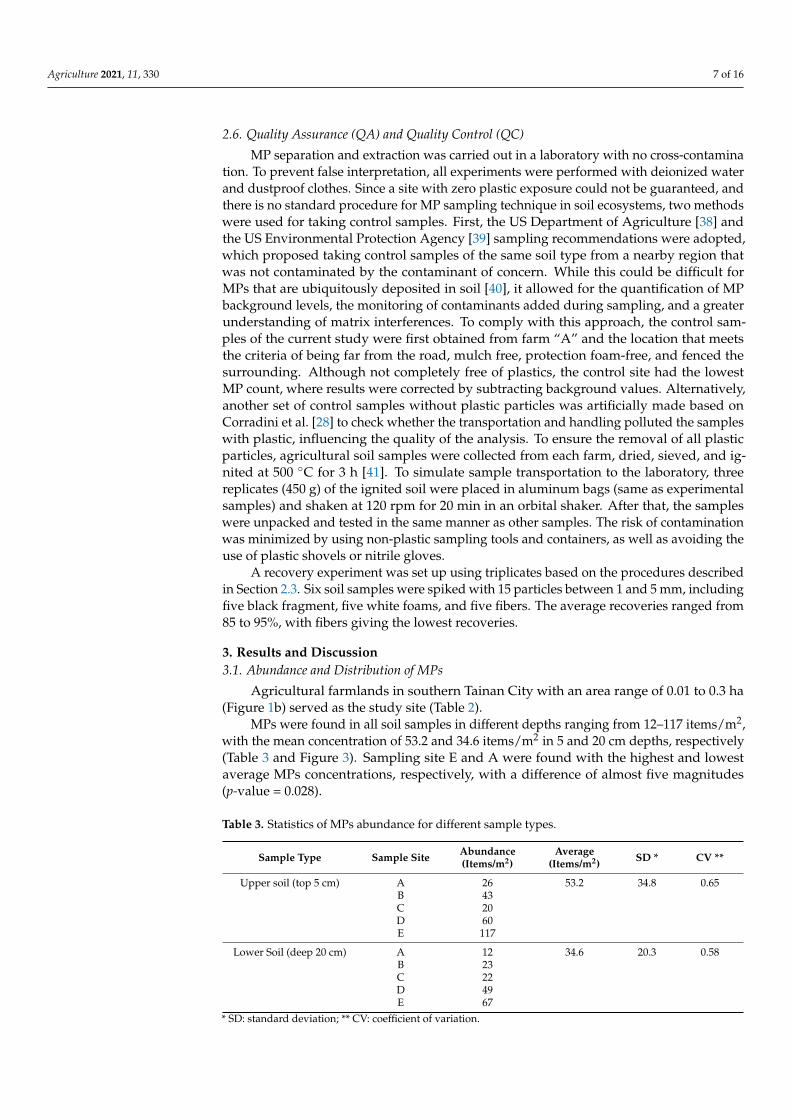
3. Results and Discussion3.1. Abundance and Distribution of MPs
Agricultural farmlands in southern Tainan City with an area range of 0.01 to 0.3 ha(Figure 1b) served as the study site (Table 2).
MPs were found in all soil samples in different depths ranging from 12–117 items/m2,with the mean concentration of 53.2 and 34.6 items/m2 in 5 and 20 cm depths, respectively(Table 3 and Figure 3). Sampling site E and A were found with the highest and lowestaverage MPs concentrations, respectively, with a difference of almost five magnitudes(p-value = 0.028).
Table 3. Statistics of MPs abundance for different sample types.
Sample Type Sample Site Abundance(Items/m2)
Average(Items/m2) SD * CV **
Upper soil (top 5 cm) A 26 53.2 34.8 0.65B 43C 20D 60E 117
Lower Soil (deep 20 cm) A 12 34.6 20.3 0.58B 23C 22D 49E 67
* SD: standard deviation; ** CV: coefficient of variation.

Agriculture 2021, 11, 330 8 of 16
Agriculture 2021, 10, x FOR PEER REVIEW 8 of 16
the transportation and handling polluted the samples with plastic, influencing the quality of the analysis. To ensure the removal of all plastic particles, agricultural soil samples were collected from each farm, dried, sieved, and ignited at 500 °C for 3 h [41]. To simulate sample transportation to the laboratory, three replicates (450 g) of the ignited soil were placed in aluminum bags (same as experimental samples) and shaken at 120 rpm for 20 min in an orbital shaker. After that, the samples were unpacked and tested in the same manner as other samples. The risk of contamination was minimized by using non-plastic sampling tools and containers, as well as avoiding the use of plastic shovels or nitrile gloves.
A recovery experiment was set up using triplicates based on the procedures de-scribed in Section 2.3. Six soil samples were spiked with 15 particles between 1 and 5 mm, including five black fragment, five white foams, and five fibers. The average recoveries ranged from 85 to 95%, with fibers giving the lowest recoveries.
3. Results and Discussion 3.1. Abundance and Distribution of MPs
Agricultural farmlands in southern Tainan City with an area range of 0.01 to 0.3 ha (Figure 1b) served as the study site (Table 2).
MPs were found in all soil samples in different depths ranging from 12–117 items/m2, with the mean concentration of 53.2 and 34.6 items/m2 in 5 and 20 cm depths, respectively (Table 3 and Figure 3). Sampling site E and A were found with the highest and lowest average MPs concentrations, respectively, with a difference of almost five magnitudes (p-value = 0.028).
Figure 3. MPs abundance in farmlands under the study at different depths.
Table 3. Statistics of MPs abundance for different sample types.
Sample Type Sample Site Abundance (Items/m2)
Average (Items/m2)
SD * CV **
Upper soil (top 5 cm) A 26 53.2 34.8 0.65 B 43 C 20 D 60 E 117
Lower Soil (deep 20 cm) A 12 34.6 20.3 0.58 B 23 C 22 D 49 E 67
* SD: standard deviation; ** CV: coefficient of variation.
Figure 3. MPs abundance in farmlands under the study at different depths.
The high concentration of MPs in Farm E can be attributed to its special characteristicsas it was adjacent to the suburban roads planted with guava where most of the fruits werefully covered with protective foams and a plastic wrap, which are easily fragmented andcarried off by wind and human activities, become brittle when exposed to UV rays insunlight, and are burrowed into the soil media resulting in farmlands pollution (Table 2and Figure 4).
Agriculture 2021, 10, x FOR PEER REVIEW 9 of 16
The high concentration of MPs in Farm E can be attributed to its special characteristics as it was adjacent to the suburban roads planted with guava where most of the fruits were fully covered with protective foams and a plastic wrap, which are easily fragmented and carried off by wind and human activities, become brittle when exposed to UV rays in sunlight, and are burrowed into the soil media resulting in farmlands pollution (Table 2 and Figure 4).
Figure 4. Fruit packing EPE foam net and plastic cover used for the package for the fruits in farm E.
On the other hand, farm A, is an enclosed greenhouse apart from suburban road planting with cabbage which needs regular monitoring and managed practice.
Around suburban roads and residential districts, there are numerous sources of MPs emissions. Tire tread particles, in addition to plastic debris from buildings and residential areas, have recently been identified as an environmental source of MPs. They are scattered through the environment as a result of the frictional interface between the tire and the road surface [42]. Chen et al. [32] also proved that the mean abundance of MPs levels is higher in areas adjacent to the suburban roads than those are far from the roadside.
Besides, t-test analysis results showed no statistically significant difference between mean MPs particles in two different depths (p-value = 0.383). As shown in Figure 3, there was as high as 67 items/m2 in deep soil samples, which shows MPs have been detected in various soil profiles, likely as a result of movement through cracks, fissures, and biopores, including earthworm burrows and root channels [43].
3.2. MP’s Size Distribution Generally, MPs of 1−3 mm and >5 mm accounted for the largest and smallest propor-
tions of all soil samples MPs, respectively (Figure 5a). The average proportions of MPs was 2.56 mm and 1.43 mm in upper and lower soil layers, respectively (Figure 5b) where farms D and E showed an overall larger size of MPs. Unlike the insignificant difference in distribution and availability of MPs in different soil depths (Section 3.1), deeper soil sam-ples contained significantly smaller size of MPs compared with surface soil (p-value = 0.011). These MPs with small particle sizes are easily ingested by organisms and may enter higher trophic levels in the food web [44].
Figure 5. Size distribution of MPs in (a) all soil samples, and (b) in different farms under different depth.
Figure 4. Fruit packing EPE foam net and plastic cover used for the package for the fruits in farm E.
On the other hand, farm A, is an enclosed greenhouse apart from suburban roadplanting with cabbage which needs regular monitoring and managed practice.
Around suburban roads and residential districts, there are numerous sources of MPsemissions. Tire tread particles, in addition to plastic debris from buildings and residentialareas, have recently been identified as an environmental source of MPs. They are scatteredthrough the environment as a result of the frictional interface between the tire and the roadsurface [42]. Chen et al. [32] also proved that the mean abundance of MPs levels is higherin areas adjacent to the suburban roads than those are far from the roadside.
Besides, t-test analysis results showed no statistically significant difference betweenmean MPs particles in two different depths (p-value = 0.383). As shown in Figure 3, therewas as high as 67 items/m2 in deep soil samples, which shows MPs have been detected invarious soil profiles, likely as a result of movement through cracks, fissures, and biopores,including earthworm burrows and root channels [43].
3.2. MP’s Size Distribution
Generally, MPs of 1−3 mm and >5 mm accounted for the largest and smallest propor-tions of all soil samples MPs, respectively (Figure 5a). The average proportions of MPs was2.56 mm and 1.43 mm in upper and lower soil layers, respectively (Figure 5b) where farms

Agriculture 2021, 11, 330 9 of 16
D and E showed an overall larger size of MPs. Unlike the insignificant difference in distri-bution and availability of MPs in different soil depths (Section 3.1), deeper soil samplescontained significantly smaller size of MPs compared with surface soil (p-value = 0.011).These MPs with small particle sizes are easily ingested by organisms and may enter highertrophic levels in the food web [44].
Agriculture 2021, 10, x FOR PEER REVIEW 9 of 16
The high concentration of MPs in Farm E can be attributed to its special characteristics as it was adjacent to the suburban roads planted with guava where most of the fruits were fully covered with protective foams and a plastic wrap, which are easily fragmented and carried off by wind and human activities, become brittle when exposed to UV rays in sunlight, and are burrowed into the soil media resulting in farmlands pollution (Table 2 and Figure 4).
Figure 4. Fruit packing EPE foam net and plastic cover used for the package for the fruits in farm E.
On the other hand, farm A, is an enclosed greenhouse apart from suburban road planting with cabbage which needs regular monitoring and managed practice.
Around suburban roads and residential districts, there are numerous sources of MPs emissions. Tire tread particles, in addition to plastic debris from buildings and residential areas, have recently been identified as an environmental source of MPs. They are scattered through the environment as a result of the frictional interface between the tire and the road surface [42]. Chen et al. [32] also proved that the mean abundance of MPs levels is higher in areas adjacent to the suburban roads than those are far from the roadside.
Besides, t-test analysis results showed no statistically significant difference between mean MPs particles in two different depths (p-value = 0.383). As shown in Figure 3, there was as high as 67 items/m2 in deep soil samples, which shows MPs have been detected in various soil profiles, likely as a result of movement through cracks, fissures, and biopores, including earthworm burrows and root channels [43].
3.2. MP’s Size Distribution Generally, MPs of 1−3 mm and >5 mm accounted for the largest and smallest propor-
tions of all soil samples MPs, respectively (Figure 5a). The average proportions of MPs was 2.56 mm and 1.43 mm in upper and lower soil layers, respectively (Figure 5b) where farms D and E showed an overall larger size of MPs. Unlike the insignificant difference in distribution and availability of MPs in different soil depths (Section 3.1), deeper soil sam-ples contained significantly smaller size of MPs compared with surface soil (p-value = 0.011). These MPs with small particle sizes are easily ingested by organisms and may enter higher trophic levels in the food web [44].
Figure 5. Size distribution of MPs in (a) all soil samples, and (b) in different farms under different depth. Figure 5. Size distribution of MPs in (a) all soil samples, and (b) in different farms under differ-ent depth.
Farm D was extensively covered with plastic mulch (Table 2 and Figure 6), and Plasticmulching is suspected to be a major source of MPs in farmland soil, since the mulch is oftenleft on the fields after harvesting, resulting in hotspots of plastic waste [45]. As a result ofphotolytic, mechanical, and biological degradation, large quantities of (micro-) plastics areburied in topsoil and plowed soil [46], and most of the plastic mulch broken into smallerparts (5 mm, i.e., MPs) becomes an MP pollutant [47,48].
Agriculture 2021, 10, x FOR PEER REVIEW 10 of 16
Farm D was extensively covered with plastic mulch (Table 2 and Figure 6), and Plas-tic mulching is suspected to be a major source of MPs in farmland soil, since the mulch is often left on the fields after harvesting, resulting in hotspots of plastic waste [45]. As a result of photolytic, mechanical, and biological degradation, large quantities of (micro-) plastics are buried in topsoil and plowed soil [46], and most of the plastic mulch broken into smaller parts (5 mm, i.e., MPs) becomes an MP pollutant [47,48].
Figure 6. Extensive application of plastic mulch in farm D, cultivated by pumpkin.
The size of MP particles has been shown to have an effect on soil organisms. MPs in soils can be consumed [49] or transported to other soil organisms [50,51], resulting in ad-verse physiological effects [52]. Rillig et al. [53], for example, investigated how the earth-worm transports MPs of different sizes. While different MP particles were found in the middle and bottom layers of the soil after exposure to MPs, and small size particles were found in the lowest soil layer. MPs impacted the growth, survival, reproduction, and im-mune system of the worm Eisenia andrei, according to Rodriguez-Seijo et al. [54]. Organic contaminants, such as chemical additives and hydrophobic chemical molecules, are also carried by MPs [55]. MPs with a particle size of less than 1 mm, can be thus extremely detrimental to local soil species and the agricultural ecosystem.
There was no significant difference in the size distribution of MPs between farms adjacent to suburban roads and road-away farms (p-value = 0.281), indicating that the size distribution of MP particles is irrelevant to the locations of sampling sites. This is in line with Chen et al. [32], who studied MP emissions in vegetable farmlands in the suburbs of Wuhan, China, and found that environmental conditions were the primary cause of chem-ical changes in plastics, which made them more brittle and eventually led to the accumu-lation of small-sized MPs in the soil.
3.3. MP’s Shape and Identification The MPs were classified into six categories based on their characteristics and mor-
phology, namely fibers (elongated strings), pellets (disc- or lentil-shaped), films (soft transparent flakes), fragments (hard angular pieces), foams (White and spongy, often spherical), and (f) microbeads (Small, solid, manufactured plastic particles) (Figure 7). The various sources of plastic waste surrounding the sample sites could explain the heteroge-neity of the dominant shapes of MPs in each site. In total, fragments and fibers were the dominated shapes of MPs, accounting for 43% and 21% respectively, followed by the foams (16%), films (13%), pellets (6%), microbeads (0.6%), and others (0.4%) (Figure 8).
Figure 6. Extensive application of plastic mulch in farm D, cultivated by pumpkin.
The size of MP particles has been shown to have an effect on soil organisms. MPsin soils can be consumed [49] or transported to other soil organisms [50,51], resulting inadverse physiological effects [52]. Rillig et al. [53], for example, investigated how theearthworm transports MPs of different sizes. While different MP particles were found inthe middle and bottom layers of the soil after exposure to MPs, and small size particleswere found in the lowest soil layer. MPs impacted the growth, survival, reproduction, andimmune system of the worm Eisenia andrei, according to Rodriguez-Seijo et al. [54]. Organiccontaminants, such as chemical additives and hydrophobic chemical molecules, are alsocarried by MPs [55]. MPs with a particle size of less than 1 mm, can be thus extremelydetrimental to local soil species and the agricultural ecosystem.
There was no significant difference in the size distribution of MPs between farmsadjacent to suburban roads and road-away farms (p-value = 0.281), indicating that the sizedistribution of MP particles is irrelevant to the locations of sampling sites. This is in linewith Chen et al. [32], who studied MP emissions in vegetable farmlands in the suburbs

Agriculture 2021, 11, 330 10 of 16
of Wuhan, China, and found that environmental conditions were the primary cause ofchemical changes in plastics, which made them more brittle and eventually led to theaccumulation of small-sized MPs in the soil.
3.3. MP’s Shape and Identification
The MPs were classified into six categories based on their characteristics and morphol-ogy, namely fibers (elongated strings), pellets (disc- or lentil-shaped), films (soft transparentflakes), fragments (hard angular pieces), foams (White and spongy, often spherical), and (f)microbeads (Small, solid, manufactured plastic particles) (Figure 7). The various sources ofplastic waste surrounding the sample sites could explain the heterogeneity of the dominantshapes of MPs in each site. In total, fragments and fibers were the dominated shapes ofMPs, accounting for 43% and 21% respectively, followed by the foams (16%), films (13%),pellets (6%), microbeads (0.6%), and others (0.4%) (Figure 8).
Agriculture 2021, 10, x FOR PEER REVIEW 11 of 16
Figure 7. Different shape of MPs detected in this study including (a) fibers, (b) pellets, (c) films, (d) fragments, (e) foams, and (f) microbeads.
Figure 8. Type distribution of MPs detected in the studied farmlands.
While the one-way ANOVA test indicated that there is a significant difference be-tween number of MPs in different farmlands (p-value = 0.042), first three farms (A, B, and C) showed similar range of microfiber items in soil samples where other types were in different proportions. If control and remediation efforts are to be successful, it is important to consider the origins and distribution of microfibers in the environment.
While primary causes are yet to be thoroughly studied, domestic laundry discharges were once thought to be the main source of fibrous MPs. Recent research, however, con-tradicts this assertion [56,57]. A recent study has revealed that the estimate for fibers in the aquatic environments was disproportionately higher than were the concentrations found in wastewater effluent [58]. Microfibers are found in a diverse variety of species across various ecosystems and trophic layers, including those targeted by fisheries, ac-cording to several field studies [59], which highlights the significance of exposure to MPs through the fishery and aquaculture industries.
Interestingly, using historical images from Google Erath, farms A, B, and C in the current study were found to be fish farms back in past years (Figure 9) where microfibers could possibly derive from ropes and fishing nets as commonly used accessories in aqua-culture practices. This may also confirm the long life of MPs products in the terrestrial
Figure 7. Different shape of MPs detected in this study including (a) fibers, (b) pellets, (c) films,(d) fragments, (e) foams, and (f) microbeads.
Agriculture 2021, 10, x FOR PEER REVIEW 11 of 16
Figure 7. Different shape of MPs detected in this study including (a) fibers, (b) pellets, (c) films, (d) fragments, (e) foams, and (f) microbeads.
Figure 8. Type distribution of MPs detected in the studied farmlands.
While the one-way ANOVA test indicated that there is a significant difference be-tween number of MPs in different farmlands (p-value = 0.042), first three farms (A, B, and C) showed similar range of microfiber items in soil samples where other types were in different proportions. If control and remediation efforts are to be successful, it is important to consider the origins and distribution of microfibers in the environment.
While primary causes are yet to be thoroughly studied, domestic laundry discharges were once thought to be the main source of fibrous MPs. Recent research, however, con-tradicts this assertion [56,57]. A recent study has revealed that the estimate for fibers in the aquatic environments was disproportionately higher than were the concentrations found in wastewater effluent [58]. Microfibers are found in a diverse variety of species across various ecosystems and trophic layers, including those targeted by fisheries, ac-cording to several field studies [59], which highlights the significance of exposure to MPs through the fishery and aquaculture industries.
Interestingly, using historical images from Google Erath, farms A, B, and C in the current study were found to be fish farms back in past years (Figure 9) where microfibers could possibly derive from ropes and fishing nets as commonly used accessories in aqua-culture practices. This may also confirm the long life of MPs products in the terrestrial
Figure 8. Type distribution of MPs detected in the studied farmlands.
While the one-way ANOVA test indicated that there is a significant difference betweennumber of MPs in different farmlands (p-value = 0.042), first three farms (A, B, and C)showed similar range of microfiber items in soil samples where other types were in different

Agriculture 2021, 11, 330 11 of 16
proportions. If control and remediation efforts are to be successful, it is important toconsider the origins and distribution of microfibers in the environment.
While primary causes are yet to be thoroughly studied, domestic laundry dischargeswere once thought to be the main source of fibrous MPs. Recent research, however, contra-dicts this assertion [56,57]. A recent study has revealed that the estimate for fibers in theaquatic environments was disproportionately higher than were the concentrations foundin wastewater effluent [58]. Microfibers are found in a diverse variety of species acrossvarious ecosystems and trophic layers, including those targeted by fisheries, according toseveral field studies [59], which highlights the significance of exposure to MPs through thefishery and aquaculture industries.
Interestingly, using historical images from Google Erath, farms A, B, and C in thecurrent study were found to be fish farms back in past years (Figure 9) where microfiberscould possibly derive from ropes and fishing nets as commonly used accessories in aqua-culture practices. This may also confirm the long life of MPs products in the terrestrialenvironment even after changing the land use category. Furthermore, commonly usedagricultural plastic products like shade nets and fertilizer bags can decompose into fibersover time in the environment.
Agriculture 2021, 10, x FOR PEER REVIEW 12 of 16
environment even after changing the land use category. Furthermore, commonly used agricultural plastic products like shade nets and fertilizer bags can decompose into fibers over time in the environment.
Figure 9. Historical land use image comparison of first three farms (A, B, and C) in this study (Google Earth Pro 7.3.3.7786 (2021)).
Among various forms of detected MPs in this study, foams followed by fragments and films were significantly (p-value < 0.001) higher in farms D, and E compared with the other ones. The statistical analysis showed that the number of fragments and foams in farm E were significantly higher than the average number of these items in all farms under the study with p-values of 0.032 and 0.017, respectively. Although not statistically signifi-cant at 95% confidence interval, but the number of fragments in farm D was also higher than other farms. This can be well attributed to the field observations where farm D was fully covered with plastic mulch and planted fruits in farm E were covered with protective foam and plastic wrap (Table 2, and Figures 4 and 6). Since these two farms were adjacent (Figure 1b), MPs could be easily carried off between the farms by natural wind and/or human activities.
MPs were observed in different colors, and no significant correlation has been found between MP color and type (p-value = 0.09). However, black and white were the dominant colors for the fragments and foams in farms D and E, respectively, possibly due to the black plastic much in farm D and white protective foam in farm E (Figures 4 and 6). Alt-hough no significant correlation was also found between soil color, texture, and MP dis-tribution (p-value > 0.05), this remains to be further studied by collecting more samples from different soil types in future as soil parameters such as texture and organic matter content could be potential driver for MP size distribution.
3.4. MP Identification The ATR-FTIR comparative spectra of MPs extracted from the various soil samples
were plotted as shown in Figure 10. Five plastic debris categories, including PE, LDPE, oxidized polyethylene (oxidized PE) polypropylene (PP), and PS were identified, with a mean match degree of 85.67% with the standard database. The match degrees of the three PE categories were relatively higher than PS, which is consistent with Fok et al. [60] re-porting that the match degrees of PS forms are lower than PP and PE. Weathering, aging, and adherence can all have an impact on the matching degree of MPs with the standard database. Statistical results indicate that LDPE followed by PS are the major polymer type of MPs in the studied farms, which is in consistent with the main type of MP found in the study, fragment and fibers.
Figure 9. Historical land use image comparison of first three farms (A, B, and C) in this study (GoogleEarth Pro 7.3.3.7786 (2021)).
Among various forms of detected MPs in this study, foams followed by fragmentsand films were significantly (p-value < 0.001) higher in farms D, and E compared withthe other ones. The statistical analysis showed that the number of fragments and foamsin farm E were significantly higher than the average number of these items in all farmsunder the study with p-values of 0.032 and 0.017, respectively. Although not statisticallysignificant at 95% confidence interval, but the number of fragments in farm D was alsohigher than other farms. This can be well attributed to the field observations where farmD was fully covered with plastic mulch and planted fruits in farm E were covered withprotective foam and plastic wrap (Table 2, and Figures 4 and 6). Since these two farms wereadjacent (Figure 1b), MPs could be easily carried off between the farms by natural windand/or human activities.
MPs were observed in different colors, and no significant correlation has been foundbetween MP color and type (p-value = 0.09). However, black and white were the dominantcolors for the fragments and foams in farms D and E, respectively, possibly due to the blackplastic much in farm D and white protective foam in farm E (Figures 4 and 6). Althoughno significant correlation was also found between soil color, texture, and MP distribution(p-value > 0.05), this remains to be further studied by collecting more samples from differentsoil types in future as soil parameters such as texture and organic matter content could bepotential driver for MP size distribution.

Agriculture 2021, 11, 330 12 of 16
3.4. MP Identification
The ATR-FTIR comparative spectra of MPs extracted from the various soil sampleswere plotted as shown in Figure 10. Five plastic debris categories, including PE, LDPE,oxidized polyethylene (oxidized PE) polypropylene (PP), and PS were identified, witha mean match degree of 85.67% with the standard database. The match degrees of thethree PE categories were relatively higher than PS, which is consistent with Fok et al. [60]reporting that the match degrees of PS forms are lower than PP and PE. Weathering, aging,and adherence can all have an impact on the matching degree of MPs with the standarddatabase. Statistical results indicate that LDPE followed by PS are the major polymer typeof MPs in the studied farms, which is in consistent with the main type of MP found in thestudy, fragment and fibers.
Agriculture 2021, 10, x FOR PEER REVIEW 13 of 16
Figure 10. The FTIR spectrum of selected MPs detected in soil samples and the match degrees with the standard spectrum.
The presence of hydroxyl and carbonyl absorption peaks in the samples, which are about 3450 and 1700 cm−1, means that the MPs surface produces functional groups includ-ing carboxyl, aldehyde, and hydroxyl [61]. MPs can thus serve as carriers for adsorbing pollutants, making it easier to pass contaminants and threatening ecosystems [62], more-over, degraded MPs also release more harmful additives into the environment [63].
3.5. Challenges and Limitation Scientists have been increasingly interested in researching MP pollution in terrestrial
environments in recent years. However, there are no reports that characterize the problem across different land use settings, and the true extent of the problem is yet to be deter-mined. While our results highlighted the role of agricultural activities in MP pollution, there are several potential methodological issues that need to be considered for future studies. Representative sampling is one of the most important steps during MP analysis in soil ecosystems. In MP monitoring and analysis, the sampling method must be very carefully designed in order to achieve reliable outcomes when working with such an in-homogeneous matrix as soil. It is highly recommended to consider the sampling location’s historical use, potential discharge from point sources (e.g., containers, picnic areas, etc.) or diffuse sources (e.g., local highways, lanes, and even traffic rates). Taking control sam-ples to verify the accuracy of the analysis is another obstacle because it is almost difficult to guarantee a site free of plastic contaminants, and there is no standard protocol for MP sampling in soil media. Removing all possible plastic particles from a collected sample through high-temperature ignition [28] or taking control samples from nearby soil with the lowest plastic contamination [38,39], have been suggested to make a plastic-free con-trol sample, but either of these methods have their own limitations and drawbacks and may not provide a fully representative control sample for MP analysis in a terrestrial en-vironment. Pre-treatment of samples, such as drying and sieving conditions, as well as organic matter removal, is another important step that the research team should carefully consider. While various oxidizing agents, such as H2O2 or Fenton’s reagent solution, have been developed for organic matter removal, acidity conditions or oxidizing strength can reduce the recovery of some plastic products and microfibers [28]. Visual inspection is dependent on the operator’s strategy, so MP identification is another challenging task. To prevent false positives, additional detection methods are recommended. However, com-bining visual and other advanced techniques, such as spectroscopic methods, can also
Figure 10. The FTIR spectrum of selected MPs detected in soil samples and the match degrees withthe standard spectrum.
The presence of hydroxyl and carbonyl absorption peaks in the samples, which areabout 3450 and 1700 cm−1, means that the MPs surface produces functional groups includ-ing carboxyl, aldehyde, and hydroxyl [61]. MPs can thus serve as carriers for adsorbingpollutants, making it easier to pass contaminants and threatening ecosystems [62], more-over, degraded MPs also release more harmful additives into the environment [63].
3.5. Challenges and Limitation
Scientists have been increasingly interested in researching MP pollution in terrestrialenvironments in recent years. However, there are no reports that characterize the problemacross different land use settings, and the true extent of the problem is yet to be determined.While our results highlighted the role of agricultural activities in MP pollution, thereare several potential methodological issues that need to be considered for future studies.Representative sampling is one of the most important steps during MP analysis in soilecosystems. In MP monitoring and analysis, the sampling method must be very carefullydesigned in order to achieve reliable outcomes when working with such an inhomogeneousmatrix as soil. It is highly recommended to consider the sampling location’s historicaluse, potential discharge from point sources (e.g., containers, picnic areas, etc.) or diffusesources (e.g., local highways, lanes, and even traffic rates). Taking control samples to verifythe accuracy of the analysis is another obstacle because it is almost difficult to guarantee

Agriculture 2021, 11, 330 13 of 16
a site free of plastic contaminants, and there is no standard protocol for MP sampling insoil media. Removing all possible plastic particles from a collected sample through high-temperature ignition [28] or taking control samples from nearby soil with the lowest plasticcontamination [38,39], have been suggested to make a plastic-free control sample, but eitherof these methods have their own limitations and drawbacks and may not provide a fullyrepresentative control sample for MP analysis in a terrestrial environment. Pre-treatmentof samples, such as drying and sieving conditions, as well as organic matter removal, isanother important step that the research team should carefully consider. While variousoxidizing agents, such as H2O2 or Fenton’s reagent solution, have been developed fororganic matter removal, acidity conditions or oxidizing strength can reduce the recoveryof some plastic products and microfibers [28]. Visual inspection is dependent on theoperator’s strategy, so MP identification is another challenging task. To prevent falsepositives, additional detection methods are recommended. However, combining visual andother advanced techniques, such as spectroscopic methods, can also significantly increasesthe cost and complexity of the research, and it may not be possible with all samples in thestudy [28].
In the present study, it was found that for interpreting MP sources, it is necessaryto conduct an integrated site assessment and collect historical data on land use with itsdifferent practices on the study area as MPs may remain in the soil decades after theemission from the source.
4. Conclusions
The aim of this study was to reveal MPs contamination in farmland soil. Due to theuse of different sampling, extraction, and analytical approaches, research on MPs in soils isstill scarce, and the existing publications are also incomparable. The studied farmlands inTainan City, Taiwan were extensively contaminated by MPs. The concentration of MPs inroadside farms was higher than in enclosed farms away from suburban roads, suggestinga possible risk of agricultural activities on the side of the road. For the MPs described,micro-fragment and -fibers were the most common types, with LDPE being the dominatedpolymer type. Generally, mulching practice, historical fish farming activity, protectivefoams, and roadside farming were found to be the main sources of MPs present in thecurrent study. Despite the fact that MPs in the environment may have harmful effectson soil and organisms, the prevalence of MPs in soil and the terrestrial environment isexpected to continue to grow in the immediate future, as their occurrence in soil ecosystemsis largely unknown. Improving the biodegradability of polymers used in the production ofplastic mulch and synthetic textiles may aid in the reduction of MPs in the environment.Since simple precautionary measures in agricultural practices, such as farm fencing orremoving left-over plastic residues after harvesting can potentially reduce MPs pollutionin farmland, raising awareness among farmers might help to slow down the MP wastegeneration and encourage the utility of more natural fibers and environmentally friendlyproducts in agriculture practices.
Author Contributions: Conceptualization, H.F.; data curation, H.F. and M.I.; formal analysis, H.F.;investigation, N.T.Y., A.M.M., N.N.L., F.B.M., P.C.J., N.S.J., B.H.M., and J.T.M.; methodology, N.T.Y.,A.M.M., N.N.L., F.B.M., P.C.J., N.S.J., B.H.M., and J.T.M.; software, N.T.Y.; supervision, S.-L.L.;validation, S.-L.L.; writing—review and editing, M.I. All authors have read and agreed to thepublished version of the manuscript.
Funding: This research was funded by the Ministry of Science and Technology of Taiwan (MOST),with grant number MOST 108-2621-M-309 -001 -MY2. This work was also partially supported by theby National Taiwan University (NTUCCP-109L901003, NTU-109L8836), and NTU Research Centerfor Future Earth from The Featured Areas Research Center Program within the framework of theHigher Education Sprout Project by the Ministry of Education (MOE) in Taiwan, and the Ministry ofScience and Technology of Taiwan (MOST108-2621-M-002-MY2).

Agriculture 2021, 11, 330 14 of 16
Data Availability Statement: The data that support the findings of this study are available from thecorresponding author upon reasonable request.
Acknowledgments: The authors gratefully acknowledge the Social Responsibility (USR) office ofthe Chang Jung Christian University and Eco Center for administrative and technical support.
Conflicts of Interest: The authors declare no conflict of interest.
References1. Geyer, R.; Jambeck, J.R.; Law, K.L. Production, use, and fate of all plastics ever made. Sci. Adv. 2017, 3, e1700782. [CrossRef]2. Wright, S.L.; Kelly, F.J. Plastic and human health: A micro issue? Environ. Sci. Technol. 2017, 51, 6634–6647. [CrossRef] [PubMed]3. Gewert, B.; Plassmann, M.M.; MacLeod, M. Pathways for degradation of plastic polymers floating in the marine environment.
Environ. Sci: Process Impacts 2015, 17, 1513–1521. [CrossRef] [PubMed]4. Kunz, A.; Walther, B.A.; Löwemark, L.; Lee, Y.C. Distribution and quantity of microplastic on sandy beaches along the northern
coast of Taiwan. Mar. Pollut. Bull. 2016, 111, 126–135. [CrossRef] [PubMed]5. Frias, J.P.G.L.; Nash, R. Microplastics: Finding a consensus on the definition. Mar. Pollut. Bull. 2019, 138, 145–147. [CrossRef]6. Liu, M.; Lu, S.; Song, Y.; Lei, L.; Hu, J.; Lv, W.; Zhou, W.; Cao, C.; Shi, H.; Yang, X.; et al. Microplastic and mesoplastic pollution in
farmland soils in suburbs of Shanghai, China. Environ. Pollut. 2018, 242, 855–862. [CrossRef]7. Horton, A.A.; Walton, A.; Spurgeon, D.J.; Lahive, E.; Svendsen, C. Microplastics in freshwater and terrestrial environments:
Evaluating the current understanding to identify the knowledge gaps and future research priorities. Sci. Total Environ. 2017, 586,127–141. [CrossRef] [PubMed]
8. Kawecki, D.; Nowack, B. Polymer-Specific Modeling of the Environmental Emissions of Seven Commodity Plastics as Macro-
and Microplastics. Environ. Sci. Technol. 2019, 53, 9664–9676. [CrossRef]9. Arthur, C.; Baker, J.; Bamford, H. International Research Workshop on the Occurrence, Effects, and Fate of MP Marine Debris; Technical
Memorandum NOS-OR&R-30; NOAA: Tacoma, WA, USA, 2009; p. 530.10. Li, L.; Luo, Y.; Peijnenburg, W.J.G.M.; Li, R.; Yang, J.; Zhou, Q. Confocal measurement of microplastics uptake by plants. MethodsX
2020, 7, 100750. [CrossRef]11. Cole, M.; Lindeque, P.; Halsband, C.; Galloway, T.S. Microplastics as contaminants in the marine environment: A review. Mar.
Pollut. Bull. 2011, 62, 2588–2597. [CrossRef]12. Shonbeck, M.W.; Evanylo, G.K. Effects of Mulches on Soil Properties and Tomato Production I. Soil Temperature, Soil Moisture
and Marketable Yield. J. Sustain. Agric. 1998, 13, 55–81. [CrossRef]13. Kasirajan, S.; Ngouajio, M. Polyethylene and biodegradable mulches for agricultural applications: A review. Agron. Sustain. Dev.
2012, 32, 501–529. [CrossRef]14. Waggoner, P.E.; Miller, P.M.; De Roo, H. Plastic mulching: Principles and benefits. Conn. Agric. Expt. Station. Bull. 1960, 634, 44.15. Shah, F.; Wu, W. Chapter Five—Use of plastic mulch in agriculture and strategies to mitigate the associated environmental
concerns. Adv. Agron. 2020, 164, 231–287.16. Lambert, S.; Wagner, M. Environmental performance of bio-based and biodegradable plastics: The road ahead. Chem. Soc. Rev.
2017, 46, 6855–6871. [CrossRef]17. United Nations Environmental Program (UNEP). Marine Plastic Debris and Microplastics: Global Lessons and Research to Inspire
Action and Guide Policy Change; UNEP: Nairobi, Kenya, 2016; pp. 1–274.18. Wang, J.; Liu, X.; Li, Y.; Powell, T.; Wang, X.; Wang, G.; Zhang, P. Microplastics as contaminants in the soil environment: A
mini-review. Sci. Total Environ. 2019, 691, 848–857. [CrossRef]19. Wiesner, Y.K.; Müller, A.; Bannick, C.G.; Bednarz, M.; Braun, U. Pathways of microplastics in soils—Detection of microplastic
contents in compost using a thermal decomposition method. In Proceedings of the 22nd EGU General Assembly, Vienna, Austria,4–8 May 2020; EGU2020-22456. [CrossRef]
20. Simon, N.; Schulte, M.L. Stopping Global Plastic Pollution: The Case for an International Convention; Heinrich-Böll-Foundation: Berlin,Germany, 2017; Volume 43, pp. 1–56.
21. Giuffrè, A.M.; Louadj, L.; Rizzo, P.; De Salvo, E.; Sicari, V. The Influence of Film and Storage on the Phenolic and AntioxidantProperties of Red Raspberries (Rubus idaeus L.) cv. Erika. Antioxidants 2019, 8, 254. [CrossRef] [PubMed]
22. Mills, N.J. (Report 167) Polyolefin Foams; Rapra Review Reports; iSmithers Rapra Publishing: Shropshire, UK, 2003; Volume 14,ISSN 0889-3144.
23. Khan, R.K.; Strand, M.A. Road dust and its effect on human health: A literature review. Epidemiol. Health 2018, 40, e2018013.[CrossRef] [PubMed]
24. Abbasi, S.; Keshavarzi, B.; Moore, F.; Delshab, H.; Soltani, N.; Sorooshian, A. Investigation of microrubbers, microplastics andheavy metals in street dust: A study in Bushehr city, Iran. Environ. Earth. Sci. 2017, 76, 798. [CrossRef]
25. Sommer, F.; Dietze, V.; Baum, A.; Sauer, J.; Gilge, S.; Maschowski, C.; Gieré, R. Tire Abrasion as a Major Source of Microplastics inthe Environment. Aerosol Air Qual Res. 2018, 18, 2014–2028. [CrossRef]
26. Knight, L.J.; Parker-Jurd, F.N.F.; Al-Sid-Cheikh, M.; Thompson, R.C. Tyre wear particles: An abundant yet widely unreportedmicroplastic? Environ. Sci. Pollut. Res. 2020, 27, 18345–18354. [CrossRef]

Agriculture 2021, 11, 330 15 of 16
27. Hurley, R.R.; Nizzetto, L. Fate and occurrence of micro(nano)plastics in soils: Knowledge gaps and possible risks. Curr. Opin.Environ. Sci. Health 2018, 1, 6–11. [CrossRef]
28. Corradini, F.; Meza, P.; Eguiluz, R.; Casado, F.; Huerta-Lwanga, E.; Geissen, V. Evidence of microplastic accumulation inagricultural soils from sewage sludge disposal. Sci. Total Environ. 2019, 671, 411–420. [CrossRef]
29. Beriot, N.; Peek, J.; Zornoza, R.; Geissen, V.; Huerta Lwanga, E. Low density-microplastics detected in sheep faeces and soil: Acase study from the intensive vegetable farming in Southeast Spain. Sci. Total Environ. 2021, 755, 142653. [CrossRef] [PubMed]
30. Yang, J.; Li, R.; Zhou, Q.; Li, L.; Li, Y.; Tu, C.; Zhao, X.; Xiong, K.; Christie, P.; Luo, Y. Abundance and morphology of microplasticsin an agricultural soil following long-term repeated application of pig manure. Environ Pollut. 2021, 272, 116028. [CrossRef][PubMed]
31. Li, W.; Wufuer, R.; Duo, J.; Wang, S.; Luo, Y.; Zhang, D.; Pan, X. Microplastics in agricultural soils: Extraction and characterizationafter different periods of polythene film mulching in an arid region. Sci. Total Environ. 2020, 749, 141420. [CrossRef]
32. Chen, Y.; Leng, Y.; Liu, X.; Wang, J. Microplastic pollution in vegetable farmlands of suburb Wuhan, central China. Environ. Pollut.2020, 257, 113449. [CrossRef]
33. Harms, I.K.; Diekötter, T.; Troegel, S.; Lenz, M. Amount, distribution and composition of large microplastics in typical agriculturalsoils in Northern Germany. Sci. Total Environ. 2021, 758, 143615. [CrossRef]
34. Taiwan Environmental Protection Administration. Electronic Environmental Policy Monthly; Taiwan Environmental ProtectionAdministration: Taipei City, Taiwan, 2018; Volume XXIII, p. 12. ISSN 1811–4008.
35. Ritchey, E.L.; McGrath, J.M.; Gehring, D. Determining Soil Texture by Feel. Agric. Nat. Resour. Publ. 2015, 4, 139.36. Thien, S.J. A flow diagram for teaching texture by feel analysis. J. Agron. Educ. 1979, 8, 54–55. [CrossRef]37. Wang, Z.; Taylor, S.E.; Sharma, P.; Flury, M. Poor extraction efficiencies of polystyrene nano- and microplastics from biosolids and
soil. PLoS ONE 2018, 13, e0208009. [CrossRef]38. Schoeneberger, P.; Wysocki, D.; Benham, E.; Staff, S.S. Field Book for Describing and Sampling Soils; Version 3.0; Natural Resources
Conservation Service; National Soil Survey Center: Lincoln, NE, USA, 2012.39. EPA, U. LSASD Operating Procedure for Soil Sampling; Technical Report LSASDPROC-300-R4; Laboratory Services and Applied
Science Division: Athens, GA, USA, 2020.40. Bergmann, M.; Mützel, S.; Primpke, S.; Tekman, M.; Trachsel, J.; Gerdts, G. White and wonderful? Microplastics prevail in snow
from the Alps to the Arctic. Sci. Adv. 2019, 5, eaax1157. [CrossRef] [PubMed]41. Anuar Sharuddin, S.D.; Abnisa, F.; Wan Daud, W.M.A.; Aroua, M.K. Energy recovery from pyrolysis of plastic waste: Study on
non-recycled plastics (NRP) data as the real measure of plastic waste. Energy Convers. Manag. 2017, 148, 925–934. [CrossRef]42. Wagner, S.; Hüffer, T.; Klöckner, P.; Wehrhahn, M.; Hofmann, T.; Reemtsma, T. Tire wear particles in the aquatic environment—A
review on generation, analysis, occurrence, fate and effects. Water Res. 2018, 139, 83–100. [CrossRef] [PubMed]43. Li, B.; Pales, A.R.; Clifford, H.M.; Kupis, S.; Hennessy, S.; Liang, W.; Moysey, S.; Powell, B.; Finneran, K.T.; Darnault, C.J.G.
Preferential flow in the vadose zone and interface dynamics: Impact of microbial exudates. J. Hydrol. 2018, 558, 72–89. [CrossRef]44. Zhou, Y.; Wang, J.; Zou, M.; Jia, Z.; Zhou, S.; Li, Y. Microplastics in soils: A review of methods, occurrence, fate, transport,
ecological and environmental risks. Sci. Total Environ. 2020, 748, 141368. [CrossRef]45. Huang, Y.; Liu, Q.; Jia, W.; Yan, C.; Wang, J. Agricultural plastic mulching as a source of microplastics in the terrestrial environment.
Environ. Pollut. 2020, 260, 114096. [CrossRef]46. Maaß, S.; Daphi, D.; Lehmann, A.; Rillig, M.C. Transport of microplastics by two collembolan species. Environ. Pollut. 2017, 225,
456–459. [CrossRef]47. Ryan, P.G.; Moore, C.J.; van Franeker, J.A.; Moloney, C.L. Monitoring the abundance of plastic debris in the marine environment.
Series B Biol. Sci. 2009, 364, 1999–2012. [CrossRef]48. Xu, S.; Ma, J.; Ji, R.; Pan, K.; Miao, A. Microplastics in aquatic environments: Occurrence, accumulation, and biological effects. Sci.
Total Environ. 2020, 703, 134699. [CrossRef]49. Peng, J.; Wang, J.; Cai, L. Current understanding of microplastics in the environment: Occurrence, fate, risks, and what we should
do. Integr. Environ. Assess Manag. 2017, 13, 476–482. [CrossRef] [PubMed]50. Nizzetto, L.; Bussi, G.; Futter, M.N.; Butterfield, D.; Whitehead, P.G. A theoretical assessment of microplastic transport in river
catchments and their retention by soils and river sediments. Environ. Sci.: Process Impacts 2016, 18, 1050–1059. [CrossRef][PubMed]
51. Da Costa, J.P.; Santos, P.S.; Duarte, A.C.; Rocha-Santos, T. (Nano) plastics in the environment-sources, fate and effects. Sci. TotalEnviron. 2016, 566–567, 15–26. [CrossRef]
52. Chae, Y.; An, Y.J. Current research trends on plastic pollution and ecological impacts on the soil ecosystem: A review. Environ.Pollut. 2018, 240, 387–395. [CrossRef] [PubMed]
53. Rillig, M.C.; Ziersch, L.; Hemplel, S. Microplastic transport in soil by earthworms. Sci. Rep. 2017, 7, 1362–1367. [CrossRef]54. Rodriguez-Seijo, A.; Lourenço, J.; Rocha-Santos, T.A.P.; da Costa, J.; Duarte, A.C.; Vala, H.; Pereira, R. Histopathological and
molecular effects of microplastics in Eisenia andrei Bouche. Environ. Pollut. 2017, 220, 495–503. [CrossRef] [PubMed]55. Hodson, M.E.; Duffus-Hodson, C.A.; Clark, A.; Prendergast-Miller, M.T.; Thorpe, K.L. Plastic bag derived-microplastics as a
vector for metal exposure in terrestrial invertebrates. Environ. Sci. Technol. 2017, 51, 4714–4721. [CrossRef]56. Bagchia, S.; Probasco, S.; MardanDoost, B.; Sturma, B.S.M. Fate of Microplastics in Water Resource Recovery Facilities (WRRFs)
and National Environmental Loading Estimates. Proc. Water Environ. Fed. 2016, 2016, 353–361. [CrossRef]
Agriculture 2021, 11, 330 16 of 16
57. Mintenig, S.M.; Int-Veena, I.; Löder, M.G.J.; Primpke, S.; Gerdts, G. Identification of microplastic in effluents of waste watertreatment plants using focal plane array-based micro-Fourier-transform infrared imaging. Water Res. 2017, 108, 365–372.[CrossRef]
58. Baldwin, A.K.; Corsi, S.R.; Mason, S.A. Plastic Debris in 29 Great Lakes Tributaries: Relations to Watershed Attributes andHydrology. Environ. Sci. Technol. 2016, 50, 10377–10385. [CrossRef]
59. de Sá, L.C.; Oliveira, M.; Ribeiro, F.; Rocha, T.L.; Futter, N. Studies of the effects of microplastics on aquatic organisms: What dowe know and where should we focus our efforts in the future? Sci. Total Environ. 2018, 645, 1029–1039. [CrossRef] [PubMed]
60. Fok, L.; Cheung, P.K.; Tang, G.; Li, W.C. Size distribution of stranded small plastic debris on the coast of Guangdong, South China.Environ. Pollut. 2017, 220, 407–412. [CrossRef] [PubMed]
61. Fairbrother, A.; Hsueh, H.; Kim, J.H.; Jacobs, D.; Perry, L.; Goodwin, D.; White, C.; Watson, S.; Sung, L. Temperature and lightintensity effects on photodegradation of high-density polyethylene. Polym. Degrad. Stabil. 2019, 165, 153–160. [CrossRef]
62. Xu, B.L.; Liu, F.; Cryder, Z.; Huang, D.; Lu, Z.J.; He, Y.; Wang, H.Z.; Lu, Z.M.; Brookes, P.C.; Tang, C.X.; et al. Microplastics in thesoil environment: Occurrence, risks, interactions and fate—A review. Crit. Rev. Environ. Sci. Technol. 2019, 2175–2222. [CrossRef]
63. Bandow, N.; Will, V.; Wachtendorf, V.; Simon, F. Contaminant release from aged microplastic. Environ. Chem. 2017, 14, 394–405.[CrossRef]