Quantification of Compartmented Metabolic Fluxes in ... · ... (G.S., V.V.I., J.V.S.),...
16
Quantification of Compartmented Metabolic Fluxes in Developing Soybean Embryos by Employing Biosynthetically Directed Fractional 13 C Labeling, Two-Dimensional [ 13 C, 1 H] Nuclear Magnetic Resonance, and Comprehensive Isotopomer Balancing 1[w] Ganesh Sriram, D. Bruce Fulton, Vidya V. Iyer, Joan Marie Peterson, Ruilian Zhou, Mark E. Westgate, Martin H. Spalding, and Jacqueline V. Shanks* Departments of Chemical Engineering (G.S., V.V.I., J.V.S.), Biochemistry, Biophysics and Molecular Biology (D.B.F.), Agronomy (J.M.P., R.Z., M.E.W.), and Genetics, Development and Cell Biology (M.H.S.), Iowa State University, Ames, Iowa 50011 Metabolic flux quantification in plants is instrumental in the detailed understanding of metabolism but is difficult to perform on a systemic level. Toward this aim, we report the development and application of a computer-aided metabolic flux analysis tool that enables the concurrent evaluation of fluxes in several primary metabolic pathways. Labeling experiments were performed by feeding a mixture of U- 13 C Suc, naturally abundant Suc, and Gln to developing soybean (Glycine max) embryos. Two-dimensional [ 13 C, 1 H] NMR spectra of seed storage protein and starch hydrolysates were acquired and yielded a labeling data set consisting of 155 13 C isotopomer abundances. We developed a computer program to automatically calculate fluxes from this data. This program accepts a user-defined metabolic network model and incorporates recent mathematical advances toward accurate and efficient flux evaluation. Fluxes were calculated and statistical analysis was performed to obtain SDs. A high flux was found through the oxidative pentose phosphate pathway (19.99 6 4.39 mmol d 21 cotyledon 21 , or 104.2 carbon mol 6 23.0 carbon mol per 100 carbon mol of Suc uptake). Separate transketolase and transaldolase fluxes could be distinguished in the plastid and the cytosol, and those in the plastid were found to be at least 6-fold higher. The backflux from triose to hexose phosphate was also found to be substantial in the plastid (21.72 6 5.00 mmol d 21 cotyledon 21 , or 113.2 carbon mol 626.0 carbon mol per 100 carbon mol of Suc uptake). Forward and backward directions of anaplerotic fluxes could be distinguished. The glyoxylate shunt flux was found to be negligible. Such a generic flux analysis tool can serve as a quantitative tool for metabolic studies and phenotype comparisons and can be extended to other plant systems. The evaluation of metabolic flux is instrumental in understanding carbon partitioning in plant metabo- lism. Since fluxes provide a quantitative depiction of carbon flow through competing metabolic pathways (Ratcliffe and Shachar-Hill, 2001), they are an impor- tant physiological characteristic akin to levels of transcripts, proteins, and metabolites (Sauer, 2004). Flux measurements and comparisons of fluxes be- tween phenotypes can provide insights toward se- lection of appropriate metabolic engineering targets (Stephanopoulos, 1999, 2002; Glawischnig et al., 2002) and toward the construction of predictive models of plant metabolism (Ratcliffe and Shachar-Hill, 2001), the necessity for which has been emphasized recently (Girke et al., 2003; Katagiri, 2003; Raikhel and Coruzzi, 2003). Although the importance of flux measurement in plants has often been stressed (Roscher et al., 2000; Ratcliffe and Shachar-Hill, 2001; Shachar-Hill, 2002; Sweetlove et al., 2003), it has received rather limited attention in plant science as compared to profiling technologies for transcript, protein, and metabolite levels (Kruger and von Schaewen, 2003; Sweetlove et al., 2003). This is principally due to the fact that fluxes have to be quantified by back-calculating them from their effect on the distribution of a labeled sub- strate, and such calculation requires a detailed math- ematical model if it is to be accurate. Mathematical models relating labeling data to fluxes are often non- trivial, particularly in the case of compartmented metabolism inherent in plants. Consequently, flux measurement technology in plants remains underde- veloped (Ratcliffe and Shachar-Hill, 2001; Sweetlove et al., 2003). 1 This work was supported by the Division of Bioengineering and Environmental Systems (BES) of the National Science Foundation (grant no. BES–0224600), by the Plant Sciences Institute of Iowa State University, and by the Iowa Soybean Promotion Board. * Corresponding author; e-mail [email protected]; fax 515–294– 2689. [w] The online version of this article contains Web-only data. Article, publication date, and citation information can be found at www.plantphysiol.org/cgi/doi/10.1104/pp.104.050625. Plant Physiology, October 2004, Vol. 136, pp. 3043–3057, www.plantphysiol.org Ó 2004 American Society of Plant Biologists 3043 www.plantphysiol.org on July 4, 2018 - Published by Downloaded from Copyright © 2004 American Society of Plant Biologists. All rights reserved. www.plantphysiol.org on July 4, 2018 - Published by Downloaded from Copyright © 2004 American Society of Plant Biologists. All rights reserved. www.plantphysiol.org on July 4, 2018 - Published by Downloaded from Copyright © 2004 American Society of Plant Biologists. All rights reserved.
Transcript of Quantification of Compartmented Metabolic Fluxes in ... · ... (G.S., V.V.I., J.V.S.),...

Quantification of Compartmented Metabolic Fluxesin Developing Soybean Embryos by EmployingBiosynthetically Directed Fractional 13C Labeling,Two-Dimensional [13C, 1H] Nuclear MagneticResonance, and ComprehensiveIsotopomer Balancing1[w]
Ganesh Sriram, D. Bruce Fulton, Vidya V. Iyer, Joan Marie Peterson, Ruilian Zhou, Mark E. Westgate,Martin H. Spalding, and Jacqueline V. Shanks*
Departments of Chemical Engineering (G.S., V.V.I., J.V.S.), Biochemistry, Biophysics and Molecular Biology(D.B.F.), Agronomy (J.M.P., R.Z., M.E.W.), and Genetics, Development and Cell Biology (M.H.S.),Iowa State University, Ames, Iowa 50011
Metabolic flux quantification in plants is instrumental in the detailed understanding of metabolism but is difficult to performon a systemic level. Toward this aim, we report the development and application of a computer-aided metabolic flux analysistool that enables the concurrent evaluation of fluxes in several primary metabolic pathways. Labeling experiments wereperformed by feeding a mixture of U-13C Suc, naturally abundant Suc, and Gln to developing soybean (Glycine max) embryos.Two-dimensional [13C, 1H] NMR spectra of seed storage protein and starch hydrolysates were acquired and yielded a labelingdata set consisting of 155 13C isotopomer abundances. We developed a computer program to automatically calculate fluxesfrom this data. This program accepts a user-defined metabolic network model and incorporates recent mathematical advancestoward accurate and efficient flux evaluation. Fluxes were calculated and statistical analysis was performed to obtain SDs. Ahigh flux was found through the oxidative pentose phosphate pathway (19.99 6 4.39 mmol d21 cotyledon21, or 104.2 carbonmol 6 23.0 carbon mol per 100 carbon mol of Suc uptake). Separate transketolase and transaldolase fluxes could bedistinguished in the plastid and the cytosol, and those in the plastid were found to be at least 6-fold higher. The backflux fromtriose to hexose phosphate was also found to be substantial in the plastid (21.72 6 5.00 mmol d21 cotyledon21, or 113.2 carbonmol 626.0 carbon mol per 100 carbon mol of Suc uptake). Forward and backward directions of anaplerotic fluxes could bedistinguished. The glyoxylate shunt flux was found to be negligible. Such a generic flux analysis tool can serve as a quantitativetool for metabolic studies and phenotype comparisons and can be extended to other plant systems.
The evaluation of metabolic flux is instrumental inunderstanding carbon partitioning in plant metabo-lism. Since fluxes provide a quantitative depiction ofcarbon flow through competing metabolic pathways(Ratcliffe and Shachar-Hill, 2001), they are an impor-tant physiological characteristic akin to levels oftranscripts, proteins, and metabolites (Sauer, 2004).Flux measurements and comparisons of fluxes be-tween phenotypes can provide insights toward se-lection of appropriate metabolic engineering targets(Stephanopoulos, 1999, 2002; Glawischnig et al., 2002)and toward the construction of predictive models of
plant metabolism (Ratcliffe and Shachar-Hill, 2001),the necessity for which has been emphasized recently(Girke et al., 2003; Katagiri, 2003; Raikhel andCoruzzi, 2003).
Although the importance of flux measurement inplants has often been stressed (Roscher et al., 2000;Ratcliffe and Shachar-Hill, 2001; Shachar-Hill, 2002;Sweetlove et al., 2003), it has received rather limitedattention in plant science as compared to profilingtechnologies for transcript, protein, and metabolitelevels (Kruger and von Schaewen, 2003; Sweetloveet al., 2003). This is principally due to the fact thatfluxes have to be quantified by back-calculating themfrom their effect on the distribution of a labeled sub-strate, and such calculation requires a detailed math-ematical model if it is to be accurate. Mathematicalmodels relating labeling data to fluxes are often non-trivial, particularly in the case of compartmentedmetabolism inherent in plants. Consequently, fluxmeasurement technology in plants remains underde-veloped (Ratcliffe and Shachar-Hill, 2001; Sweetloveet al., 2003).
1 This work was supported by the Division of Bioengineering andEnvironmental Systems (BES) of the National Science Foundation(grant no. BES–0224600), by the Plant Sciences Institute of Iowa StateUniversity, and by the Iowa Soybean Promotion Board.
* Corresponding author; e-mail [email protected]; fax 515–294–2689.
[w]The online version of this article contains Web-only data.Article, publication date, and citation information can be found at
www.plantphysiol.org/cgi/doi/10.1104/pp.104.050625.
Plant Physiology, October 2004, Vol. 136, pp. 3043–3057, www.plantphysiol.org � 2004 American Society of Plant Biologists 3043 www.plantphysiol.orgon July 4, 2018 - Published by Downloaded from
Copyright © 2004 American Society of Plant Biologists. All rights reserved. www.plantphysiol.orgon July 4, 2018 - Published by Downloaded from
Copyright © 2004 American Society of Plant Biologists. All rights reserved. www.plantphysiol.orgon July 4, 2018 - Published by Downloaded from
Copyright © 2004 American Society of Plant Biologists. All rights reserved.
Not surprisingly, most papers that have reportedlabeling studies in plants have focused on the quali-tative goal of inferring which pathways are in opera-tion (identification of metabolic network topology) butnot on the mathematically involved endeavor ofevaluating how much carbon is processed by thosepathways (quantification of flux). For example,Wheeler et al. (1998) delineated the pathway of ascor-bic acid synthesis in higher plants from 14C labelingdata, and Krook et al. (1998) showed that two separateoxidative pentose phosphate pathways (oxPPP) oper-ate in the cytosol and the plastid, using 13C enrichmentdata from Daucus carota cell suspensions. More re-cently, a suite of articles by Eisenreich and co-workers(Bacher et al., 1999; Glawischnig et al., 2000, 2001,2002) reported the abundances of isotopomers ofseveral isolated sink metabolites in maize (Zea mays)kernels. Although these articles demonstrated ad-vances in label measurement technology, theinferences from them were either qualitative or semi-quantitative.
Two recent pioneering research efforts have concen-trated on quantification of fluxes in plants. In the first,Raymond and co-workers calculated fluxes throughglycolysis, oxPPP, tricarboxylic acid (TCA) cycle, andanaplerotic reactions using 13C atom enrichment dataof metabolites isolated from tomato (Lycopersicon escu-lentum) suspension cells (Rontein et al., 2002) andmaize root tips (Dieuaide-Noubhani et al., 1995).However, 13C isotopomer abundance data providericher metabolic information than 13C atom enrich-ments. Isotopomers are isomers of a metabolite thatdiffer in the labeling state (13C or 12C) of their in-dividual carbon atoms (Fig. 1). Isotopomer measure-
ments provide information on carbon-carbonconnectivities in metabolites, in systems supplied witha mixture of U-13C-labeled and U-12C-labeled sub-strates (Szyperski, 1995, 1998). Therefore, isotopomerabundance data facilitate statistically superior estima-tion of metabolic fluxes and reaction reversibilitiesthan atom enrichment data (Wiechert et al., 1999). Thesecond important development in flux quantificationin plants was by Ohlrogge and co-workers, who usedmass isotopomer data of metabolites separated fromdeveloping Brassica napus embryos to calculate fluxes(Schwender et al., 2003), although only the glycolysisand oxPPP were considered.
Despite these advances, flux measurement in plantsis in its early stages. Systemic evaluation of fluxes fromoverdetermined isotopomer data sets as well as de-tailed statistical analysis of the evaluated fluxes havenot yet been implemented in plant metabolism to theextent of their application to prokaryotic metabolism.Second, the quantification of fluxes of parallel path-ways in two compartments (e.g. cytosolic and plastidicoxPPP, mitochondrial and plastidic malic enzymes)has not been reported to date. Also, while the afore-mentioned studies have isolated metabolites beforecollecting labeling data, this effort-intensive step is notnecessary since two-dimensional (2-D) NMR can beused to resolve a mixture of several metabolites.
In this article, we report labeling studies and fluxquantification in developing embryos of soybean (Gly-cine max), metabolizing Suc and Gln in liquid culture.Soybeans are important sources of protein, oil, andnutraceuticals, and developing embryos are importantin vitro model systems to study them (Saravitz andRaper, 1995). There exists motivation to physiologi-cally characterize this system to understand carbonpartitioning between pathways and identify potentialmetabolic engineering targets. We acquired an over-determined isotopomer abundance data set in a high-throughput fashion, using 2-D NMR. To convert theisotopomer abundances in this data set to fluxes,a computer tool was developed, which incorporatedrecent mathematical and statistical advances (Wiechertet al., 1999; Sriram and Shanks, 2001, 2004; Wiechertand Wurzel, 2001) in metabolic flux analysis theory.This tool is not specific to our metabolic networkmodel and accepts user-defined metabolic models.Our results show that in the developing embryos,large amounts of carbon are shunted through theoxPPP and through the gluconeogenic pathway fromtriose phosphate to Fru phosphate in the plastid. Theactivities of the anaplerotic pathways, glyoxylateshunt, and g-aminobutyric acid (GABA) shunt werealso quantified. Moreover, we were able to distinguishbetween parallel pathways in separate compartments.
RESULTS
We performed labeling experiments by culturingdeveloping soybean embryos in liquid medium with
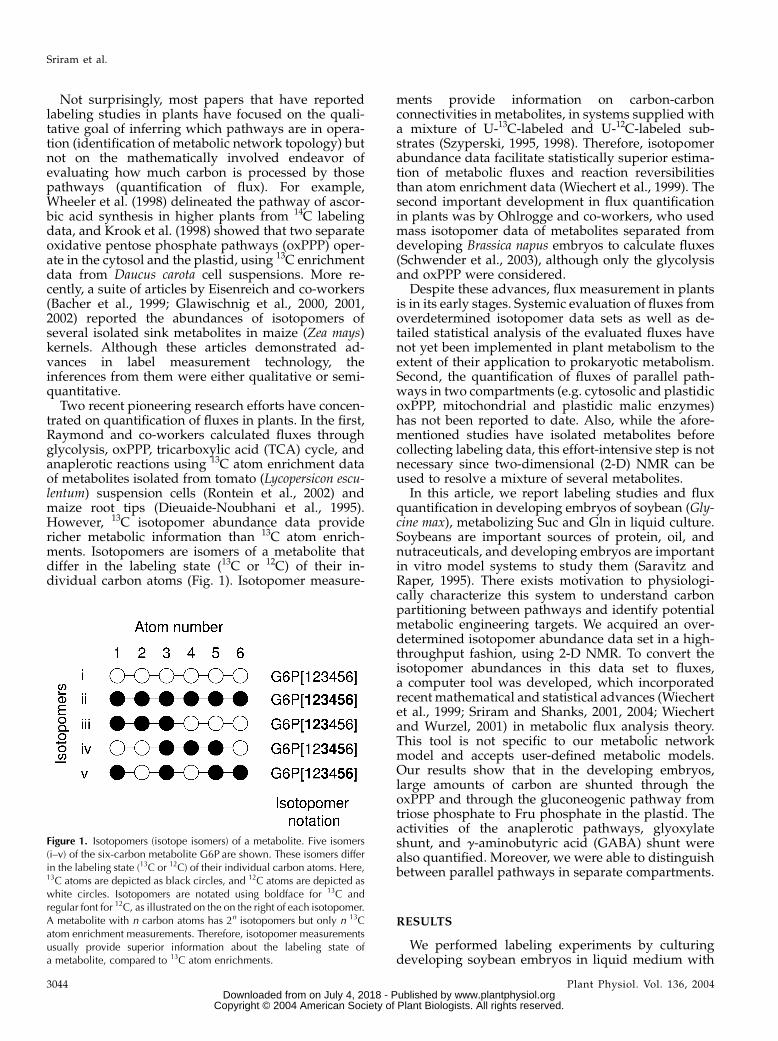
Figure 1. Isotopomers (isotope isomers) of a metabolite. Five isomers(i–v) of the six-carbon metabolite G6P are shown. These isomers differin the labeling state (13C or 12C) of their individual carbon atoms. Here,13C atoms are depicted as black circles, and 12C atoms are depicted aswhite circles. Isotopomers are notated using boldface for 13C andregular font for 12C, as illustrated on the on the right of each isotopomer.A metabolite with n carbon atoms has 2n isotopomers but only n 13Catom enrichment measurements. Therefore, isotopomer measurementsusually provide superior information about the labeling state ofa metabolite, compared to 13C atom enrichments.
3044 Plant Physiol. Vol. 136, 2004
Sriram et al.
www.plantphysiol.orgon July 4, 2018 - Published by Downloaded from Copyright © 2004 American Society of Plant Biologists. All rights reserved.

Suc (10% [w/w] U-13C, 90% [w/w] naturally abun-dant) and Gln (naturally abundant) as the only carbonsources. This labeling technique is termed biosynthet-ically directed fractional 13C labeling (Szyperski, 1995).After 6 d of culture, a protein fraction and a starchfraction were extracted from the embryos and hydro-lyzed. Then 2-D NMR experiments were performed onthe respective hydrolysates, and heteronuclear [13C,1H]-type NMR spectra were acquired. These spectrawere used to quantify isotopomeric compositions ofsink metabolites.
2-D NMR [13C, 1H] Spectra of Sink Metabolites and
Cross-Peak Assignments
A [13C, 1H] heteronuclear single quantum correla-tion (HSQC) spectrum of the seed protein hydrolysateis shown in Figure 2. The 13C axis (labeled F1) on thisspectrum spans the 13C chemical shift range 10 to 50parts per million (ppm). Cross-peaks on this spectrumcorrespond to carbon atoms (that are attached toprotons) of compounds in the protein hydrolysate. Inthe spectrum shown in Figure 2, we identified ali-phatic carbon atoms of 16 amino acids, levulinic acid(LVA), and 5-hydroxymethyl furfural (HMF). Eachcarbon atom was identifiable by its unique 13C and1H chemical shifts as well as distinctive couplingpatterns and J-coupling constants (JCC). Explanationsof chemical shifts and JCC are provided by Harris(1983).
The amino acids identified in the spectrum resultedfrom degradation of the seed protein under the hy-
drolysis conditions employed (145�C, vacuum, 6 N
HCl) and are therefore proteinogenic amino acidssynthesized in the embryos. The LVA and HMF peaksappear on the spectrum because soybean seed storageprotein (most of the protein in the developing embryo)is highly glycosylated (Doyle et al., 1986), the attachedsugars being predominantly Man and glucosamine(Yamauchi and Yamagishi, 1979). Under the hydroly-sis conditions employed, the hexose skeletons of Man,Glc, and glucosamine are converted to LVA and HMF(G. Sriram, V.V. Iyer, and J.V. Shanks, unpublisheddata).
To assign the cross-peaks to carbon atoms, chemicalshift values for the amino acids obtained fromWuthrich et al. (1976) and JCC values obtained fromKrivdin and Kalabin (1989) were used. The assign-ments were also verified using supplementary 2-Dand 3-D NMR spectra of the hydrolysate of a 100%13C-labeled protein (data not shown). Chemical shiftsand JCC values for the carbon atoms of LVA and HMFwere obtained by analyzing [13C, 1H] spectra of hydroly-sates of Glc labeled at various positions (G. Sriram, V.V.Iyer, and J.V. Shanks, unpublished data).
A second [13C, 1H] HSQC spectrum of the seedstorage protein was acquired, where the 13C axisspanned the chemical shift range 90 to 160 ppm.Herein, the aromatic carbon atoms of Tyr, Phe, andHis were detected. A [13C, 1H] spectrum of the starchhydrolysate was acquired, where the 13C axis spannedthe chemical shift range 10 to 50 ppm. This spectrumcontained peaks corresponding to the aliphatic carbonatoms of LVA and HMF. This is expected since starch is
Figure 2. Two-dimensional [13C,1H] HSQC spectrum of protein hy-drolysate. Protein was isolated fromsoybean cotyledons cultured on Suc(10% [w/w] U-13C) and Gln. Cross-peaks represent carbon atoms ofhydrolysate constituents (proteino-genic amino acids, HMF, LVA). Thenames of some amino acid nucleiare omitted for clarity.
Metabolic Flux Evaluation in Soybean Embryos
Plant Physiol. Vol. 136, 2004 3045 www.plantphysiol.orgon July 4, 2018 - Published by Downloaded from
Copyright © 2004 American Society of Plant Biologists. All rights reserved.

a Glc polymer, and its hydrolysate should contain LVAand HMF for the reasons stated above.
Fine Structures of Peaks and Quantification ofIsotopomer Abundances
The cross-peaks in the [13C, 1H] spectrum displayedpeak splitting along the 13C dimension, due to 13C-13Cscalar coupling, as is evident in expanded views of thecross-peaks, e.g. Gly a and Asp b (Fig. 3). Detaileddescriptions of scalar coupling, why it causes peaksplitting, and the types of satellite peaks resulting frompeak splitting, are provided by Harris (1983) andCavanagh et al. (1996). Briefly, such peak splittingindicates the presence of multiple isotopomers of thedetected compounds. For instance, the Gly a-peakexhibits a central singlet peak (s) and two doubletpeaks (d) distributed on either side of the singlet (Fig.3A). The singlet in the Gly a fine structure representsa population of Gly isotopomers in which the a-atom(a) has a 13C nucleus, and the carboxyl atom (C)adjacent to it has a 12C nucleus. Whereas, the doublet
represents a population of Gly isotopomers in whichthe a-atom and the carboxyl atom both have 13C nuclei.Using boldface to represent 13C atoms and regular fontfor 12C atoms, the isotopomer population correspond-ing to the singlet may be represented as [Ca], and theone corresponding to the doublet as [Ca]. Likewise, thefine structure of the Asp b cross-peak shows a singlet(s), a doublet (d1), a doublet (d2), and a double doublet(dd; Fig. 3B). As per the above notation, the isotopomerpopulation represented by the singlet is [xabg], thatrepresented by the doublet d1 is [xabg], that by thedoublet d2 is [xabg], and that by the double doublet is[xabg]. Here, x stands for an undeterminable labelingstate, i.e. the atom represented by x (Asp carboxyl)cannot be detected from the Asp b fine structure.
These satellite peaks observed in the fine structureof a given cross-peak are termed multiplets. The abun-dances of the isotopomer populations represented bythe multiplets are directly proportional to the integralsof the respective multiplet peaks. We quantified peakintegrals by various methods depending on the com-plexity of the fine structure, as described in ‘‘Materialsand Methods.’’ The isotopomeric compositions of sinkmetabolites resulting from the quantification (a total of155 relative isotopomer abundances) are listed inSupplemental Material I.
Labeling States of Precursor Metabolites byRetrobiosynthetic Analysis
To evaluate metabolic fluxes of reactions in primarymetabolism, the isotopomer abundances of centralmetabolic precursors need to be calculated. These weredetermined from the labeling states of the sink metab-olites by retrobiosynthetic reconstruction, followingthe approach of Szyperski (1995) and Glawischnig et al.(2001). For instance, Thr is metabolically synthesizedfrom its precursor, plastidic oxaloacetate (OAAp), andthe four carbon atoms of Thr (denoted as [Cabg])correspond to the carbon atoms of OAAp (denoted as[1234]). Since OAAp is the only source of Thr, itsisotopomeric composition should be calculable fromthat of Thr. For example, the fractional abundance ofthe OAA isotopomer [123x] (relative to the total OAApool) should be equal to that of the Thr isotopomer[Cabx] or the intensity of the singlet in the Thr a peak(relative to the total Thr a signal). The precursorisotopomer structures corresponding to the quantifiedmultiplets are shown in Supplemental Material I. Insome cases, only sums of isotopomers can be assignedto a multiplet, rather than a single isotopomer. Thisoccurs for cross-peaks such as Tyr b, where the doubletrepresents the sum of two Tyr isotopomers. It alsooccurs for cross-peaks of sink metabolites that aresynthesized from multiple metabolic precursors, suchas Lys, which is synthesized from pyruvate and OAA.
The multiplet intensities of the sink metabolitesprovide an overdetermined data set for the calculationof the isotopomeric compositions of their precursor.This is because, usually, multiple sink metabolites are
Figure 3. Expanded views of [13C, 1H] HSQC spectrum: Gly a (A) andAsp b (B) cross-peaks. One-dimensional slices are shown alongside.The multiplet peaks are: s, singlet; d, d1, d2, doublet; dd, doubledoublet.
Sriram et al.
3046 Plant Physiol. Vol. 136, 2004 www.plantphysiol.orgon July 4, 2018 - Published by Downloaded from
Copyright © 2004 American Society of Plant Biologists. All rights reserved.
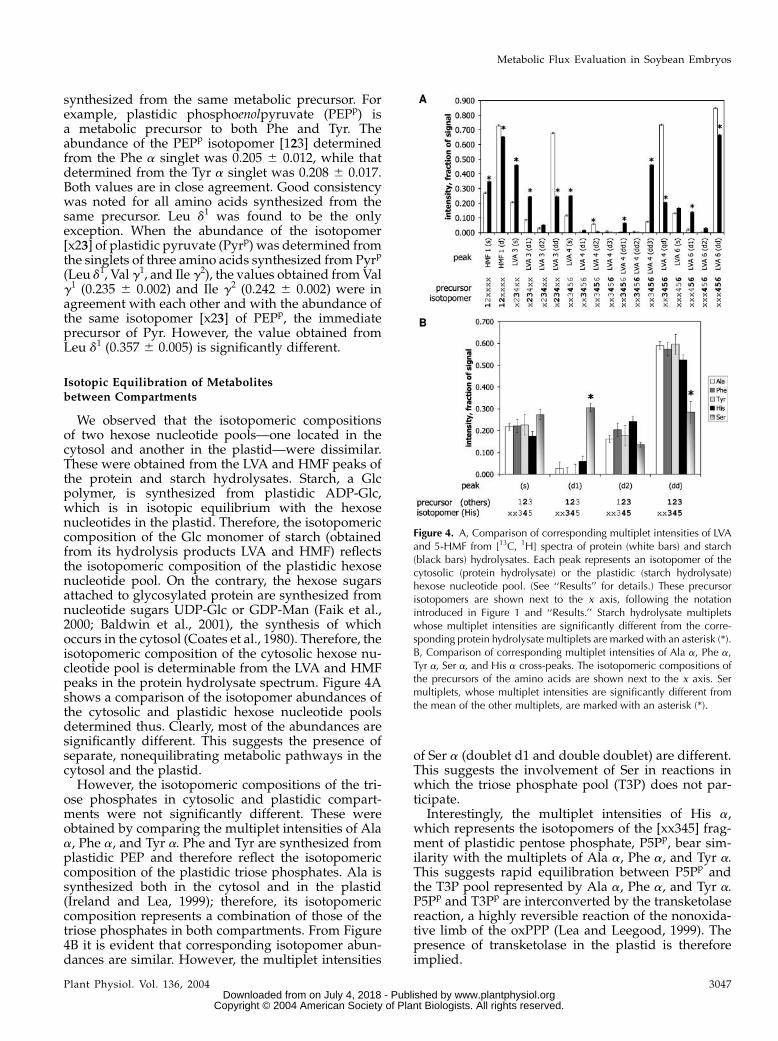
synthesized from the same metabolic precursor. Forexample, plastidic phosphoenolpyruvate (PEPp) isa metabolic precursor to both Phe and Tyr. Theabundance of the PEPp isotopomer [123] determinedfrom the Phe a singlet was 0.205 6 0.012, while thatdetermined from the Tyr a singlet was 0.208 6 0.017.Both values are in close agreement. Good consistencywas noted for all amino acids synthesized from thesame precursor. Leu d1 was found to be the onlyexception. When the abundance of the isotopomer[x23] of plastidic pyruvate (Pyrp) was determined fromthe singlets of three amino acids synthesized from Pyrp
(Leu d1, Val g1, and Ile g2), the values obtained from Valg1 (0.235 6 0.002) and Ile g2 (0.242 6 0.002) were inagreement with each other and with the abundance ofthe same isotopomer [x23] of PEPp, the immediateprecursor of Pyr. However, the value obtained fromLeu d1 (0.357 6 0.005) is significantly different.
Isotopic Equilibration of Metabolitesbetween Compartments
We observed that the isotopomeric compositionsof two hexose nucleotide pools—one located in thecytosol and another in the plastid—were dissimilar.These were obtained from the LVA and HMF peaks ofthe protein and starch hydrolysates. Starch, a Glcpolymer, is synthesized from plastidic ADP-Glc,which is in isotopic equilibrium with the hexosenucleotides in the plastid. Therefore, the isotopomericcomposition of the Glc monomer of starch (obtainedfrom its hydrolysis products LVA and HMF) reflectsthe isotopomeric composition of the plastidic hexosenucleotide pool. On the contrary, the hexose sugarsattached to glycosylated protein are synthesized fromnucleotide sugars UDP-Glc or GDP-Man (Faik et al.,2000; Baldwin et al., 2001), the synthesis of whichoccurs in the cytosol (Coates et al., 1980). Therefore, theisotopomeric composition of the cytosolic hexose nu-cleotide pool is determinable from the LVA and HMFpeaks in the protein hydrolysate spectrum. Figure 4Ashows a comparison of the isotopomer abundances ofthe cytosolic and plastidic hexose nucleotide poolsdetermined thus. Clearly, most of the abundances aresignificantly different. This suggests the presence ofseparate, nonequilibrating metabolic pathways in thecytosol and the plastid.
However, the isotopomeric compositions of the tri-ose phosphates in cytosolic and plastidic compart-ments were not significantly different. These wereobtained by comparing the multiplet intensities of Alaa, Phe a, and Tyr a. Phe and Tyr are synthesized fromplastidic PEP and therefore reflect the isotopomericcomposition of the plastidic triose phosphates. Ala issynthesized both in the cytosol and in the plastid(Ireland and Lea, 1999); therefore, its isotopomericcomposition represents a combination of those of thetriose phosphates in both compartments. From Figure4B it is evident that corresponding isotopomer abun-dances are similar. However, the multiplet intensities
of Ser a (doublet d1 and double doublet) are different.This suggests the involvement of Ser in reactions inwhich the triose phosphate pool (T3P) does not par-ticipate.
Interestingly, the multiplet intensities of His a,which represents the isotopomers of the [xx345] frag-ment of plastidic pentose phosphate, P5Pp, bear sim-ilarity with the multiplets of Ala a, Phe a, and Tyr a.This suggests rapid equilibration between P5Pp andthe T3P pool represented by Ala a, Phe a, and Tyr a.P5Pp and T3Pp are interconverted by the transketolasereaction, a highly reversible reaction of the nonoxida-tive limb of the oxPPP (Lea and Leegood, 1999). Thepresence of transketolase in the plastid is thereforeimplied.
Figure 4. A, Comparison of corresponding multiplet intensities of LVAand 5-HMF from [13C, 1H] spectra of protein (white bars) and starch(black bars) hydrolysates. Each peak represents an isotopomer of thecytosolic (protein hydrolysate) or the plastidic (starch hydrolysate)hexose nucleotide pool. (See ‘‘Results’’ for details.) These precursorisotopomers are shown next to the x axis, following the notationintroduced in Figure 1 and ‘‘Results.’’ Starch hydrolysate multipletswhose multiplet intensities are significantly different from the corre-sponding protein hydrolysate multiplets are marked with an asterisk (*).B, Comparison of corresponding multiplet intensities of Ala a, Phe a,Tyr a, Ser a, and His a cross-peaks. The isotopomeric compositions ofthe precursors of the amino acids are shown next to the x axis. Sermultiplets, whose multiplet intensities are significantly different fromthe mean of the other multiplets, are marked with an asterisk (*).
Metabolic Flux Evaluation in Soybean Embryos
Plant Physiol. Vol. 136, 2004 3047 www.plantphysiol.orgon July 4, 2018 - Published by Downloaded from
Copyright © 2004 American Society of Plant Biologists. All rights reserved.

The Carbon in Pyrp Originates Largely from Suc
We found that the carbon in Pyrp originates almostentirely from Suc and not from other external carbonsubstrates Gln or CO2. The carbon in any metabolitesynthesized in the embryos could be a mixture of thecarbon from three available external carbon sources:Suc, Gln (both present in the liquid medium), or CO2(through photosynthetic fixation). To determine thecontributions of these carbon sources to the carbon inPyrp, we determined the 13C enrichment of atom 3 ofPyrp and compared it with the 13C enrichment of thecarbon sources. The doublet intensities of Leu d2 andVal g2 provide the 13C enrichment of atom 3 of Pyrp
synthesized de novo since the beginning of the label-ing experiment (Szyperski, 1995). In our data, theseintensities were: Leu d2(d) 5 0.123 6 0.001 and Valg2(d) 5 0.118 6 0.002. Among the three external carbonsources, Suc had a substantial 13C enrichment in therange 0.11 to 0.12 (i.e. 0.10 from U-13C Suc andapproximately 0.011 from natural 13C abundance),while Gln and CO2 had a small natural 13C abundanceof 0.011.
Thus, the 13C enrichment of Pyrp synthesized duringthe labeling experiment was almost identical to the 13Cenrichment of the substrate Suc and significantlydifferent from the enrichments of the substrates Glnor CO2. This observation implies that the carbon inPyrp originates entirely from the Suc in the medium.Therefore, the Gln in the medium or external CO2fixation by photosynthesis make small or negligiblecontributions to the carbon in Pyrp, since a substantialcontribution from either of these carbon sources toPyrp would have resulted in its 13C enrichment beingconsiderably lower than 0.11.
Extracellular Fluxes and Fluxes Contributing to
Biomass Accumulation
The measurements of extracellular fluxes and fluxestoward biomass synthesis were as follows. The aver-age rate of biomass accumulation in the developingsoybean embryos was 2.3 g d21 cotyledon21. The Succonsumption was 9.59 3 1026 mmol d21 cotyledon21.The contents of biomass, including protein, oil, starch,and proteinogenic amino acid proportions, are listedin Supplemental Material II. The proportions of aminoacids in the protein compared well with publishedvalues for soybean embryo seed storage protein(Bewley and Black, 1994).
Metabolic Network Model
The calculation of metabolic fluxes from labelingdata requires a model of the metabolic network. Ourmodel is shown in Figure 5. It includes all principalpathways of primary metabolism (glycolysis, oxPPP,TCA cycle, anaplerotic shunts, glyoxylate shunt, andGABA shunt) and the biosynthetic pathways that
convert the primary metabolic precursors to sinkmetabolites. Also, it includes three metabolic com-partments: cytosol, plastid, and mitochondrion. Thepathways in the model were assigned to specificcompartments based on information in the currentliterature (see references below). Some pathwayscould not be unequivocally assigned to a single com-partment, since they are known to operate separatelyin multiple compartments. Thus, we included separateglycolysis and oxPPP pathways in the cytosol andplastid, as well as separate malic enzyme (Mal / Pyr)fluxes in the plastid and mitochondrion.
The sources of information for the primary metabolicand biosynthetic pathways in the model were the recentliterature on soybean embryo or higher plant biochem-istry (Breitkreuz and Shelp, 1995; Chollet et al., 1996;Lam et al., 1996; Casati et al., 1999; Hermann andWeaver, 1999; Singh, 1999; Drincovich et al., 2001;Jeanneau et al., 2002), plant biochemistry texts (Deyand Harborne, 1997; Lea and Leegood, 1999), and theonline catalog Soybase (2004). These sources alsoprovided information on the precursors of the sink meta-bolites. Stoichiometries and carbon atom rearrange-ments for the reactions were obtained from the KyotoEncyclopedia of Genes and Genomes (KEGG, 2004).
The reactions in the model were assumed reversibleunless information on irreversibility was available. Allreversible reactions were modeled as two fluxes (seeSupplemental Material IV, p. 10). The reaction fromsuccinate to malate (Mal) in the TCA cycle can lead toan inversion of the labeling pattern, owing to the factthat succinate is a symmetrical molecule while Mal isnot (Schmidt et al., 1999). To account for this fact, thisreaction was modeled as two parallel fluxes, one thatconserves the carbon skeleton and another that invertsthe same (see Supplemental Material IV, p. 10).
The metabolic model also incorporated the observa-tions reported in the previous sections. Specifically, thephotosynthetic reactions (Calvin cycle) were not in-cluded in our model because carbon assimilation byexternal CO2 fixation was found to be negligible.Because differences were observed between the iso-topomeric compositions of the cytosolic and plastidichexose nucleotide pools, we assumed separate glycol-ysis pathways and oxPPPs to operate in those com-partments, with the cytosolic and plastidic G6P poolsacting as precursors to the respective hexose nucleo-tide pools. To account for the difference in the isoto-pomeric compositions of Ser and T3P, we incorporateda reversible reaction between Ser and Gly, which isknown to occur during the catabolism of Ser inheterotrophic plant tissues (Bourguignon et al., 1999).
Metabolic Fluxes
Fluxes in the above metabolic network were calcu-lated from the measured isotopomer abundances, ex-tracellular fluxes, and biomass composition by using aflux evaluation mathematical routine that incorpo-rated isotopomer balancing and global optimization.
Sriram et al.
3048 Plant Physiol. Vol. 136, 2004 www.plantphysiol.orgon July 4, 2018 - Published by Downloaded from
Copyright © 2004 American Society of Plant Biologists. All rights reserved.

(All mathematical and computational details are ex-plained in Supplemental Material IV–VI.) The objectiveof this routine was to evaluate a set of stoichiometricallyfeasible fluxes that best accounts for the isotopomerand extracellular flux measurements. The flux evalua-tion routine was implemented by a computer program,NMR2Flux. It was ensured that the iteratively evalu-ated flux solution is unique by repeating the fluxevaluation at least 300 times from arbitrary startingpoints. SD for the fluxes and reversibility extents werecomputed from a statistical analysis. (For details, seeSupplemental Material IV, p. 21.)
The evaluated fluxes are listed in Figure 6 and alsodepicted in Figure 5 (arrow widths in this figure aredirectly proportional to flux). Figure 7 depicts the
agreement between experimental multiplet intensitiesand those simulated from the evaluated fluxes. It canbe seen that the evaluated fluxes explain the labelingdata well. Only a few outlier points can be observed, ofwhich the Leu d1 intensities (shown with black circles)were the largest contributors to the cumulative x2 errorbetween the simulated and experimental intensities.
The flux into the oxPPP was found to be 9.10 63.85 mmol d21 cotyledon21 in the cytosol and 10.90 64.97 mmol d21 cotyledon21 in the plastid, the totalflux being 19.99 6 4.39 mmol d21 cotyledon21. On a car-bon mole basis, this is 104.2 carbon mol 623.0 carbonmol per 100 carbon mol of Suc uptake. Also, the fluxof the hexose phosphate isomerase reaction, in boththe cytosol and plastid, is in the direction Fru-6-P
Figure 5. Metabolic flux map of primary and intermediate metabolic pathways in developing soybean cotyledons cultured onSuc (10% [w/w] U-13C) and Gln. Fluxes are proportional to arrow widths. (Fluxes less than 0.4 mmol d21 cotyledon21 are shownwith lines of lowest visible thickness.) Arrows indicate the direction of net flux. A complete numerical listing of estimated fluxvalues and reaction reversibilities is provided in Figure 6. Intracellular metabolites are shown in white ovals, and gray ovals showsink metabolites (proteinogenic amino acids, polysaccharides, etc.). Metabolites taken up from/secreted into the medium areshown in blue ovals. Metabolic pathways are color coded as follows: dark red, glycolysis and Suc metabolism; pale blue, pentosephosphate pathway; orange, TCA cycle; blue-gray, pyruvate dehydrogenase link; mauve, anaplerotic fluxes; dark yellow,glyoxylate shunt; green, Glu metabolism, GABA shunt, and associated intercompartmental transport fluxes; gray, fluxes towardbiomass synthesis; and black, all intercompartmental transport fluxes except those involved in Gln metabolism and GABA shunt.Abbreviations for intracellular metabolites not defined in the text are as follows: P5P, pentose-5-P; S7P, sedoheptulose-7-P; E4P,erythrose-4-P; acetCoA, acetyl CoA; iCit, isocitrate; aKG, a-ketoglutarate; Scn, succinate; SSA, succinic semi-aldehyde; and GOx,glyoxylate. Sink metabolite abbreviations are as follows: Psac, polysaccharides; Nuc, carbon skeleton of nucleotides; and Sta,starch. Asp and Asn are denoted together as Asx. Glu and Gln are denoted together as Glx. F6P and T3P appear at two differentlocations each in the cytosol and plastid, to avoid confusing intersections of lines. Each flux is assigned a short name based on thename of the gene encoding one of the metabolic reactions represented by it. Intracellular metabolites and fluxes with a superscriptare located in specific subcellular compartments: c, cytosol; p, plastid; and m, mitochondrion. If a flux has no superscript, itscompartmentation could not be unambiguously determined (such as gap, eno, and pyk, and some fluxes toward biosynthesis).
Metabolic Flux Evaluation in Soybean Embryos
Plant Physiol. Vol. 136, 2004 3049 www.plantphysiol.orgon July 4, 2018 - Published by Downloaded from
Copyright © 2004 American Society of Plant Biologists. All rights reserved.
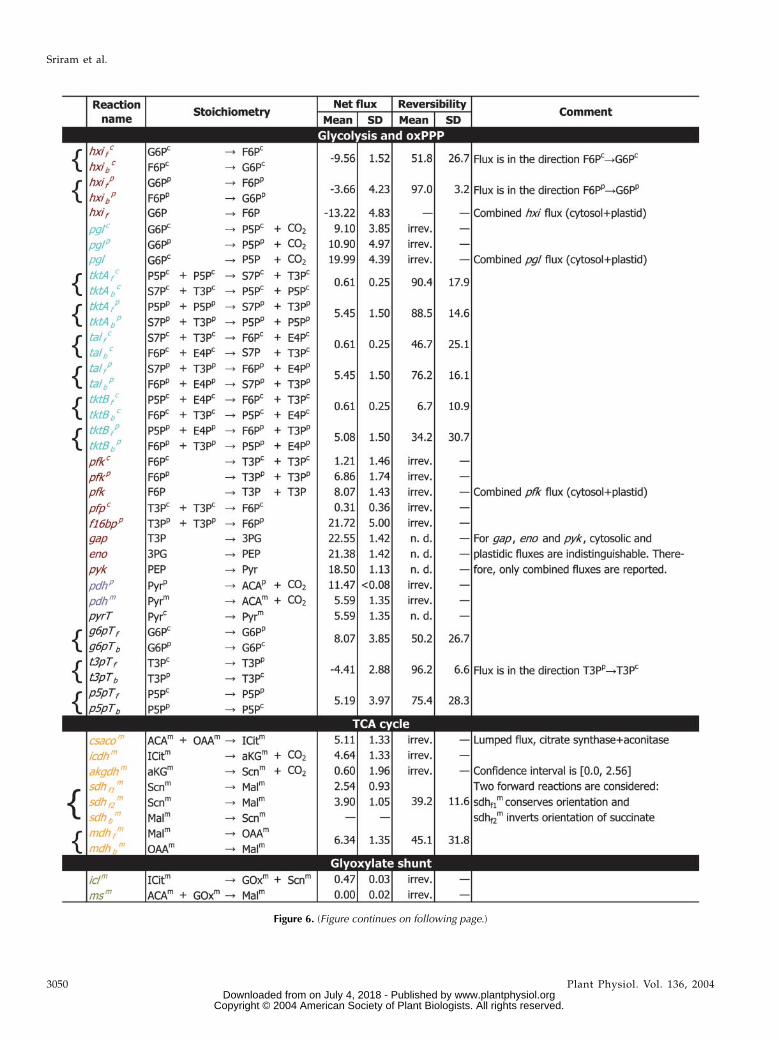
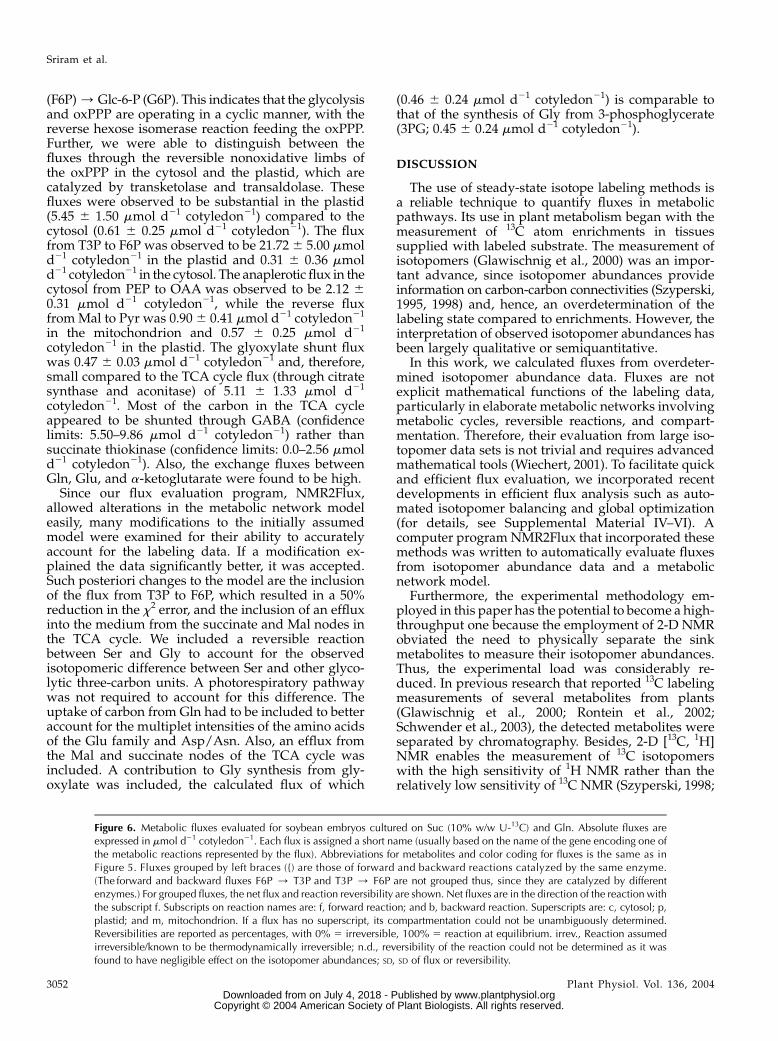
Figure 6. (Figure continues on following page.)
Sriram et al.
3050 Plant Physiol. Vol. 136, 2004 www.plantphysiol.orgon July 4, 2018 - Published by Downloaded from
Copyright © 2004 American Society of Plant Biologists. All rights reserved.

Figure 6. (Legend appears on following page.)
Metabolic Flux Evaluation in Soybean Embryos
Plant Physiol. Vol. 136, 2004 3051 www.plantphysiol.orgon July 4, 2018 - Published by Downloaded from
Copyright © 2004 American Society of Plant Biologists. All rights reserved.
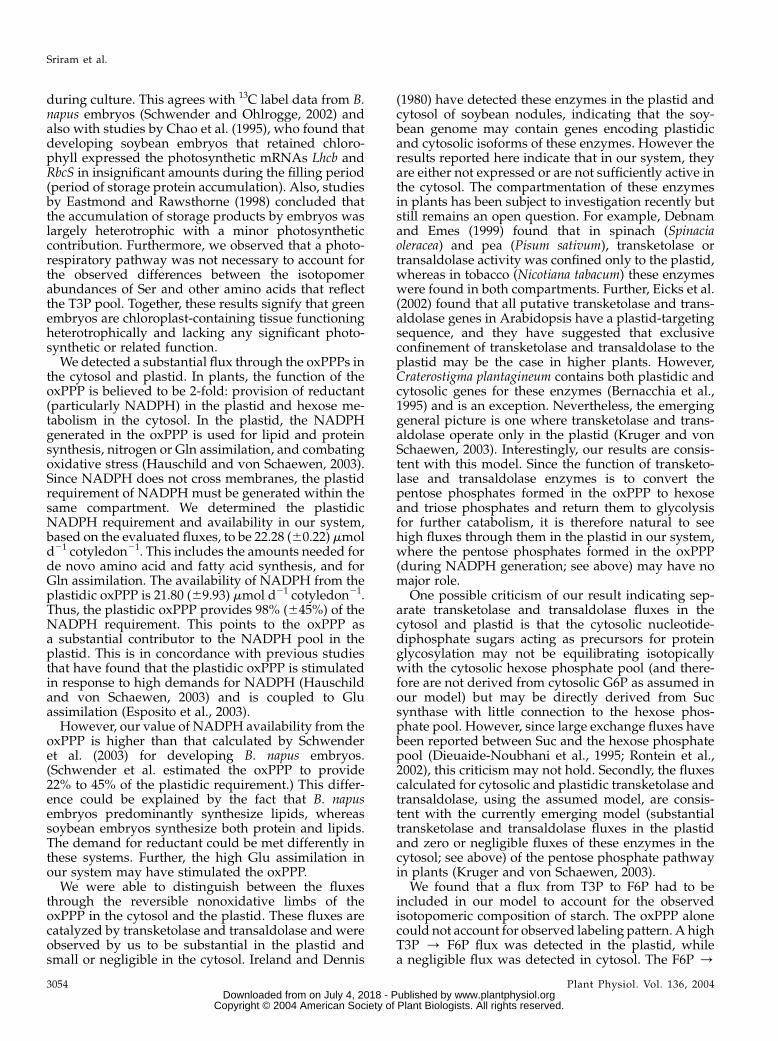
(F6P) / Glc-6-P (G6P). This indicates that the glycolysisand oxPPP are operating in a cyclic manner, with thereverse hexose isomerase reaction feeding the oxPPP.Further, we were able to distinguish between thefluxes through the reversible nonoxidative limbs ofthe oxPPP in the cytosol and the plastid, which arecatalyzed by transketolase and transaldolase. Thesefluxes were observed to be substantial in the plastid(5.45 6 1.50 mmol d21 cotyledon21) compared to thecytosol (0.61 6 0.25 mmol d21 cotyledon21). The fluxfrom T3P to F6P was observed to be 21.72 6 5.00 mmold21 cotyledon21 in the plastid and 0.31 6 0.36 mmold21 cotyledon21 in the cytosol. The anaplerotic flux in thecytosol from PEP to OAA was observed to be 2.12 60.31 mmol d21 cotyledon21, while the reverse fluxfrom Mal to Pyr was 0.90 6 0.41 mmol d21 cotyledon21
in the mitochondrion and 0.57 6 0.25 mmol d21
cotyledon21 in the plastid. The glyoxylate shunt fluxwas 0.47 6 0.03 mmol d21 cotyledon21 and, therefore,small compared to the TCA cycle flux (through citratesynthase and aconitase) of 5.11 6 1.33 mmol d21
cotyledon21. Most of the carbon in the TCA cycleappeared to be shunted through GABA (confidencelimits: 5.50–9.86 mmol d21 cotyledon21) rather thansuccinate thiokinase (confidence limits: 0.0–2.56 mmold21 cotyledon21). Also, the exchange fluxes betweenGln, Glu, and a-ketoglutarate were found to be high.
Since our flux evaluation program, NMR2Flux,allowed alterations in the metabolic network modeleasily, many modifications to the initially assumedmodel were examined for their ability to accuratelyaccount for the labeling data. If a modification ex-plained the data significantly better, it was accepted.Such posteriori changes to the model are the inclusionof the flux from T3P to F6P, which resulted in a 50%reduction in the x2 error, and the inclusion of an effluxinto the medium from the succinate and Mal nodes inthe TCA cycle. We included a reversible reactionbetween Ser and Gly to account for the observedisotopomeric difference between Ser and other glyco-lytic three-carbon units. A photorespiratory pathwaywas not required to account for this difference. Theuptake of carbon from Gln had to be included to betteraccount for the multiplet intensities of the amino acidsof the Glu family and Asp/Asn. Also, an efflux fromthe Mal and succinate nodes of the TCA cycle wasincluded. A contribution to Gly synthesis from gly-oxylate was included, the calculated flux of which
(0.46 6 0.24 mmol d21 cotyledon21) is comparable tothat of the synthesis of Gly from 3-phosphoglycerate(3PG; 0.45 6 0.24 mmol d21 cotyledon21).
DISCUSSION
The use of steady-state isotope labeling methods isa reliable technique to quantify fluxes in metabolicpathways. Its use in plant metabolism began with themeasurement of 13C atom enrichments in tissuessupplied with labeled substrate. The measurement ofisotopomers (Glawischnig et al., 2000) was an impor-tant advance, since isotopomer abundances provideinformation on carbon-carbon connectivities (Szyperski,1995, 1998) and, hence, an overdetermination of thelabeling state compared to enrichments. However, theinterpretation of observed isotopomer abundances hasbeen largely qualitative or semiquantitative.
In this work, we calculated fluxes from overdeter-mined isotopomer abundance data. Fluxes are notexplicit mathematical functions of the labeling data,particularly in elaborate metabolic networks involvingmetabolic cycles, reversible reactions, and compart-mentation. Therefore, their evaluation from large iso-topomer data sets is not trivial and requires advancedmathematical tools (Wiechert, 2001). To facilitate quickand efficient flux evaluation, we incorporated recentdevelopments in efficient flux analysis such as auto-mated isotopomer balancing and global optimization(for details, see Supplemental Material IV–VI). Acomputer program NMR2Flux that incorporated thesemethods was written to automatically evaluate fluxesfrom isotopomer abundance data and a metabolicnetwork model.
Furthermore, the experimental methodology em-ployed in this paper has the potential to become a high-throughput one because the employment of 2-D NMRobviated the need to physically separate the sinkmetabolites to measure their isotopomer abundances.Thus, the experimental load was considerably re-duced. In previous research that reported 13C labelingmeasurements of several metabolites from plants(Glawischnig et al., 2000; Rontein et al., 2002;Schwender et al., 2003), the detected metabolites wereseparated by chromatography. Besides, 2-D [13C, 1H]NMR enables the measurement of 13C isotopomerswith the high sensitivity of 1H NMR rather than therelatively low sensitivity of 13C NMR (Szyperski, 1998;
Figure 6. Metabolic fluxes evaluated for soybean embryos cultured on Suc (10% w/w U-13C) and Gln. Absolute fluxes areexpressed in mmol d21 cotyledon21. Each flux is assigned a short name (usually based on the name of the gene encoding one ofthe metabolic reactions represented by the flux). Abbreviations for metabolites and color coding for fluxes is the same as inFigure 5. Fluxes grouped by left braces ({) are those of forward and backward reactions catalyzed by the same enzyme.(The forward and backward fluxes F6P / T3P and T3P / F6P are not grouped thus, since they are catalyzed by differentenzymes.) For grouped fluxes, the net flux and reaction reversibility are shown. Net fluxes are in the direction of the reaction withthe subscript f. Subscripts on reaction names are: f, forward reaction; and b, backward reaction. Superscripts are: c, cytosol; p,plastid; and m, mitochondrion. If a flux has no superscript, its compartmentation could not be unambiguously determined.Reversibilities are reported as percentages, with 0% 5 irreversible, 100% 5 reaction at equilibrium. irrev., Reaction assumedirreversible/known to be thermodynamically irreversible; n.d., reversibility of the reaction could not be determined as it wasfound to have negligible effect on the isotopomer abundances; SD, SD of flux or reversibility.
Sriram et al.
3052 Plant Physiol. Vol. 136, 2004 www.plantphysiol.orgon July 4, 2018 - Published by Downloaded from
Copyright © 2004 American Society of Plant Biologists. All rights reserved.

Wiechert et al., 1999). The use of 2-D NMR is thereforecrucial in the large-scale application of flux evaluationin plants.
The attainment of isotopic steady state is essentialfor the calculation of fluxes from the labeling data. Forthe in vitro soybean embryo culture employed here,the residence time of Suc in the cells is approximately9.4 h, as calculated from the uptake of Suc (1.179 31026 mol h21 for three cotyledons) and the free-spaceSuc concentration documented for developing soy-bean embryos (37 mM; Lichtner and Spanswick, 1981).Isotopic steady state is attained within 5 residencetimes (i.e. ,48 h or 2 d), which is less than the 6-dlabeling period employed here. Therefore, the labelingdata in this work can be assumed to be at steady state.
We observed that the measured isotopomer abun-dances of Leu d1 did not agree with the simulatedabundances of its precursor, Pyrp. However, all otheramino acid atoms showed good agreement, includingother amino acids synthesized from Pyrp (Val g1, Ileg2). Also, the Leu d1 abundances were the largestcontributors to the cumulative x2 error between sim-ulated and experimental isotopomer abundances. Wealso found this anomaly in isotopomer data fromsoybean embryos cultured at other temperatures(V.V. Iyer, G. Sriram, and J.V. Shanks, unpublisheddata) and from Catharanthus roseus hairy roots (G.Sriram and J.V. Shanks, unpublished data). This was
not an artifact of the protein hydrolysis or NMR, sinceit has neither been reported in isotopomer abundancedata from hydrolysates of protein from prokaryotes(e.g. Szyperski, 1995) nor been observed in our datafrom hydrolysates of 100% 13C-labeled prokaryoticprotein. This anomaly was not observed in other Leuatoms. This anomaly suggests that the assumption ofPyrp as a precursor to Leu d1 or the assumed linearmetabolic pathway from Pyrp to Leu d1 may be in-correct. However, there exists substantial evidencethat Pyrp is the precursor of Leu d1 (Singh, 1999). Also,the observed isotopomer abundances of Val g1 and Ileg2 agreed with the simulated abundances of Pyrp.Therefore, it may be likely that the pathway between2-oxoisovalerate and Leu (the only part of the pathwayof branched amino acid synthesis from Pyrp not sharedby Val or Ile) may have other precursors feeding into itand needs further investigation. An alternative expla-nation of this anomaly is that Leu may be metabolizedby pathways not considered in our metabolic model.While this anomaly is still not completely resolved, itpoints to the fact that such comprehensive flux anal-ysis can draw attention to errors in hypothesizedpathways in a metabolic model.
We observed that the hexose nucleotide pools in thecytosol and plastid were not in isotopic equilibrium.This result is supported by the finding that, in D. carotacells, the 13C enrichments of the carbon atoms of Suc(synthesized from the cytosolic hexose phosphatepool) and starch (synthesized from the plastidic hexosephosphate pool) were significantly different through-out the period of labeling study (Krook et al., 1998).However, Keeling (1991), Rontein et al. (2002), andSchwender et al. (2003) reported nearly similar enrich-ments for Suc and starch, which contrasts with ourresult. Therefore, the equilibration of hexoses betweenthe two compartments may be a function of metabolicdemand, and no general conclusion can be made.
On the other hand, our data showed that the T3Ppools in the cytosol and plastid have the same iso-topomeric composition and were not distinguishable.This has been observed previously by Rontein et al.(2002) and Schwender et al. (2003). One possibility thatexplains this result is that the two pools may beexchanging rapidly, i.e. they are in equilibrium. An-other possibility that could account for this result is theabsence of enolase in the plastid. Enolase catalyzes theconversion of 3PG to PEP, and its absence has beenreported in chloroplasts as well as nonphotosyntheticplastids of various species (Fischer et al., 1997). If it isabsent in the plastid, the PEP (and/or pyruvate)required for plastidic biosynthesis may have to bemanufactured in the cytosol. This would necessitatethe export of T3P from the plastid to the cytosol (by theT3P/phosphate transporter) and the import of PEP inthe opposite direction (by the PEP/phosphate trans-porter; Streatfield et al., 1999). This model suggestsa single, lower glycolytic pathway in many plastids.
Our data showed negligible photosynthetic carbonassimilation, although the cotyledons were green
Figure 7. Comparison of experimental and simulated multiplet in-tensities, depicting how closely the evaluated fluxes account for thelabeling data (multiplet intensities or isotopomer abundances). The xaxis represents experimental multiplet intensities measured from [13C,1H] spectra; the y axis represents relative intensities that were simulatedby the computer program NMR2Flux, corresponding to the evaluatedfluxes (Fig. 6). Multiplet intensities are shown as fraction of total signal.The thick diagonal line is the 45� diagonal, on which the error betweenmeasurement and simulation is zero. The thin lines enclose 90% of alldata points (all points with error #0.0434). The singlet and doubletintensities of Leu d1 are shown as black circles.
Metabolic Flux Evaluation in Soybean Embryos
Plant Physiol. Vol. 136, 2004 3053 www.plantphysiol.orgon July 4, 2018 - Published by Downloaded from
Copyright © 2004 American Society of Plant Biologists. All rights reserved.
during culture. This agrees with 13C label data from B.napus embryos (Schwender and Ohlrogge, 2002) andalso with studies by Chao et al. (1995), who found thatdeveloping soybean embryos that retained chloro-phyll expressed the photosynthetic mRNAs Lhcb andRbcS in insignificant amounts during the filling period(period of storage protein accumulation). Also, studiesby Eastmond and Rawsthorne (1998) concluded thatthe accumulation of storage products by embryos waslargely heterotrophic with a minor photosyntheticcontribution. Furthermore, we observed that a photo-respiratory pathway was not necessary to account forthe observed differences between the isotopomerabundances of Ser and other amino acids that reflectthe T3P pool. Together, these results signify that greenembryos are chloroplast-containing tissue functioningheterotrophically and lacking any significant photo-synthetic or related function.
We detected a substantial flux through the oxPPPs inthe cytosol and plastid. In plants, the function of theoxPPP is believed to be 2-fold: provision of reductant(particularly NADPH) in the plastid and hexose me-tabolism in the cytosol. In the plastid, the NADPHgenerated in the oxPPP is used for lipid and proteinsynthesis, nitrogen or Gln assimilation, and combatingoxidative stress (Hauschild and von Schaewen, 2003).Since NADPH does not cross membranes, the plastidrequirement of NADPH must be generated within thesame compartment. We determined the plastidicNADPH requirement and availability in our system,based on the evaluated fluxes, to be 22.28 (60.22) mmold21 cotyledon21. This includes the amounts needed forde novo amino acid and fatty acid synthesis, and forGln assimilation. The availability of NADPH from theplastidic oxPPP is 21.80 (69.93) mmol d21 cotyledon21.Thus, the plastidic oxPPP provides 98% (645%) of theNADPH requirement. This points to the oxPPP asa substantial contributor to the NADPH pool in theplastid. This is in concordance with previous studiesthat have found that the plastidic oxPPP is stimulatedin response to high demands for NADPH (Hauschildand von Schaewen, 2003) and is coupled to Gluassimilation (Esposito et al., 2003).
However, our value of NADPH availability from theoxPPP is higher than that calculated by Schwenderet al. (2003) for developing B. napus embryos.(Schwender et al. estimated the oxPPP to provide22% to 45% of the plastidic requirement.) This differ-ence could be explained by the fact that B. napusembryos predominantly synthesize lipids, whereassoybean embryos synthesize both protein and lipids.The demand for reductant could be met differently inthese systems. Further, the high Glu assimilation inour system may have stimulated the oxPPP.
We were able to distinguish between the fluxesthrough the reversible nonoxidative limbs of theoxPPP in the cytosol and the plastid. These fluxes arecatalyzed by transketolase and transaldolase and wereobserved by us to be substantial in the plastid andsmall or negligible in the cytosol. Ireland and Dennis
(1980) have detected these enzymes in the plastid andcytosol of soybean nodules, indicating that the soy-bean genome may contain genes encoding plastidicand cytosolic isoforms of these enzymes. However theresults reported here indicate that in our system, theyare either not expressed or are not sufficiently active inthe cytosol. The compartmentation of these enzymesin plants has been subject to investigation recently butstill remains an open question. For example, Debnamand Emes (1999) found that in spinach (Spinaciaoleracea) and pea (Pisum sativum), transketolase ortransaldolase activity was confined only to the plastid,whereas in tobacco (Nicotiana tabacum) these enzymeswere found in both compartments. Further, Eicks et al.(2002) found that all putative transketolase and trans-aldolase genes in Arabidopsis have a plastid-targetingsequence, and they have suggested that exclusiveconfinement of transketolase and transaldolase to theplastid may be the case in higher plants. However,Craterostigma plantagineum contains both plastidic andcytosolic genes for these enzymes (Bernacchia et al.,1995) and is an exception. Nevertheless, the emerginggeneral picture is one where transketolase and trans-aldolase operate only in the plastid (Kruger and vonSchaewen, 2003). Interestingly, our results are consis-tent with this model. Since the function of transketo-lase and transaldolase enzymes is to convert thepentose phosphates formed in the oxPPP to hexoseand triose phosphates and return them to glycolysisfor further catabolism, it is therefore natural to seehigh fluxes through them in the plastid in our system,where the pentose phosphates formed in the oxPPP(during NADPH generation; see above) may have nomajor role.
One possible criticism of our result indicating sep-arate transketolase and transaldolase fluxes in thecytosol and plastid is that the cytosolic nucleotide-diphosphate sugars acting as precursors for proteinglycosylation may not be equilibrating isotopicallywith the cytosolic hexose phosphate pool (and there-fore are not derived from cytosolic G6P as assumed inour model) but may be directly derived from Sucsynthase with little connection to the hexose phos-phate pool. However, since large exchange fluxes havebeen reported between Suc and the hexose phosphatepool (Dieuaide-Noubhani et al., 1995; Rontein et al.,2002), this criticism may not hold. Secondly, the fluxescalculated for cytosolic and plastidic transketolase andtransaldolase, using the assumed model, are consis-tent with the currently emerging model (substantialtransketolase and transaldolase fluxes in the plastidand zero or negligible fluxes of these enzymes in thecytosol; see above) of the pentose phosphate pathwayin plants (Kruger and von Schaewen, 2003).
We found that a flux from T3P to F6P had to beincluded in our model to account for the observedisotopomeric composition of starch. The oxPPP alonecould not account for observed labeling pattern. A highT3P / F6P flux was detected in the plastid, whilea negligible flux was detected in cytosol. The F6P /
Sriram et al.
3054 Plant Physiol. Vol. 136, 2004 www.plantphysiol.orgon July 4, 2018 - Published by Downloaded from
Copyright © 2004 American Society of Plant Biologists. All rights reserved.

T3P conversion catalyzed by phosphofructokinase isirreversible, and the only plastidic enzyme responsiblefor a flux in the opposite direction is Fru-1,6-bisphos-phatase. Interestingly, this enzyme is usually associ-ated with photosynthetic plastids, where it convertsthe photosynthate to starch for storage. Its existencehas been ruled out in heterotrophic tissues, although ithas been detected in pea embryos (Entwistle and apRees, 1990). Together with this result, our findingsuggests an atypical role for plastidic Fru-1,6-bisphos-phatase in embryo metabolism.
Plants contain anaplerotic enzymes catalyzing bothdirections of the PEP/Pyr / OAA/Mal conversion,and the plastidic Mal / Pyr conversion is thought toprovide plastidic Pyr and/or NADPH toward bio-synthesis. However, we found little cycling betweenthese reactions, and the function of the anapleroticfluxes appears to be replenishment of the smallamount of OAA lost from the TCA cycle to Asp andAsn biosynthesis. We observed a rather small fluxfrom Mal / Pyr in the plastid. This indicates that, inour system, Mal does not substantially contributecarbon toward biosynthesis or NADPH availability.
The GABA shunt has been detected in soybeancotyledons previously (Breitkreuz and Shelp, 1995),and we found that it appears to be preferred oversuccinate thiokinase reaction of the TCA cycle. We alsoobserved negligible flux through the glyoxylate shunt.This is natural to expect, since the glyoxylate enzymesin embryos are turned on only at the start of germi-nation (Reynolds and Smith, 1995) and during leafsenescence. The glyoxylate shunt metabolizes acetateunits resulting from the breakdown of lipids, and ina tissue that primarily accumulates lipids, its activity isanticipated to be insignificant.
CONCLUSION AND FUTURE DIRECTIONS
In this work, we performed 13C-labeling experi-ments on developing soybean embryos and obtainedexhaustive labeling data from sink metabolites by 2-DNMR. It was possible to quantify carbon partitioningthrough several metabolic processes, including glycol-ysis, oxPPP, gluconeogenesis, anaplerotic pathways,TCA cycle, and the glyoxylate and GABA shunts.Furthermore, we were also able to distinguish betweenfluxes in different compartments, based on labelingdata of sink metabolites known to be synthesized inseparate compartments. To the best of our knowledge,this is the most comprehensive flux analysis of a plantsystem to date. The experimental methodology em-ployed in this work has the potential to become a high-throughput one. Further reduction of the sample sizeand duration of labeling period should be possible andcould be optimized. The computer program devel-oped to calculate fluxes from the labeling data isgeneric. We expect these features to increase theapplicability of flux analysis in plants.
As demonstrated here, flux analysis can provideinsights on physiology and function. Comparison of
fluxes between genetic or environmental variants canprovide valuable information about the effects ofgenetic or environmental manipulations on the phys-iology. This is particularly relevant in the context ofthe recent upsurge in plant metabolic engineering(Hanson and Shanks, 2002). Together with high-throughput data on transcripts, proteins, and metab-olites, systemic flux data can provide the basis forunderstanding the functioning of plants from a sys-tems biology perspective (Sweetlove et al., 2003). Workis under way in our laboratory to evaluate fluxes insoybean embryos grown in different environmentsand in another plant system. Using recent theoreticaldevelopments on flux identifiability (Isermann andWiechert, 2003), we are also working toward designinglabeling experiments on plant systems with judiciouscombinations of labeled substrates so as to increase theflux information available from them.
MATERIALS AND METHODS
Soybean Cotyledon Culture
Soybean (Glycine max cv Evans) was grown in a growth chamber at 27�C/
20�C and 14-h photoperiod. Eighteen days after flowering, pods were
harvested from the central section of the main stem and embryos isolated
for in vitro culture. Three cotyledons were selected for uniform initial size
(100–120 mg fresh weight) and cultured aseptically in 20 mL of liquid medium
containing 146 mM Suc (10% [w/w] U-13C, 90% [w/w] commercial, with
a natural 13C abundance of 1.1%) and 37 mM Gln (commercial, natural 13C
abundance of 1.1%) as the only carbon sources. This labeling technique is
termed biosynthetically directed fractional 13C labeling (Szyperski, 1995).
U-13C Suc was purchased from Isotec (Miamisburg, OH). The in vitro culture
was maintained at 25�C, 100 rpm, and approximately 100 mE m22 s21 light
intensity. After 6 d of culture, cotyledons were harvested, rinsed with
nonlabeled medium, and lyophilized at 250�C and 133 3 1023 mbar for
72 h. The lyophilized embryos were finely ground for further processing.
Protein Extraction, Hydrolysis, Amino Acid
Quantification, and NMR Sample Preparation
Protein was extracted from ground samples in 100 mM phosphate buffer,
pH 7.2, at 4�C for 15 min. The extract was repeated four times, and the
consolidated supernatant was assayed for protein using the Bradford test (Bio-
Rad Laboratories, Hercules, CA).
Protein hydrolysis was performed in hydrolysis tubes (Pierce Endogen,
Rockford, IL), to which 6 N hydrochloric acid was added in the 0.5 mL of
HCl:400 mg of protein. The hydrolysis tube was evacuated, flushed with
nitrogen to remove residual oxygen, and reevacuated. Hydrolysis was
performed at 150�C for 4 h. The acid in the hydrolysate was evaporated in
a Rapidvap evaporator (Labconco, Kansas City, MO). The residue was
redissolved in 2 mL of deionized water, lyophilized for 72 h, and dissolved
in 500 mL of D2O in an NMR tube. The pH of the NMR sample was adjusted to
0.5 using DCl. Amino acids in the sample were quantified by HPLC, after
derivatization with phenylisothiocyanate to produce phenylthiocarbamyl
amino acid derivatives, which were eluted by a reverse-phase C18 silica
column, with detection at 254 nm.
Extracellular Fluxes and Fluxes Contributing to Biomass
Biomass growth was quantified by measuring embryo fresh weight.
Protein and proteinogenic amino acid proportions in the biomass were
determined as above. Lipids were extracted in hexane at 45�C and quantified
by weight. Suc consumption was measured using HPLC. The measurements
related to biomass fluxes are listed in Supplemental Material II.
Metabolic Flux Evaluation in Soybean Embryos
Plant Physiol. Vol. 136, 2004 3055 www.plantphysiol.orgon July 4, 2018 - Published by Downloaded from
Copyright © 2004 American Society of Plant Biologists. All rights reserved.
NMR Spectroscopy
Two-dimensional [13C, 1H] HSQC NMR spectra (Bodenhausen and
Ruben, 1980) were collected on a Bruker Avance DRX 500 MHz spectrom-
eter (Bruker Instruments, Billerica, MA) at 298 K. The reference to 0 ppm
was set using the methyl signal of dimethylsilapentanesulfonate (Sigma, St.
Louis) as an internal standard. The resonance frequency of 13C and 1H
were 125.7 MHz and 499.9 MHz, respectively. The spectral width was
5,482.26 Hz along the 1H (F2) dimension and 5,028.05 Hz along the 13C (F1)
dimension. Peak aliasing was used in order to minimize the sweep width
along the F1 dimension. The number of complex data points was 1,024 (1H)
3 900 (13C). A modification of the INEPT (insensitive nuclei enhanced by
polarization transfer) pulse sequence was used for acquiring HSQC spectra
(Bodenhausen and Ruben, 1980). The number of scans was generally set to
16. Assignment of amino acid peaks on the HSQC spectrum was verified
using 2-D [1H, 1H] total correlation (TOCSY) and 3-D [13C, 1H, 1H] TOCSY
spectra (Braunschweiler and Ernst, 1983), which were acquired with a 100%
labeled protein sample. While acquiring TOCSY spectra, the DIPSI-2
sequence (Shaka et al., 1988) was used for isotropic mixing, with a mixing
time of 76 ms.
The software Xwinnmr (Bruker) was used to acquire all spectra, and the
software NMRView (Johnson and Blevins, 1994; available at http://onemoon-
scientific.com/nmrview) was used to quantify nonoverlapping multiplets on
the HSQC spectrum. To quantify overlapping multiplets (a-amino acid and
LVA peaks), which could not be processed with NMRView, a peak deconvo-
lution software was written. This software was based on a spectral model
proposed by van Winden et al. (2001). Additionally, 2-D spectra were obtained
that were J-scaled along the F1 dimension, by incorporating pulse sequences
described by Willker et al. (1997) and Brown (1984) into the HSQC pulse
sequence. J-scaling increases multiplet separation by an even integral factor J
and eliminates multiplet overlap. J-scaling factors of 6 or 8 were employed.
We verified that the [13C, 1H] experiment employed by us (and the
subsequent spectral analysis) can accurately measure isotopomer abundances,
by performing it on two samples containing known quantities of three
commercial isotopomers of Ala (a representative amino acid). Details are
provided in Supplemental Material III.
Flux Evaluation Methodology and Computer Program
Fluxes were evaluated from isotopomer data by using isotopomer balanc-
ing and a global routine. The objective of this flux evaluation procedure is to
evaluate a set of stoichiometrically feasible fluxes (per the metabolic network
supplied by the user) that best accounts for the measured isotopomer
abundances and extracellular flux measurements. Furthermore, uniqueness
of the evaluated flux solution was ensured and statistical analysis was
performed. The computer program that evaluates fluxes, NMR2Flux, is
implemented in the programming language C, on the Red Hat Linux
operating system. All mathematical and computational details are presented
in Supplemental Material IV to VI.
Upon request, all novel materials described in this paper (flux evaluation
program NMR2Flux, modified NMR pulse sequences, and peak deconvolu-
tion software) will be made available in a timely manner for noncommercial
research purposes, subject to the requisite permission from any third-party
owners of all or parts of the material. Obtaining any permissions will be the
responsibility of the requestor.
ACKNOWLEDGMENTS
We thank Dr. Eve Wurtele (Department of Botany, Iowa State University)
for helpful discussions on this work and for her comments on the manuscript,
Dr. Amy Andreotti (Department of Biochemistry, Biophysics and Molecular
Biology, Iowa State University) for a gift of 100% 13C-labeled protein, Dr.
Louisa B. Tabatabai (Department of Biochemistry, Biophysics and Molecular
Biology, Iowa State University) for consultations on protein hydrolysis, and
Curtis C. Clifton (Department of Computer Science, Iowa State University)
for useful information on UML (Universal Modeling Language).
Received July 26, 2004; returned for revision August 6, 2004; accepted August
6, 2004.
LITERATURE CITED
Bacher A, Rieder C, Eichinger D, Arigoni D, Fuchs G, Eisenreich W (1999)
Elucidation of novel biosynthetic pathways and metabolite flux patterns
by retrobiosynthetic NMR analysis. FEMS Microbiol Rev 22: 567–598
Baldwin TC, Handford MG, Yuseff MI, Orellana A, Dupree P (2001)
Identification and characterization of GONST1: a golgi-localized GDP-
mannose transporter in Arabidopsis. Plant Cell 13: 2283–2295
Bernacchia G, Schwall G, Lottspeich F, Salamini F, Bartels D (1995) The
transketolase gene family of the resurrection plant Craterostigma Plan-
tagineum: differential expression during rehydration phase. EMBO J 14:
610–618
Bewley JD, Black M (1994) Seeds: germination, structure and composition.
In JD Bewley, M Black, eds, Seeds: Physiology of Development and
Germination. Plenum Press, New York
Bodenhausen G, Ruben DJ (1980) Natural abundance nitrogen-15 NMR by
enhanced heteronuclear spectroscopy. Chem Phys Lett 69: 185–189
Bourguignon J, Rebeille F, Douce R (1999) Serine and glycine metabolism
in higher plants. In BK Singh, ed, Plant Amino Acids: Biochemistry and
Biotechnology. Marcel Dekker, New York
Braunschweiler L, Ernst RR (1983) Correlation transfer by isotropic
mixing: application to proton correlation spectroscopy. J Magn Reson
53: 521–528
Breitkreuz KE, Shelp B (1995) Subcellular compartmentation of the
g-aminobutyrate shunt in protoplasts from developing soybean cotyle-
dons. Plant Physiol 108: 99–103
Brown LR (1984) Differential scaling along v1 in COSY experiments. J Magn
Reson 57: 513–518
Casati P, Drincovich MF, Edwards GE, Andreo CS (1999) Malate metab-
olism by NADP-malic enzyme in plant defense. Phytosynth Res 61:
99–105
Cavanagh J, Fairbrother WJ, Palmer AG, Skelton NJ (1996) Protein NMR
Spectroscopy: Principles and Practice. Academic Press, San Diego
Chao WS, Liu V, Thomson WW, Platt K, Walling LL (1995) The impact of
chlorophyll-retention mutations d7d2 and cyt-G7: during embryogeny
in soybean. Plant Physiol 107: 253–262
Chollet R, Vidal J, O’Leary MH (1996) Phosphoenolpyruvate carboxylase:
a ubiquitous highly regulated enzyme in plants. Annu Rev Plant Physiol
Plant Mol Biol 47: 273–298
Coates SW, Gurney T, Sommers LW, Yeh M, Hirschberg CB (1980)
Subcellular localization of sugar nucleotide synthases. J Biol Chem
255: 9225–9229
Debnam PM, Emes MJ (1999) Subcellular distribution of the enzymes of
the oxidative pentose phosphate pathway in root and leaf tissues. J Exp
Bot 340: 1653–1661
DeyPM,Harborne JB (1997) Plant Biochemistry. Academic Press, San Diego
Dieuaide-Noubhani M, Raffard G, Canioni P, Pradet A, Raymond P
(1995) Quantification of compartmented metabolic fluxes in maize root
tips using isotope distribution from 13C- or 14C-labeled glucose. J Biol
Chem 22: 13147–13159
Doyle JJ, Schuler MA, Godette WD, Zenger V, Beachy RN (1986) The
glycosylated seed storage proteins of Glycine max and Phaseolus vulgaris.
J Biol Chem 261: 9228–9238
Drincovich MF, Casati P, Andreo CS (2001) NADP-malic enzyme from
plants: a ubiquitous enzyme involved in different metabolic pathways.
FEBS Lett 490: 1–6
Eastmond PJ, Rawsthorne S (1998) Comparison of the metabolic properties
of plastids isolated from developing leaves or embryos of Brassica napus.
J Exp Bot 49: 1105–1111
Eicks M, Maurino V, Knappe S, Flugge UI, Fischer K (2002) The plastidic
pentose phosphate translocator represents a link between the cytosolic
and the plastidic pentose phosphate pathways in plants. Plant Physiol
128: 512–522
Entwistle G, ap Rees TA (1990) Lack of fructose-1:6-bisphosphatase in
a range of higher plants that store starch. Biochem J 271: 467–472
Esposito S, Massaro G, Vona V, Di Martino Rigano V, Carfagna S (2003)
Glutamate synthesis in barley roots: the role of plastidic glucose-6-
phosphate dehydrogenase. Planta 216: 637–647
Faik A, Desveaux D, Maclachlan G (2000) Sugar-nucleotide binding and
autoglycosylating polypeptides from nasturtium fruit: biochemical
capacities and potential functions. Biochem J 347: 857–864
Fischer K, Kammerer B, Gutensohn M, Arbinger B, Weber A, Hausler RE,
Flugge UI (1997) A new class of plastidic phosphate translocators:
Sriram et al.
3056 Plant Physiol. Vol. 136, 2004 www.plantphysiol.orgon July 4, 2018 - Published by Downloaded from
Copyright © 2004 American Society of Plant Biologists. All rights reserved.

a putative link between primary and secondary metabolism by the
phosphoenolpyruvate/phosphate antiporter. Plant Cell 9: 453–462
Girke T, Ozkan M, Carter D, Raikhel NV (2003) Towards a modeling
infrastructure for studying plant cells. Plant Physiol 132: 410–414
Glawischnig E, Gierl A, Tomas A, Bacher A, Eisenreich W (2001)
Retrobiosynthetic nuclear magnetic resonance analysis of amino acid
biosynthesis and intermediary metabolism: metabolic flux in develop-
ing maize kernels. Plant Physiol 125: 1178–1186
Glawischnig E, Gierl A, Tomas A, Bacher A, Eisenreich W (2002) Starch
biosynthesis and intermediary metabolism in maize kernels: quantita-
tive analysis of metabolite flux by nuclear magnetic resonance. Plant
Physiol 130: 1717–1727
Glawischnig E, Tomas A, Eisenreich W, Spiteller P, Bacher A, Gierl A
(2000) Auxin biosynthesis in maize kernels. Plant Physiol 123: 1109–1119
Hanson AD, Shanks JV (2002) Plant metabolic engineering: entering the S
curve. Metab Eng 4: 1–2
Harris RK (1983) Nuclear Magnetic Resonance Spectroscopy: A Physio-
chemical View. Pitman Books, London
Hauschild R, von Schaewen A (2003) Differential regulation of glucose-6-
phosphate dehydrogenase isoenzyme activities in potato. Plant Physiol
133: 47–62
Hermann KM, Weaver LM (1999) The shikimate pathway. Annu Rev Plant
Physiol Plant Mol Biol 50: 473–503
Ireland RJ, Dennis DT (1980) Isozymes of the glycolytic and pentose-
phosphate pathways in storage tissues of different oilseeds. Planta 149:
476–479
Ireland RJ, Lea PJ (1999) The enzymes of glutamine glutamate asparagines
and aspartate metabolism. In BK Singh, ed, Plant Amino Acids: Bio-
chemistry and Biotechnology. Marcel Dekker, New York
Isermann N, Wiechert W (2003) Metabolic isotopomer labeling systems.
Part II: structural flux identifiability analysis. Math Biosci 183: 175–214
Jeanneau M, Vidal J, Gousset-Dupont A, Lebouteiller B, Hodges M,
Gerentes D, Perez P (2002) Manipulating PEPC levels in plants. J Exp
Bot 53: 1837–1845
Johnson BA, Blevins RA (1994) NMRView: a computer program for the
visualization and analysis of NMR data. J Biomol NMR 4: 603–614
Katagiri F (2003) Attacking complex problems with the power of systems
biology. Plant Physiol 132: 417–419
KEGG (2004) KEGG. Kyoto Encyclopedia of Genes and Genomes. http://
www.genome.ad.jp/kegg (September 17, 2004)
Keeling PL (1991) The pathway and compartmentation of starch synthesis
in developing wheat grain. In MJ Emes, ed, Compartmentation of Plant
Metabolism in Non-Photosynthetic Tissues. Cambridge University
Press, Cambridge, UK
Krivdin LB, Kalabin GA (1989) Structural applications of one-bond
carbon-carbon coupling constants. Prog Nucl Mag Res Spectroscopy
21: 293–448
Krook J, Vreugdenhil D, Dijkema C, van der Plas LHW (1998) Sucrose and
starch metabolism in carrot (Daucus carota) cell suspensions analyzed by13C labeling: indications for a cytosol and a plastid-localized oxidative
pentose phosphate pathway. J Exp Bot 49: 1917–1924
Kruger NJ, von Schaewen A (2003) The oxidative pentose phosphate
pathway: structure and organization. Curr Opin Plant Biol 6: 236–246
Lam HM, Coschigani KT, Oliviera IC, Melo-Oliviera R, Coruzzi GM
(1996) The molecular-genetics of nitrogen assimilation into amino acids
in higher plants. Annu Rev Plant Physiol Plant Mol Biol 47: 569–593
Lea PJ, Leegood RC (1999) Plant Biochemistry and Molecular Biology, Ed 2.
John Wiley & Sons, Chichester, UK
Lichtner FT, Spanswick RM (1981) Sucrose uptake by developing soybean
cotyledons. Plant Physiol 68: 693–698
Press WH, Teukolsky SA, Vetterling WT, Flannery BP (1992) Numerical
Recipes in C: The Art of Scientific Computing, Ed 2. Cambridge
University Press, Cambridge, UK
Raikhel NV, Coruzzi GM (2003) Plant Systems Biology. Plant Physiol
132: 403
Ratcliffe RG, Shachar-Hill Y (2001) Probing plant metabolism with NMR.
Annu Rev Plant Physiol Plant Mol Biol 52: 499–526
Reynolds SJ, Smith SM (1995) The isocitrate lyase gene of cucumber:
isolation characterization and expression in cotyledons following seed
germination. Plant Mol Biol 27: 487–497
Rontein D, Dieuaide-Noubhani M, Dufourc EJ, Raymond P, Rolin D
(2002) The metabolic architecture of plant cells: stability of central
metabolism and flexibility of anabolic pathways during the growth
cycle of tomato cells. J Biol Chem 277: 43948–43960
Roscher A, Kruger NJ, Ratcliffe RG (2000) Strategies for metabolic flux
analysis in plants using isotope labeling. J Biotechnol 77: 81–102
Saravitz CH, Raper CJ (1995) Responses to sucrose and glutamine by
soybean embryos grown in vitro. Physiol Plant 93: 799–805
Sauer U (2004) High-throughput phenomics: experimental methods for
mapping fluxomes. Curr Opin Biotechnol 15: 58–63
Schmidt K, Nørregaard C, Pedersen B, Meisner A, Duus JØ, Nielsen JØ,
Villadsen J (1999) Quantification of intracellular metabolic fluxes from
fractional enrichment and 13C-13C coupling constraints on the isotop-
omer distribution in labeled biomass components. Metab Eng 1: 166–179
Schwender J, Ohlrogge JB (2002) Probing in vivo metabolism by stable
isotope labeling of storage lipids and proteins in developing Brassica
napus embryos. Plant Physiol 130: 347–361
Schwender J, Ohlrogge JB, Shachar-Hill Y (2003) A flux model of
glycolysis and the oxidative pentosephosphate pathway in developing
Brassica napus embryos. J Biol Chem 278: 29442–29453
Shachar-Hill Y (2002) Nuclear magnetic resonance and plant metabolic
engineering. Metab Eng 4: 90–97
Shaka AJ, Lee CJ, Pines A (1988) Iterative schemes for bilinear operators:
applications to spin decoupling. J Magn Reson 77: 274–293
Singh BK (1999) Biosynthesis of valine leucine and isoleucine. In BK Singh,
ed, Plant Amino Acids: Biochemistry and Biotechnology. Marcel
Dekker, New York
Soybase (2004) Soybase. National Center for Genome Resources. http://
soybase.ncgr.org (September 17, 2004)
Sriram G, Shanks JV (2001) A mathematical model for carbon bond
labeling experiments: analytical solutions and sensitivity analysis for
the effect of reaction reversibilities on estimated fluxes. In LE Erickson,
ed, Proceedings of the 31st Annual Biochemical Engineering Sympo-
sium, September 8, 2001, Manhattan, KS, pp 45–54
Sriram G, Shanks JV (2004) Improvements in metabolic flux analysis using
carbon labeling experiments: bondomer balancing and Boolean function
mapping. Metab Eng 6: 116–132
Stephanopoulos G (1999) Metabolic fluxes and metabolic engineering.
Metab Eng 1: 1–12
Stephanopoulos G (2002) Metabolic engineering: perspective of a chemical
engineer. AIChE J 48: 920–926
Streatfield SJ, Weber A, Kinsman EA, Hausler RE, Li J, Post-Beittenmiller
D, Kaiser WM, Pyke KA, Flugge UI, Chory J (1999) The phosphoenol-
pyruvate/phosphate translocator is required for phenolic metabolism
palisade cell development and plastid-dependent nuclear gene expres-
sion. Plant Cell 11: 1609–1621
Sweetlove LJ, Last RL, Fernie AD (2003) Predictive metabolic engineering:
a goal for systems biology. Plant Physiol 132: 420–425
Szyperski T (1995) Biosynthetically directed fractional 13C-labeling of
proteinogenic amino acids. Eur J Biochem 232: 433–448
Szyperski T (1998) 13C NMR, MS and metabolic flux balancing in bio-
technology research. Q Rev Biophys 31: 41–106
van Winden W, Schipper D, Verheijen P, Heijnen J (2001) Innovations in
generation and analysis of 2D [13C, 1H] COSY NMR spectra for
metabolic flux analysis purposes. Metab Eng 3: 322–343
Wheeler GL, Jones MA, Smirnoff N (1998) The biosynthetic pathway of
vitamin C in higher plants. Nature 393: 365–369
Wiechert W (2001) 13C metabolic flux analysis. Metab Eng 3: 195–206
Wiechert W, Mollney M, Isermann N, Murzel M, de Graaf AA (1999)
Bidirectional reaction steps in metabolic networks: III. Explicit solution
and analysis of isotopomer labeling systems. Biotechnol Bioeng 66:
69–85
Wiechert W, Murzel M (2001) Metabolic isotopomer labeling systems, Part
I: global dynamic behavior. Math Biosci 169: 173–205
Willker W, Flogel U, Leibfritz D (1997) Ultra-high-resolved HSQC spectra
of multiple-13C-labeled biofluids. J Magn Reson 125: 216–219
Wuthrich K (1976) NMR in Biological Research: Peptides and Proteins.
North Holland, Amsterdam
Yamauchi F, Yamagishi T (1979) Carbohydrate sequence of a soybean 7S
protein. Agric Biol Chem 43: 505–510
Metabolic Flux Evaluation in Soybean Embryos
Plant Physiol. Vol. 136, 2004 3057 www.plantphysiol.orgon July 4, 2018 - Published by Downloaded from
Copyright © 2004 American Society of Plant Biologists. All rights reserved.

CORRECTIONS
Vol. 136: 3043–3057, 2004
Sriram G., Fulton D.B., Iyer V.V., Peterson J.M., Zhou R., Westgate M.E., Spalding M.H., andShanks J.V. Quantification of Compartmented Metabolic Fluxes in Developing Soybean Em-bryos by Employing Biosynthetically Directed Fractional 13C Labeling, Two-Dimensional[13C,1H] Nuclear Magnetic Resonance, and Comprehensive Isotopomer Balancing.
The authors regret two errors in this article. All absolute fluxes reported in mmol d21
cotyledon21 (in Fig. 6 and text) should be multiplied by the integer 3. This error occurredbecause the combined dry weight for three cotyledons (instead of that for a single coty-ledon) was used while converting relative fluxes output by the program NMR2Flux toabsolute fluxes. The relative fluxes (reported in carbon mol per 100 carbon mol of Sucuptake) and reaction reversibilities (reported in %) remain unchanged. None of the inter-pretations of data or conclusions in this article are altered by this error since they werebased on relative flux values.
The minor hexose hydrolysis product referred to as ‘‘5-hydroxymethyl furfural’’ (HMF; p.3045) should be ‘‘hydroxyacetone’’ (HyA). This error also does not affect any of the results,conclusions, or interpretations of the data in the article.
Vol. 141: 898–909, 2006
Gruis D., Guo H., Selinger D., Tian Q., and Olsen O.-A. Surface Position, Not Signaling fromSurrounding Maternal Tissues, Specifies Aleurone Epidermal Cell Fate in Maize.
The authors regret that in the ‘‘Materials and Methods’’ section of this article, under theheading ‘‘Initiation and Growth of in Vitro Endosperm Cultures,’’ the amount of Suc inthe growth medium is incorrectly stated as 10-fold lower than the correct concentration.The correct value is 150 g/L Suc.
Plant Physiology, December 2006, Vol. 142, p. 1771, www.plantphysiol.org � 2006 American Society of Plant Biologists 1771