Quality-Relevant Process Monitoring S. Joe Qin Department of Chemical Engineering and Material...
17
Quality-Relevant Process Monitoring S. Joe Qin Department of Chemical Engineering and Material Sciences Department of Electrical Engineering University Southern California Los Angeles, CA, U.S.A. [email protected] Nov. 7-12, 2010, Salt Lake City, UT
-
Upload
rudolf-carpenter -
Category
Documents
-
view
215 -
download
1
Transcript of Quality-Relevant Process Monitoring S. Joe Qin Department of Chemical Engineering and Material...
Quality-Relevant Process Monitoring
S. Joe Qin
Department of Chemical Engineering and Material Sciences
Department of Electrical EngineeringUniversity Southern California
Los Angeles, CA, [email protected]
Nov. 7-12, 2010, Salt Lake City, UT
USC - 2 © S. Joe Qin
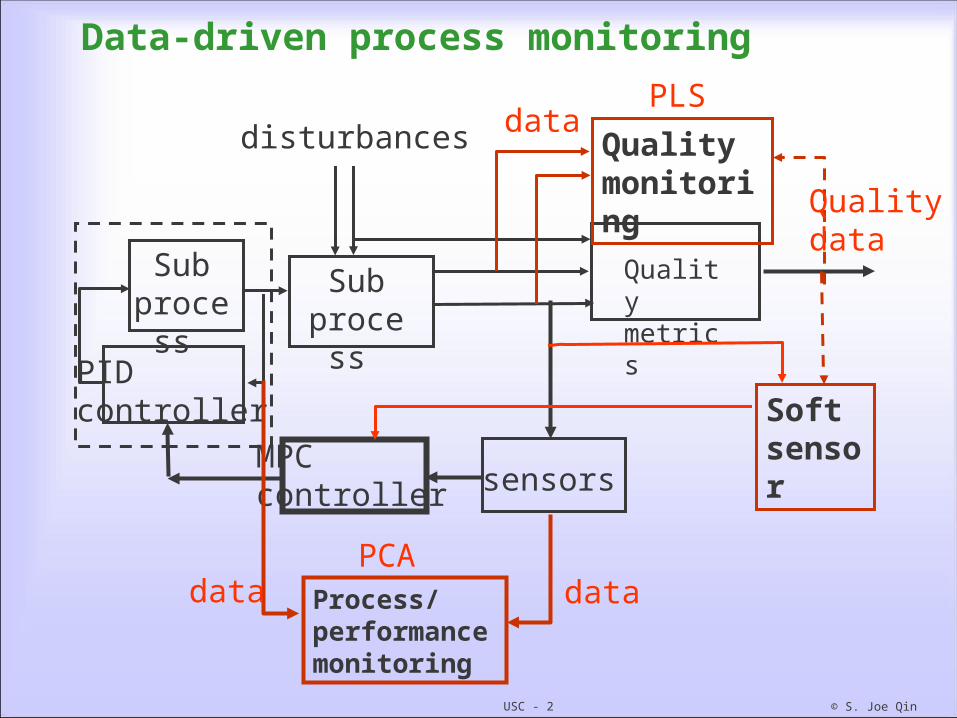
Data-driven process monitoring
sensorsMPCcontroller
Subprocess
Qualitymetrics
disturbances
PIDcontroller
Subprocess
Process/ performancemonitoring
datadataPCA
Quality monitoring
data
Quality data
PLS
Soft sensor
USC - 3 © S. Joe Qin
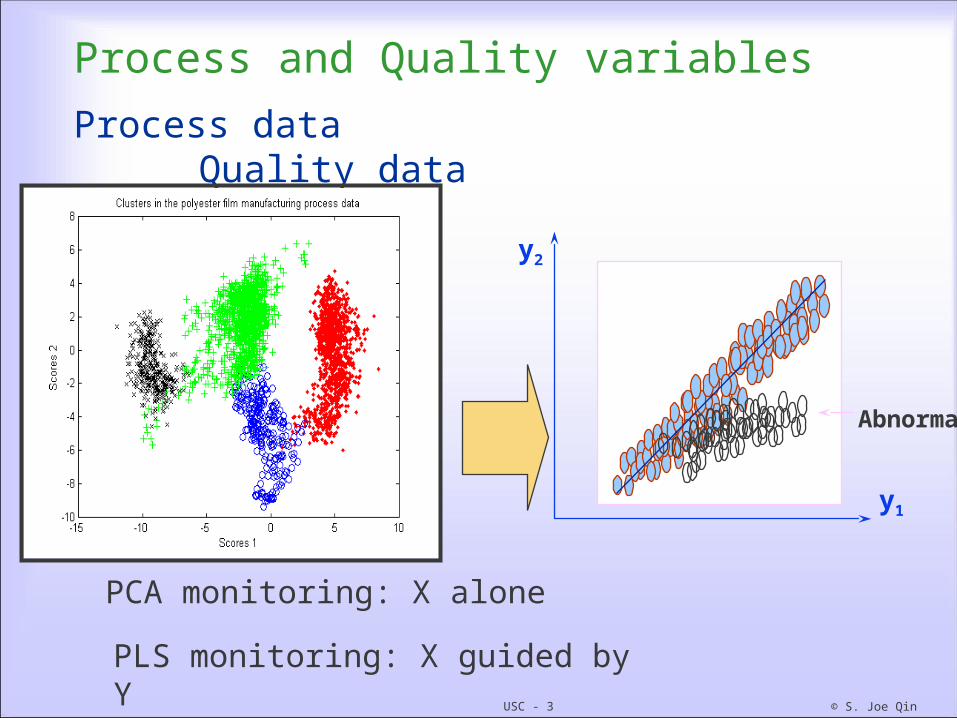
Process and Quality variables
Process data Quality data
y2
y1
Abnormal
PCA monitoring: X alone
PLS monitoring: X guided by Y
USC - 4 © S. Joe Qin
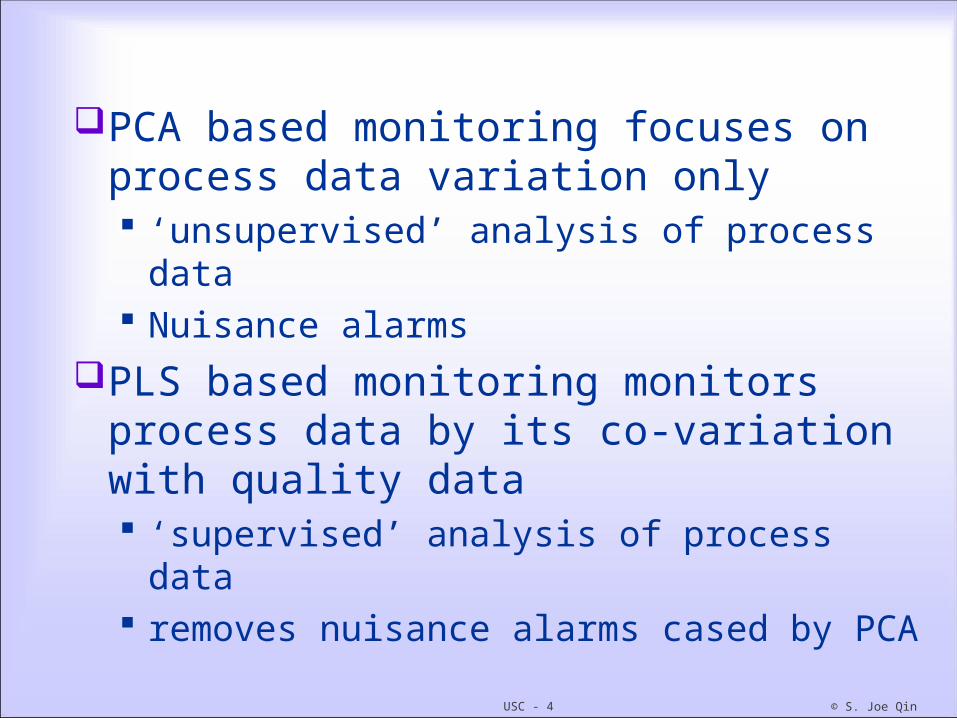
PCA based monitoring focuses on process data variation only ‘unsupervised’ analysis of process data Nuisance alarms
PLS based monitoring monitors process data by its co-variation with quality data ‘supervised’ analysis of process data removes nuisance alarms cased by PCA
USC - 5 © S. Joe Qin
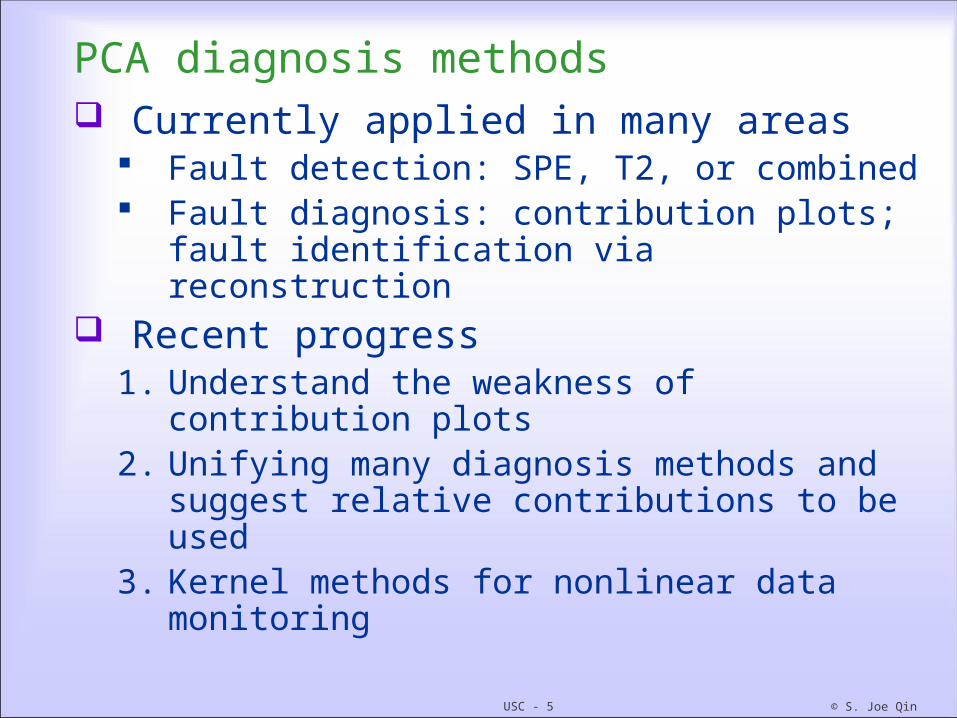
PCA diagnosis methods Currently applied in many areas
Fault detection: SPE, T2, or combined Fault diagnosis: contribution plots;
fault identification via reconstruction Recent progress
1. Understand the weakness of contribution plots
2. Unifying many diagnosis methods and suggest relative contributions to be used
3. Kernel methods for nonlinear data monitoring

USC - 6 © S. Joe Qin
Unifying many diagnosis methods
Carlos Alcala and S. Joe Qin (2010). Analysis and Generalization of Fault Diagnosis Methods for Process Monitoring. Revised for J. of Process Control. (Special Issue in honor of T.J. McAvoy)
Most contribution plot methods do not have statistically equal contributions when no fault is present
Suggest relative contributions which posses this property

USC - 7 © S. Joe Qin
Nonlinear, Kernel PCA methods C. Alcala and S.J. Qin (2010). Reconstruction-
based Contribution for Process Monitoring with Kernel Principal Component Analysis, to appear in I&EC Research. (Special Issue in honor of T.F. Edgar)

USC - 8 © S. Joe Qin
PLS: Impact of Y on X-space Decomposition
PLS partition of X, depending on whether Y lines up with the major X directions or not
PCA directions PLS directions
p1 p2

USC - 9 © S. Joe Qin
PCA-like, Unsupervised Monitoring
Pros: plenty of process data, easy to use given normal data
Cons: need normal data to define ‘normal’
Cons: out-of-control in process data does not always point to a ‘quality’ problem
Cons: Measured variables being normal does not guarantee the quality is normal because of unmeasured contributors to quality Example:
USC - 10 © S. Joe Qin
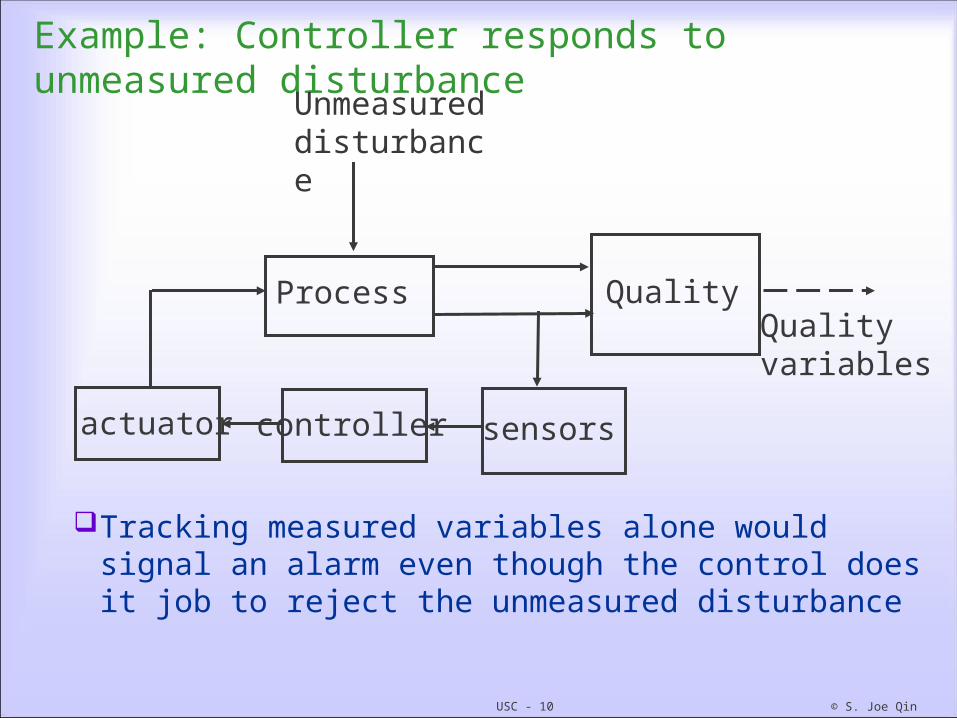
Example: Controller responds to unmeasured disturbance
Tracking measured variables alone would signal an alarm even though the control does it job to reject the unmeasured disturbance
sensors
Process
controlleractuator
Quality Quality variables
Unmeasured disturbance

USC - 11 © S. Joe Qin
PLS-Based Process Monitoring
PLS-based monitoring uses quality data Y to guide the partition of process data X, which is different from PCA partition of X-space
Impact of Y on the structural modeling of X-space PLS is the de facto method for modeling X and
Y PLS factors and residuals are interpreted in the
same way as PCA factors and residuals Lack of understanding of the impact of Y on the
decomposition of X-space

USC - 12 © S. Joe Qin
Recent work
Gang Li, S. Joe Qin, and Donghua Zhou (2008). Geometric properties of partial least squares for process monitoring, submitted to Automatica. Gives a fairly thorough understanding of X-space
decomposition guided by Y Donghua Zhou, Gang Li, and S. Joe Qin (2008).
Total projection to latent structures for process monitoring, accepted by AIChE Journal. PCA-like interpretation of PLS partition is not adequate.
Additional projections (i.e., total projection) are necessary
Gang Li, S. Joe Qin, Yindong Ji, and Donghua Zhou (2008). Total PLS based contribution plots for fault diagnosis, revised for Acta Automatica Sinica.

USC - 13 © S. Joe Qin
PCA vs. PLS for monitoring
PCA model PLS model
PCA projection PLS projection
PCA monitoring PLS monitoring
PLS residual not always ‘small’
PLS scores not all related to Y
PLS residual ‘faults’ can affect Y
P=R
T=XP
USC - 14 © S. Joe Qin
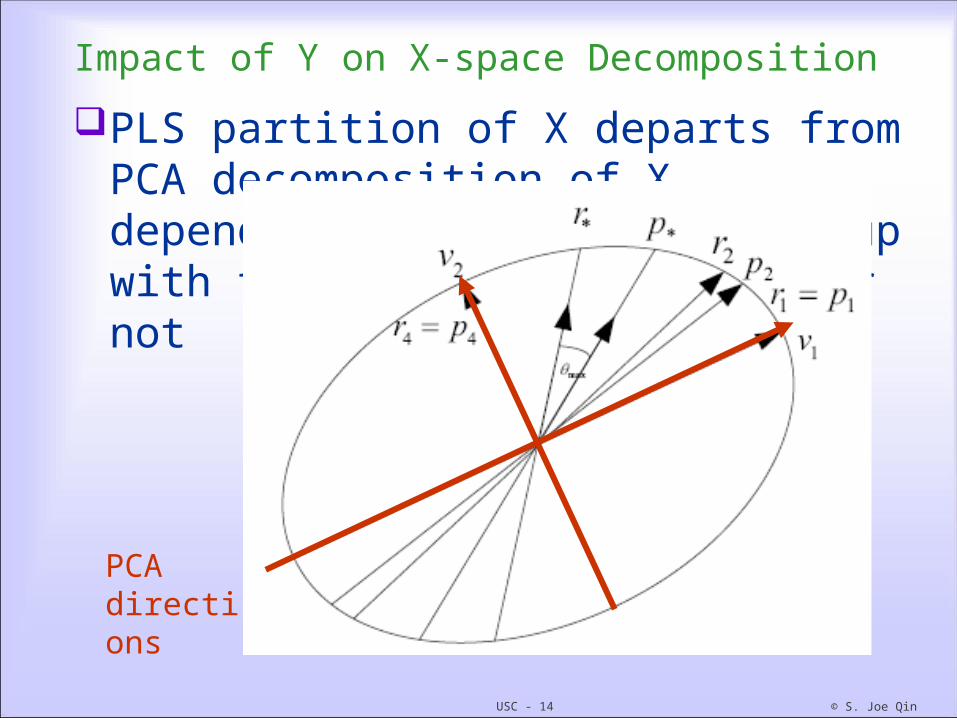
Impact of Y on X-space Decomposition
PLS partition of X departs from PCA decomposition of X, depending on whether Y lines up with the major X directions or not
PCAdirections
USC - 15 © S. Joe Qin
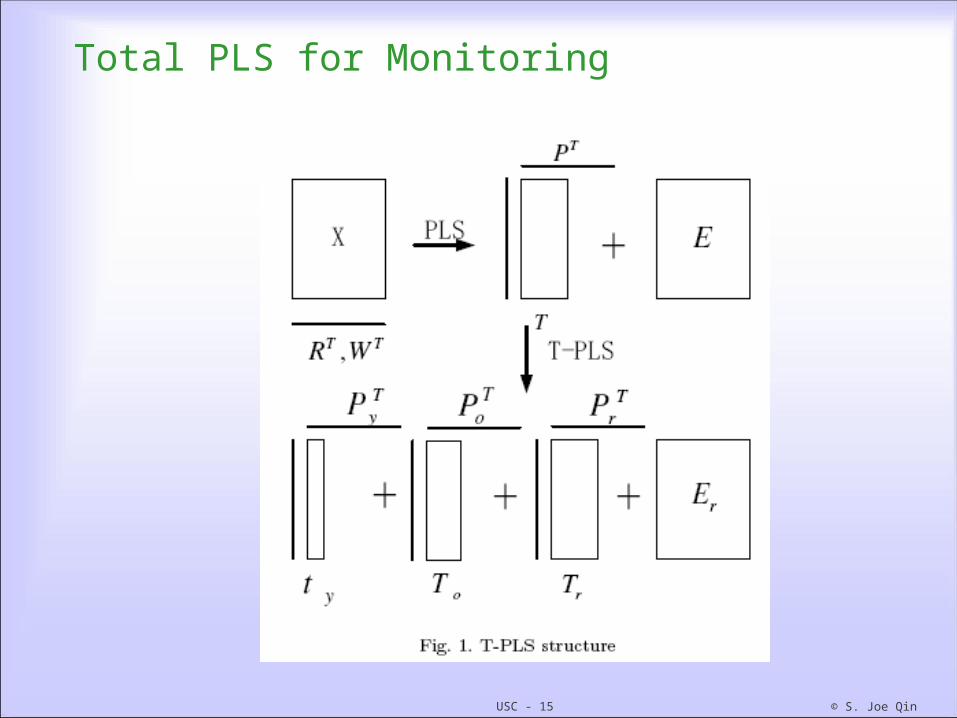
Total PLS for Monitoring
USC - 16 © S. Joe Qin
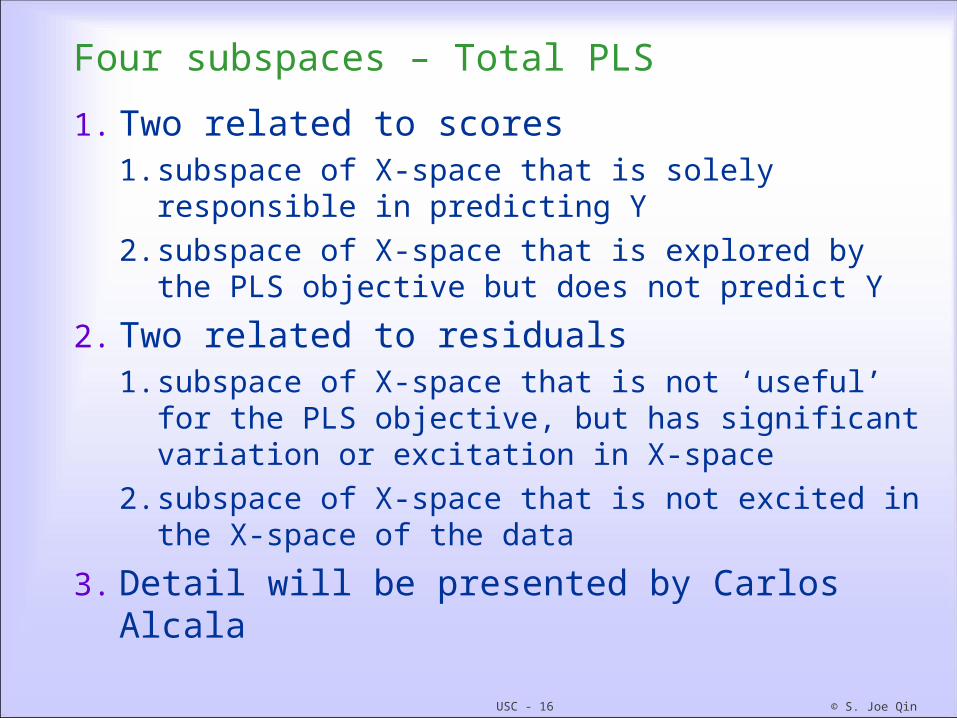
Four subspaces – Total PLS
1. Two related to scores1. subspace of X-space that is solely responsible
in predicting Y2. subspace of X-space that is explored by the
PLS objective but does not predict Y
2. Two related to residuals1. subspace of X-space that is not ‘useful’ for the
PLS objective, but has significant variation or excitation in X-space
2. subspace of X-space that is not excited in the X-space of the data
3. Detail will be presented by Carlos Alcala
USC - 17 © S. Joe Qin
PLS-based monitoring papers Gang Li, S. Joe Qin, and Donghua Zhou
(2010). Geometric properties of partial least squares for process monitoring, Automatica, 46, 204-210.
Donghua Zhou, Gang Li, and S. Joe Qin (2010). Total projection to latent structures for process monitoring, AIChE Journal, 56, 168-178.
Gang Li, S. Joe Qin, and Donghua Zhou (2010). Output relevant fault reconstruction and fault subspace extraction in Total PLS models. Accepted by I&EC Research.