
Quality Prediction for Component-Based Software Development: Techniques and A Generic Environment...
71
Quality Prediction for Component-Based Software Development: Techniques and A Generic Environment Presented by: Cai Xia Supervisor: Prof. Michael Lyu Examiners: Prof. Ada Fu Prof.
-
date post
20-Dec-2015 -
Category
Documents
-
view
216 -
download
0
Transcript of Quality Prediction for Component-Based Software Development: Techniques and A Generic Environment...

Quality Prediction for Component-Based Software Development: Techniques and A Generic Environment
Presented by: Cai XiaSupervisor: Prof. Michael Lyu Examiners: Prof. Ada Fu Prof. K.F. Wong
Dec. 17, 2001

2
Outline
Introduction Technical Background and Related Work A Quality Assurance Model for CBSD A Generic Quality Assessment
Environment: ComPARE Experiment and Discussion Conclusion

3
Introduction
The most promising solution for large-scale, complex and uneasily controlled modern software system is component-based software development (CBSD) approach
The concept, process, life cycle and infrastructure of CBSD are different from traditional systems
Quality Assurance (QA) is very important for component-based software systems

4
Introduction Component-based software development
(CBSD) is to build software systems using a combination of components
CBSD aims to encapsulate function in large components that have loose couplings.
A component is a unit of independent deployment in CBSD.
The over quality of the final system greatly depends on the quality of the selected components.

5
What is Component-Based Software Development ?
Component repository
Component 1
Component 2
Component n
Software systems
select assemble
...
Commercial Off-the-shelf (COTS) components

6
What is A Component?
A component is an independent and replaceable part of a system that fulfills a clear function A component works in the context of a well-defined architecture It communicates with other components by the interfaces

7
System Architecture
Special business components
Common components
Basic components
App2App1
App3Application
Layer
Components Layer

8
Problem Statement
Due to the special feature of CBSD, conventional SQA techniques and methods are uncertain to apply to CBSD.
We address the investigation of most efficient and effective approach suitable to CBSD

9
Our Contributions A QA model for CBSD which covers
eight main processes. A quality assessment environment
(ComPARE) to evaluate the quality of components and software systems in CBSD.
Experiments on applying and comparing different quality predicted techniques to some CBSD programs.

10
Outline
Introduction Technical Background and Related Work A Quality Assurance Model for CBSD A Generic Quality Assessment
Environment: ComPARE Experiment and Discussion Conclusion

11
Technical Background and Related Work:
Development Frameworks
A framework can be defined as a set of constraints on components and their interactions, and a set of benefits that derive from those constraints.
Three somehow standardized component frameworks: CORBA, COM/DCOM, JavaBeans/EJB.

12
Comparison of Component Frameworks
CORBA EJB COM/DCOM
Development environment
Underdeveloped
Emerging
Supported by a wide range of strong development environments
Binary interfacing standard
Not binary standards Based on COM; Java specific
A binary standard for component interaction is the heart of COM
Compatibility & portability
Strong in standardizing language bindings; but not so portable
Portable by Java language spec; but not very compatible.
Not having any concept of source-level standard of standard language binding.
Modification & maintenance
CORBA IDL for defining component interfaces
Not involving IDL files
Microsoft IDL for defining component interfaces
Services provided
A full set of standardized services; lack of implementations
Neither standardized nor implemented
Recently supplemented by a number of key services
Platform dependency
Platform independent Platform independent Platform dependent
Language dependency
Language independent Language dependent Language independent
Implementation
Strongest for traditional enterprise computing
Strongest on general Web clients.
Strongest on the traditional desktop applications

13
Technical Background and Related Work:
QA Issues How to certify quality of a
component?o Sizeo complexityo reuse frequencyo reliability
How to certify quality of a
component-based software system?

14
Life Cycle of A Component
reject affirmed for affirmed for new construction delivery
new release of change proposal component library
delete mark for deletion
Proposal UnderConstruction
Ready forDistribution
To be deleted(do not use )
Under use
15
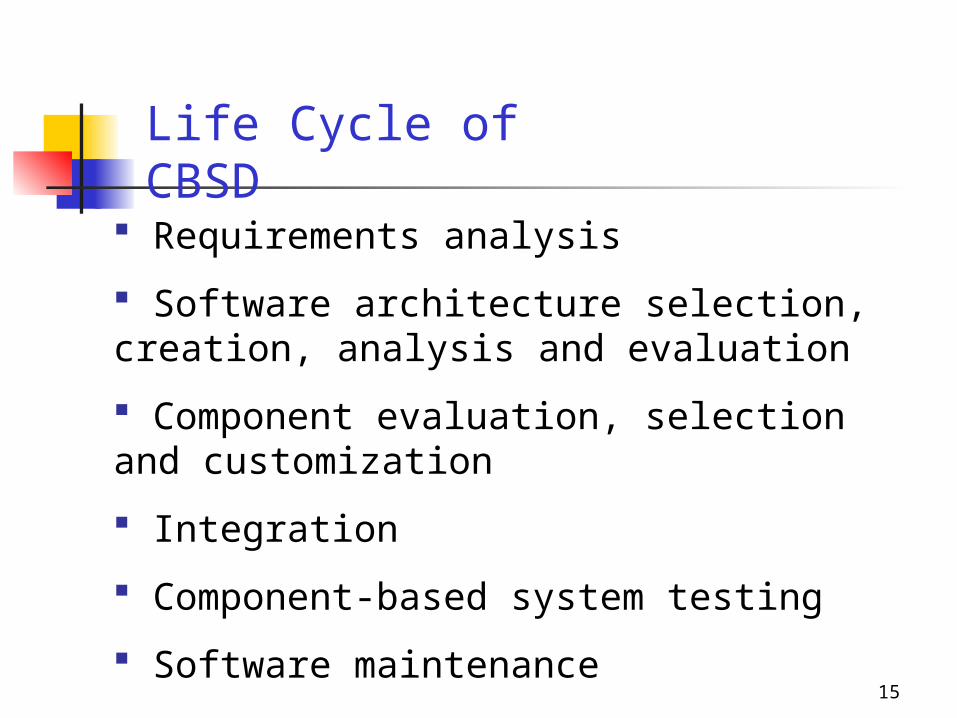
Requirements analysis
Software architecture selection, creation, analysis and evaluation
Component evaluation, selection and customization
Integration
Component-based system testing
Software maintenance
Life Cycle of CBSD

16
Case-Based Reasoning Classfication Tree Model Bayesian Belief Network Discriminant Analysis Pattern recoginition
Technical Background and Related Work:
Quality Prediction Techniques

17
Outline
Introduction Technical Background and Related Work A Quality Assurance Model for CBSD A Generic Quality Assessment
Environment: ComPARE Experiment and Discussion Conclusion

18
A QA Model for CBSD Component System
QualityAssuranceModel
ComponentSystem

19
Main Practices
Requirement Analysis
Component
Architecture Design
System
Component Development
Component Certification
Component Customization
System Integration
System Testing
System Maintenance

20
RequirementsGathering andDefinition
RequirementAnalysis
ComponentModeling
RequirementValidation
ComponentDevelopment
SystemMaintenance
Draft User Requirement Documentation (URD)
Format &Structure
Component Requirement Document (CRD)
Updated CRD with model included
Current URD User Requirement Changes
DataDictionary
Structure fornaming &Describing
CurrentURD
RequirementDocumentTemplate
Request for new development or change
Initiators (Users, Customers,Manager etc.)
Process Overview:
Component Requirement Analysis

21
Developers
Implementation
Self-Testing (Function)
Self-Testing ( Reliability)
Development Document
Component Certification
System Maintenance
Techniques required
Draft Component
Requirements
Well-Functional Component
Reliable Component
Submit For Reference
ExistingFault
Component Requirement
Document
Process Overview:
Component Development

22
System Requirements
Component Outsourcing
Component Testing
Component Selecting
Acceptance System Maintenance
Specific Component Requirements
Component Released
Component Functions
Well-Functional Component
Component fit for the special requirements
Contract Signoffs, Payments
Reject
Component Development
Document
Process Overview:
Component Certification

23
System Requirements & Other Component Requirements
Component Customization
Component Document
Component Testing
Acceptance System Maintenance
on
Specific System & Other Component Requirements
Component Changed
Component Document
New Component Document
Component fit for the special requirements
Component Document
Reject
Component Development
Document
System Integration Assemble
Process Overview:
Component Customization

24
Initiators
System Requirement Gathering
System Requirement Analysis
System Architecture Design
System Specification
System Integration
Requests for New Systems
Draft System Requirements Document
Format & Structure Document
System Requirement Document
System Architecure
System Specification Document
Current Document
Requirement Document Template
System Testing System
Requirement
System Maintenance
Process Overview:
System Architecture Design

25
System Requirement
System Integration
Self-Testing
Component Changing
Final System
System Maintenance
Requirements for New Systems
Draft System
Architecture
Fault Component
Selecting New Component
System Integration Document
Current Component
System Architecture
System Testing Final System
Component Certification
Component Requirement
Process Overview:
System Integration

26
System Design Document
Testing Strategy
System Testing
User Acceptance Testing
Test Completion Activities
System Maintenance
Testing Requirements
System Testing Plan
Test Dependencies
System Tested
User Accepted System
System Integration Document
System Maintenance
(Previous Software Life
Cycle)
Component Development
Component Document
System Integration
Component Document
System Test Spec.
User Acceptance Test Spec.
Process Overview:
System Testing

27
Users
Support Strategy
Problem Management
System Maintenance
Request and Problem Reports
User Support Agreement
Documents, Strategies
Change Requests
All Previous Phases
System Testing
New Version
Process Overview:
System Maintenance

28
The Feature of Our QA Model
Compared with other existing models:
Simple, easy to apply
Design for local component vendors (small to medium size)
Focused on development process, according to the life cycle of CBSD
Not focused on the measure/predict the quality of components/systems

29
Outline
Introduction Technical Background and Related Work A Quality Assurance Model for CBSD A Generic Quality Assessment
Environment: ComPARE Experiment and Discussion Conclusion

30
ComPARE: A Generic Quality Assessment Environment Component-based Program Analysis and
Reliability Evaluation Automates the collection of metrics, the
selection of prediction models, the validation of the established models according to fault data collected in the development process
Integrates & encapsulate the quality control for different processes defined in our QA model
31
Objective of ComPARE
To predict the overall quality by using process metrics, static code metrics as well as dynamic metrics.
To integrate several quality prediction models into one environment and compare the prediction result of different models
To define the quality prediction models interactively

32
Objective of ComPARE
To display quality of components by different categories
To validate reliability models defined by user against real failure data
To show the source code with potential problems at line-level granularity
To adopt commercial tools in accessing software data related to quality attributes

33
Architecture of ComPARE
Metrics Computation
CriteriaSelection
Model Definition
Model Validation
Result Display
Case Base
Failure Data
Candidate Components
System Architecture

34
Combination of Metrics & Models
MetricsProcess Metrics
Static Metrics
Dynamic Metrics
Models
BBN
CBR
TreeLOC
CCNOC
Coverage
Call GraphHeap
TimeEffort
CR
Sub-metrics

35
Quality Control Methods
Existing Software Quality Assurance (SQA) techniques and methods have explored to measure or control the quality of software systems or process.• Management/process control• Software testing• Software metrics • Quality prediction techniques

36
Quality Assessment Techniques
Software metrics: • Process metrics• Static code metrics• Dynamic metrics
Quality prediction model:• Classification tree model• Case-based reasoning
method• Bayesian Belief Network

37
Progress and Dynamic Metrics
Metric Description
Time Time spent from the design to the delivery (months)
Effort The total human resources used (man*month)
Change Report Number of faults found in the development
Metric Description
Test Case Coverage The coverage of the source code when executing the given test cases. It may help to design effective test cases.
Call Graph metrics The relationships between the methods, including method time (the amount of time the method spent in execution), method object count (the number of objects created during the method execution) and number of calls (how many times each method is called in you application).
Heap metrics Number of live instances of a particular class/package, and the memory used by each live instance.

38
Static Code MetricsAbbreviation Description
Lines of Code (LOC) Number of lines in the components including the statements, the blank lines of code, the lines of commentary, and the lines consisting only of syntax such as block delimiters.
Cyclomatic Complexity (CC) A measure of the control flow complexity of a method or constructor. It counts the number of branches in the body of the method, defined by the number of WHILE statements, IF statements, FOR statements, and CASE statements.
Number of Attributes (NA) Number of fields declared in the class or interface.
Number Of Classes (NOC) Number of classes or interfaces that are declared. This is usually 1, but nested class declarations will increase this number.
Depth of Inheritance Tree (DIT) Length of inheritance path between the current class and the base class.
Depth of Interface Extension Tree (DIET)
The path between the current interface and the base interface.
Data Abstraction Coupling (DAC) Number of reference types that are used in the field declarations of the class or interface.
Fan Out (FANOUT) Number of reference types that are used in field declarations, formal parameters, return types, throws declarations, and local variables.
Coupling between Objects (CO) Number of reference types that are used in field declarations, formal parameters, return types, throws declarations, local variables and also types from which field and method selections are made.
Method Calls Input/Output (MCI/MCO)
Number of calls to/from a method. It helps to analyze the coupling between methods.
Lack of Cohesion Of Methods (LCOM)
For each pair of methods in the class, the set of fields each of them accesses is determined. If they have disjoint sets of field accesses then increase the count P by one. If they share at least one field access then increase Q by one. After considering each pair of methods, LCOM = (P > Q) ? (P - Q) : 0

39
Classfication Tree Model classify the candidate components into
different quality categories by constructing a tree structure
Quality Prediction Techniques

40
Case-Based Reasoning A CBR classifier uses previous
“similar” cases as the basis for the prediction. case base.
The candidate component that has a similar structure to the components in the case base will inherit a similar quality level.
Euclidean distance, z-score standardization, no weighting scheme, nearest neighbor.
Quality Prediction Techniques

41
Bayesian Network a graphical network that represents
probabilistic relationships among variables enable reasoning under uncertainty The foundation of Bayesian networks is the
following theorem known as Bayes’
Theorem: P(H|c)P(E|H,c)P(H|E,c) =
P(E|c)
where H, E, c are independent events, P is the probability of such event under certain circumstances
Quality Prediction Techniques

42
Prototype GUI of ComPARE for metrics, criteria
and tree model Metrics Tree Model Criteria

43
Prototype GUI of ComPARE for prediction display,
risky source code and result statistics
Statistics Display Source code
44
Outline
Introduction Technical Background and Related Work A Quality Assurance Model for CBSD A Generic Quality Assessment
Environment: ComPARE Experiment and Discussion Conclusion

45
Experiment: Objective
Apply various existing quality prediction models to component-based programs to see if they are applicable
Evaluate/validate the prediction results to CBSD
Investigate the relationship between metrics and quality indicator

46
Experiment: Data Description
Real life project --- Soccer Club Management System
A distributed system for multiple clients to access a Soccer Team Management Server for 10 different operations
CORBA platform 18 set of programs by different teams 57 test cases are designed: 2 test cases for
each operation: one for normal operation and the other for exception handling.

47
Experiment: Data Description
Team TLOC CLOC SLOC CClass CMethod SClass SMethod Fail Maybe R R1
P2 1129 613 516 3 15 5 26 7 6 0.77 0.88
P3 1874 1023 851 3 23 5 62 3 6 0.84 095
P4 1309 409 900 3 12 1 23 3 12 0.74 0.95
P5 2843 1344 1499 4 26 1 25 2 1 0.95 0.96
P6 1315 420 895 3 3 1 39 13 10 0.60 0.77
P7 2674 1827 847 3 17 5 35 3 14 0.70 0.95
P8 1520 734 786 3 24 4 30 1 6 0.88 0.98
P9 2121 1181 940 4 22 3 43 4 2 0.89 0.93
P10 1352 498 854 3 12 5 41 2 2 0.93 0.96
P11 563 190 373 3 12 3 20 6 3 0.84 0.89
P12 5695 4641 1054 14 166 5 32 1 4 0.91 0.98
P13 2602 1587 1015 3 27 3 32 17 19 0.37 0.70
P14 1994 873 1121 4 12 5 39 4 6 0.82 0.93
P15 714 348 366 4 11 4 33 2 5 0.88 0.96
P16 1676 925 751 3 3 23 44 30 0 0.47 0.47
P17 1288 933 355 6 25 5 35 3 3 0.89 0.95
P18 1731 814 917 3 12 3 20 4 9 0.77 0.93
P19 1900 930 970 3 3 2 20 35 1 0.37 0.39

48
Experiment: Data Description
TLOC: the total length of whole program;
CLOC: lines of codes in client program;
SLOC: lines of codes in server program;
CClass: number of classes in client program;
CMethod: number of methods in client program;
SClass: number of classes in server program;
SMethod: number of methods in server program;

49
Fail: the number of test cases that the program fails to pass
Maybe: the number of test cases, which are designed to raise exceptions, can not apply to the program because the client side of the program deliberately forbids it.
R: pass rate, defined by . R1: pass rate 2, defined by , C is the total number of test cases applied to the programs ( i.e.,
57); Pj is the number of “Pass” cases for program j, Pj = C – Fail –
Maybe; Mj is the number of “Maybe” cases for program j.
Experiment: Data Description
jj
PR
C
1j j
jP M
RC

50
Experiment: Procedures
Collect metrics of all programs: Metamata & JProbe
Design test cases, use test results as indicator of quality
Apply on different models Validate the prediction results against
test results

51
Experiment: Modeling Methodology
Classification Tree Modeling- CART: Classification and Regression Trees
Bayesian Belief Network - Hugin system

52
CART
Splitting Rules: all possible splits Choosing a split: GINI, gwoing,
ordered twoing, class probability, least squares, least abosolute deviation
Stopping Rules: too few cases Cross Validation: 1/10 for smaller datasets and cases

53
CART: Tree Structure
CMETHOD< 7
TLOC< 1495.5 TLOC< 638.5
TLOC< 2758.5
CMETHOD< 26
SLOC< 908.5
TLOC< 921.5
TLOC< 1208.5
1 2
4
7
8
9
3
5 6

54
CART: Node Information
Parent Node Wgt Count Count Median MeanAbsDev Complexity--------------------------------------------------------------------------------------- 1 1.00 1 13.000 0.000 17.000 2 2.00 2 35.000 2.500 17.000 3 1.00 1 6.000 0.000 6.333 4 1.00 1 2.000 0.000 2.500 5 1.00 1 7.000 0.000 4.000 6 6.00 6 3.000 0.500 4.000 7 3.00 3 4.000 0.000 3.000 8 1.00 1 17.000 0.000 14.000 9 2.00 2 2.000 0.500 8.000

55
CART: Variable Importance
Relative Number Of Minimum Metrics Importance Categories Category ----------------------------------------------------------- CMETHOD 100.000 TLOC 45.161 SCLASS 43.548 CLOC 33.871 SLOC 4.839 SMETHOD 0.000 CCLASS 0.000 N of the learning sample = 18

56
CART: Result AnalysisTerminal Node Mean Faults CMethod TLOC SLOC
4 2 7~26 638.5~921.5 <=908.5
9 2 >7 <=638.5 -
6 3 7~26 1208.5~2758.5 <=908.5
7 4 7~26 638.5~921.5 >908.5
3 6 >7 <=638.5 -
5 7 7~26 638.5~921.5 <=908.5
1 13 <=7 <=1495.5 -
8 17 >26 638.5~921.5 -
2 35 <=7 >1495.5 -

57
Hugin Explorer System
Construct model-based decision support systems in domains characterized by inherent uncertainty.
Support Bayesian belief networks and their extension influence diagrams.
Define both discrete nodes and continuous nodes

58
Hugin: Influence Diagram

59
Hugin: Probability Description

60
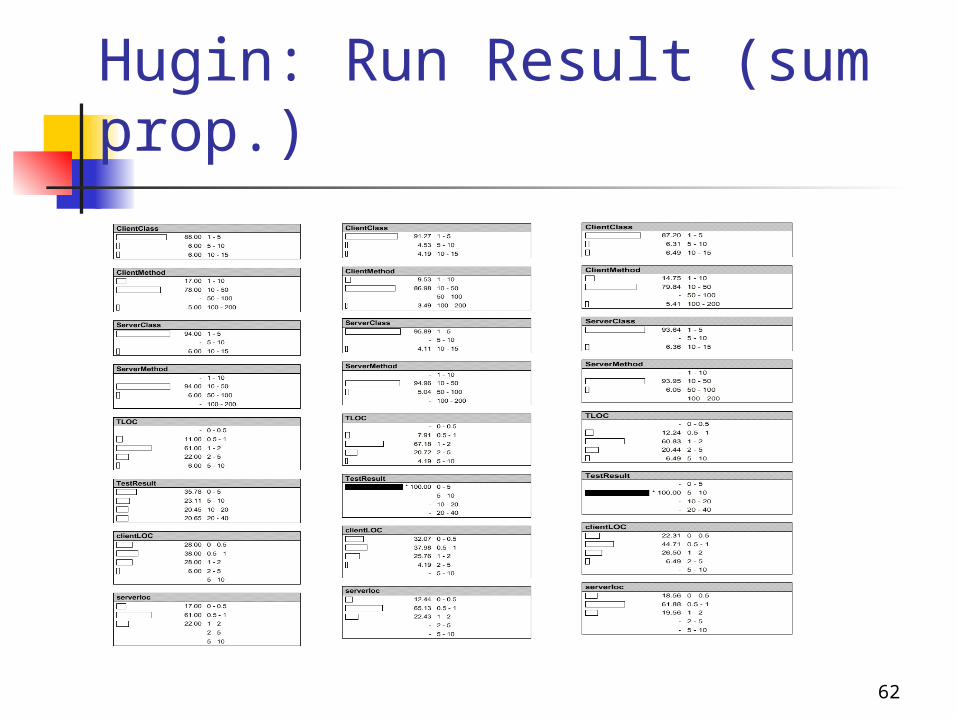
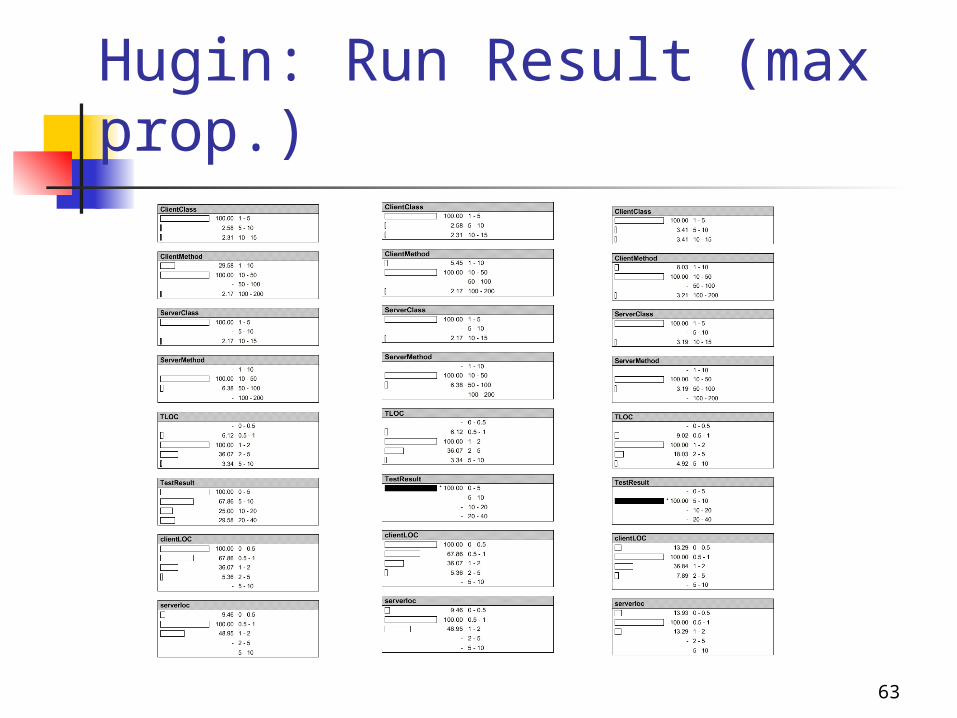
Hugin: Propagation The sum propagation shows the true
probability of state of nodes with the total summation 1
For the max propagation, if a state of a node belongs to the most probable configuration it is given the value 100, all other states are given the relative value of the probability of the most probable configuration they are found in compared to the most probable configuration.

61
Hugin: Propagation
Using max propagation instead of sum propagation, we can find the probability of the most likely combination of states under the assumption that the entered evidence holds. In each node, a state having the value 100.00 belongs to a most likely combination of states.
62
Hugin: Run Result (sum prop.)
63
Hugin: Run Result (max prop.)

64
Hugin: Result Analysis
TestResult
CCLASS CMethod SCLASS SMethod TLOC CLOC SLOC
0-5 1-5 10-50 1-5 10-50 1-2K 0-0.5K 0.5-1K
5-10 1-5 10-50 1-5 10-50 1-2L 0.5-1K 0.5-1K

65
Comparison
Modeling Advantage Disadvantage
Classification Tree
Very accurate if the learning sample is large enough
Need large learning data and data description
Bayesian Belief Network
Can suggest the best combination of metrics for the faults in a specific range
Need expert acknowledge in a specific domain to construct a correct influence diagram

66
Discussion
For testing result between 0-5, the range of CMethod, TLOC and SLOC is very close in the two modeling methods.
For our experiment, the learning data set is limited to 18 teams.
The prediction results will be more accurate and representative if the learning data set is larger.

67
Discussion
If more learning data and more metrics are available, the results will be more complex and hard to analysis.
This will raise the need for an automatic and thorough modeling and analysis environment to integrate and encapsulate such operations. That’s exactly what ComPARE aims at.

68
Discussion
Case-based reasoning is not applied in our experiment because the lack of tool, yet it can be simulated by the results of the classification tree.
Dynamic metric is not collected because of the complex and confliction of the CORBA platform and existing metric-collected tool.

69
Conclusion Problem: conventional SQA techniques
are not applicable to CBSD. We propose a QA model for CBSD
which covers eight main processes. We propose an environment to
integrate and investigate most efficient and effective approach suitable to CBSD.

70
Conclusion Experiments of applying and comparing
different quality predicted techniques to some CBSD programs have been done.
Not enough component-based software programs and results collected for our experiment
Validation/evaluation of different models should be done if learning data set is large enough

Thank you!


![Thermodynamics [AP-2013] Lecture 4B by Ling-Hsiao Lyu ...lyu/lecture_files_en/lyu_TD_Notes/TD...Thermodynamics [AP-2013] Lecture 4B by Ling-Hsiao Lyu 2015 p. 4B- 3 Exercise: Write](https://static.fdocuments.net/doc/165x107/603cb45e18d052577f298947/thermodynamics-ap-2013-lecture-4b-by-ling-hsiao-lyu-lyulecturefilesenlyutdnotestd.jpg)