Quality of service— price-monitored airports monitoring - Quality of... · quality of service...
100
Quality of service— price-monitored airports 2004–05 | November 2005
Transcript of Quality of service— price-monitored airports monitoring - Quality of... · quality of service...

Quality of service—price-monitored airports
2004–05 | November 2005

QUALITY OF SERVICE REPORT: 2004–05ii
© Commonwealth of Australia 2005
This work is copyright. Apart from any use as permitted under the
Copyright Act 1968 no part may be reproduced by any process
without permission from the Australian Competition and Consumer
Commission. Requests and inquiries concerning reproduction and
rights should be addressed to the Director Publishing, Australian
Competition and Consumer Commission, PO Box 1199, Dickson
ACT 2602.
Produced by the ACCC Publishing Unit 11/05.

QUALITY OF SERVICE REPORT: 2004–05 iii
Contents
1 Introduction 41.1 The ACCC’s role and approach in quality monitoring 4
2 Airport comparisons 92.1 Overall airport ratings 92.2 Runway traffi c—demand and delays 112.3 Objective indicators 122.4 Passenger surveys 122.5 Airline surveys 132.6 Australian Customs Service survey 152.7 Airport overview 16
3 Adelaide airport 193.1 Objective indicators for quality of service 193.2 Passenger survey 203.3 Airline survey 233.4 Australian Customs Service survey 25
4 Brisbane airport 274.1 Runway traffi c—demand and delays 274.2 Objective indicators for quality of service 284.3 Passenger survey 294.4 Airline survey 314.5 Australian Customs Service survey 33
5 Canberra airport 345.1 Objective indicators for quality of service 345.2 Passenger survey 345.3 Airline survey 345.4 Australian Customs Service survey 36
6 Darwin airport 376.1 Objective indicators for quality of service 376.2 Passenger survey 386.3 Airline survey 386.4 Australian Customs Service survey 40

QUALITY OF SERVICE REPORT: 2004–05iv
7 Melbourne airport 497.1 Runway traffi c—demand and delays 417.2 Objective indicators for quality of service 427.3 Passenger survey 437.4 Airline survey 457.5 Australian Customs Service survey 48
8 Perth airport 378.1 Objective indicators for quality of service 498.2 Passenger survey 508.3 Airline survey 538.4 Australian Customs Service survey 55
9 Sydney airport 569.1 Runway traffi c—demand and delays 569.2 Objective indicators for quality of service 579.3 Passenger survey 589.4 Airline survey 609.5 Australian Customs Service survey 63
Appendix 1 Indicators of airport quality of service 64Objective measures 64Passenger perception surveys 66Airline user survey 67
Appendix 2 Base data for objective indicators 68Airport traffi c 68Airport scale of provision of service 69Adelaide airport 72Brisbane airport 76Canberra airport 80Darwin airport 82Melbourne airport 85Perth airport 89Sydney airport 93

QUALITY OF SERVICE REPORT: 2004–05 SUMMARY 1
GlossaryACCC Australian Competition and Consumer Commission
ACS Australian Customs Service
actual arrivals the actual number of aircraft that land during the measured period (morning peak hour)
AETRA a leading airport customer satisfaction program run jointly by IATA and ACI Worldwide, headquartered in Geneva, Switzerland
agreed arrival rate—also see OAC
indicates the maximum number of aircraft that can land at the airport within the measured period (morning peak hour)—also known as operationally agreed capacity
airside facilities runways, taxiways, aprons, aircraft gates and ground equipment
AQIS Australian Quarantine and Inspection Service
availability the availability of infrastructure and equipment and the occurrence of delays in gaining access to those facilities
average system delay the average of all airborne delay experienced by those aircraft that land during the measured period (morning peak hour)—this is the difference between the estimated time of landing after the aircraft becomes airborne and the actual time of arrival
CPI consumer price index
DOTARS Department of Transport and Regional Services
FID screen fl ight information display screen
gates a passageway in the airport terminal where passengers can embark or disembark aircraft
IATA International Air Transport Association
kerbside facilities space alongside terminal where vehicles can pick up and drop off passengers
landside facilities all parts of the airport that are not airside—includes terminals and the infrastructure within them and also facilities outside the terminal such as car parks and access roads

SUMMARY QUALITY OF SERVICE REPORT: 2004–052
maximum pro rata arrival rate
the highest arrival rate achieved for the part of the measured period (morning peak hour) where demand did equal or exceed the agreed OAC, expressed as a pro rata hourly rate
maximum system delay the maximum delay experienced by a fl ight during the measured period (morning peak hour)—this is an average of the maximum delays for all the daily peak hours in the month
OAC—also see agreed arrival rate
operationally agreed capacity
objective indicators indicators of adequacy or quality of service derived from basic measures of number or size of facility
peak demand within hour demand for that part of the morning peak hour when demand equals, or exceeds, the agreed OAC, expressed as a pro rata hourly rate
phase II airports airports privatised in 1998—Adelaide, Canberra and Darwin airports (of the price-monitored airports)
price-monitored airports Adelaide, Brisbane, Canberra, Darwin, Melbourne, Perth and Sydney airports
RPT regular public transport
runway demand the number of aircraft that, once airborne, have an estimated time of arrival within the measured period (morning peak hour)
standard the ability of equipment to perform the function intended, the reliability of the equipment and the possibility of it breaking down
terminal facilities aerobridges, check-in and baggage handling facilities

QUALITY OF SERVICE REPORT: 2004–05 SUMMARY 3
SummaryThis report presents the results of the Australian Competition and Consumer Commission’s (ACCC’s) quality of service monitoring at the seven price-monitored airports (Adelaide, Brisbane, Canberra, Darwin, Melbourne, Perth and Sydney) for 2004–05.
The key fi ndings are:
• On a rating scale ranging from very poor to excellent, the overall ratings of the seven airports has ranged from satisfactory to good over the three-year period from 2002–03 to 2004–05.
• Over the three-year period, Brisbane has been the top-ranked airport, achieving an overall rating of good. Melbourne, Perth and Sydney airports have generally been rated between satisfactory and good, while Adelaide, Canberra and Darwin airports have generally been rated as satisfactory.
• Melbourne airport’s rating has declined since 2002–03, while Canberra airport’s rating has improved.
• Runway traffi c at Sydney airport during the morning peak hour at times equalled or exceeded operationally agreed capacity during 2004–05. At the two other busiest airports—Melbourne and Brisbane—demand was generally below capacity at peak hour.
• The average system delay at morning peak hour at Sydney airport was about fi ve minutes in 2004–05, while the maximum system delay was about 14 minutes. Both results are unchanged from 2003–04.
• Since 1997–98 passengers have consistently rated the international terminals at Brisbane, Melbourne, Perth and Sydney airports as good. Over a shorter time series, passengers have rated the domestic terminal facilities as good for Brisbane, Melbourne and Perth airports and as between satisfactory and good for Adelaide and Sydney airports.
• Since 1997–98 airlines have generally rated the airside facilities within the range of satisfactory to good and the international terminal facilities within the range of poor to good. Within these ranges, airlines have rated the facilities at Brisbane and Melbourne airports as better than those provided at other airports. Airlines have generally rated the domestic terminal facilities at all airports as satisfactory since 2002–03, except for Canberra airport, which was generally rated as good.
• Since 1998–99, the Australian Customs Service (ACS) has rated airport facilities at all airports within the range of poor to good, with ratings being more variable compared with other survey responses. The ACS has generally rated Sydney as the best performing airport, rating its facilities as good over the period.

INTRODUCTION QUALITY OF SERVICE REPORT: 2004–054
1 IntroductionThis report presents the results of the Australian Competition and Consumer Commission’s (ACCC’s) quality of service monitoring at the seven price-monitored airports (Adelaide, Brisbane, Canberra, Darwin, Melbourne, Perth and Sydney) for 2004–05.
The ACCC has been monitoring the quality of service at airports since airports began to be privatised in 1997.1 A separate report, presenting the results of the ACCC’s price monitoring and airport company fi nancial reporting for these airports is expected to be released in early 2006.
Originally introduced as a complement and input to price regulation,2 quality of service monitoring is now considered an important complement to price monitoring: it continues to provide an incentive (in addition to commercial incentives) to airports to maintain appropriate service standards and adds a level of transparency and comparability (between airports) that would not otherwise exist. It may provide information to airport users that will help them when negotiating commercially with airports, and help the government address public interest matters relating to the regulation of airports.
Since 2002–03, the ACCC has reported on more measures of service quality. In particular, some ‘objective measures’ were introduced to complement the (largely subjective) surveys of airport users’ perceptions. Basic measures of number, or size, of facility have been converted to indicators of adequacy or quality of service (e.g. by expressing these as an amount per passenger at peak hour). The introduction of these objective measures followed a consultative process with airports and other stakeholders in response to comments made in the Productivity Commission’s report on Price regulation of airport services.3
The report begins with an overview of the ACCC’s role and approach to quality of service monitoring. This is followed by a comparison of the airports on various indicators and the specifi c quality of service results for each airport. The items monitored are listed in appendix 1, while the base data for the objective measures are shown in appendix 2.
1.1 The ACCC’s role and approach in quality monitoringQuality of service monitoring by the ACCC was introduced in 1997 as a complement to price controls when airports began to be privatised. Its key function is to report on whether airport operators degrade service standards to reduce costs and increase profi t.
1.1.1 Regulatory frameworkPart 8 of the Airports Act 1996 requires the ACCC to monitor and evaluate the quality of airport services and facilities against specifi c indicators that are prescribed by regulations made under s. 153 of the Airports Act and by ‘such other criteria as the ACCC determines in writing’.4
Part 8 of the Airports Regulations 1997 sets out various prescribed performance indicators which the ACCC uses to monitor and evaluate the quality of airport services and facilities of particular airports. They include several objective or ‘static’ indicators about the number, availability and adequacy of particular facilities; and some subjective satisfaction ratings by airport users (airlines and passengers). Generally, the regulations require that Brisbane, Melbourne, Perth and Sydney airports provide more, or more detailed, information than Adelaide, Canberra and Darwin airports. In particular, Adelaide, Canberra and Darwin airports are not required to conduct passenger surveys. Adelaide airport does, however, survey passengers for its own purposes and provides this information to the ACCC voluntarily.
1 Before 2002–03, the ACCC reported the results of quality of service monitoring in fi ve separate reports each year. One report was published for each for the three phase I airports (Brisbane, Melbourne, Perth), one report for Sydney airport, and one report for the phase II airports (Adelaide, Alice Springs, Canberra, Gold Coast (Coolangatta), Darwin, Hobart, Launceston and Townsville). These regulatory reports contained each airport’s fi nancial reports, quality of service monitoring, price monitoring and reported on price cap compliance as required for particular airports.
2 The ACCC was required to consider the quality of service in its deliberations on airport pricing proposals.
3 Productivity Commission, Price regulation of airport services: inquiry report 2002, pp. 265–271.
4 Subsection 155(1) of the Airports Act.

QUALITY OF SERVICE REPORT: 2004–05 INTRODUCTION 5
After airport price regulation signifi cantly changed in 2002,5 the ACCC consulted airports, other stakeholders and the Department of Transport and Regional Services (DOTARS) and reviewed the indicators it used in its quality monitoring. This resulted in the ACCC publication, Guidelines for quality of service monitoring at airports.6 The guidelines and an accompanying template provide the details of information that airports should supply to the ACCC.
The regulations have not yet been updated to refl ect the new requirements developed by the ACCC’s review. The Airports Act is currently subject to review by DOTARS and the ACCC anticipates that, following fi nalisation of the review, the regulations will be amended to refl ect the quality of service indicators outlined in the guidelines.
1.1.2 The ACCC’s approachThe ACCC monitors only those facilities and services provided by, or that could be infl uenced by, the airport operator. These facilities and services include:
• airside facilities such as runways, taxiways and aprons
• terminal facilities, such as international departure lounges and baggage claim
• car parking
• taxi and bus pick-up and drop-off points.
Domestic terminals owned and/or operated by airlines are not included.
The ACCC has tried to cover, in its quality monitoring, the range of facilities that are subject to price monitoring. These include both aeronautical and aeronautical-related services as defi ned in Direction 27 under the Trade Practices Act 1974, where ‘aeronautical-related services’ include, for example, landside vehicle access and check-in counters.
This report draws on information from several sources:
• airport operators
• passengers of the airport
• airlines
• Airservices Australia
• Australian Customs Service (ACS).
Airport operators
Airport operators provide the ACCC with a range of objective data on the number or size of various facilities. These include the number of passengers at peak hours, the number of aerobridges and the size of gate lounges. The ACCC has converted these to indicators of adequacy or quality of service, such as the area of lounge per passenger at peak hours, and percentage of passengers using aerobridges. These objective indicators, listed in appendix 1, follow the ACCC’s Guidelines for quality of service monitoring at airports.
The derived objective indicators are shown in tables in the body of the report for each airport for the three years they have been calculated (2002–03 to 2004–05). The data on which these objective indicators are based is detailed in appendix 2.
Measures that relate to the size of facilities generally relate to the end of the fi nancial year 2004–05, whereas measures of throughput, such as numbers of passengers or bags, relate to the whole fi nancial year, unless specifi ed as daily or for peak hour.
5 Price cap and price notifi cation regulation of aeronautical services (except for aeronautical services to ‘regional air services’ at Sydney airport, which remain subject to a price cap) was replaced by price monitoring from 1 June 2002.
6 These guidelines are available on the ACCC’s website at www.accc.gov.au

INTRODUCTION QUALITY OF SERVICE REPORT: 2004–056
Passenger perception surveys
The passenger perception surveys arranged by each airport differ somewhat in their coverage and detail, but all broadly provide the information specifi ed in the regulations and guidelines. The areas covered include passenger check-in, security clearance, government inspection, lounges, washrooms, baggage collection, signage, car parking, and vehicle access for arriving and departing passengers.
Surveys at most airports ask respondents to rate their level of satisfaction with facilities on a scale from 1 to 5.
1 2 3 4 5
very poor poor average, fair, or satisfactory
good excellent
There is one main deviation from this approach: Sydney airport uses a global survey conducted by the International Air Transport Association (IATA).
The ACCC accepted the IATA survey for Sydney airport because it is an authoritative independent survey by a user group that allows benchmarking against major world airports. Questions in the IATA survey are broadly equivalent, but not identical, to those expected in the Australian regulations. While a consistent methodology across all airports is desirable, the IATA survey does allow international comparisons and there is a time series back to 2000.
Before 2004–05, Perth airport used a 1–7 rating scale which was converted to the ACCC’s 1–5 scale. However, this year Perth has changed its survey methods and now conducts its survey using a 1–5 rating scale. Section 8.2 of this report details the major changes in Perth’s survey methods.
As noted above, the regulations do not require Adelaide, Canberra or Darwin airports to undertake passenger surveys. Accordingly, the ACCC’s guidelines do not require these airports to undertake passenger surveys. Adelaide airport does, however, survey passengers for its own purposes and provides this information to the ACCC voluntarily.
The average ratings for each indicator in the passenger perception surveys are shown for each airport. The average ratings for domestic terminals and international terminals are shown, with a time series if available.
Airline surveys
The ACCC has surveyed airlines on their perception of the quality of facilities they use at the monitored airports. The facilities and services covered include:
• airside facilities—runways, taxiways, aprons, aircraft gates and ground equipment sites
• terminal facilities—aerobridges, check-in and baggage handling.
Airlines were asked to rate two aspects of these facilities:
• availability—the availability of infrastructure and equipment and how often there were delays in accessing those facilities
• standard—the ability of equipment to perform the function intended, the reliability of the equipment and the possibility of it breaking down.
The airlines were also asked to rate the airport operator’s responsiveness or approach to addressing problems and concerns about the above facilities.
Full details of the questions are in appendix 1.
The scale used for airlines’ ratings, shown below, was essentially the same as that sought for passenger survey responses.
1 2 3 4 5
very poor poor satisfactory good excellent

QUALITY OF SERVICE REPORT: 2004–05 INTRODUCTION 7
Ratings given by airlines have been averaged (with equal weights) to give an overall rating for each facility at each airport.
Airservices Australia
Airservices Australia was asked to provide data to indicate the adequacy of airport runways to handle the traffi c. Airservices Australia currently records several measures of peak-hour arrival performance monthly at Brisbane, Melbourne and Sydney airports. The facilities to gather this data have not yet been installed at any of the other airports. Airservices Australia has advised that the next expansion of this system is likely to be to Adelaide and Perth airports; however, the timing of this expansion has not been set.
Airservices Australia’s aircraft traffi c measures
Airservices Australia’s measures relate to the busiest morning peak hour at each of the three airports, generally 7.30–8.30 am, averaged across all days in the month or year specifi ed.
Demand—counts how many aircraft that, once airborne, have an estimated time of arrival within the measured period (morning peak hour).
Actual arrivals—counts the actual number of aircraft that land during the measured period. This is always close to ‘demand’ since demand refers to aircraft already airborne, which will generally land at the destination airport close to the estimated time of arrival.
Agreed arrival rate—or operationally agreed capacity (OAC), is derived from modelling and expert consensus. It indicates the maximum number of aircraft that can land at the airport within the measured period. This varies for several different runway modes and depends on weather conditions.
Peak demand within hour—demand for that part of the hour when demand equals, or exceeds, the agreed OAC, expressed as a pro rata hourly rate.
Maximum pro rata arrival rate—the highest arrival rate achieved for the part of the measured period when demand did equal or exceed the agreed OAC, expressed as a pro rata hourly rate.
Average system delay—the average of all airborne delay experienced by those aircraft that land during the measured period. This is the difference between the estimated time of landing after the aircraft becomes airborne and the actual time of arrival. ‘System delay’ covers all reasons for delays such as airspace limitations, weather, arrival clustering, air traffi c control, air crew operations, and airport infrastructure limitations, but it does not refl ect delays at the airport from which the aircraft left. The data currently collected does not apportion the reasons for delays.
Maximum system delay—the maximum delay experienced by a fl ight during the measured period. The maximum delay for a monthly period is not the maximum delay experienced by an individual fl ight during the whole month, but an average of the maximum delays for all the daily peak hours in the month.
Interpretation of Airservices Australia’s measures
Airservices Australia’s measures have been devised as a guide to its own performance in handling air traffi c, but do give some indication of airport constraints and therefore the adequacy of runway infrastructure or management. In particular, if demand is consistently close to OAC for the peak hour, it would suggest that there is little spare capacity for increased traffi c at that time.
When high demand (relative to OAC) is combined with consistently long system delays, it indicates capacity constraints. However, if the peak demand is limited to a short period, it would not necessarily point to the need to expand the infrastructure and it might be better to make changes to spread the demand more evenly.
The full extent of capacity constraints cannot be seen from this data, because the agreed arrival rate has already been limited by constraints such as airport infrastructure. Potential economic demand greater than capacity, which might, for example, indicate the need for new infrastructure may therefore not be observed in this data. Airlines may not attempt to or may not be permitted to schedule extra aircraft when capacity is clearly limited.

INTRODUCTION QUALITY OF SERVICE REPORT: 2004–058
Australian Customs Service
The ACCC surveyed ACS, asking it to rate facilities in the following areas provided by airports:
• arrivals (immigration)—adequacy of areas for circulation and queuing, signage, lighting, desks and passenger facilities (e.g. seating, toilets)
• arrivals (baggage inspection or examination area)—adequacy of space to avoid congestion, signage, provision for passenger privacy, appropriate access and security, passenger facilities and inspection facilities
• departures (immigration)—adequacy of circulation space to avoid congestion, signage and appropriate provision of desks.
ACS was asked to give separate ratings for each area for:
• adequacy—the space and facilities made available for its operations, covering the amount of space provided; and the likelihood of congestion and delays in passenger processing
• standard and condition in which it is generally maintained.
ACS was also asked to rate the airport operator’s responsiveness or approach to addressing problems and concerns about the above facilities.
Results from this survey are included in each airport’s section.
1.1.3 Issues concerning interpretation of resultsIn assessing the quality of service for airports, it is important to note that there are a variety of factors outside the immediate control of the airport operator that are likely to infl uence the quality of service results.
The fi rst of these is the staffi ng of check-in services by airlines and, similarly, staffi ng of immigration services by ACS, which may affect the quality results obtained for related services. Second, airlines, Airservices Australia and other service providers might contribute to quality outcomes, for example, by contributing to delays in aircraft departure.
Investment in terminal infrastructure is also ‘lumpy’ and there may therefore be a lag between an increase in passenger and fl ight numbers and an increase in the capacity of the terminal infrastructure. Such a lag could refl ect adversely in the results of some quality of service indicators.

QUALITY OF SERVICE REPORT: 2004–05 AIRPORT COMPARISONS 9
2 Airport comparisonsIn this section some key indicators across the monitored airports are compared. Overall airport ratings since 2002–03 are displayed, as are survey results from passengers, airlines and ACS.
2.1 Overall airport ratingsThe results obtained for each airport have been aggregated to give an overall view of the quality of service provided by the airport operators. The ACCC now has available three years of data for all indicators, which allows trends in overall quality of service to be examined.
Chart 2.1 shows the overall average rating of quality of service at all airports from 2002–03 to 2004–05. This rating is based on a weighted average7 over the range of quality of service indicators examined at each airport.
Chart 2.1 Overall airport ratings
Adelaide Brisbane Canberra Darwin Melbourne Perth Sydney
Ave
rage
rat
ing
(1–5
)
2002–03 2003–04 2004–05
Very poor
Satisfactory
Good
Excellent
Poor
The overall ratings of quality of service at the seven price-monitored airports have been relatively stable since 2002–03, with ratings ranging from satisfactory to good for all airports.
Over the reported period, Brisbane airport has been the highest ranked airport, with an overall rating of good in each year and Melbourne, Perth and Sydney airports have generally been rated at the mid-point between satisfactory and good. However, Melbourne’s overall rating declined over the period. As shown in the following two charts, this decline relates mainly to the availability of facilities. Adelaide, Canberra and Darwin have generally rated at the satisfactory level, with Canberra’s overall rating improving over the three years. It should be noted, however, that Canberra airport does not provide information on its objective indicators; therefore, its overall ratings are derived from a narrower range of indicators.
Chart 2.2 shows the average ratings of the availability of facilities provided at all airports from 2002–03 to 2004–05. This rating is based on a weighted average over the range of quality of service indicators relating to the availability of facilities provided by each airport operator.
7 The overall airport ratings have been calculated by taking the average rating of each category of indicator (i.e. passenger, airline and ACS ratings and objective indicators) available for each airport and weighting these scores by the number of observations in each category. The objective indicators have been converted to the same 1–5 rating scale used in the other surveys. This has been achieved by taking the average of the results obtained for each indicator across airports and constructing quartiles in order to rate performance of each objective indicator.

AIRPORT COMPARISONS QUALITY OF SERVICE REPORT: 2004–0510
Chart 2.2 Overall airport ratings—availability of facilities
Adelaide Brisbane Canberra Darwin Melbourne Perth Sydney
Ave
rage
rat
ing
(1–5
)
2002–03 2003–04 2004–05
Very poor
Satisfactory
Good
Excellent
Poor
In general, the overall airport rating of the availability of facilities has ranged between satisfactory and good for all airports. The exception to this is the rating for availability of facilities at Darwin airport during 2004–05, which was below satisfactory.
Over the reported period, Brisbane airport has been the highest ranked airport for availability of facilities. Melbourne, Perth and Sydney airports have generally been rated at the mid-point between satisfactory and good, although Melbourne’s overall rating has declined over the period. Adelaide, Canberra and Darwin airports have generally been rated as satisfactory; however, Darwin’s rating decreased to below satisfactory this year. Canberra airport’s overall rating for availability has improved over the three years. However, it should be noted that Canberra airport does not provide information on its objective indicators; therefore, its rankings are derived from a narrower range of indicators.
Chart 2.3 shows the average rating of the standard of facilities provided at all airports from 2002–03 to 2004–05. This rating is based on a weighted average over the range of quality of service indicators for the standard of facilities provided by each airport operator.

QUALITY OF SERVICE REPORT: 2004–05 AIRPORT COMPARISONS 11
Chart 2.3 Overall airport ratings—standard of facilities
Adelaide Brisbane Canberra Darwin Melbourne Perth Sydney
Ave
rage
rat
ing
(1–5
)
Very poor
Satisfactory
Good
Excellent
Poor
2002–03 2003–04 2004–05
In general, the overall airport ratings of the standard of facilities have ranged between satisfactory and good for all airports.
Over the reported period, Brisbane airport has been the highest ranked airport for standard of facilities. Melbourne and Perth airports have generally been rated at the higher end of the range of satisfactory to good, while Sydney airport has generally been rated at the mid-point of this range. Adelaide, Canberra and Darwin airports have generally been rated as satisfactory.
Within the range of satisfactory to good ratings, some minor trends are apparent in the overall rating of the standard of airport facilities—there has been an upward trend in the ratings for the standard of services provided at Canberra and Perth airports, while there has been a downward trend in the ratings at Adelaide airport since 2002–03.
2.2 Runway traffi c—demand and delaysThe ACCC collects information on runway traffi c and demand from Airservices Australia. This information is currently available only for Brisbane, Melbourne and Sydney airports and is presented in the individual airport chapters.
At Sydney airport runway demand during 2004–05 was sometimes higher than operationally agreed capacity during the morning peak hour.
Runway demand at Brisbane and Melbourne airports was generally within operationally agreed capacity during the morning peak hour. However, on one occasion, runway demand at Melbourne airport equalled operationally agreed capacity due to construction works on its main runway.
Delay times remained relatively low at both Brisbane and Melbourne airports during 2004–05. In general, reported delay times at Brisbane airport were shorter than for Melbourne and Sydney. The average system delay time at Brisbane airport was about 1.4 minutes, compared with 3.6 minutes at Melbourne airport and 5 minutes at Sydney airport. The maximum system delay was also shorter at Brisbane airport, averaging about 4 minutes, compared with 10 and 14 minutes at Melbourne and Sydney airports, respectively.
Delay times in peak hour at Sydney airport in 2004–05 were unchanged from 2003–04. Capacity at Sydney airport is constrained by a limit on hourly movements and the guaranteed access provided to regional airlines.
It should be noted that delays to fl ights may not result from factors within the airport’s control.

AIRPORT COMPARISONS QUALITY OF SERVICE REPORT: 2004–0512
2.3 Objective indicatorsAirport operators provide the ACCC with objective data on the number or size of various facilities, from which the ACCC derives objective indicators for quality of service. For the most part, variations in the objective indicators for all airports refl ected increases in passenger volumes during peak hour, rather than changes in the number of facilities provided. The objective indicators are shown in the individual airport chapters.
2.4 Passenger surveysChart 2.4 shows the average passenger ratings for the international terminals at Adelaide, Brisbane, Melbourne, Perth and Sydney airports. More detail on survey results are shown in the individual airport chapters.
Chart 2.4 Average passenger ratings for international terminals
Adelaide Brisbane Melbourne Perth Sydney
Ave
rage
rat
ing
(1–5
)
1997–98 1998–99 1999–2000 2000–01 2001–02 2002–03 2003–04 2004–05
Very poor
Satisfactory
Good
Excellent
Poor
Note: Sydney airport’s passenger ratings have been converted from the IATA 1–5 scale to an equivalent ACCC 1–5 scale. The IATA passenger survey covers calendar years from January 2000 to June 2004.
Average passenger ratings of the international terminal facilities have been relatively stable over the reporting period, generally achieving ratings of good. Results for Adelaide airport’s international terminal are lower than for the other airports, with results ranging between satisfactory and good and have been lower in the past two years.
Chart 2.5 shows the average passenger ratings for the domestic terminal at Adelaide, Brisbane, Melbourne, Perth and Sydney airports. A shorter time series is available for domestic terminals because the ACCC only started to collect results after the control of Ansett’s terminals was transferred to the airport operators.

QUALITY OF SERVICE REPORT: 2004–05 AIRPORT COMPARISONS 13
Chart 2.5 Average passenger ratings for domestic terminals
Adelaide Brisbane Melbourne Perth Sydney
Very poor
Satisfactory
Good
Excellent
Poor
2002–03 2003–04 2004–05
Ave
rage
rat
ing
(1–5
)
Average passenger ratings of the domestic terminal facilities have been relatively stable over the reporting period. In general, the domestic terminal facilities at Brisbane, Melbourne and Perth airports have been rated by passengers as good, while Adelaide and Sydney airports’ facilities have been rated between satisfactory and good. Adelaide airport’s rating is lower in 2004–05 than in previous years.
2.5 Airline surveysChart 2.6 shows the average ratings by airlines of airside facilities for all airports.
Chart 2.6 Average airline ratings for airside facilities
Adelaide Brisbane Canberra Darwin Melbourne Perth Sydney
Very poor
Satisfactory
Good
Excellent
Poor
Ave
rage
rat
ing
(1–5
)
1997–98 1998–99 1999–2000 2000–01 2001–02 2002–03 2003–04 2004–05

AIRPORT COMPARISONS QUALITY OF SERVICE REPORT: 2004–0514
The average airline rating of the airside facilities in 2004–05 was good for Brisbane airport, between satisfactory and good for Melbourne, Perth and Sydney airports and satisfactory for Adelaide, Canberra and Darwin airports.
There have been some variations in average ratings over the reported period, with Melbourne’s ratings falling since 1997–98 and Perth’s results increasing since 2001–02, after falling from 1997–98.
Chart 2.7 shows the average airline ratings of the international terminal facilities at all airports.
Chart 2.7 Average airline ratings for international terminal facilities
Adelaide Brisbane Darwin Melbourne Perth Sydney
1997–98 1998–99 1999–2000 2000–01 2001–02 2002–03 2003–04 2004–05
Ave
rage
rat
ing
(1–5
)
Very poor
Satisfactory
Good
Excellent
Poor
In 2004–05 international terminal facilities at Brisbane and Perth airports were rated between satisfactory and good, while the facilities at Darwin, Melbourne and Sydney were rated as satisfactory. The international terminal facilities at Adelaide airport were rated by airlines as poor. However, it should be noted that Adelaide airport has relatively low international traffi c.
Average ratings varied over the reported period. Results for Adelaide and Melbourne airports fell—Adelaide’s average rating from between poor and satisfactory in 2000–01 to poor in 2004–05, and Melbourne’s from above good in 1997–98 to below satisfactory in 2004–05.
Chart 2.8 shows the average airline ratings of the domestic terminal facilities at all airports. A shorter time series is available for domestic terminals because the ACCC only started to collect results after the control of Ansett’s terminals was transferred to the airport operators.

QUALITY OF SERVICE REPORT: 2004–05 AIRPORT COMPARISONS 15
Chart 2.8 Average airline ratings of the domestic terminal facilities
Adelaide Canberra Darwin Melbourne Perth Sydney
Very poor
Satisfactory
Good
Excellent
Poor
2002–03 2003–04 2004–05
Ave
rage
rat
ing
(1–5
)
Only those airlines that operate out of airport-operated domestic terminals complete the ACCC’s survey. No responses were provided for Brisbane airport and only one for Canberra airport.
Airlines rated the domestic terminal facilities at Canberra airport for 2004–05 as good, while other airports were generally rated as satisfactory.
2.6 Australian Customs Service surveyChart 2.9 shows the average ratings of terminal facilities by ACS for all airports.
Chart 2.9 Average ACS ratings for terminal facilities
Adelaide Brisbane Canberra Darwin Melbourne Perth Sydney
Very poor
Satisfactory
Good
Excellent
Poor
1998–99 1999–2000 2000–01 2001–02 2002–03 2003–04 2004–05
Ave
rage
rat
ing
(1–5
)

AIRPORT COMPARISONS QUALITY OF SERVICE REPORT: 2004–0516
In 2004–05 the average rating by the ACS of the facilities at Adelaide, Darwin, Melbourne and Perth airports was poor to satisfactory. For Brisbane, Canberra and Sydney airports, the ACS ratings were above satisfactory. Darwin airport’s rating decreased signifi cantly in 2004–05, from good to below satisfactory, while Brisbane airport’s rating improved markedly from poor to above satisfactory. Also Melbourne airport’s rating decreased this year from satisfactory to poor.
Over the reporting period, Brisbane airport’s results fell, before rebounding strongly in 2004–05. ACS rated Brisbane higher on every measure in 2004–05 than in 2003–04. In particular, ACS mentioned that Brisbane airport had taken a pro-active approach to responding to ACS’s concerns.
The ACS ratings of Canberra airport continued to improve this year, after a marked increase in ratings during 2003–04, as a result of Canberra airport investing in new border control facilities.
Both Melbourne and Sydney airports achieved their highest ratings early in the reporting period, with the ACS ratings this year dropping to their lowest levels since reporting started. Perth’s ratings fell over the period.
2.7 Airport overviewAn overview of each airport’s performance is provided below.
Adelaide airport Most objective indicators for Adelaide airport remained unchanged since 2003–04 and remained stable over the past three years.
Passengers rated Adelaide airport’s international and domestic terminal facilities as between satisfactory and good during 2004–05, with some ratings of the international terminal slightly up on those achieved in 2003–04.
For 2004–05 airlines’ average ratings of the airside facilities at Adelaide airport ranged from poor to satisfactory, while ratings for the international terminal facilities ranged from very poor to satisfactory. The average rating by airlines for the domestic terminal facilities was generally satisfactory. Airline ratings of airside and domestic terminal facilities were generally higher than last year’s, while ratings of the international terminal were down.
ACS rated the facilities at Adelaide airport as between poor and satisfactory; largely unchanged from previous years.
Brisbane airportRunway demand was within OAC in the morning peak hour. Delay times remained low at Brisbane airport during 2004–05, with the average system delay averaging 1.4 minutes. This year, the average maximum delay was 4 minutes.
Most objective indicators for both the international and domestic terminals showed a higher number of passengers per service indicator, due to an increase in peak-hour passenger numbers.
Passengers generally rated the domestic and international terminal facilities as between good and excellent in 2004–05. Passenger ratings for international terminal facilities have been stable over the reporting period, generally rating good or better.
The average airline rating for airside facilities at Brisbane airport since 1997–98 has been consistently good. Airline ratings of the international terminal facilities and management responsiveness increased during 2004–05, with ratings ranging between satisfactory and good.
ACS’s ratings for Brisbane airport’s facilities improved markedly since last year, rating between satisfactory and good during 2004–05.

QUALITY OF SERVICE REPORT: 2004–05 AIRPORT COMPARISONS 17
Canberra airportCanberra airport has not been able to provide complete data to enable the ACCC to calculate objective measures.
Airline ratings of the airside facilities at Canberra airport generally either improved or remained stable during 2004–05, ranging between satisfactory and good. For the most part, the domestic terminal facilities at Canberra airport were rated as good.
ACS’s ratings ranged between satisfactory and good in 2004–05.
Darwin airportMost objective indicators for the international terminal showed an increase in the number of passengers per service indicator, due to an increase in peak hour passenger numbers.
The average airline ratings of the airside and terminal facilities at Darwin airport ranged from less than satisfactory to good during 2004–05. In general, ratings of the terminal facilities and management responsiveness ranged from poor to good and either improved or remained stable when compared with the 2003–04 ratings.
ACS rated Darwin airport’s facilities as poor or satisfactory.
Melbourne airportRunway demand was generally within OAC during morning peak hour. Delay times have remained low at Melbourne airport during 2004–05, with the average system delay being 3.6 minutes and the average maximum system delay being 10 minutes.
Most objective indicators for both the international and domestic terminal showed an increase in the number of passengers per service due to an increase in passenger numbers during peak hour.
In general, passengers rated the international and domestic terminals as good. The international terminal facilities at Melbourne airport have received high ratings from passengers since 1997–98.
Airlines rated the airside facilities at Melbourne airport as satisfactory during 2004–05. Average airline ratings of the international terminal facilities ranged from above poor to satisfactory and ratings for the domestic terminal ranged from poor to good. Overall, airline ratings of the facilities at Melbourne airport were down on those achieved last year.
The ACS ratings of the facilities at Melbourne airport ranged between very poor and satisfactory, with most ratings down on last year.
Perth airportMost objective indicators for both the international and domestic terminals showed an increase in the number of passengers per service in 2004–05, due to more passengers during peak hour.
Passengers rated the international and domestic terminals as good. Passenger ratings for the international terminal facilities have been stable since 1997–98, being rated on average as good.
The average airline ratings of Perth airport’s airside facilities for 2004–05 ranged between satisfactory and good, with ratings slightly up on those achieved last year. Ratings by airlines of the international terminal facilities increased during 2004–05, with facilities on average rated as satisfactory, while ratings for the domestic terminal ranged from poor to good.
The ACS rated Perth airport’s facilities between poor and good during 2004–05.

AIRPORT COMPARISONS QUALITY OF SERVICE REPORT: 2004–0518
Sydney airportRunway demand at Sydney airport was sometimes higher than OAC during the morning peak hour. The average system delay and maximum system delay in peak hour were unchanged since last year, at about 5 and 14 minutes, respectively.
The objective indicators for the domestic terminal generally remained relatively stable, while an increase in the number of international passengers during peak hour resulted in most of the objective indicators for the international terminal increasing.
Passengers rated the international and domestic terminals as good to very good.8 Ratings for the international terminal facilities have been relatively stable, between good to very good, over the reporting period.
Airlines’ average ratings of the airside facilities at Sydney airport ranged between satisfactory and good. This year, the average airline ratings for Sydney airport’s international and domestic terminals were satisfactory. Overall, the airlines’ ratings of the facilities at Sydney airport were largely unchanged from those in 2003–04.
ACS rated the facilities at Sydney airport as satisfactory to good.
8 The ACCC have accepted Sydney airport’s use of a global survey conducted by IATA, under which passengers have rated the terminal facilities as good to very good. This translates to a rating of satisfactory to good using ACCC survey.

QUALITY OF SERVICE REPORT: 2004–05 ADELAIDE AIRPORT 19
3 Adelaide airport
3.1 Objective indicators for quality of serviceTable 3.1 shows the objective indicators for quality of service at Adelaide airport for 2002–03 to 2004–05.
3.1 Objective indicators for quality of service
Indicator
Terminal International Domestic
2002–03 2003–04 2004–05 2002–03 2003–04 2004–05
Percentage of international passengers arriving using an aerobridge
75% 75% 0%(a) N/A N/A N/A
Percentage of international passengers departing using an aerobridge
75% 75% 0%(a) N/A N/A N/A
Percentage of hours with more than 80 per cent of check-in desks in use
25% 25% 25% 60% 60% 60%
Number of arriving passengers per inbound immigration desk during peak hour
46 48 48 N/A N/A N/A
Number of arriving passengers per baggage inspection desk during peak hour
38 40 40 N/A N/A N/A
Number of departing passengers per outbound migration desk during peak hour
92 86 86 N/A N/A N/A
Number of departing passengers per security-clearance system during peak hour
230 216 240 250 233 251
Number of departing passengers per seat in gate lounges during peak hour
1.4 1.3 1.3 2.1 1.9 2.1
Number of departing passengers per square metre of lounge area during peak hour
0.8 0.7 0.7 0.4 0.4 0.4
Average throughput of outbound baggage system, bags per hour
43 73 114 N/P N/P 465
Number of passengers per baggage trolley during peak hour
4 4 4 9 9 10
Number of passengers per fl ight information display screen during peak hour
153 152 152 143 39 62
Number of passengers per information point during peak hour
460 912 910 1000 486 524
Car parking at terminals
Average daily throughput, short-term car park, cars per day
296 310 542 2192 2647 2580
Notes: Measures of throughput are based on the fi nancial year unless otherwise specifi ed as peak hour or daily, whereas measures of availability and capacity are for the last day of the fi nancial year.
(a) Aerobridges at the international terminal were removed in 2004–05 to enable work on the new terminal.
N/A = not applicable; N/P = not provided

ADELAIDE AIRPORT QUALITY OF SERVICE REPORT: 2004–0520
The number of international passengers arriving and departing during peak hour at Adelaide airport has remained stable at about 910 passengers over the past two years and as a result most objective indicators for the international terminal remained unchanged from last year.
Adelaide airport handled more international baggage in 2004–05, resulting in an increase in the average throughput measure of outbound bags per hour, increasing from 73 in 2003–04 to 114 in 2004–05.
Domestic passengers arriving and departing during peak hour increased slightly in 2004–05 to 1047 from 972 in 2003–04 and 1000 in 2002–03. As a result, most objective indicators for the domestic terminal have remained stable since 2002–03.
The increase in the number of domestic passengers per FID screen during peak hour from 39 in 2003–04 to 62 in 2004–05 can be attributed to a decrease in the number of FID screens from 25 in 2003–04 to 17 in 2004–05.
3.2 Passenger surveyChart 3.1 shows the results for the passenger surveys for the international and domestic terminals at Adelaide airport for 2004–05. Adelaide airport commissioned the Adelaide Institute of TAFE to conduct its passenger surveys. Five hundred survey responses were completed by departing international passengers and 500 questionnaires were completed by passengers departing from the domestic terminal. Adelaide airport advised that some of the passengers surveyed may have used facilities not managed by Adelaide airport because the Qantas-operated terminal facilities are in the same building as the airport-operated ones.
Chart 3.1 Passenger survey results for international and domestic terminals
Check-
in—wait
ing tim
e
Immigr
ation
area
—inb
ound
—wait
ing tim
e
Baggage
inspe
ction
—inb
ound
—wait
ing tim
e
Govern
ment in
specti
on—
outbo
und—
waiting
time
Secu
rity cle
aranc
e—qu
ality o
f searc
h pro
cess
Gate lo
unge
s—qu
ality a
nd av
ailabil
ity of
seati
ng
Gate lo
unge
s—cro
wding
Baggage
recla
im—
waiting
time
Baggage
recla
im—
infor
mation
displ
ay
Baggage
recla
im—
circu
lation
space
Baggage
troll
eys—
finda
bility
Flight
infor
mation
displ
ay scr
eens
Signa
ge an
d wayf
inding
Wash
room
s—sta
ndard
Car pa
rking
—sta
ndard
Car pa
rking
—ava
ilability
Car pa
rking
—tim
e take
n to e
nter
Kerbs
ide sp
ace—
cong
estion
Kerbs
ide dr
op-o
ff and
pick-
up fa
cilitie
s
International Domestic
Very poor
Poor
Satisfactory
Good
Excellent
Ave
rage
rat
ing
(1–5
)
The passenger surveys conducted for the international and domestic terminals for 2004–05 rated both terminals’ facilities as between satisfactory and good. The exception to this was domestic baggage reclaim circulation space which was rated as being just below satisfactory.
The international terminal facilities generally rated slightly higher than the domestic terminal facilities, except for crowding in gate lounges and FID screens.
Check-in times increased in 2004–05. However, passengers continued to rate the check-in times as satisfactory. The average check-in waiting time for passengers interviewed at the domestic terminal was 9 minutes, increasing from 2.2 minutes reported in the previous two years. The average check-in waiting time for passengers interviewed at the international terminal in 2004–05 was 17 minutes, up from 14.2 minutes in 2003–04.

QUALITY OF SERVICE REPORT: 2004–05 ADELAIDE AIRPORT 21
Charts 3.2 and 3.3 show the passenger survey results for international terminal facilities at Adelaide airport from 2000–01 to 2004–05.
Chart 3.2 Passenger survey results for the international terminal immigration inspection and baggage reclaim
Check
-in—
waiting
time
Immigr
ation
area
—inb
ound
—wait
ing tim
e
Bagg
age i
nspe
ction
—inb
ound
—wait
ing tim
e
Gover
nmen
t insp
ectio
n—ou
tboun
d—wait
ing tim
e
Secu
rity cl
earan
ce—
qualit
y of s
earch
proc
ess
Bagg
age r
eclaim
—wait
ing tim
e
Bagg
age r
eclaim
—inf
ormati
on di
splay
Bagg
age r
eclaim
—cir
culat
ion sp
ace
Bagg
age t
rolle
ys—fin
dabil
ity
Very poor
Poor
Satisfactory
Good
Excellent
2000–01 2001–02 2002–03 2003–04 2004–05
Ave
rage
rat
ing
(1–5
)
Chart 3.3 Passenger survey results for the international terminal general facilities and car parks
2000–01 2001–02 2002–03 2003–04 2004–05
Ave
rage
rat
ing
(1–5
)
Gate lo
unge
s—se
ating
qualit
y/ava
ilability
Gate lo
unge
s—cro
wding
Flight
infor
mation
disp
lay sc
reens
Signa
ge an
d way
findin
g
Wash
room
s—sta
ndard
Car pa
rking
—sta
ndard
Car pa
rking
—av
ailabil
ity
Car pa
rking
—tim
e tak
en to
enter
Kerb
side s
pace
—co
nges
tion
Kerb
side d
rop-
off an
d pick
-up fa
cilitie
s
Very poor
Poor
Satisfactory
Good
Excellent

ADELAIDE AIRPORT QUALITY OF SERVICE REPORT: 2004–0522
The passenger survey results for the international terminal facilities over the reported period have generally been stable, ranging from satisfactory to good.
Some ratings in 2004–05 are slightly up on those for 2003–04, which were slightly down on the ratings in previous years.
Chart 3.4 shows the passenger survey results for domestic terminal facilities at Adelaide airport from 2002–03 to 2004–05.
Chart 3.4 Passenger survey results for domestic terminal facilities
Check
-in—
waiting
time
Secu
rity cl
earan
ce—
qualit
y of s
earch
proc
ess
Gate lo
unge
s—qu
ality a
nd av
ailabil
ity of
seati
ng
Gate lo
unge
s—cro
wding
Bagg
age r
eclaim
—wait
ing tim
e
Bagg
age r
eclaim
—inf
ormati
on di
splay
Bagg
age r
eclaim
—cir
culat
ion sp
ace
Bagg
age t
rolle
ys—fin
dabil
ity
Fligh
t infor
mation
disp
lay sc
reen
s
Wash
room
s—sta
ndard
Car pa
rking
—sta
ndard
Car pa
rking
—av
ailabil
ity
Car pa
rking
—tim
e tak
en to
enter
Kerb
side s
pace
—co
nges
tion
Kerb
side d
rop-
off an
d pick
-up f
aciliti
es
Very poor
Poor
Satisfactory
Good
Excellent
2002–03 2003–04 2004–05
Ave
rage
rat
ing
(1–5
)
Over the reported period, the passenger survey results for the domestic terminal facilities have, for the most part, been relatively stable, ranging from satisfactory to good. Since 2002–03, there has been a downward trend in the ratings for baggage reclaim circulation space and time taken to enter the car park. There has been a slight upwards trend in the passenger ratings for the standard of washrooms and the fi ndability of baggage trolleys.

QUALITY OF SERVICE REPORT: 2004–05 ADELAIDE AIRPORT 23
3.3 Airline survey During 2004–05 fi ve domestic and six international airlines operated out of Adelaide airport. This year two domestic airlines and three international airlines responded to the ACCC’s airline survey.
Chart 3.5 shows the average ratings by airlines of airside facilities at Adelaide airport for 2000–01 to 2004–05.
Chart 3.5 Average ratings by airlines of airside facilities
Runways
availa
bility
Runways
stan
dard
Taxiw
ays av
ailabil
ity
Taxiw
ays st
anda
rd
Aprons
availab
ility
Aprons
stand
ard
Gates a
vailab
ilty
Gates s
tanda
rd
Groun
d serv
ice sit
es ava
ilability
Groun
d serv
ice sit
es sta
ndard
Very poor
Poor
Satisfactory
Good
Excellent
2000–01 2001–02 2002–03 2003–04 2004–05
Ave
rage
rat
ing
(1–5
)
In 2004–05 the average airline rating of airside facilities at Adelaide airport ranged from poor to satisfactory. While ratings in 2004–05 were up on those achieved last year, since 2000–01, there has been a downward trend in ratings of airside facilities, except for gates availability and ground service sites standard.
Chart 3.6 shows the average ratings by airlines of international terminal facilities and management responsiveness for Adelaide airport for 2000–01 to 2004–05.

ADELAIDE AIRPORT QUALITY OF SERVICE REPORT: 2004–0524
Chart 3.6 Average ratings by airlines of international terminal facilities and management responsiveness
Aerobri
dge a
vailab
ility
Aerobri
dge s
tanda
rd
Check-
in ava
ilability
Check-
in sta
ndard
Baggage
facili
ties a
vailab
ility
Baggage
facili
ties s
tanda
rd
Manage
ment a
ppro
ach to
conc
erns
Very poor
Poor
Satisfactory
Good
Excellent
2000–01 2001–02 2002–03 2003–04 2004–05
Ave
rage
rat
ing
(1–5
)
Airlines’ average ratings of the international terminal facilities at Adelaide airport ranged from very poor to satisfactory during 2004–05. Except for those for aerobridges and management approach to concerns, which remained stable, ratings for the international terminal facilities were down on those in 2003–04. However, the airlines noted that they expected the ratings of these facilities to improve once the construction of Adelaide airport’s new terminal was complete.
Chart 3.7 shows the average ratings by airlines of domestic terminal facilities at Adelaide airport for 2002–03 to 2004–05.

QUALITY OF SERVICE REPORT: 2004–05 ADELAIDE AIRPORT 25
Chart 3.7 Average ratings by airlines for domestic terminal facilities
Check-
in ava
ilability
Check-
in sta
ndard
Baggage
facili
ties a
vailab
ility
Baggage
facili
ties s
tanda
rd
Very poor
Poor
Satisfactory
Good
Excellent
2002–03 2003–04 2004–05
Ave
rage
rat
ing
(1–5
)
The average rating by airlines for the domestic terminal facilities was generally satisfactory and up from poor in 2003–04.
3.4 Australian Customs Service surveyChart 3.8 shows the ratings by ACS of the facilities at Adelaide airport for 2000–01 to 2004–05.
Chart 3.8 Ratings by ACS of terminal facilities
Arrival -
immigr
ation
—ava
ilability
Arrival—
immigr
ation
—sta
ndard
Arrival—
bagga
ge in
specti
on—
availab
ility
Arrival—
bagga
ge in
specti
on—
stand
ard
Depart
ures—
immigr
ation
—ava
ilability
Depart
ures—
immigr
ation
—sta
ndard
Manage
ment a
ppro
ach to
conc
erns
Very poor
Satisfatory
Good
Excellent
Poor
2000–01 2001–02 2002–03 2003–04 2004–05
Ave
rage
rat
ing
(1–5
)

ADELAIDE AIRPORT QUALITY OF SERVICE REPORT: 2004–0526
The ACS ratings ranged between poor and satisfactory in 2004–05. Most ratings have remained unchanged since 2003–04; however, the rating for management approach decreased signifi cantly, from excellent to satisfactory.
ACS noted that its main concerns about the operational areas at Adelaide airport should be overcome in the near future when it moves into the new terminal which is due to be completed later this year.
In summary:Most objective indicators for Adelaide airport remained unchanged since 2003–04, and have remained stable over the past three years.
Passengers rated Adelaide airport’s international and domestic terminal facilities as between satisfactory and good during 2004–05, with some ratings for the international terminal slightly up on those achieved in 2003–04.
For 2004–05 airlines’ average ratings of the airside facilities at Adelaide airport ranged from poor to satisfactory, while ratings for the international terminal facilities ranged from very poor to satisfactory. The average rating by airlines for the domestic terminal facilities was generally satisfactory. Airline ratings of airside and domestic terminal facilities were generally higher than last year’s, while ratings of the international terminal were down.
ACS rated the facilities at Adelaide airport as between poor and satisfactory, largely unchanged from previous years.

QUALITY OF SERVICE REPORT: 2004–05 BRISBANE AIRPORT 27
4 Brisbane airport
4.1 Runway traffi c—demand and delaysChart 4.1 shows the aircraft traffi c measures for Brisbane airport’s morning peak hour.
Chart 4.1 Peak-hour aircraft traffi c
0
10
20
30
40
50
60
Demand Actual arrivals Rate Peak demand(within the hour)
Max pro rata rate(within the hour)
Max system delay Avg system delay
Jun 2004 AVG
Jul 2004 AVG
Aug 2004 AVG
Sep 2004 AVG
Oct 2004 AVG
Nov 2004 AVG
Dec 2004 AVG
Jan 2005 AVG
Feb 2005 AVG
Mar 2005 AVG
Apr 2005 AVG
May 2005 AVG
Jun 2005 AVG
Source: Airservices Australia
Note: Rate means agreed arrival rate or operational capacity.
Demand, arrivals and agreed rate are measures of aircraft per hour. Delays are in minutes.
Measures are further explained earlier in section 2.
Runway demand was within the OAC in the morning peak hour, with the capacity rate remaining relatively stable over the year. Peak demand decreased during November 2004 but steadily increased to levels previously observed. Peak demand exceeded the measure of capacity shown by the pro rata arrival rate by an average of 30 per cent, up from 28 per cent in 2003–04, but still down on 40 per cent in 2002–03. Delay times have remained low but have shown a slight upward trend towards the end of the period, with the average system delay being 1.4 minutes. This year, the average maximum delay was 4 minutes, up from about 2 minutes last year, but still down on about 6 minutes in 2002–03.

BRISBANE AIRPORT QUALITY OF SERVICE REPORT: 2004–0528
4.2 Objective indicators for quality of serviceTable 4.1 shows the objective indicators for quality of service provided by Brisbane airport for 2002–03 to 2004–05. This is the second year that Brisbane airport has provided objective indicators for the domestic terminal.
Table 4.1 Objective indicators of quality of service
Indicator
Terminal International Domestic
2002–03 2003–04 2004–05 2002–03 2003–04 2004–05
Percentage of international passengers arriving using an aerobridge
92% 100% 100% N/A N/A N/A
Percentage of international passengers departing using an aerobridge
92% 100% 100% N/A N/A N/A
Percentage of hours with more than 80 per cent of check-in desks in use
0% 0% 3% N/P N/P N/P
Number of arriving passengers per inbound immigration desk during peak hour
43 52 50 N/A N/A N/A
Number of arriving passengers per baggage inspection desk during peak hour
47 52 43 N/A N/A N/A
Number of departing passengers per outbound migration desk during peak hour
43 44 52 N/A N/A N/A
Number of departing passengers per security-clearance system during peak hour
215 97 103 N/P 169 261
Number of departing passengers per seat in gate lounges during peak hour
0.6 0.6 0.7 N/P 0.8 1.2
Number of departing passengers per square metre of lounge area during peak hour
N/P 0.1 0.1 N/P 0.1 0.1
Average throughput of outbound baggage system, bags per hour
262 308 365 N/P N/P 82
Number of passengers per baggage trolley during peak hour
N/P 1.5 2 N/P 18 3
Number of passengers per fl ight information display screen during peak hour
N/P 10.5 11 N/P 25 35
Number of passengers per information point during peak hour
N/P 247 259 N/P 179 268
Car parking at terminals
Average daily throughput, short-term car park, cars per day
1679 1811 2062 3181 3171 3223
Average daily throughput, long-term car park, cars per day
N/A N/A N/A N/P 520 585
Notes: Measures of throughput are based on the fi nancial year unless otherwise specifi ed as peak hour or daily, whereas measures of availability and capacity are for the last day of the fi nancial year.
N/A = not applicable; N/P = not provided

QUALITY OF SERVICE REPORT: 2004–05 BRISBANE AIRPORT 29
The number of passengers arriving at the international terminal during peak hour decreased slightly during 2004–05 from 1347 in 2003–04 to 1297. However, the number of departing passengers during peak hour increased in 2004–05 to 1033 from 873 in 2003–04. This increase resulted in most of the objective indicators for this category of passengers showing an increase in the number of passengers per service indicator.
The number of arriving passengers per baggage inspection desk during peak hour decreased from 52 in 2003–04 to 43 in 2004–05. This was due to an increase in the number of baggage inspection desks in the international terminal from 26 in 2003–04 to 30 in 2004–05.
Brisbane airport handled more pieces of international baggage in 2004–05, resulting in the average throughput measure of outbound bags per hour increasing from 308 in 2003–04 to 365 in 2004–05.
The number of domestic passengers arriving and departing during peak hour increased in 2004–05 to 1073 from 717 in 2003–04. This resulted in most of the objective indicators for the domestic terminal showing an increase in the number of passengers per service indicator.
The exception to this was a decrease in the indicator of number of passengers per baggage trolley during peak hour from 18 in 2003–04 to 3 in 2004–05, due to the number of working accessible baggage trolleys in the domestic terminal increasing from 40 to 350.
4.3 Passenger surveyChart 4.2 shows the results for the passenger surveys for the international and domestic terminals at Brisbane airport for 2004–05. Brisbane airport engaged market research fi rm, Enhance Management, to survey its passengers. Five hundred and seven passengers were interviewed within the terminals or car parks with a further 75 interviewed near taxi ranks.
Chart 4.2 Passenger survey results for international and domestic terminals
International Domestic
Ave
rage
rat
ing
(1–5
)
Check-
in—wait
ing tim
e
Immigr
ation
area
—inb
ound
—wait
ing tim
e
Baggage
inspe
ction
—inb
ound
—wait
ing tim
e
Govern
ment in
specti
on—
outbo
und—
waiting
time
Secu
rity cle
aranc
e—qu
ality o
f searc
h pro
cess
Gate lo
unge
s—qu
ality a
nd av
ailabil
ity of
seati
ng
Gate lo
unge
s—cro
wding
Baggage
recla
im—
waiting
time
Baggage
recla
im—
infor
mation
displ
ay
Baggage
recla
im—
circu
lation
space
Baggage
troll
eys—
finda
bility
Flight
infor
mation
displ
ay scr
eens
Signa
ge an
d wayf
inding
Wash
room
s—sta
ndard
Car pa
rking
—sta
ndard
Car pa
rking
—ava
ilability
Car pa
rking
—tim
e take
n to e
nter
Kerbs
ide sp
ace—
cong
estion
Kerbs
ide dr
op-o
ff and
pick-
up fa
cilitie
s
Taxi fa
cilitie
s—sta
ndard
Very poor
Poor
Satisfactory
Good
Excellent
The ratings between the international and domestic terminals were generally similar, with all terminal facilities regarded as being above satisfactory and mostly rating between good and excellent.
Ratings for the landside indicators of kerbside space and congestion, kerbside drop-off and pick-up facilities and the standard of taxi facilities received ratings between satisfactory and good for both the international and domestic terminals.

BRISBANE AIRPORT QUALITY OF SERVICE REPORT: 2004–0530
The average check-in waiting time during peak hour for passengers interviewed at the international terminal was 8 minutes, which was down from the waiting time of 9.6 minutes in 2003–04. For passengers interviewed at the domestic terminal, the average check-in waiting time during peak hour was 3.1 minutes, which was signifi cantly lower than the waiting time of 10.1 minutes in 2003–04. However, survey results were largely unchanged.
Charts 4.3 and 4.4 show the passenger survey results for the international terminal at Brisbane airport from 1997–98 to 2004–05.
Chart 4.3 Passenger survey results for the international terminal immigration inspection and baggage reclaim
Check-
in—wait
ing tim
e
Immigr
ation
area
—inb
ound
—wait
ing tim
e
Baggage
inspe
ction
—inb
ound
—wait
ing tim
e
Govern
ment in
specti
on—
outbo
und—
waiting
time
Secu
rity cle
aranc
e—qu
ality o
f searc
h pro
cess
Baggage
recla
im—
waiting
time
Baggage
recla
im—
infor
mation
displ
ay
Baggage
recla
im—
circu
lation
space
Baggage
troll
eys—
finda
bility
Very poor
Poor
Satisfactory
Good
Excellent
Ave
rage
rat
ing
(1–5
)
1997–98 1998–99 1999–2000 2000–01 2001–02 2002–03 2003–04 2004–05
Chart 4.4 Passenger survey results for the international terminal general facilities and car park
Gate lo
unge
s—sea
ting q
uality
/availa
bity
Gate lo
unge
s—cro
wding
Flight
infor
mation
displ
ay scr
eens
Signa
ge an
d wayf
inding
Wash
room
s—sta
ndard
Car pa
rking
—sta
ndard
Car pa
rking
—ava
ilability
Kerbs
ide co
ngest
ion
Kerbs
ide dr
op-o
ff and
pick-
up fa
cilitie
s
Taxi fa
cilitie
s—sta
ndard
Ave
rage
rat
ing
(1–5
)
1997–98 1998–99 1999–2000 2000–01 2001–02 2002–03 2003–04 2004–05
Very poor
Poor
Satisfactory
Good
Excellent

QUALITY OF SERVICE REPORT: 2004–05 BRISBANE AIRPORT 31
Ratings of the international terminal facilities at Brisbane airport have been stable over the reporting period, with ratings generally between good and excellent. Exceptions to this were ratings for the landside facilities of kerbside facilities and taxi facilities, for which results were slightly down in 2004–05 and less than good.
Chart 4.5 shows the passenger survey results for domestic terminal facilities at Brisbane airport from 2002–03 to 2004–05.
Chart 4.5 Passenger survey results for domestic terminal facilities
Check-
in—wait
ing tim
e
Secu
rity cle
aranc
e—qu
ality o
f searc
h pro
cess
Gate lo
unge
s—qu
ality a
nd av
ailabil
ity of
seati
ng
Gate lo
unge
s—cro
wding
Baggage
recla
im—
waiting
time
Baggage
recla
im—
infor
mation
displ
ay
Baggage
recla
im—
circu
lation
space
Baggage
troll
eys—
finda
bility
Flight
infor
mation
displ
ay scr
eens
Signa
ge an
d wayf
inding
Wash
room
s—sta
ndard
Car pa
rking
—sta
ndard
Car pa
rking
—ava
ilability
Car pa
rking
—tim
e take
n to e
nter
Kerbs
ide sp
ace—
cong
estion
Kerbs
ide dr
op-o
ff and
pick-
up fa
cilitie
s
Taxi fa
cilitie
s—sta
ndard
Very poor
Poor
Satisfactory
Good
Excellent
2002–03 2003–04 2004–05
Ave
rage
rat
ing
(1–5
)
Over the past two years, passenger ratings of the domestic terminal facilities at Brisbane airport have been relatively stable, at good. The exception to this has been the ratings of the kerbside and taxi facilities, which have rated as satisfactory. While ratings were still good this year, survey results for the domestic terminals were slightly down on last year’s. The exceptions to this were the availability of baggage trolleys and car parking, which have improved this year.
4.4 Airline surveyDuring 2004–05, 21 international airlines operated out of Brisbane airport’s international terminal, and fi ve domestic carriers used the domestic terminal facilities. This year, eight international airlines responded to the ACCC’s airline survey. No responses were provided for the domestic terminal facilities at Brisbane airport. Qantas and Virgin Blue operate their own areas of the domestic terminal under leasing arrangements with Brisbane airport. Jetstar, Alliance and National Jet use the common-user section.
Chart 4.6 shows the average ratings by airlines of airside facilities at Brisbane airport for 1997–98 to 2004–05.

BRISBANE AIRPORT QUALITY OF SERVICE REPORT: 2004–0532
Chart 4.6 Average ratings by airlines of airside facilities
Runw
ays a
vailab
ility
Runw
ays s
tanda
rd
Taxiw
ays a
vailab
ility
Taxiw
ays s
tanda
rd
Apro
ns av
ailabil
ity
Apro
ns st
anda
rd
Gates a
vailab
ilty
Gates s
tanda
rd
Groun
d ser
vice s
ites a
vailab
ility
Groun
d ser
vice s
ites s
tanda
rd
Very poor
Poor
Satisfactory
Good
Excellent
Ave
rage
rat
ing
(1–5
)
1997–98 1998–99 1999–2000 2000–01 2001–02 2002–03 2003–04 2004–05
The average airline rating for airside facilities at Brisbane airport for 2004–05 was good. In general, this year’s ratings were slightly lower than in 2003–04. Since 1997–98, there has been a downward trend in the ratings for taxiways availability, aprons availability and standard and gates standard.
Chart 4.7 shows the average ratings by airlines of international terminal facilities and management responsiveness for Brisbane airport for 1997–98 to 2004–05.
Chart 4.7 Average ratings by airlines of international terminal facilities and management responsiveness
Aero
bridg
e ava
ilabilit
y
Aero
bridg
e stan
dard
Check
-in av
ailabil
ity
Check
-in st
anda
rd
Bagg
age f
acilit
ies av
ailabil
ity
Bagg
age f
acilit
ies st
anda
rd
Manag
emen
t app
roac
h to c
once
rns
Very poor
Poor
Satisfactory
Good
Excellent
Ave
rage
rat
ing
(1–5
)
1997–98 1998–99 1999–2000 2000–01 2001–02 2002–03 2003–04 2004–05
Airline ratings of the international terminal facilities and management responsiveness increased during 2004–05, with ratings ranging between satisfactory and good. Since 1997–98, there has been a downward trend in the ratings for check-in availability and baggage facilities availability.

QUALITY OF SERVICE REPORT: 2004–05 BRISBANE AIRPORT 33
4.5 Australian Customs Service surveyChart 4.89 shows the ratings by ACS of the facilities at Brisbane airport for 1998–99 to 2004–05.
Chart 4.8 Ratings by ACS of terminal facilities
Arriva
l—im
migrati
on—
availa
bility
Arriva
l—im
migrati
on—
stand
ard
Arriva
l—ba
ggage
insp
ectio
n—av
ailabil
ity
Arriva
l—ba
ggage
insp
ectio
n—sta
ndard
Depart
ures—
immigr
ation
—av
ailabil
ity
Depart
ures—
immigr
ation
—sta
ndard
Manage
ment a
ppro
ach to
conc
erns
Very poor
Poor
Satisfactory
Good
Excellent
Ave
rage
rat
ing
(1–5
)
1998–99 1999–2000 2000–01 2001–02 2002–03 2003–04 2004–05
ACS’s ratings of the facilities at Brisbane airport have increased over the past year, ranging between satisfactory and good during 2004–05.
ACS noted that, while sustained high growth rates in passenger numbers has continued to lead to crowding in the customs inspection areas over the past year, Brisbane airport has undertaken minor capital works which have improved the space available to process passengers. This has also been complemented by a review of signage, and changes to queuing infrastructure. ACS mentioned that Brisbane airport has taken a proactive approach to responding to the ACS’s concerns.
In summary: Runway demand was within operationally agreed capacity in the morning peak hour. Delay times remained low at Brisbane airport during 2004–05, with the average system delay averaging 1.4 minutes. This year the average maximum delay was 4 minutes.
Most objective indicators for both the international and domestic terminals showed a higher number of passengers per service indicator, due to an increase in peak hour passenger numbers.
Passengers generally rated the domestic and international terminal facilities as between good and excellent in 2004–05. Passenger ratings for international terminal facilities have been stable over the reporting period, generally rating good or better.
The average airline rating for airside facilities at Brisbane airport since 1997–98 has been consistently good. Airline ratings of the international terminal facilities and management responsiveness increased during 2004–05, with ratings ranging between satisfactory and good.
ACS’s ratings for Brisbane airport’s facilities improved markedly since last year, rating between satisfactory and good during 2004–05.
9 In the 2003–04 report, the rating for management approach to concerns was incorrectly reported as poor rather than satisfactory. This is corrected in this report.

CANBERRA AIRPORT QUALITY OF SERVICE REPORT: 2004–0534
5 Canberra airport
5.1 Objective indicators for quality of serviceWhile Canberra airport was able to provide data for some objective measures, as seen in tables A11 and A12 in appendix 2, it has not provided the number of passengers arriving and departing during peak hour. As a result, there is insuffi cient information to provide a table of objective measures for quality of service.
Canberra airport has previously undertaken to improve the quality and availability of data needed for quality of service monitoring as its systems and business processes evolve. During 2004–05 Canberra airport procured a new information system that will provide additional data for quality of service monitoring in the next reporting period.
5.2 Passenger surveyAs a Phase II airport, Canberra airport is not required to undertake passenger surveys.
5.3 Airline surveyDuring 2004–05 three airlines operated out of Canberra airport. Of these airlines, two responded to the airline survey, with only one response for the domestic terminal.
Chart 5.1 shows the average ratings by airlines of airside facilities at Canberra airport for 2000–01 to 2004–05.
Chart 5.1 Average ratings by airlines of airside facilities
Runw
ays a
vailab
ility
Runw
ays s
tanda
rd
Taxiw
ays a
vailab
ility
Taxiw
ays s
tanda
rd
Apro
ns av
ailabil
ity
Apro
ns st
anda
rd
Gates a
vailab
ilty
Gates s
tanda
rd
Groun
d ser
vice s
ites a
vailab
ility
Groun
d ser
vice s
ites s
tanda
rd
Very poor
Poor
Satisfactory
Good
Excellent
2000–01 2001–02 2002–03 2003–04 2004–05
Ave
rage
rat
ing
(1–5
)
Airline ratings of the airside facilities at Canberra airport generally either improved or remained stable during 2004–05, ranging between satisfactory and good. However, airlines rated the availability and standard of ground service sites as poor, down from satisfactory ratings in 2000–01. Canberra airport advised that additional ground service sites had been offered to airlines on existing terms; but that no airline had accepted this offer.

QUALITY OF SERVICE REPORT: 2004–05 CANBERRA AIRPORT 35
Chart 5.2 shows the ratings of domestic terminal facilities and management responsiveness at Canberra airport for 2002–03 to 2004–05.
Chart 5.2 Average ratings by airlines for domestic terminal facilities and management responsiveness
Aerobr
idge a
vailab
ility
Aerobr
idge s
tanda
rd
Check
-in av
ailabil
ity
Check
-in st
anda
rd
Bagg
age f
aciliti
es av
ailabil
ity
Bagg
age f
aciliti
es st
anda
rd
Manag
emen
t app
roac
h to c
once
rns
Very poor
Poor
Satisfactory
Good
Excellent
2002–03 2003–04 2004–05
Ave
rage
rat
ing
(1–5
)
For the most part, the domestic terminal facilities at Canberra airport were rated as good in 2004–05. However, the standard of baggage facilities and management’s approach to concerns were rated as satisfactory. The rating for the standard of aerobridges increased markedly during 2004–05 from poor to good. The rating of aerobridge availability fell from excellent to good in 2004–05. However, Canberra airport advised that there had been no change in the availability of the aerobridges provided to the sole user of these facilities. The rating for standard of baggage facilities fell from excellent in 2002–03 to satisfactory in 2004–05.

CANBERRA AIRPORT QUALITY OF SERVICE REPORT: 2004–0536
5.4 Australian Customs Service surveyChart 5.3 shows the ratings by ACS of the facilities at Canberra airport for 2002–03 to 2004–05.
Chart 5.3 Ratings by ACS of terminal facilities
Arrival—
Immigr
ation
—ava
ilability
Arrival—
immigr
ation
—sta
ndard
Arrival—
bagga
ge in
specti
on—
availab
ility
Arrival—
bagga
ge in
specti
on—
stand
ard
Depart
ures—
immigr
ation
—ava
ilability
Depart
ures—
immigr
ation
—sta
ndard
Manage
ment a
ppro
ach to
ACS con
cerns
Very poor
Poor
Satisfactory
Good
Excellent
2002–03 2003–04 2004–05
Ave
rage
rat
ing
(1–5
)
ACS’s ratings ranged between satisfactory and good in 2004–05. In general, ratings over the past year remained stable; however, the ratings for availability and standard of baggage inspection facilities for arrivals increased from poor to satisfactory.
Canberra airport advised that it provided facilities for the ACS for the fi rst time in 2004–05 to meet the introduction of the fi rst international RPT airline service into Canberra airport.
In summary:Canberra airport has not been able to provide complete data to enable the ACCC to calculate objective measures.
Airline ratings of the airside facilities at Canberra airport generally either improved or remained stable during 2004–05, ranging between satisfactory and good. For the most part, the domestic terminal facilities at Canberra airport were rated as good.
ACS’s ratings ranged between satisfactory and good in 2004–05.

QUALITY OF SERVICE REPORT: 2004–05 DARWIN AIRPORT 37
6 Darwin airport
6.1 Objective indicators for quality of serviceDarwin airport has an integrated terminal serving both international and domestic fl ights.
Table 6.1 shows the objective indicators for quality of service provided at Darwin airport over the period 2002–03 to 2004–05.
Table 6.1 Objective indicators for quality of service
Indicator
Terminal International Domestic
2002–03 2003–04 2004–05 2002–03 2003–04 2004–05
Percentage of international passengers arriving using an aerobridge
N/P N/P N/P N/A N/A N/A
Percentage of international passengers departing using an aerobridge
N/P N/P N/P N/A N/A N/A
Percentage of hours with more than 80 per cent of check-in desks in use
N/A N/A N/A N/A N/A N/A
Number of arriving passengers per inbound immigration desk during peak hour
28 20 33 N/A N/A N/A
Number of arriving passengers per baggage inspection desk during peak hour
20 15 24 N/A N/A N/A
Number of departing passengers per outbound migration desk during peak hour
37 32 40 N/A N/A N/A
Number of departing passengers per security-clearance system during peak hour
220 160 200 470 338 338
Number of departing passengers per seat in gate lounges during peak hour
1.0 0.7 0.9 1.2 1.7 1.1 to 2.4(a)
Number of departing passengers per square metre of lounge area during peak hour
0.3 0.2 0.3 0.5 0.6 0.4 to 0.6(a)
Average throughput of outbound baggage system, bags per hour
N/A N/A N/A N/A N/A N/A
Number of passengers per baggage trolley during peak hour
3 2 3
Number of passengers per fl ight information display screen during peak hour
220 160 N/A 47 67.5 34.6(b)
Number of passengers per information point during peak hour
440 320 N/A 55 79 75(b)
Car parking at terminals
Average daily throughput, short-term car park, cars per day
603 672 772
Notes: Measures of throughput are based on the fi nancial year unless otherwise specifi ed as peak hour or daily, whereas measures of availability and capacity are for the last day of the fi nancial year.
(a) During 2004–05 Darwin airport completed its ‘swing lounge’, which operates to open the entire terminal (including the international area) for domestic passengers during peak domestic periods when there are no international fl ights.
(b) Before 2004–05 there was a separate departure/arrival area for international use only and as such Darwin airport was able to provide the split for FID screens and information points between the international and domestic terminals. During 2004–05 Darwin airport completed its ‘swing lounge’, which operates so that, during peak domestic periods when there are no international fl ights, the entire terminal facility (including the international area) is opened up for domestic passengers. The area is closed to accommodate only international passengers during the times these fl ights operate. As a result, Darwin airport has not provided the split of FID screens and information points between the international and domestic terminals.
N/A = not applicable; N/P = not provided

DARWIN AIRPORT QUALITY OF SERVICE REPORT: 2004–0538
The number of arriving and departing international passengers during peak hour increased in 2004–05 to 460 from 380 in 2003–04. This resulted in most of the objective indicators for the international terminal showing an increase in the number of passengers per service. In general, the objective indicators for the international terminal decreased in 2003–04 and then increased in 2004–05, following the trend in passenger numbers over this time.
The number of domestic passengers arriving and departing in peak hour is unchanged since last year at 1350. However, the number of departing passengers per seat in gate lounges during peak hour increased in 2004–05 due to a decrease in the number of seats in the domestic terminal from 397 in 2003–04 to 285 in 2004–05. This was caused by the current refurbishment of the terminal; however, due to the construction of the ‘swing lounge’, there can be up to 591 seats available for domestic use. Darwin airport advised that new seating will be purchased in the near future.
6.2 Passenger surveyAs a Phase II airport, Darwin airport is not required to undertake passenger surveys.
6.3 Airline surveyDuring 2004–05 four international and three domestic airlines operated out of Darwin airport. This year two airlines responded to the airline survey.
Chart 6.1 shows the average ratings by airlines of airside facilities at Darwin airport for 2000–01 to 2004–05.
Chart 6.1 Average ratings by airlines of airside facilities
Runw
ays a
vailab
ility
Runw
ays s
tanda
rd
Taxiw
ays a
vailab
ility
Taxiw
ays s
tanda
rd
Apron
s ava
ilability
Apron
s stan
dard
Gates a
vailab
ilty
Gates s
tanda
rd
Groun
d ser
vice s
ites a
vailab
ility
Groun
d ser
vice s
ites s
tanda
rd
Very poor
Poor
Satisfactory
Good
Excellent
Ave
rage
rat
ing
(1–5
)
2000–01 2001–02 2002–03 2003–04 2004–05
The average airline ratings of the airside facilities at Darwin airport ranged from less than satisfactory to good during 2004–05. The average ratings for availability and standard of ground service sites increased markedly in 2004–05, while the rating for the standard of aprons decreased from good to above poor. Since 2000–01, except for ground service sites, taxiways and gates availability, ratings have decreased.
Chart 6.2 shows the average ratings by airlines of terminal facilities and management responsiveness for Darwin airport for 2000–01 to 2004–05.

QUALITY OF SERVICE REPORT: 2004–05 DARWIN AIRPORT 39
Chart 6.2 Average ratings by airlines of terminal facilities and management responsiveness
Aerobri
dge s
tanda
rd
Check-
in ava
ilability
Check-
in sta
ndard
Baggage
facili
ties a
vailab
ility
Baggage
facili
ties s
tanda
rd
Manage
ment a
ppro
ach to
conc
erns
Very poor
Poor
Satisfactory
Good
Excellent
Aerobri
dge a
vailab
ility
Ave
rage
rat
ing
(1–5
)
2000–01 2001–02 2002–03 2003–04 2004–05
The average airline ratings of the terminal facilities and management responsiveness ranged from poor to good during 2004–05. In general, ratings this year either increased or remained stable when compared with 2003–04 ratings. Ratings in 2004–05 for the availability of baggage facilities decreased from satisfactory to poor. Darwin airport advised that it is currently upgrading this facility.
The ratings for check-in facilities increased markedly in 2004–05, with the ratings for availability and standard increasing from poor and very poor, respectively, to good.
Since 2000–01 ratings for aerobridges and check-in have improved; whereas ratings for baggage facilities have fallen.

DARWIN AIRPORT QUALITY OF SERVICE REPORT: 2004–0540
6.4 Australian Customs Service surveyChart 6.3 shows the ratings by ACS of the facilities at Darwin airport for 2000–01 to 2004–05.
Chart 6.3 Ratings by ACS of terminal facilities
Arrival—
immigr
ation
—ava
ilability
Arrival—
immigr
ation
—sta
ndard
Arrival—
bagga
ge in
specti
on—
availab
ility
Arrival—
bagga
ge in
specti
on—
stand
ard
Depart
ures—
immigr
ation
—ava
ilability
Depart
ures—
immigr
ation
—sta
ndard
Manage
ment a
ppro
ach to
con
cerns
Very poor
Poor
Satisfactory
Good
Excellent
Ave
rage
rat
ing
(1–5
)
2000–01 2001–02 2002–03 2003–04 2004–05
ACS’s ratings for Darwin airport decreased during 2004–05, with ratings ranging between poor and satisfactory. Ratings for the availability and standard of baggage inspection facilities for arrivals decreased from good to poor, with ACS noting that there is poor circulation and limited space for processing passengers, with little or no privacy for passengers who are undergoing an examination. ACS noted that this area is currently undergoing refurbishment.
In summary:Most objective indicators for the international terminal showed an increase in the number of passengers per service indicator, due to an increase in peak-hour passenger numbers.
The average airline ratings of the airside and terminal facilities at Darwin airport ranged from less than satisfactory to good during 2004–05. In general, ratings of the terminal facilities and management responsiveness ranged from poor to good and either improved or remained stable when compared with the 2003–04 ratings.
ACS rated Darwin airport’s facilities as poor or satisfactory.

QUALITY OF SERVICE REPORT: 2004–05 MELBOURNE AIRPORT 41
7 Melbourne airport
7.1 Runway traffi c—demand and delaysAir traffi c measures for Melbourne airport’s morning peak are shown in chart 7.1.
Chart 7.1 Peak-hour air traffi c
0
10
20
30
40
50
60
Demand Actual arrivals Rate Peak demand
(within the hour)
Max pro rata rate
(within the hour)
Max system delay Avg system delay
Jun 2004 AVG
Jul 2004 AVG
Aug 2004 AVG
Sep 2004 AVG
Oct 2004 AVG
Nov 2004 AVG
Dec 2004 AVG
Jan 2005 AVG
Feb 2005 AVG
Mar 2005 AVG
Apr 2005 AVG
May 2005 AVG
Jun 2005 AVG
Source: Airservices Australia
Note: Rate means agreed arrive rate or operational capacity.
Demand, arrivals and agreed rate are measures of aircraft per hour. Delays are in minutes.
Measures are further explained earlier in section 2.
Runway demand was within the operationally agreed capacity in all months except for April 2005, when runway demand equalled OAC. This was the month Melbourne airport closed its north–south runway to complete works for the impending arrival of the Airbus A380. Peak-hour demand fl uctuated during 2004–05, with peak demand exceeding the pro rata arrival rate by an average of 38 per cent, down from 41 per cent in 2003–04 and 48 per cent in 2002–03. Delay times have remained low; on average being 3.6 minutes. In 2004–05 the average maximum system delay time was 10 minutes.

MELBOURNE AIRPORT QUALITY OF SERVICE REPORT: 2004–0542
7.2 Objective indicators for quality of serviceTable 7.1 shows the objective indicators for quality of service provided at Melbourne airport for the period 2002–03 to 2004–05.
Table 7.1 Objective indicators for quality of service
Indicator
Terminal International Domestic
2002–03 2003–04 2004–05 2002–03 2003–04 2004–05
Percentage of international passengers arriving using an aerobridge
100% 100% 99% N/A N/A N/A
Percentage of international passengers departing using an aerobridge
100% 100% 99% N/A N/A N/A
Percentage of hours with more than 80 per cent of check-in desks in use
0% 0% 1% N/P N/P N/P
Number of arriving passengers per inbound immigration desk during peak hour
38 53 62 N/A N/A N/A
Number of arriving passengers per baggage inspection desk during peak hour
62 86 93 N/A N/A N/A
Number of departing passengers per outbound migration desk during peak hour
64 71 92 N/A N/A N/A
Number of departing passengers per security-clearance system during peak hour
385 426 414 N/P 231 248
Number of departing passengers per seat in gate lounges during peak hour
0.5 0.6 0.8 N/P 1.1 1.0
Number of departing passengers per square metre of lounge area during peak hour
0.3 0.3 0.4 N/P 0.3 0.3
Average throughput of outbound baggage system, bags per hour
256 276 310 N/P N/P N/P
Number of passengers per baggage trolley during peak hour
1 2 1 N/P 13 14
Number of passengers per fl ight information display screen during peak hour
32 40 47 N/P 51 53
Number of passengers per information point during peak hour
2141 2660 3139 N/P N/P N/P
Car parking at terminals
Average daily throughput, short-term car park, cars per day
6798 7307 7448
Average daily throughput, long-term car park, cars per day
958 1131 1144
Notes: Measures of throughput are based on the fi nancial year unless otherwise specifi ed as peak hour or daily, whereas measures of availability and capacity are for the last day of the fi nancial year.
N/A = not applicable; N/P = not provided
Since 2002–03 there has been a decline in the per passenger objective indicators for Melbourne airport which has been primarily driven by an increase in passenger numbers during each period, rather than a reduction in available capacity.

QUALITY OF SERVICE REPORT: 2004–05 MELBOURNE AIRPORT 43
This year the number of arriving and departing passengers during peak hour for the international terminal increased to 3139, up from 2660 in 2003–04. This resulted in most of the objective indicators for the international terminal showing an increase in the number of passengers per service indicator.
However, there was a decrease in the number of departing passengers per security-clearance system during peak hour from 426 to 414, due to Melbourne airport increasing the number of security-clearance systems in the international terminal from three to four in November 2004. There was also a decrease in the number of passengers per baggage trolley during peak hour in the international terminal from two to one, due to the number of baggage trolleys available increasing in December 2004 from 1500 to 2350.
This year there was an increase in the number of arriving and departing passengers during peak hour for the domestic terminal, increasing from 1922 in 2003–04 to 2030 in 2004–05. This resulted in the observed objective indicators for the domestic terminal showing an increase in the number of passengers per service indicator.
7.3 Passenger surveyChart 7.2 shows the passenger survey results for the international and domestic terminals at Melbourne airport for 2004–05.
Melbourne airport’s passenger surveys are administered by Melbourne airport’s survey staff, who are accredited under the interviewer quality control scheme. About 2000 departing and arriving passengers were interviewed during the year for each terminal. Melbourne airport also interviewed about 820 users of the short-term and long-term car parks throughout the year.
Chart 7.2 Passenger survey results for the international and domestic terminals
Check
-in—
waiting
time
Immigr
ation
area
—inb
ound
—wait
ing tim
e
Bagg
age i
nspe
ction
—inb
ound
—wait
ing tim
e
Gover
nmen
t insp
ectio
n—ou
tboun
d—wait
ing tim
e
Secu
rity cl
earan
ce—
qualit
y of s
earch
proc
ess
Gate lo
unge
s—qu
ality a
nd av
ailabil
ity of s
eatin
g
Gate lo
unge
s—cro
wding
Bagg
age r
eclaim
—wait
ing tim
e
Bagg
age r
eclaim
—inf
ormati
on di
splay
Bagg
age r
eclaim
—cir
culat
ion sp
ace
Bagg
age t
rolle
ys—fin
dabil
ity
Fligh
t infor
mation
disp
lay sc
reen
s
Signa
ge an
d way
findin
g
Wash
room
s—sta
ndard
Car pa
rking
—sta
ndard
Car pa
rking
—av
ailabil
ity
Car pa
rking
—tim
e tak
en to
enter
Kerb
side d
rop-
off an
d pick
-up f
acilit
ies
Very poor
Poor
Satisfactory
Good
Excellent
International Domestic
Ave
rage
rat
ing
(1–5
)
In general, passenger ratings of the international and domestic terminals at Melbourne airport were good, with no signifi cant difference in the ratings between the international and domestic terminals.
The average check-in waiting time for passengers interviewed at the international terminal has been stable over the past three years, being reported as 9.8 minutes in 2004–05, 9.6 minutes in 2003–04 and 9.9 minutes in 2002–03.
This year the average check-in waiting time for passengers interviewed at Melbourne airport’s domestic terminal was 5.5 minutes, which is down on the time reported in the past two years: 7.1 minutes in 2003–04 and 6.3 minutes in 2002–03.

MELBOURNE AIRPORT QUALITY OF SERVICE REPORT: 2004–0544
Charts 7.3 and 7.4 show the passenger survey results for the international terminals at Melbourne airport for the period 1997–98 to 2004–05.
Chart 7.3 Passenger survey results for the international terminal immigration inspection and baggage reclaim facilities
Check
-in—
waiting
time
Immigr
ation
area
—inb
ound
—wait
ing tim
e
Bagg
age i
nspe
ction
—inb
ound
—wait
ing tim
e
Gover
nmen
t insp
ectio
n—ou
tboun
d—wait
ing tim
e
Secu
rity c
learan
ce—
qualit
y of s
earch
proc
ess
Bagg
age r
eclaim
—wait
ing tim
e
Bagg
age r
eclaim
—inf
ormati
on di
splay
Bagg
age r
eclaim
—cir
culat
ion sp
ace
Bagg
age t
rolle
ys—fin
dabil
ity
Very poor
Poor
Satisfactory
Good
Excellent
Ave
rage
rat
ing
(1–5
)
1997–98 1998–99 1999–2000 2000–01 2001–02 2002–03 2003–04 2004–05
Chart 7.4 Passenger survey results for the international terminal general facilities and car park
Gate lo
unge
s—se
ating
qualit
y/ava
ilabilit
y
Gate lo
unge
s—cro
wding
Fligh
t infor
mation
disp
lay sc
reen
s
Signa
ge an
d way
findin
g
Wash
room
s—sta
ndard
Car pa
rking
—sta
ndard
Car pa
rking
—av
ailabil
ity
Kerb
side d
rop-
off an
d pick
-up f
acilit
ies
Very poor
Poor
Satisfactory
Good
Excellent
Ave
rage
rat
ing
(1–5
)
1997–98 1998–99 1999–2000 2000–01 2001–02 2002–03 2003–04 2004–05
Over the reporting period, Melbourne airport’s international terminal facilities have achieved high and stable ratings from passengers; on average rating good. The exceptions to this have been the ratings for baggage reclaim circulation space and car parking availability, which have achieved ratings between satisfactory and good.

QUALITY OF SERVICE REPORT: 2004–05 MELBOURNE AIRPORT 45
Melbourne airport advised that it is constructing a fi fth baggage reclaim carousel, which is due to be available in June 2006. In addition, an extra 2267 car park spaces were made available in June 2005, with the full opening of a new multi-level car park and additional long-term car parking spaces.
Chart 7.5 shows the passenger survey results for domestic terminal facilities at Melbourne airport from 2002–03 to 2004–05.
Chart 7.5 Passenger survey results for domestic terminal facilities
Check
-in—
waiting
time
Secu
rity cl
earan
ce—
qualit
y of se
arch p
roce
ss
Gate lo
unge
s—qu
ality a
nd av
ailabil
ity of
seati
ng
Gate lo
unge
s—cro
wding
Bagg
age r
eclaim
—wait
ing tim
e
Bagg
age r
eclaim
—cir
culat
ion sp
ace
Bagg
age t
rolle
ys—fin
dabil
ity
Flight
infor
mation
disp
lay sc
reens
Signa
ge an
d way
findin
g
Wash
room
s—sta
ndard
Very poor
Poor
Satisfactory
Good
Excellent
Ave
rage
rat
ing
(1–5
)
2002–03 2003–04 2004–05
Over the reporting period, passenger ratings of the domestic terminal facilities at Melbourne airport have been relatively stable, in general rating as good, with lower results for baggage reclaim.
7.4 Airline surveyDuring 2004–05, 23 international airlines operated out of Melbourne airport’s international terminal, while fi ve domestic airlines used the domestic terminal facilities, only two of which use domestic terminal facilities provided by Melbourne airport.
This year 10 airlines responded to the airline survey—eight for the international terminal and two for the domestic terminal.
Chart 7.6 shows the average ratings by airlines of airside facilities at Melbourne airport for 1997–98 to 2004–05.

MELBOURNE AIRPORT QUALITY OF SERVICE REPORT: 2004–0546
Chart 7.6 Average ratings by airlines of airside facilities
Runways
availa
bility
Runways
stan
dard
Taxiw
ays av
ailabil
ity
Taxiw
ays st
anda
rd
Aprons
availab
ility
Aprons
stand
ard
Gates a
vailab
ilty
Gates s
tanda
rd
Groun
d serv
ice sit
es ava
ilability
Groun
d serv
ice sit
es sta
ndard
Very poor
Poor
Satisfactory
Good
Excellent
Ave
rage
rat
ing
(1–5
)
1997–98 1998–99 1999–2000 2000–01 2001–02 2002–03 2003–04 2004–05
Airlines rated airside facilities at Melbourne airport as satisfactory during 2004–05. Ratings were generally down on those achieved last year, except for ground service sites, which showed a slight increase. Since 1997–98, ratings on all measures of airside facilities have fallen.
Chart 7.7 shows the average ratings by airlines of international terminal facilities and management responsiveness for Melbourne airport for 1997–98 to 2004–05.
Chart 7.7 Average ratings by airlines of international terminal facilities and management responsiveness
Aerobri
dge a
vailab
ility
Aerobri
dge s
tanda
rd
Check-
in ava
ilability
Check-
in sta
ndard
Baggage
facili
ties a
vailab
ility
Baggage
facili
ties s
tanda
rd
Manage
ment a
ppro
ach to
conc
erns
Very poor
Poor
Satisfactory
Good
Excellent
Ave
rage
rat
ing
(1–5
)
1997–98 1998–99 1999–2000 2000–01 2001–02 2002–03 2003–04 2004–05

QUALITY OF SERVICE REPORT: 2004–05 MELBOURNE AIRPORT 47
In 2004–05 airlines rated the international terminal facilities and management responsiveness at Melbourne airport generally between poor and satisfactory. Over the past three years, airlines’ ratings of the international terminal facilities at Melbourne airport have decreased.
Chart 7.8 shows the average ratings by airlines of domestic terminal facilities at Melbourne airport for 2002–03 to 2004–05.
Chart 7.8 Average ratings by airlines for domestic terminal facilities
Aerob
ridge
availa
bility
Aerob
ridge
stan
dard
Check
-in av
ailabil
ity
Check
-in st
anda
rd
Bagg
age f
aciliti
es av
ailabil
ity
Bagg
age f
aciliti
es st
anda
rd
Very poor
Poor
Satisfactory
Good
Excellent
Ave
rage
rat
ing
(1–5
)
2002–03 2003–04 2004–05
Melbourne airport’s domestic terminal facilities were rated by airlines as between poor and good. Ratings for the availability and standard of check-in and baggage facilities decreased this year, while the ratings for the standard of aerobridges increased and remained constant for their availability. Melbourne airport advised that, in addition to existing check-in desks, six self-serve check-in kiosks were installed towards the end of the fi nancial year.

MELBOURNE AIRPORT QUALITY OF SERVICE REPORT: 2004–0548
7.5 Australian Customs Service surveyChart 7.9 shows the ratings by ACS of the facilities at Melbourne airport for 1998–99 to 2004–05.
Chart 7.9 Ratings by ACS of terminal facilities
Arrival—
immigr
ation
—ava
ilability
Arrival—
immigr
ation
—sta
ndard
Arrival—
bagga
ge in
specti
on—
availab
ility
Arrival—
bagga
ge in
specti
on—
stand
ard
Depart
ures—
immigr
ation
—ava
ilability
Depart
ures—
immigr
ation
—sta
ndard
Manage
ment a
ppro
ach to
conc
erns
Very poor
Poor
Satisfactory
Good
Excellent
Ave
rage
rat
ing
(1–5
)
1998–99 1999–2000 2000–01 2001–02 2002–03 2003–04 2004–05
ACS’s ratings for 2004–05 ranged between very poor and satisfactory, with most ratings down on last year. The exception to this was the standard of immigration facilities for departing passengers, which increased from poor in 2003–04 to satisfactory.
There is a downward trend apparent in most measures that the ACS rated Melbourne airport on, with all ratings in 2004–05 lower than those in 1998–99. The ACS noted that the growth in passenger numbers at Melbourne airport has resulted in increased congestion and delays due to insuffi cient space for customs to process these passengers effectively. Melbourne airport advised that it considered that the issue of insuffi cient space could be mitigated by ACS providing additional staff.
Melbourne airport advised that it is currently working with the ACS and the Australian Quarantine and Inspection Service (AQIS) to develop terms of reference to further expand the arrival baggage inspection facilities to modify queuing and passenger processing procedures.
In summary:Runway demand was generally within operationally agreed capacity during morning peak hour. Delay times have remained low at Melbourne airport during 2004–05, with the average system delay being 3.6 minutes and average maximum system delay being 10 minutes.
Most of the objective indicators for both the international and domestic terminals showed an increase in the number of passengers per service due to an increase in passenger numbers during peak hour.
In general, passengers rated the international and domestic terminals as good. The international terminal facilities at Melbourne airport have received high ratings from passengers since 1997–98.
Airlines rated the airside facilities at Melbourne airport as satisfactory during 2004–05. Average airline ratings of the international terminal facilities ranged from above poor to satisfactory and ratings for the domestic terminal ranged from poor to good. Overall, airline ratings of the facilities at Melbourne airport were down on those achieved last year.
The ACS ratings of the facilities at Melbourne airport ranged between very poor and satisfactory, with most ratings down on last year.

QUALITY OF SERVICE REPORT: 2004–05 PERTH AIRPORT 49
8 Perth airport
8.1 Objective indicators for quality of serviceTable 8.1 provides the objective indicators for quality of service at Perth airport over the period 2002–03 to 2004–05. Perth airport did not provide information for the objective indicators relating to its domestic terminal in 2002–03.
Table 8.1 Objective indicators for quality of service
Indicator
Terminal International Domestic
2002–03 2003–04 2004–05 2002–03 2003–04 2004–05
Percentage of international passengers arriving using an aerobridge
97% 100% 99% N/A N/A N/A
Percentage of international passengers departing using an aerobridge
97% 100% 99% N/A N/A N/A
Percentage of hours with more than 80 per cent of check-in desks in use
0% 0% 0% N/P 2% 0%
Number of arriving passengers per inbound immigration desk during peak hour
44 43 53 N/A N/A N/A
Number of arriving passengers per baggage inspection desk during peak hour
25 28 34 N/A N/A N/A
Number of departing passengers per outbound migration desk during peak hour
79 79 97 N/A N/A N/A
Number of departing passengers per security-clearance system during peak hour
265(a) 263(a) 243 N/P 366 203
Number of departing passengers per seat in gate lounges during peak hour
1.8 1.8 1.9 N/P 0.7 1.4
Number of departing passengers per square metre of lounge area during peak hour
0.4 0.4 0.3 N/P 0.2 0.2
Average throughput of outbound baggage system, bags per hour
119 114 140 N/P 115 116
Number of passengers per baggage trolley during peak hour
2 2 3 N/P 2.6 3.4
Number of passengers per fl ight information display screen during peak hour
26 27 26 N/P 49 55
Number of passengers per information point during peak hour
1502 1572 1928 N/P 780 1322
Car parking at terminals
Average daily throughput, short-term car park, cars per day
1878 1755 1862 2511 2747 2602
Notes: Measures of throughput are based on the fi nancial year unless otherwise specifi ed as peak hour or daily, whereas measures of availability and capacity are for the last day of the fi nancial year.
(a) Perth airport advised the ACCC that it incorrectly reported the number of security-clearance systems in the international terminal in 2002–03 and 2003–04 as being two. This has now been corrected to three and as a result the above objective indicators have changed from 397 to 265 in 2002–03 and from 395 to 263 in 2003–04.
N/A = not applicable; N/P = not provided

PERTH AIRPORT QUALITY OF SERVICE REPORT: 2004–0550
The objective indicators for quality of service for the international terminal between 2002–03 and 2003–04 were generally stable, with most indicators increasing during 2004–05, refl ecting the increase in international passenger numbers at Perth airport over the past three years.
This year, the number of arriving and departing passengers during peak hour for the international terminal increased from 1572 in 2003–04 to 1928. In the domestic terminal, the number of passengers arriving and departing during peak hour increased in 2004–05 to 1322 from 780 in 2003–04. This resulted in most of the objective indicators for both the international and domestic terminals showing an increase in the number of passengers per service indicator.
The exception to this was the decrease in the number of departing passengers per security-clearance system during peak hour for both the domestic and international terminal, due to an increase in the number of security-clearance systems in both terminals. During 2004–05 the number of security-clearance systems in the international terminal increased from two to four and in the domestic terminal from one to three.
8.2 Passenger surveyPerth airport engaged BAA plc (formally the British Airport Authority) to survey its passengers. This year 750 departing passengers, 500 arriving passengers and 100 taxi users in the international and domestic terminals were surveyed.
In 2004–05 Perth airport changed its methods for surveying passengers on quality of service issues. Before 2004–05 Perth airport randomly selected survey participants and used a 1–7 point rating scale, which was then converted into a 1–5 rating scale to meet the ACCC’s reporting requirements. This year, Perth airport surveyed a sample of passengers and adopted a 1–5 point rating scale. The number of passengers surveyed also increased over previous years.
Chart 8.1 shows the passenger survey results for the international and domestic terminals at Perth airport for 2004–05.
Chart 8.1 Passenger survey results for the international and domestic terminals
Check
-in—
waiting
time
Immigr
ation
area
—inb
ound
—wait
ing tim
e
Bagg
age i
nspe
ction
—inb
ound
—wait
ing tim
e
Gover
nmen
t insp
ectio
n—ou
tboun
d—wait
ing tim
e
Secu
rity cl
earan
ce—
qualit
y of s
earch
proc
ess
Gate lo
unge
s—qu
ality a
nd av
ailabil
ity of
seati
ng
Gate lo
unge
s—cro
wding
Bagg
age r
eclaim
—wait
ing tim
e
Bagg
age r
eclaim
—inf
ormati
on di
splay
Bagg
age r
eclaim
—cir
culat
ion sp
ace
Bagg
age t
rolle
ys—fin
dabil
ity
Fligh
t infor
mation
disp
lay sc
reen
s
Signa
ge an
d way
findin
g
Wash
room
s—sta
ndard
Car pa
rking
—sta
ndard
Car pa
rking
—av
ailabil
ity
Car pa
rking
—tim
e tak
en to
enter
Kerb
side s
pace
—co
nges
tion
Kerb
side d
rop-
off an
d pick
-up f
acilit
ies
Taxi
facilit
ies—
stand
ard
Very poor
Poor
Satisfactory
Good
Excellent
International Domestic
Ave
rage
rat
ing
(1–5
)
Overall, both the international and domestic terminals were rated as good in 2004–05. The exception to this was the standard and availability of the domestic car park, which were rated as being less than good.

QUALITY OF SERVICE REPORT: 2004–05 PERTH AIRPORT 51
The average check-in waiting time during peak hour for passengers interviewed at the international terminal was 10.94 minutes, down from 11.8 minutes in 2003–04. For passengers interviewed at the domestic terminal, the average check-in waiting time during peak hour was 1.96 minutes, up from 0.8 minutes in 2003–04. The average check-in waiting times for both terminals were not available for 2002–03.
Charts 8.2 and 8.3 show the passenger survey results for the international terminal facilities at Perth airport from 1997–98 to 2004–05.
Chart 8.2 Passenger survey results for the international terminal immigration inspection and baggage reclaim
Check-
in—wait
ing tim
e
Immigr
ation
area
—inb
ound
—wait
ing tim
e
Baggage
inspe
ction
—inb
ound
—wait
ing tim
e
Govern
ment in
spec
tion—
outbo
und—
waiting
time
Secu
rity cle
aranc
e—qu
ality o
f searc
h pro
cess
Baggage
recla
im—
waiting
time
Baggage
recla
im—
infor
mation
disp
lay
Baggage
recla
im—
circu
lation
space
Baggage
troll
eys—
finda
bility
Very poor
Poor
Satisfactory
Good
Excellent
Ave
rage
rat
ing
(1–5
)
1997–98 1998–99 1999–2000 2000–01 2001–02 2002–03 2003–04 2004–05
Chart 8.3 Passenger survey results for the international terminal general facilities and car park
Gate lo
unge
s—sea
ting q
uality
/availa
bility
Gate lo
unge
s—cro
wding
Flight
infor
mation
displ
ay scr
eens
Signa
ge an
d wayf
inding
Wash
room
s—sta
ndard
Car pa
rking
—sta
ndard
Car pa
rking
—ava
ilability
Car pa
rking
—tim
e take
n to e
nter
Kerbs
ide sp
ace—
cong
estion
Kerbs
ide dr
op-o
ff and
pick-
up fa
cilitie
s
Taxi fa
cilitie
s—sta
ndard
Taxi fa
cilitie
s—wait
ing tim
e
Very poor
Poor
Satisfactory
Good
Excellent
Ave
rage
rat
ing
(1–5
)
1997–98 1998–99 1999–2000 2000–01 2001–02 2002–03 2003–04 2004–05

PERTH AIRPORT QUALITY OF SERVICE REPORT: 2004–0552
The passenger survey results for the international terminal facilities have been stable over the reporting period, being rated, on average, as good.
Chart 8.4 shows the passenger survey results for domestic terminal facilities at Perth airport from 2003–04 to 2004–05. These results were not available for 2002–03.
Chart 8.4 Passenger survey results for domestic terminal facilities
Check
-in—
waiting
time
Secu
rity cl
earan
ce—
qualit
y of se
arch p
roce
ss
Gate lo
unge
s—qu
ality a
nd av
ailabil
ity of
seati
ng
Gate lo
unge
s—cro
wding
Bagg
age r
eclaim
—wait
ing tim
e
Bagg
age r
eclaim
—inf
ormati
on di
splay
Bagg
age r
eclaim
—cir
culat
ion sp
ace
Bagg
age t
rolle
ys—fin
dabil
ity
Flight
infor
mation
disp
lay sc
reens
Signa
ge an
d way
findin
g
Wash
room
s—sta
ndard
Car pa
rking
—sta
ndard
Car pa
rking
—av
ailabil
ity
Car pa
rking
—tim
e tak
en to
enter
Kerb
side s
pace
—co
nges
tion
Kerb
side d
rop-
off an
d pick
-up f
aciliti
es
Taxi
faciliti
es—
stand
ard
Very poor
Poor
Satisfactory
Good
Excellent
Ave
rage
rat
ing
(1–5
)
2003–04 2004–05
Over the past two years, passengers rated the domestic terminal facilities at Perth airport, on average, as good. The exceptions to this were the standard and availability of car parking, which rated as satisfactory. There has been a notable improvement this year for passenger ratings of the time taken to enter the car park and baggage reclaim information display.

QUALITY OF SERVICE REPORT: 2004–05 PERTH AIRPORT 53
8.3 Airline surveyDuring 2004–05, 13 international airlines operated out of Perth airport’s international terminal, while two domestic airlines and three regional airlines used the domestic terminal facilities. This year, six airlines responded to the airline survey—two for the domestic terminal and fi ve for the international terminal.
Chart 8.5 shows the average ratings by airlines of airside facilities at Perth airport for 1997–98 to 2004–05.
Chart 8.5 Average ratings by airlines of airside facilities
Runw
ays a
vailab
ility
Runw
ays s
tanda
rd
Taxiw
ays a
vailab
ility
Taxiw
ays s
tanda
rd
Apron
s ava
ilability
Apron
s stan
dard
Gates a
vailab
ilty
Gates s
tanda
rd
Groun
d ser
vice s
ites a
vailab
ility
Groun
d ser
vice s
ites s
tanda
rd
Very poor
Poor
Satisfactory
Good
Excellent
Ave
rage
rat
ing
(1–5
)
1997–98 1998–99 1999–2000 2000–01 2001–02 2002–03 2003–04 2004–05
The average airline ratings of Perth airport’s airside facilities for 2004–05 ranged between satisfactory and good, with ratings slightly up on those of last year. Within the range of satisfactory to good ratings, minor trends are apparent in the ratings of airside facilities—a fall in ratings after 1998–99, followed by a gradual recovery up to 2004–05.
Chart 8.6 shows the average ratings by airlines of international terminal facilities and management responsiveness for Perth airport for 1997–98 to 2004–05.

PERTH AIRPORT QUALITY OF SERVICE REPORT: 2004–0554
Chart 8.6 Average ratings by airlines of international terminal facilities and management responsiveness
Aero
bridg
e ava
ilabilit
y
Aero
bridg
e stan
dard
Check
-in av
ailabil
ity
Check
-in st
anda
rd
Bagg
age f
acilit
ies av
ailabil
ity
Bagg
age f
acilit
ies st
anda
rd
Man
agem
ent a
ppro
ach t
o con
cern
s
Very poor
Poor
Satisfactory
Good
Excellent
Ave
rage
rat
ing
(1–5
)
1997–98 1998–99 1999–2000 2000–01 2001–02 2002–03 2003–04 2004–05
Average ratings by airlines of the international terminal facilities increased during 2004–05, with facilities rated as satisfactory on average. Within the range of poor to above satisfactory ratings, minor trends are apparent in the ratings of the international terminal and management responsiveness—ratings were relatively high in the fi rst half of the reporting period, followed by a fall in ratings, which has been reversed in recent years.
Chart 8.7 shows the average ratings by airlines of domestic terminal facilities at Perth airport for 2002–03 to 2004–05.
Chart 8.7 Average ratings by airlines for domestic terminal facilities
Aero
bridg
e ava
ilabilit
y
Aero
bridg
e stan
dard
Check
-in av
ailabil
ity
Check
-in st
anda
rd
Bagg
age f
acilit
ies av
ailabil
ity
Bagg
age f
acilit
ies st
anda
rd
Very poor
Poor
Satisfactory
Good
Excellent
Ave
rage
rat
ing
(1–5
)
2002–03 2003–04 2004–05

QUALITY OF SERVICE REPORT: 2004–05 PERTH AIRPORT 55
Airlines’ average ratings of the domestic terminal facilities at Perth airport in 2004–05 ranged from poor to good. Ratings of check-in and baggage facilities improved, while there was a decline in the rating of the standard of aerobridges. The average rating of aerobridge availability remained unchanged from last year.
8.4 Australian Customs Service surveyChart 8.8 shows the ratings by ACS of the facilities at Perth airport for 1998–99 to 2004–05.
Chart 8.8 Ratings by ACS of terminal facilities
Arrival—
immigr
ation
—ava
ilability
Arrival—
immigr
ation
—sta
ndard
Arrival—
bagga
ge in
specti
on—
availab
ility
Arrival—
bagga
ge in
specti
on—
stand
ard
Depart
ures—
immigr
ation
—ava
ilability
Depart
ures—
immigr
ation
—sta
ndard
Manage
ment a
ppro
ach to
conc
erns
Very poor
Poor
Satisfactory
Good
Excellent
Ave
rage
rat
ing
(1–5
)
1998–99 1999–2000 2000–01 2001–02 2002–03 2003–04 2004–05
The ACS ratings at Perth airport ranged between poor to good during 2004–05. The ACS noted that congestion is a problem when international fl ights arrive close together, but said that Perth airport had improved the baggage inspection area for arrivals during the reporting period.
In summary:Most of the objective indicators for both the international and domestic terminals showed an increase in the number of passengers per service in 2004–05, due to more passengers during peak hour.
Passengers rated the international and domestic terminals as good. Passenger ratings for the international terminal facilities have been stable since 1997–98, being rated on average as good.
The average airline ratings of Perth airport’s airside facilities for 2004–05 ranged between satisfactory and good, with ratings slightly up on those achieved last year. Ratings by airlines of the international terminal facilities increased during 2004–05, with facilities on average rated as satisfactory, while ratings for the domestic terminal ranged from poor to good.
The ACS rated Perth airport’s facilities between poor and good during 2004–05.

SYDNEY AIRPORT QUALITY OF SERVICE REPORT: 2004–0556
9 Sydney airport
9.1 Runway traffi c—demand and delaysChart 9.1 shows the aircraft traffi c measures for Sydney airport’s morning peak.
Chart 9.1 Peak-hour aircraft traffi c
0
10
20
30
40
50
60
70
80
Demand Actual arrivals Rate Peak demand(within the hour)
Max pro rata rate(within the hour)
Max system delay Avg system delay
Jun 2004 AVG
Jul 2004 AVG
Aug 2004 AVG
Sep 2004 AVG
Oct 2004 AVG
Nov 2004 AVG
Dec 2004 AVG
Jan 2005 AVG
Feb 2005 AVG
Mar 2005 AVG
Apr 2005 AVG
May 2005 AVG
Jun 2005 AVG
Source: Airservices Australia
Note: Rate means agreed arrive rate or operational capacity.
Demand, arrivals and agreed rate are measures of aircraft per hour. Delays are in minutes.
Measures are further explained earlier in section 2.
Runway demand was relatively high compared with OAC during the morning peak hour, averaging 89.6 per cent, up from 84 per cent in 2003–04. Peak-hour demand within parts of that hour exceeded the maximum pro rata arrival rate by 29 per cent, down from 35 per cent in 2003–04. The average system delay at Sydney airport remained unchanged from last year at about 5 minutes, up from about 4 minutes in 2002–03. The maximum system delay in peak hour is also unchanged since last year, averaging about 14 minutes, up from 12 minutes in 2002–03.
The above indicates a concentration of demand in the peak hour, but not necessarily inadequate capacity, because the runway is underused at other times. Sydney airport has advised that it tends to experience greater average delays than other Australian airports because of external factors, such as higher peak movement rates, terminal area constraints and the government noise-sharing policy.
Sydney’s capacity rates are limited by the scheduling cap of 80 movements per hour, (around 40 arrivals per hour) which necessitates rationing of airline access to timeslots. This rationing is performed administratively by Airport Co-ordination Australia. Regional fl ights have guaranteed access to a minimum number of regional slots at Sydney airport during peak hour. Prices for regional airlines at Sydney airport are also subject to a CPI-X price cap.
The data does not show the potential economic demand which is suppressed through the existence of the slot controls, as ‘demand’ relates only to aircraft already scheduled to land.
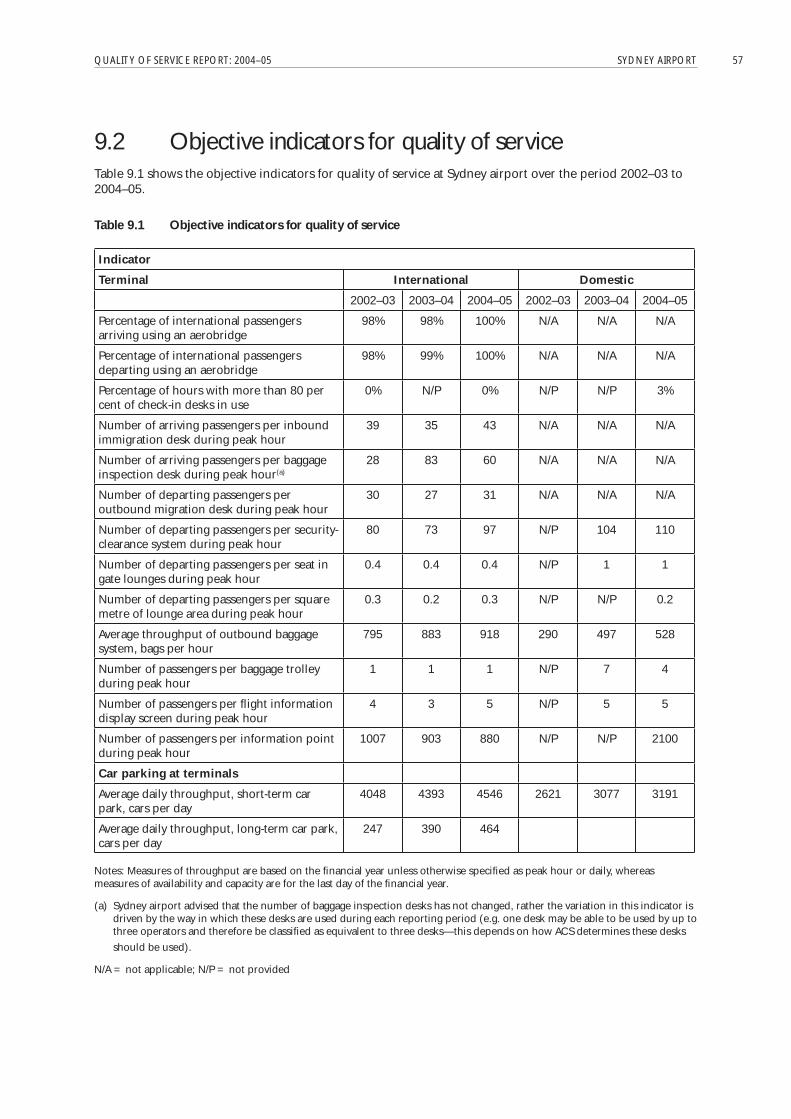
QUALITY OF SERVICE REPORT: 2004–05 SYDNEY AIRPORT 57
9.2 Objective indicators for quality of serviceTable 9.1 shows the objective indicators for quality of service at Sydney airport over the period 2002–03 to 2004–05.
Table 9.1 Objective indicators for quality of service
Indicator
Terminal International Domestic
2002–03 2003–04 2004–05 2002–03 2003–04 2004–05
Percentage of international passengers arriving using an aerobridge
98% 98% 100% N/A N/A N/A
Percentage of international passengers departing using an aerobridge
98% 99% 100% N/A N/A N/A
Percentage of hours with more than 80 per cent of check-in desks in use
0% N/P 0% N/P N/P 3%
Number of arriving passengers per inbound immigration desk during peak hour
39 35 43 N/A N/A N/A
Number of arriving passengers per baggage inspection desk during peak hour(a)
28 83 60 N/A N/A N/A
Number of departing passengers per outbound migration desk during peak hour
30 27 31 N/A N/A N/A
Number of departing passengers per security-clearance system during peak hour
80 73 97 N/P 104 110
Number of departing passengers per seat in gate lounges during peak hour
0.4 0.4 0.4 N/P 1 1
Number of departing passengers per square metre of lounge area during peak hour
0.3 0.2 0.3 N/P N/P 0.2
Average throughput of outbound baggage system, bags per hour
795 883 918 290 497 528
Number of passengers per baggage trolley during peak hour
1 1 1 N/P 7 4
Number of passengers per fl ight information display screen during peak hour
4 3 5 N/P 5 5
Number of passengers per information point during peak hour
1007 903 880 N/P N/P 2100
Car parking at terminals
Average daily throughput, short-term car park, cars per day
4048 4393 4546 2621 3077 3191
Average daily throughput, long-term car park, cars per day
247 390 464
Notes: Measures of throughput are based on the fi nancial year unless otherwise specifi ed as peak hour or daily, whereas measures of availability and capacity are for the last day of the fi nancial year.
(a) Sydney airport advised that the number of baggage inspection desks has not changed, rather the variation in this indicator is driven by the way in which these desks are used during each reporting period (e.g. one desk may be able to be used by up to three operators and therefore be classifi ed as equivalent to three desks—this depends on how ACS determines these desks
should be used).
N/A = not applicable; N/P = not provided

SYDNEY AIRPORT QUALITY OF SERVICE REPORT: 2004–0558
The general trend in objective indicators for the international terminal over the past three years has followed the trend in passenger numbers. In 2004–05, the number of international passengers arriving and departing during peak hour increased to 4401 from 3615 in 2003–04. This resulted in most of the objective indicators for the international terminal showing an increase in the number of passengers per service indicator.
The number of passengers per information point during peak hour decreased from 903 in 2003–04 to 880 in 2004–05, due to an increase in the number of information points from four to fi ve.
The number of passengers per baggage trolley during peak hour has remained constant over the past two years. This is because, even though passenger numbers went up, the number of baggage trolleys increased from 3400 in 2003–04 to 4725 in 2004–05.
The number of international passengers per fl ight information display screen during peak hour increased during 2004–05, due to a reduction in the number of FID screens. Sydney airport installed new LCD screens in some parts of the terminal, which it states are larger and clearer than the existing screens. There were 870 fl ight information display screens in the international terminal in 2004–05, down from 1050 in 2003–04.
The number of passengers arriving and departing during peak hour for the domestic terminal increased slightly in 2004–05 to 2100, up from 2076. As a result, most objective indicators for the domestic terminal remained stable. The exception to this was a decrease in the number of passengers per baggage trolley during peak hour from seven to four, due to the number of baggage trolleys available in the domestic terminal increasing from 300 in 2003–04 to 590 in 2004–05.
9.3 Passenger surveyAs noted in the earlier chapter on the ACCC’s role and approach, the approach for passenger surveys at Sydney airport is unique in that Sydney airport requested that its performance be assessed on the basis of the AETRA survey undertaken annually by IATA, rather than the ACCC’s guidelines. Although a consistent methodology across all airports would be preferable, the ACCC accepted this approach because the IATA survey was an authoritative independent survey by a user group which allows benchmarking against the world’s best airports. Questions in the IATA survey are broadly equivalent but not identical to those expected in the Australian regulations.
While a benefi t of Sydney airport using the IATA survey is that it allows for international comparisons, Sydney airport did not provide the ACCC with the full AETRA results.
Although IATA uses a 1–5 rating scale, the meaning of the scores differs from the ACCC’s scale, as shown in the comparison below:
IATA scale 1
Poor
2
Fair
3
Good
4
Very good
5
Excellent
ACCC scale 1
Very poor
2
Poor
3
Satisfactory
4
Good
5
Excellent
Chart 9.2 shows passenger survey results for the international and domestic airport-operated terminals at Sydney airport for 2004–05.

QUALITY OF SERVICE REPORT: 2004–05 SYDNEY AIRPORT 59
Chart 9.2 Passenger survey results for the international and domestic terminals
Check
-in—
waiting
time
Immigr
ation
area
—inb
ound
—wait
ing tim
e
Gover
nmen
t insp
ectio
n—ou
tboun
d—wait
ing tim
e
Secu
rity cl
earan
ce—
qualit
y of s
earch
proc
ess
Gate lo
unge
s—qu
ality a
nd av
ailabil
ity of
seati
ng
Bagg
age r
eclaim
—wait
ing tim
e
Bagg
age t
rolle
ys—fin
dabil
ity
Fligh
t infor
mation
disp
lay sc
reen
s
Signa
ge an
d way
findin
g
Wash
room
s—sta
ndard
Car-pa
rking
—sta
ndard
Kerb
side d
rop-
off an
d pick
-up f
aciliti
es
Poor
Fair
Good
Very good
Excellent
International Domestic
Ave
rage
rat
ings
(IAT
A 1
–5 s
cale
)
The passenger survey results rated the international and domestic terminals at Sydney airport as between good and very good.
The average check-in waiting time during peak hour for passengers interviewed at the international terminal was 13 minutes, down from 16 minutes in 2003–04. For passengers interviewed at the domestic terminal, the average check-in waiting time during peak hour was 10 minutes during 2004–05. The average check-in time for the domestic terminal was not available for 2003–04.
Chart 9.3 shows Sydney airport’s passenger survey results for international terminal services from January 2000 to 30 June 2005. These are based on the IATA survey, which historically was reported on the calendar year and is now reported on the fi nancial year.
Chart 9.3 Passenger survey results for the international terminal
Wait
ing tim
e at c
heck
-in
Passp
ort a
nd vi
sa ins
pecti
on
Custom
s insp
ectio
n
Secu
rity in
spec
tion
Sens
e of s
ecur
ity
Wait
ing/ga
te are
as—co
mfort
Cleanli
ness
of air
port
termina
l
Bagg
age d
elive
ry se
rvice
spee
d
Bagg
age c
arts a
vailab
ility
Fligh
t infor
mation
scre
ens
Signp
ostin
g & w
ayfin
ding
Wash
room
s
Parki
ng fa
cilitie
s
Groun
d tran
spor
tation
to/fr
om ai
rpor
t
Ave
rage
rat
ing
(IATA
1–5
)
Poor
Fair
Good
Very good
Excellent
Jan 2000–Apr 2001 Jan–Dec 2001 Jan–Dec 2002 Jan–Dec 2003 Jan–Jun 2004 Jul 2004–Jun 2005

SYDNEY AIRPORT QUALITY OF SERVICE REPORT: 2004–0560
Over the reported period, the international terminal facilities at Sydney airport have rated on average as good to very good, with slight downward trends appearing for signposting and washrooms.
Sydney airport advised that it has recently announced ‘Project Star’, which is planned to upgrade the airside and general terminal facilities over the next three to fi ve years.
Chart 9.4 shows the passenger survey results for domestic terminal facilities at Sydney airport from 2003–04 to 2004–05. These results were not available for 2002–03.
Chart 9.4 Passenger survey results for domestic terminal facilities
Check
-in—
waiting
time
Secu
rity cl
earan
ce—
qualit
y of se
arch p
roce
ss
Gate lo
unge
s—qu
ality a
nd av
ailabil
ity of
seati
ng
Bagg
age r
eclaim
—wait
ing tim
e
Bagg
age t
rolle
ys—fin
dabil
ity
Flight
infor
mation
disp
lay sc
reens
Signa
ge an
d way
findin
g
Wash
room
s—sta
ndard
Car pa
rking
—sta
ndard
Kerb
side d
rop-
off an
d pick
-up f
aciliti
es
Poor
Fair
Good
Very good
Excellent
Ave
rage
rat
ing
(IATA
1–5
)
2003–04 2004–05
Over the past two years, the passenger survey results for domestic terminal facilities at Sydney airport have ranged from good to very good. In 2004–05 passenger ratings of these facilities declined, but were still rated as good.
Sydney airport recently announced a $20 million upgrade of the domestic terminal, which began on 8 September 2005. In addition, Sydney airport advised that it has recently increased the number of available car parking spaces.
9.4 Airline surveyDuring 2004–05, 40 international airlines operated out of Sydney airport’s international terminal, while eight domestic and regional airlines used the domestic terminal facilities. This year, 13 airlines responded to the airline survey—11 for the international terminal and three for the domestic terminal.
Chart 9.5 shows the average ratings by airlines of airside facilities at Sydney airport for 1998–99 to 2004–05.

QUALITY OF SERVICE REPORT: 2004–05 SYDNEY AIRPORT 61
Chart 9.5 Average ratings by airlines of airside facilities
Runways
availa
bility
Runways
stan
dard
Taxiw
ays av
ailabil
ity
Taxiw
ays st
anda
rd
Aprons
availab
ility
Aprons
stand
ard
Gates a
vailab
ilty
Gates s
tanda
rd
Groun
d serv
ice sit
es ava
ilability
Groun
d serv
ice sit
es sta
ndard
Very poor
Poor
Satisfactory
Good
Excellent
Ave
rage
rat
ing
(1–5
)
1998–99 1999–2000 2000–01 2001–02 2002–03 2003–04 2004–05
Airlines’ average ratings of the airside facilities at Sydney airport were largely unchanged from 2003–04, with ratings ranging between satisfactory and good. Results over the period from 1998–99 appear to be broadly stable, apart from relatively low results in 1998–99 for gates and ground service sites.
Chart 9.6 shows the average ratings by airlines of international terminal facilities and management responsiveness for Sydney airport for 1998–99 to 2004–05.
Chart 9.6 Average ratings by airlines of international terminal facilities and management responsiveness
Aerobri
dge a
vailab
ility
Aerobri
dge s
tanda
rd
Check-
in ava
ilability
Check-
in sta
ndard
Baggage
facili
ties a
vailab
ility
Baggage
facili
ties s
tanda
rd
Manage
ment a
ppro
ach to
conc
erns
Very poor
Poor
Satisfactory
Good
Excellent
Ave
rage
rat
ing
(1–5
)
1998–99 1999–2000 2000–01 2001–02 2002–03 2003–04 2004–05
For the most part, airline ratings of the international terminal facilities were relatively stable or up on the ratings in 2003–04; on average rating satisfactory. The exception to this was the airlines’ rating of the standard of aerobridges, which decreased slightly during 2004–05. Over the reporting period, there has been a downward trend in the standard of check-in facilities, from above satisfactory in 1998–99 to below satisfactory in 2004–05.

SYDNEY AIRPORT QUALITY OF SERVICE REPORT: 2004–0562
Sydney airport advised that it is currently in the process of upgrading the check-in facilities and, under Project Star, aerobridges will be upgraded.
Chart 9.7 shows the average ratings by airlines of domestic terminal facilities at Sydney airport for 2002–03 to 2004–05.
Chart 9.7 Average ratings by airlines for domestic terminal facilities
Aerobri
dge a
vailab
ility
Aerobri
dge s
tanda
rd
Check-
in ava
ilability
Check-
in sta
ndard
Baggage
facili
ties a
vailab
ility
Baggage
facili
ties s
tanda
rd
Very poor
Poor
Satisfactory
Good
Excellent
Ave
rage
rat
ing
(1–5
)
2002–03 2003–04 2004–05
This year, the average airline ratings for Sydney airport’s domestic terminal were satisfactory, with results largely unchanged from 2003–04. Since 2002–03, the rating of standard of aerobridges improved, as did the standard of the baggage facilities, while the standard and availability of check-in facilities fell.
Sydney airport advised that many more passengers used the domestic terminal in 2004–05. The number of airlines operating out of the domestic terminal increased from two to three and, during this period, the two major airlines experienced increases in services and passenger numbers.

QUALITY OF SERVICE REPORT: 2004–05 SYDNEY AIRPORT 63
9.5 Australian Customs Service surveyChart 9.8 shows the ratings by ACS of the facilities at Sydney airport for 1998–99 to 2004–05.
Chart 9.8 Ratings by ACS of terminal facilities
Arrival—
immigr
ation
—ava
ilability
Arrival—
immigr
ation
—sta
ndard
Arrival—
bagga
ge in
specti
on—
availab
ility
Arrival—
bagga
ge in
specti
on—
stand
ard
Depart
ures—
immigr
ation
—ava
ilability
Depart
ures—
immigr
ation
—sta
ndard
Manage
ment a
ppro
ach to
conc
erns
Very poor
Poor
Satisfactory
Good
Excellent
Ave
rage
rat
ing
(1–5
)
1998–99 1999–2000 2000–01 2001–02 2002–03 2003–04 2004–05
In 2004–05, ACS’s ratings ranged between satisfactory and good. While ACS’s ratings for the availability of facilities remained stable, ratings on the standard of facilities decreased during 2004–05, from good to satisfactory. Since 1998–99 the rating for management’s approach to concerns has fallen from excellent to satisfactory.
In summary:Runway demand at Sydney airport was sometimes higher than operationally agreed capacity during the morning peak hour. The average system delay and maximum system delay in peak hour were unchanged since last year, at about 5 and 14 minutes, respectively.
The objective indicators for the domestic terminal generally remained relatively stable, while an increase in the number of international passengers during peak hour resulted in most of the objective indicators for the international terminal increasing.
Passengers rated the international and domestic terminals as good to very good. Ratings for the international terminal facilities have been relatively stable, between good to very good, over the reporting period.
Airlines’ average ratings of the airside facilities at Sydney airport ranged between satisfactory and good. This year, the average airline ratings for Sydney airport’s international and domestic terminals were satisfactory. Overall, the airlines’ ratings of the facilities at Sydney airport were largely unchanged from those achieved in 2003–04.
ACS rated the facilities at Sydney airport as satisfactory to good.

APPENDIX 1 QUALITY OF SERVICE REPORT: 2004–0564
Appendix 1 Indicators of airport quality of service
Objective measuresThe ACCC requested the measures in the table below from airports and Airservices Australia, in light of the airports regulations and the government objectives for monitoring. The measures in column (1) are base data largely related to the size or scale of the airport, while the indicators in column (2) are derived from the base data to give a better indicator of relative adequacy of facilities; that is, relative to the number of passengers or aircraft.
Apart from the runway data which was sought from Airservices Australia, the data was sought from the airport operators. It was not always possible to obtain this data, as indicated in the relevant chapters of this report.
Facility (1) Base data (2) Objective indicators
Runway system Number of arrivals/departures per hour:… morning peak… evening peak… monthly average… day of week average
Runway system capacity
Arriving/departing aircraft delay:… morning peak… evening peak… monthly average… day of week average
Number of arriving/departing aircraft delayed by length of delay
Aerobridges
… for arrivals Number of aerobridges… international terminal… domestic terminal
Number of passengers arriving from international aircraft via aerobridges
Number of arriving international aircraft using aerobridges
% of international passengers arriving via aerobridges
… for departures Number of passengers departing in international aircraft via aerobridges
% of international passengers departing via aerobridges
Apron System
Parking… for aircraft
Number of aircraft parking bays Number of aircraft parking bays per arriving aircraft at peak hour
Check-in Number of hours with more than 80 per cent of desks in use
Number of hours any desks are open
Number of desks
% of hours with more than 80 per cent of desks in use

QUALITY OF SERVICE REPORT: 2004–05 APPENDIX 1 65
Facility (1) Base data (2) Objective indicators
Government inspection(at international terminals)
… inbound Number of inbound immigration desks Number of inbound immigration desks per arriving passenger during peak hour
Number of baggage inspection desks Number of baggage inspection desks per arriving passenger during peak hour
… outbound Number of outbound immigration desks Number of outbound immigration desks per departing passenger during peak hour
Security clearance Number of security-clearance systems Number of security-clearance systems per departing passenger during peak hour
Gate lounges Number of seats in gate lounge Lounge area per departing passenger during peak hour
Square metres of lounge area Seats per departing passenger during peak hour
Baggage processing
… outbound baggage systems
Capacity of outbound baggage handling system
Number of bags handled
Number of hours system is in use
Number and duration of planned/unplanned
Interruptions to outbound baggage handling system
Average throughput of the outbound baggage system
… inbound baggage systems
Capacity of inbound baggage handling systemNumber and duration of planned/unplanned interruptions to inbound baggage handling system
Baggage trolleys Number of baggage trolleys Number of baggage trolleys per [arriving/departing] passenger during peak hour
Signage and way-fi nding
Number of FID screens Number of FID screens per [arriving/departing] passenger during peak hour
Number of information points Number of information points per [arriving/departing] passenger during peak hour
Other—traffi c Total number of arriving passengers from international aircraft
Total number of departing passengers in international aircraft
Number of arriving/departing passengers during peak hour4
Average number of arriving/departing passengers during peak hour

APPENDIX 1 QUALITY OF SERVICE REPORT: 2004–0566
Facility (1) Base data (2) Objective indicators
Car parking Number of days car park is openNumber of parking spaces available to the publicTotal annual throughput of car parkAverage daily throughput of car parkNumber of parking spaces available to staff
Average daily throughput/number of spaces
Notes:
1. Advice provided to the ACCC by airport operators recommended the use of an average peak measure as a quality of service performance indicator, which is recommended to be defi ned as the peak hour in the average day of the peak month. The ACCC also recognises that there are other peak measures such as 30th busiest hour per month or 95th percentile traffi c levels that may be used by airports to approximate peak-hour passenger traffi c levels in airport terminals.
Passenger perception surveysAirports were expected to conduct passenger surveys eliciting passengers’ satisfaction with each of the facilities in the following table at each terminal managed by the airport operator.
Service Satisfaction with …
Check-in Check-in waiting time
Average waiting time per passenger during peak hour (number of minutes)
Government inspection
Inbound Waiting time in inbound immigration area
Waiting time in inbound baggage inspection area
Outbound Waiting time in outbound immigration area
Security clearance Quality of security search process
Gate lounges Quality and availability of seating in lounge area
Crowding in lounge area
Baggage processing Waiting time for inbound baggage arrival
Information display regarding inbound baggage location
Circulation space for baggage pick-up
Baggage trolleys Findability of baggage trolleys
Signage and wayfi nding FID (fl ight information display) screens
Signage and wayfi nding
Washrooms Standard of washroom facilities
Car parking Standard of car park facilities
Availability of car parking spaces
Time taken to enter car park
airport access Congestion at kerbside taxi drop-off and pick-up
Facilities for kerbside taxi drop-off and pick-up
… for taxis Standard of facilities for taxis
Waiting time to get a taxi

QUALITY OF SERVICE REPORT: 2004–05 APPENDIX 1 67
Airline user surveyThe ACCC’s survey of airlines using monitored airports asked questions about each airline’s satisfaction with the following items:
Facility Satisfaction with …
Airside
Runways
Taxiways
Apron system
1. Standard; 2. Availability
1. Standard; 2. Availability
1. Standard; 2. Availability
Gates (including hardstand)/aircraft facilities (including parking bays)
1. Standard; 2. Availability
Ground service equipment storage sites 1. Standard; 2. Availability
Terminal
Aerobridges 1. Standard; 2. Availability
Check-in facilitiesincluding counters, IT systems and queuing areas
1. Standard; 2. Availability
Baggage processing facilities 1. Standard; 2. Availability
Management
Overall system for addressing quality of service concerns
Notes:
1. Availability: the amount of the service made available to an airline relative to demands for the service. May include whether facilities are available or restricted due to congestion, positioning, maintenance, or repairs, the accessibility or usefulness of the facility/service provided, and the effi ciency of the system to allocate usage.
2. Standard: the standard/condition of the facility supplied, and condition in which it is generally maintained.
3. Management and consultation provided by airport operator in relation to the listed services—relates to airport operator’s responsiveness and approach when dealing with quality of service issues with the airline, including addressing new and recurring quality concerns, and keeping airlines informed of imminent changes.

APPENDIX 2 QUALITY OF SERVICE REPORT: 2004–0568
Appendix 2 Base data for objective indicators
This appendix sets out the base data for objective indicators. The indicators of adequacy derived from the base data are shown earlier in each airport’s section.
Airport traffi cTable A1 sets out the key traffi c fi gures at price-monitored airports. The table shows the average peak-hour times at each airport, number of passengers at peak hour, and the total number of passengers for the year. Owing to the fl exibility in determining what the average peak hour is, the measures may not be strictly comparable between airports.
Table A1 Number of passengers at peak hour and total annual number of passengers 2004–05
Airport Terminal Arriving/ departing
Peak-hour time Number of passengers in
peak hour
Year total passengers
2004–05
AdelaideInternational
Arriving N/A(a) 480 168 168
Departing N/A(a) 430 156 698
DomesticArriving 1900–2000 546 2 628 690
Departing 0600–0700 501
BrisbaneInternational
Arriving 0700–0759 1 297 2 145 203
Departing 0800–0859 1 033 2 142 426
DomesticArriving 1800–1859 551 1 753 450
Departing 0800–0859 522
CanberraDomestic
Arriving 0750–0850 N/P2 484 032(b)
Departing 0815–0915 N/P
DarwinInternational
Arriving 0400–0500 260 80 100
Departing 0500–0600 200 78 400
DomesticArriving 0010–0110 675 535 700
Departing 0100–0200 675 536 900
MelbourneInternational
Arriving 0653–0752 1 484 2 264 826
Departing 0917–1016 1 655 2 143 435
DomesticArriving 1859–1958 1 039 3 140 295
Departing 1904–2003 991
PerthInternational
Arriving 1400–1459 956 1 005 870
Departing 1600–1659 972 971 392
DomesticArriving 2200–2259 714 658 513
Departing 2300–2359 608 670 178
SydneyInternational
Arriving 600 2 750 5 559 921
Departing 900 N/P 5 367 150
DomesticArriving 1500 1 651 9 329 539
Departing 1200 N/P
(a) Adelaide airport advised that due to the low volume of international traffi c it was unable to accurately quantify the peak-hour time for the international terminal. As such, the number of international passengers arriving and departing during average peak hour has been provided as an estimate to enable the calculation of some objective measures.
(b) This is the total number of regular public transport (RPT) passengers at Canberra airport during 2004–05. It should be noted that this fi gure includes both international and domestic passengers.

QUALITY OF SERVICE REPORT: 2004–05 APPENDIX 2 69
Airport scale of provision of serviceThe following table shows some indicators of the number or size of key facilities at each airport. This data indicates the scale of provision of service, but cannot be taken as indicators of the adequacy or quality of facilities. The adequacy of facilities depends on the level of demand which they are required to meet. Quality is also a refl ection of the condition of facilities, wear and tear and so on.
Airside facilitiesTable A2 shows the provision of aircraft parking bays and aerobridges at terminals operated by the airport.
Table A2 Airside facilities 2004–05
Airport Terminal Number of aircraft parking bays
Number of aerobridges
Adelaide International 4 0
Domestic 13 0
Brisbane International 13 10
Domestic 9 2
Canberra Domestic 13 2
Darwin International/domestic 10 RPT 3
Other 90 GA1 0
Melbourne International 20 11
Domestic 20 10
Perth International 9 5
Domestic 15 2
Sydney International 39 27
Domestic 27 13
1. General aviation

APPENDIX 2 QUALITY OF SERVICE REPORT: 2004–0570
Term
inal
facil
ities
Tabl
e A3
sh
ow
s th
e n
um
ber
of t
erm
inal
faci
litie
s av
aila
ble
at e
ach
ter
min
al o
per
ated
by
the
airp
ort
.
Tabl
e A
3 Te
rmin
al fa
cilit
ies
2004
–05
Airp
ort
Term
inal
Nu
mbe
r o
f ch
eck-
in d
esks
Nu
mbe
r o
f se
curi
ty-
clea
ran
ce
syst
ems
Nu
mbe
r o
f se
ats
in g
ate
lou
nge
s
Area
of g
ate
lou
nge
s, s
quar
e m
etre
s
Nu
mbe
r o
f o
utb
ou
nd
bag
s h
and
led
Nu
mbe
r o
f bag
gage
tr
olle
ys
Nu
mbe
r o
f FI
Ds
Nu
mbe
r o
f in
form
atio
n
po
ints
Ad
elai
de
Inte
rnat
ion
al12
234
061
026
6 38
724
06
1
Do
mes
tic
152
240
1 20
02
628
690
110
172
Bri
sban
eIn
tern
atio
nal
6310
1 52
28
600
2 26
4 35
31
432
211
9
Do
mes
tic
122
427
3 52
240
4 05
535
031
4
Can
berr
aD
om
esti
c10
144
01
591
N/P
100
191
Dar
win
Inte
rnat
ion
al24
122
572
9ai
rlin
e o
per
ated
173
3918
Do
mes
tic
228
5 u
p t
o 5
91(a
)56
6 u
p t
o 1
598
(a)
airl
ine
op
erat
ed
Mel
bou
rne
Inte
rnat
ion
al72
42
079
4 03
12
383
091
2 35
067
1
Do
mes
tic
334
963
3 19
5N
/A15
038
0
Pert
hIn
tern
atio
nal
294
512
3 18
61
214
529
650
741
Do
mes
tic
163
431
2 90
078
2 53
338
524
1
Syd
ney
Inte
rnat
ion
al19
217
4 10
96
335
6 03
2 94
94
725
870
5
Do
mes
tic
3910
1 63
04
457
3 47
0 46
259
043
01
(a)
Du
rin
g 20
04–0
5, D
arw
in a
irp
ort
co
mp
lete
d t
he
con
stru
ctio
n o
f its
‘sw
ing
lou
nge
’, w
hic
h o
per
ates
su
ch t
hat
du
rin
g p
eak
do
mes
tic
per
iod
s w
hen
th
ere
are
no
inte
rnat
ion
al fl
igh
ts, t
he
enti
re t
erm
inal
faci
lity
(in
clu
din
g th
e in
tern
atio
nal
are
a) is
o
pen
ed u
p fo
r d
om
esti
c p
asse
nge
rs. T
her
efo
re, d
uri
ng
do
mes
tic
pea
k h
ou
rs, t
he
inte
rnat
ion
al s
etti
ng
and
lou
nge
are
a is
o
pen
ed u
p fo
r d
om
esti
c u
se.

QUALITY OF SERVICE REPORT: 2004–05 APPENDIX 2 71
Car parkingTable A4 shows the number of short-term and long-term car parking spaces at each airport. Some are identifi ed as terminal specifi c.
Table A4 Car parking facilities, price monitored airports, 2004–05
Airport Terminal Number of short-term car park
spaces
Number of long- term car park
spaces
Number of staff car park spaces
Adelaide International 450 N/A N/A
Domestic 815 N/A N/A
Brisbane International 950 N/A 708
Domestic 938 3 600 1 641
Canberra Domestic 377 687 155
Darwin Total airport 556 12(a) 177
Melbourne Total airport 3 553 6 859 1 300
Perth International 1 077 N/A N/A
Domestic 1 645 614 N/A
Sydney International 1 560 4 361 1 202
Domestic 3 045 N/A N/A
(a) Refers to the locked compound available for dedicated long-term car parking. Darwin airport advised that long-term car parking is also available in the short-term car park.

APPENDIX 2 QUALITY OF SERVICE REPORT: 2004–0572
Adelaide airportAs a Phase II airport Adelaide airport has provided quality of service information since 2000–01.
Table A5 shows the objective measures at the international terminal at Adelaide airport for the period between 2000–01 to 2004–05, where available.
Table A5 Objective measures for the international terminal at Adelaide airport
Indicator 2000–01 2001–02 2002–03 2003–04 2004–05
Number of aircraft parking bays 5 5 5 4
Number of aerobridges 1 1 0 0
Number of passengers arriving from international aircraft via aerobridges
84 741 112 317 0
Total number of arriving passengers from international aircraft
112 988 149 576 168 168
Number of arriving passengers 112 988 149 576 168 168
Number of arriving international aircraft using aerobridges
858 624 0
Number of passengers departing in international aircraft via aerobridges
76 738 132 718 0
Total number of departing passengers in international aircraft
102 318 176 958 156 698
Total number of check-in desks 12 12 12 12 12
Number of hours with more than 80 per cent of check-in desks staffed
821 585 585
Total number of hours any check-in desks are open 3 285 2 340 2 340
Number of inbound immigration desks 10 10 10
Number of inbound baggage inspection desks 1 1 12 12 12
Number of outbound migration desks 5 5 5
Number of security-clearance systems 1 2 2 2 2
Number of seats in gate lounges 333 333 340 340
Square metres of lounge area 608 610 610
Capacity of outbound baggage handling system, bags per hour
360 360 360
Number of outbound bags handled 141 447 171 948 266 387
Number of hours outbound baggage system is in use 3 285 2 340 2 340
Number of planned interruptions to outbound baggage system
0 0 0
Total number of hours of planned interruption to outbound baggage system
0 0 0
Number of unplanned interruptions to outbound baggage system
0 0 0
Number of hours of unplanned interruption to outbound baggage system
0 0 0
Number of hours inbound baggage handling system is in use
1 326 1 326 1 326

QUALITY OF SERVICE REPORT: 2004–05 APPENDIX 2 73
Indicator 2000–01 2001–02 2002–03 2003–04 2004–05
Number of planned interruptions to inbound baggage system
0 0 0
Total number of hours of planned interruption to inbound baggage system
0 0 0
Number of unplanned interruptions to inbound baggage system
0 0 0
Total number of hours of unplanned interruption to inbound baggage system
0 0 0
Number of working accessible baggage trolleys 230 240 240
Number of FID (fl ight information display) screens 3 7 6 6 6
Number of information points 3 7 2 1 1
Time of average peak hour for arriving passengers 0 0600–0700 N/P
Time of average peak hour for departing passengers 0 1400–1500 N/P
Total number of passengers arriving during average peak hour
460 481 480
Total number of passengers departing during average peak hour
460 431 430

APPENDIX 2 QUALITY OF SERVICE REPORT: 2004–0574
Table A6 shows the objective measures at Adelaide airport for the domestic terminal for 2002–03 to 2004–05.
Table A6 Objective measures for the domestic terminal at Adelaide airport
Indicator 2002–03 2003–04 2004–05
Number of aircraft parking bays 13 13 13
Number of aerobridges 0 0 0
Number of arriving passengers 438 678 2 295 585 2 628 690
Total number of check-in desks 12 12 15
Number of hours with more than 80 per cent of check-in desks staffed 3 285 3 395 3 395
Total number of hours any check-in desks are open 5 475 5 658 5 658
Number of security-clearance systems 2 2 2
Number of seats in gate lounges 240 240 240
Square metres of lounge area 1 200 1 200 1 200
Capacity of outbound baggage handling system, bags per hour 360 360 360
Number of hours outbound baggage system is in use 5 475 5 658 5 658
Number of planned interruptions to outbound baggage system 0 0 0
Total number of hours of planned interruption to outbound baggage system
0 0 0
Number of unplanned interruptions to outbound baggage system 0 0 0
Number of hours of unplanned interruption to outbound baggage system, including extra hours where interruptions longer than planned
0 0 0
Number of hours inbound baggage handling system is in use 4 927 4 927 4 927
Number of planned interruptions to inbound baggage system 0 0 0
Total number of hours of planned interruption to inbound baggage system 0 0 0
Number of unplanned interruptions to inbound baggage system 0 0 0
Total number of hours of unplanned interruption to inbound baggage system, including extra hours where interruptions longer than planned
0 0 0
Number of working accessible baggage trolleys 110 110 110
Number of FID (fl ight information display) screens 7 25 17(a)
Number of information points 1 2 2
Time of average peak hour for arriving passengers 0 1900–2000 1900–2000
Time of average peak hour for departing passengers 0 0600–0700 0600–0700
Total number of passengers arriving during average peak hour 500 507 546
Total number of passengers departing during average peak hour 500 465 501
(a) There are 25 FID screens operating in the domestic terminal; however, only 17 are managed by the airport.

QUALITY OF SERVICE REPORT: 2004–05 APPENDIX 2 75
Table A7 shows the number of short-term and long-term car parking spaces at Adelaide airport.
Table A7 Objective measures for car parking at Adelaide airport
Short-term car park—international terminal 2002–03 2003–04 2004–05
Number of days short-term car park is open 365 365 365
Number of spaces available 450 430(a) 450
Total annual throughput 108 000 144 701 197 739
Short-term car park—domestic terminal
Number of days short-term car park is open 365 365 365
Number of spaces available 740 740 815
Total annual throughput 800 000 910 831 941 579
(a) Adelaide airport advised that the reduction in short-term car park spaces available was due to the commencement of terminal works.

APPENDIX 2 QUALITY OF SERVICE REPORT: 2004–0576
Brisb
ane
airp
ort
Tabl
e A8
sh
ow
s th
e o
bjec
tive
mea
sure
s fo
r th
e in
tern
atio
nal
ter
min
al a
t B
risb
ane
airp
ort
for
the
per
iod
19
97–9
8 to
200
4–05
, wh
ere
avai
labl
e.
Tabl
e A
8 O
bjec
tive
mea
sure
s fo
r th
e in
tern
atio
nal t
erm
inal
at
Bri
sban
e ai
rpor
t
Ind
icat
or
1997
–98
1998
–99
1999
–200
020
00–0
120
01–0
220
02–0
320
03–0
420
04–0
5
Nu
mbe
r o
f air
craf
t p
arki
ng
bays
11
11
11
13
1313
1313
Nu
mbe
r o
f aer
obr
idge
s 8
8
8
8
10
1010
10
Nu
mbe
r o
f pas
sen
gers
arr
ivin
g fr
om
inte
rnat
ion
al a
ircr
aft
via
aero
brid
ges
1 64
0 77
01
858
143
2 13
7 06
2
Tota
l nu
mbe
r o
f arr
ivin
g p
asse
nge
rs fr
om
inte
rnat
ion
al a
ircr
aft
1 78
9 64
11
859
853
2 14
5 20
3
Nu
mbe
r o
f arr
ivin
g p
asse
nge
rs1
789
641
1 85
9 85
32
145
203
Nu
mbe
r o
f arr
ivin
g in
tern
atio
nal
air
craf
t u
sin
g ae
robr
idge
sN
/P9
564
11 3
48
Nu
mbe
r o
f pas
sen
gers
dep
arti
ng
in in
tern
atio
nal
air
craf
t vi
a ae
robr
idge
s1
581
981
1 85
9 60
32
141
617
Tota
l nu
mbe
r o
f dep
arti
ng
pas
sen
gers
in in
tern
atio
nal
air
craf
t1
728
424
1 86
1 04
92
142
426
Tota
l nu
mbe
r o
f ch
eck-
in d
esks
54
54
54
54
5454
5463
Nu
mbe
r o
f ho
urs
wit
h m
ore
th
an 8
0 p
er c
ent
of c
hec
k-in
des
ks
staf
fed
39
236
Tota
l nu
mbe
r o
f ho
urs
an
y ch
eck-
in d
esks
are
op
en6
575
7 39
47
461
Nu
mbe
r o
f in
bou
nd
imm
igra
tio
n d
esks
2
6 2
6 2
6 2
6 26
2626
26
Nu
mbe
r o
f in
bou
nd
bag
gage
insp
ecti
on
des
ks
19
19
19
20
2424
2630
Nu
mbe
r o
f ou
tbo
un
d m
igra
tio
n d
esks
20
20
20
20
2020
2020
Nu
mbe
r o
f sec
uri
ty-c
lear
ance
sys
tem
s 3
3
3
3
4
49
10
Nu
mbe
r o
f sea
ts in
gat
e lo
un
ges
1 21
6 1
246
1 24
6 1
246
1 52
21
522
1 52
21
522
Squ
are
met
res
of l
ou
nge
are
aN
/P9
667
8 60
0
Cap
acit
y o
f ou
tbo
un
d b
agga
ge h
and
ling
syst
em, b
ags
per
ho
ur
6 00
0 6
000
6 00
0 6
000
6 00
06
000
6 00
06
000
Nu
mbe
r o
f ou
tbo
un
d b
ags
han
dle
d1
527
901
1 85
5 93
72
264
353
Nu
mbe
r o
f ho
urs
ou
tbo
un
d b
agga
ge s
yste
m is
in u
se5
840
6 02
26
205
Nu
mbe
r o
f pla
nn
ed in
terr
up
tio
ns
to o
utb
ou
nd
bag
gage
sys
tem
N/P
00

QUALITY OF SERVICE REPORT: 2004–05 APPENDIX 2 77
Ind
icat
or
1997
–98
1998
–99
1999
–200
020
00–0
120
01–0
220
02–0
320
03–0
420
04–0
5
Tota
l nu
mbe
r o
f ho
urs
of p
lan
ned
inte
rru
pti
on
to
ou
tbo
un
d
bagg
age
syst
em N
/P0
0
Nu
mbe
r o
f un
pla
nn
ed in
terr
up
tio
ns
to o
utb
ou
nd
bag
gage
sys
tem
N/P
3
619
2 22
6
Nu
mbe
r o
f ho
urs
of u
np
lan
ned
inte
rru
pti
on
to
ou
tbo
un
d b
agga
ge
syst
emN
/P
302
186
Cap
acit
y o
f in
bou
nd
bag
gage
han
dlin
g sy
stem
, bag
s p
er h
ou
r9
000
9 00
0 9
000
9 00
0 9
000
9 00
09
000
9 00
0
Nu
mbe
r o
f ho
urs
inbo
un
d b
agga
ge h
and
ling
syst
em is
in u
se N
/P2
493
2 62
8
Nu
mbe
r o
f pla
nn
ed in
terr
up
tio
ns
to in
bou
nd
bag
gage
sys
tem
N/P
0
0
Nu
mbe
r o
f un
pla
nn
ed in
terr
up
tio
ns
to in
bou
nd
bag
gage
sys
tem
N/P
33
137
0
Tota
l nu
mbe
r o
f ho
urs
of u
np
lan
ned
inte
rru
pti
on
to
inbo
un
d
bagg
age
syst
emN
/P
27.6
31
Nu
mbe
r o
f wo
rkin
g ac
cess
ible
bag
gage
tro
lleys
N/P
1
500
1 43
2
Nu
mbe
r o
f FID
(fl i
ght
info
rmat
ion
dis
pla
y) s
cree
ns
N/P
21
121
1
Nu
mbe
r o
f in
form
atio
n p
oin
tsN
/P
99
Tim
e o
f ave
rage
pea
k h
ou
r fo
r ar
rivi
ng
pas
sen
gers
0700
–080
007
00–0
800
0700
–075
9
Tim
e o
f ave
rage
pea
k h
ou
r fo
r d
epar
tin
g p
asse
nge
rs08
00–0
900
0800
–090
008
00–0
859
Tota
l nu
mbe
r o
f pas
sen
gers
arr
ivin
g d
uri
ng
aver
age
pea
k h
ou
r1
116
1 34
71
297
Tota
l nu
mbe
r o
f pas
sen
gers
dep
arti
ng
du
rin
g av
erag
e p
eak
ho
ur
859
873
1 03
3

APPENDIX 2 QUALITY OF SERVICE REPORT: 2004–0578
Table A9 shows the objective measures for the international and domestic terminals at Brisbane airport for 2003–04 to 2004–05.
Table A9 Objective measures for domestic terminal facilities at Brisbane airport
Indicator 2003–04 2004–05
Number of aircraft parking bays 9 9
Number of aerobridges 2 2
Number of arriving passengers 234 268 1 753 450
Total number of check-in desks 12 12
Number of security-clearance systems 2 2
Number of seats in gate lounges 427 427
Square metres of lounge area 3 744 3 522
Capacity of outbound baggage handling system, bags per hour 3 000 3 000
Number of unplanned interruptions to outbound baggage system 9 405
Number of hours of unplanned interruption to outbound baggage system, including extra hours where interruptions longer than planned 4 34
Capacity of inbound baggage handling system, bags per hour 1 700 1 700
Number of working accessible baggage trolleys 40 350
Number of FID (fl ight information display) screens 29 31
Number of information points 4 4
Time of average peak hour for arriving passengers 1800–1900 1800–1859
Time of average peak hour for departing passengers 0800–0900 0800–0859
Total number of passengers arriving during average peak hour 380 551
Total number of passengers departing during average peak hour 337 522

QUALITY OF SERVICE REPORT: 2004–05 APPENDIX 2 79
Table A10 shows the objective measures for the car park facilities at Brisbane airport for 2002–03 to 2004–05.
Table A10 Objective measures for car parking at Brisbane airport
Short-term car park—international terminal 2002–03 2003–04 2004–05
Number of days short-term car park is open 365 365 365
Number of spaces available 1 000 950 950
Total annual throughput 612 740 661 163 752 553
Short-term car park—domestic terminal
Number of days short-term car park is open 365 365 365
Number of spaces available 985 938 938
Total annual throughput 1 160 903 1 157 220 1 176 229
Long-term car park—domestic terminal
Number of days long-term domestic car park is open 365 365 365
Number of spaces available 2 350 1 500 3 600
Total annual throughput 142 621 189 828 213 685
Staff car parking
Number of parking spaces for staff 2 263 2 277 1 641

APPENDIX 2 QUALITY OF SERVICE REPORT: 2004–0580
Canberra airportTable A11 shows the objective measures for the domestic terminal at Canberra airport for the period 2000–01 to 2004–05, where available.
Table A11 Objective measures for domestic terminal at Canberra airport
Indicator 2000–01 2001–02 2002–03 2003–04 2004–05
Number of aircraft parking bays 12 13 13 13 13
Number of aerobridges 2 2 2
Number of arriving passengers 960 496 Unknown Unknown
Total number of check-in desks 4 4 8 10 10
Number of hours with more than 80 per cent of check-in desks staffed Unknown Unknown Unknown
Total number of hours any check-in desks are open Unknown Unknown Unknown
Number of security-clearance systems 1 1 1 0 1
Number of seats in gate lounges 64 332 356 376 440
Square metres of lounge area 1 591 1 591 1 591
Number of planned interruptions to outbound baggage system 0 0 0
Total number of hours of planned interruption to outbound baggage system 0 0 0
Number of unplanned interruptions to outbound baggage system 0 0 2
Number of hours of unplanned interruption to outbound baggage system 0 0 1.5
Number of planned interruptions to inbound baggage system 0 0 0
Total number of hours of planned interruption to inbound baggage system 0 0 0
Number of unplanned interruptions to inbound baggage system 0 0 0
Total number of hours of unplanned interruption to inbound baggage system 0 0 0
Number of working accessible baggage trolleys 100 100 100
Number of FID (fl ight information display) screens 5 7 9 19 19
Number of information points 1 1 1 1 1
Time of average peak hour for arriving passengers 0750–0845 0750–0845 0750–0850
Time of average peak hour for departing passengers 0815–0915 0815–0915 0815–0915
Total number of passengers arriving during average peak hour Unknown Unknown Unknown
Total number of passengers departing during average peak hour Unknown Unknown Unknown

QUALITY OF SERVICE REPORT: 2004–05 APPENDIX 2 81
Table A12 shows the objective measures for car parking at Canberra airport for 2002–03 to 2004–05.
Table A12 Objective measures for car parking at Canberra airport
Short-term car park 2002–03 2003–04 2004–05
Number of days short-term car park is open, fi nancial year 365 365 365
Number of short-term parking spaces available to the public, 30 June 266 359 377
Total annual throughput of short-term car park, fi nancial year Unknown 487 847 511 169
Long-term car park
Number of days long-term car park is open, fi nancial year 365 365 365
Number of long-term parking spaces available to the public, 30 June 790 697 687
Total annual throughput of long-term car park, fi nancial year Unknown 91 242 85 816
Staff car park
Number of parking spaces for staff 122 136 155

APPENDIX 2 QUALITY OF SERVICE REPORT: 2004–0582
Dar
win
airp
ort
Tabl
e A1
3 sh
ow
s th
e o
bjec
tive
mea
sure
s fo
r th
e in
tern
atio
nal
ter
min
al a
t D
arw
in a
irp
ort
for
1999
–200
0 to
200
4–05
. Ple
ase
no
te t
hat
Dar
win
air
po
rt is
a s
ingl
e in
tegr
ated
ter
min
al c
ater
ing
for
both
inte
rnat
ion
al a
nd
do
mes
tic
traf
fi c. S
om
e o
bjec
tive
mea
sure
s n
ote
d b
elo
w a
pp
ly t
o t
he
term
inal
as
a w
ho
le.
Tabl
e A
13
Obj
ecti
ve m
easu
res
for
the
inte
rnat
iona
l ter
min
al a
t D
arw
in a
irpo
rt
Ind
icat
or
1999–2
000
2000–0
12001–0
22002–0
32003–0
42004–0
5
Nu
mbe
r o
f air
craf
t p
arki
ng
bays
(in
tern
atio
nal
an
d d
om
esti
c)10
10
1010
1010
Nu
mbe
r o
f aer
obr
idge
s (i
nte
rnat
ion
al a
nd
do
mes
tic)
3 3
3
33
3(a)
Tota
l nu
mbe
r o
f arr
ivin
g p
asse
nge
rs fr
om
inte
rnat
ion
al a
ircr
aft
77 0
0068
400
80 1
00
Nu
mbe
r o
f arr
ivin
g p
asse
nge
rs77
000
68 4
0080
100
Tota
l nu
mbe
r o
f dep
arti
ng
pas
sen
gers
in in
tern
atio
nal
air
craf
t75
000
68 3
0078
400
Tota
l nu
mbe
r o
f ch
eck-
in d
esks
(in
tern
atio
nal
an
d d
om
esti
c)22
2424
Nu
mbe
r o
f ho
urs
wit
h m
ore
th
an 8
0 p
er c
ent
of c
hec
k–in
des
ks s
taff
edN
/PN
/PN
/P
Tota
l nu
mbe
r o
f ho
urs
an
y ch
eck-
in d
esks
are
op
en 4
4
N/P
N/P
N/P
Nu
mbe
r o
f in
bou
nd
imm
igra
tio
n d
esks
8
88
Nu
mbe
r o
f in
bou
nd
bag
gage
insp
ecti
on
des
ks
1 1
1
1111
11
Nu
mbe
r o
f ou
tbo
un
d m
igra
tio
n d
esks
65
5
Nu
mbe
r o
f sec
uri
ty-c
lear
ance
sys
tem
s1
1
11
11
Nu
mbe
r o
f sea
ts in
gat
e lo
un
ges
224
224
22
422
522
522
5
Squ
are
met
res
of l
ou
nge
are
a70
770
772
9
Nu
mbe
r o
f wo
rkin
g ac
cess
ible
bag
gage
tro
lleys
(in
tern
atio
nal
an
d d
om
esti
c)15
016
517
3
Nu
mbe
r o
f FID
(fl i
ght
info
rmat
ion
dis
pla
y) s
cree
ns
5
72
2N
/A
Nu
mbe
r o
f in
form
atio
n p
oin
ts 1
1
11
N/A
Tim
e o
f ave
rage
pea
k h
ou
r fo
r ar
rivi
ng
pas
sen
gers
0400
–050
004
00–0
500
0400
–050
0
Tim
e o
f ave
rage
pea
k h
ou
r fo
r d
epar
tin
g p
asse
nge
rs05
00–0
600
0500
–060
005
00–0
600
Tota
l nu
mbe
r o
f pas
sen
gers
arr
ivin
g d
uri
ng
aver
age
pea
k h
ou
r22
016
026
0
Tota
l nu
mbe
r o
f pas
sen
gers
dep
arti
ng
du
rin
g av
erag
e p
eak
ho
ur
220
160
200
a)
Dar
win
air
po
rt a
dvi
sed
th
at it
has
alw
ays
had
th
ree
aero
brid
ges.
In
th
e p
ast,
it h
as r
epo
rted
sep
arat
ely
for
inte
rnat
ion
al a
nd
do
mes
tic
term
inal
s. D
arw
in a
irp
ort
no
w c
on
sid
ers
it
mo
re a
pp
rop
riat
e to
rep
ort
th
e n
um
ber
of a
ero
brid
ges
base
d o
n a
sin
gle
term
inal
faci
lity
wh
ereb
y m
ost
, if n
ot
all,
faci
litie
s ar
e av
aila
ble
and
use
d fo
r bo
th in
tern
atio
nal
an
d d
om
esti
c se
rvic
es.

QUALITY OF SERVICE REPORT: 2004–05 APPENDIX 2 83
Table A14 shows the objective measures for the domestic terminal at Darwin airport for 2002–03 to 2004–05.
Table A14 Objective measures for the domestic terminal at Darwin airport
Indicator 2002–03 2003–04 2004–05
Number of arriving passengers 425 000 475 800 535 700
Number of hours with more than 80 per cent of check-in desks staffed
Airline operated Airline operated Airline operated
Total number of hours any check-in desks are open Airline operated Airline operated Airline operated
Number of security-clearance systems 1 2 2
Number of seats in gate lounges 397 397 285 to 591(a)
Square metres of lounge area 922 1 053 1 053 to 1 598(a)
Capacity of outbound baggage handling equipment, bags per hour
N/P 1 100 1 100
Number of outbound bags handled Airline operated Airline operated Airline operated
Number of hours outbound baggage system is in use Airline operated Airline operated Airline operated
Capacity of inbound baggage handling equipment, bags per hour
N/P N/P N/P
Number of inbound bags handled Airline operated Airline operated Airline operated
Number of hours inbound baggage system is in use Airline operated Airline operated Airline operated
Number of FID (fl ight information display) screens 20 20 39(b)
Number of information points 17 17 18(b)
Time of average peak hour for arriving passengers 0010–0110 0030–0130 0010–0110
Time of average peak hour for departing passengers 0100–0200 0130–0230 0100–0200
Total number of passengers arriving during average peak hour
470 675 675
Total number of passengers departing during average peak hour
470 675 675
(a) During 2004–05 Darwin airport completed the construction of its ‘swing lounge’, which operates such that during peak domestic periods when there are no international fl ights, the entire terminal facility (including the international area) is opened up for domestic passengers. Therefore, during domestic peak hours, the international seating and lounge area is opened up for domestic use.
(b) Total for the international and domestic terminal.

APPENDIX 2 QUALITY OF SERVICE REPORT: 2004–0584
Table A15 shows the objective measures for car parking at Darwin airport for 2002–03 to 2004–05.
Table A15 Objective measures for car parking at Darwin airport
Short-term car park 2002–03 2003–04 2004–05
Number of days short-term car park is open 365 365 365
Number of short-term parking spaces available to the public 556 556 556
Total annual throughput of short-term car park 220 000 245 300 281 700
Long-term car park(a)
Number of days long-term car park is open 365 365 365
Number of long-term parking spaces available to the public 12 12 12
Total annual throughput of long-term car park N/P N/P N/P
Staff car parking
Number of parking spaces for staff 177 177 177
(a) Refers to the locked compound available for dedicated long-term car parking. Darwin airport advised that long-term car parking is also available in the short-term car park.

QUALITY OF SERVICE REPORT: 2004–05 APPENDIX 2 85
Mel
bour
ne a
irpor
tTa
ble
A16
sho
ws
the
obj
ecti
ve m
easu
res
for
the
inte
rnat
ion
al t
erm
inal
at
Mel
bou
rne
airp
ort
for
the
per
iod
be
twee
n 1
997–
98 a
nd
200
4–05
.
Tabl
e A
16
Obj
ecti
ve m
easu
res
for
the
inte
rnat
iona
l ter
min
al a
t M
elbo
urne
air
port
Ind
icat
or
1997–9
81998–9
91999–2
000
2000–0
12001–0
22002–0
32003–0
42004–0
5
Nu
mbe
r o
f air
craf
t p
arki
ng
bays
1414
1514
14
1414
20
Nu
mbe
r o
f aer
obr
idge
s10
1010
10
1010
1111
Nu
mbe
r o
f pas
sen
gers
arr
ivin
g fr
om
inte
rnat
ion
al a
ircr
aft
via
aero
brid
ges
1 73
0 11
81
966
293
2 24
1 63
0
Tota
l nu
mbe
r o
f arr
ivin
g p
asse
nge
rs fr
om
inte
rnat
ion
al a
ircr
aft
1 73
7 06
71
969
899
2 26
4 82
6
Nu
mbe
r o
f arr
ivin
g p
asse
nge
rs1
737
067
1 96
9 89
92
264
826
Nu
mbe
r o
f arr
ivin
g in
tern
atio
nal
air
craf
t u
sin
g ae
robr
idge
s9
941
11 2
4313
120
Nu
mbe
r o
f pas
sen
gers
dep
arti
ng
in in
tern
atio
nal
air
craf
t vi
a ae
robr
idge
s1
645
389
1 91
1 05
72
115
030
Tota
l nu
mbe
r o
f dep
arti
ng
pas
sen
gers
in in
tern
atio
nal
air
craf
t1
650
341
1 91
5 59
02
143
435
Tota
l nu
mbe
r o
f ch
eck-
in d
esks
7272
7272
(a)
72(a
)72
7272
Nu
mbe
r o
f ho
urs
wit
h m
ore
th
an 8
0 p
er c
ent
of c
hec
k-in
des
ks
staf
fed
823
43
Tota
l nu
mbe
r o
f ho
urs
an
y ch
eck-
in d
esks
are
op
en7
859
7 22
17
256
Nu
mbe
r o
f in
bou
nd
imm
igra
tio
n d
esks
26
(b)
2626
26
2626
2624
Nu
mbe
r o
f in
bou
nd
bag
gage
insp
ecti
on
des
ks
1616
1616
16
1616
16
Nu
mbe
r o
f ou
tbo
un
d m
igra
tio
n d
esks
1818
18
18
1818
1818
Nu
mbe
r o
f sec
uri
ty-c
lear
ance
sys
tem
s6
66
6
7(c)
3(d)
34
Nu
mbe
r o
f sea
ts in
gat
e lo
un
ges
2 28
92
363
2 17
21
984
2 03
42
323
2 11
02
079
Squ
are
met
res
of l
ou
nge
are
a4
031
4 03
14
031
Cap
acit
y o
f ou
tbo
un
d b
agga
ge h
and
ling
syst
em, b
ags
per
ho
ur
3 06
03
060
3 06
03
060
3 06
03
060
3 06
03
060
Nu
mbe
r o
f ou
tbo
un
d b
ags
han
dle
d1
963
094
2 12
1 31
72
383
091
Nu
mbe
r o
f ho
urs
ou
tbo
un
d b
agga
ge s
yste
m is
in u
se7
665
7 68
67
686

APPENDIX 2 QUALITY OF SERVICE REPORT: 2004–0586
Ind
icat
or
1997–9
81998–9
91999–2
000
2000–0
12001–0
22002–0
32003–0
42004–0
5
Tota
l nu
mbe
r o
f ho
urs
of p
lan
ned
inte
rru
pti
on
to
ou
tbo
un
d
bagg
age
syst
em22
624
432
8
Nu
mbe
r o
f ho
urs
of u
np
lan
ned
inte
rru
pti
on
to
ou
tbo
un
d b
agga
ge
syst
em26
913
517
1
Cap
acit
y o
f in
bou
nd
bag
gage
han
dlin
g sy
stem
, bag
s p
er h
ou
rN
/A2
720
2 72
02
720
2 72
02
720
2 72
02
720
Nu
mbe
r o
f ho
urs
inbo
un
d b
agga
ge h
and
ling
syst
em is
in u
seN
/P5
983
5 98
3
Nu
mbe
r o
f pla
nn
ed in
terr
up
tio
ns
to in
bou
nd
bag
gage
sys
tem
N/P
N/A
N/A
Tota
l nu
mbe
r o
f ho
urs
of p
lan
ned
inte
rru
pti
on
to
inbo
un
d
bagg
age
syst
emN
/P19
.521
.3
Tota
l nu
mbe
r o
f ho
urs
of u
np
lan
ned
inte
rru
pti
on
to
inbo
un
d
bagg
age
syst
emN
/P9.
38.
8
Nu
mbe
r o
f wo
rkin
g ac
cess
ible
bag
gage
tro
lleys
1 50
01
500
2 35
0
Nu
mbe
r o
f FID
(fl i
ght
info
rmat
ion
dis
pla
y) s
cree
ns
6767
67
Nu
mbe
r o
f in
form
atio
n p
oin
ts1
11
Tim
e o
f ave
rage
pea
k h
ou
r fo
r ar
rivi
ng
pas
sen
gers
0700
074
8–08
4806
53–0
752
Tim
e o
f ave
rage
pea
k h
ou
r fo
r d
epar
tin
g p
asse
nge
rs09
00 1
740–
1840
0917
–101
6
Tota
l nu
mbe
r o
f pas
sen
gers
arr
ivin
g d
uri
ng
aver
age
pea
k h
ou
r98
61
383
1 48
4
Tota
l nu
mbe
r o
f pas
sen
gers
dep
arti
ng
du
rin
g av
erag
e p
eak
ho
ur
1 15
51
277
1 65
5
(a)
Th
is fi
gure
has
bee
n m
ista
ken
ly r
epo
rted
in p
revi
ou
s A
CC
C Q
ua
lity
of
serv
ice—
pric
e m
onit
ored
air
port
s m
onit
orin
g re
port
s as
84,
wh
ich
incl
ud
ed 1
2 se
rvic
e d
esks
. Mel
bou
rne
airp
ort
ad
vise
d t
hat
th
e co
rrec
t fi g
ure
is 7
2.
(b)
Th
is fi
gure
has
bee
n m
ista
ken
ly r
epo
rted
in p
revi
ou
s A
CC
C Q
ua
lity
of
serv
ice—
pric
e m
onit
ored
air
port
s m
onit
orin
g re
port
s as
16.
Mel
bou
rne
airp
ort
ad
vise
d t
hat
th
e co
rrec
t fi g
ure
is 2
6.
(c)
Th
is fi
gure
was
mis
take
nly
rep
ort
ed a
s si
x in
th
e A
CC
C Q
ua
lity
of
serv
ice—
pric
e m
onit
ored
air
port
s m
onit
orin
g re
port
20
02–0
3. M
elbo
urn
e ai
rpo
rt a
dvi
sed
th
at t
he
corr
ect
fi gu
re is
sev
en.
(d)
Th
is fi
gure
was
mis
take
nly
rep
ort
ed a
s si
x in
th
e A
CC
C Q
ua
lity
of
serv
ice—
pric
e m
onit
ored
air
port
s m
onit
orin
g re
port
20
02–0
3. M
elbo
urn
e ai
rpo
rt a
dvi
sed
th
at t
he
corr
ect
fi gu
re is
th
ree.

QUALITY OF SERVICE REPORT: 2004–05 APPENDIX 2 87
Table A17 shows the objective measures for the domestic terminal at Melbourne airport for 2002–03 to 2004–05.
Table A17 Objective measures for the domestic terminal at Melbourne airport
Indicator 2002–03 2003–04 2004–05
Number of aircraft parking bays 10 16 20
Number of aerobridges 8 8 10
Number of arriving passengers 1 989 876 2 695 391 3 140 295
Total number of check-in desks 22 27 33
Number of security-clearance systems 2 4 4
Number of seats in gate lounges 853 851 963
Square metres of lounge area 2 325 3 195 3 195
Total number of hours of planned interruption to inbound baggage system
20 N/P(a) N/P
Total number of hours of unplanned interruption to inbound baggage system, including extra hours where interruptions longer than planned
5 N/P(a) N/P
Number of working accessible baggage trolleys 150 150 150
Number of FID (fl ight information display) screens 38 38 38
Time of average peak hour for arriving passengers N/P 1712–1812 1859–1958
Time of average peak hour for departing passengers N/P 0743–0843 1904–2003
Total number of passengers arriving during average peak hour N/P 999 1 039
Total number of passengers departing during average peak hour N/P 923 991
(a) Melbourne airport advised that the number of hours of planned and unplanned interruptions to the inbound baggage system was not collected in 2003–04 due to in-line check bag screening works.

APPENDIX 2 QUALITY OF SERVICE REPORT: 2004–0588
Tabl
e A1
8 sh
ow
s th
e o
bjec
tive
mea
sure
s fo
r ca
r p
arki
ng
at M
elbo
urn
e ai
rpo
rt fr
om
199
7–98
to
200
4–05
.
Tabl
e A
18
Obj
ecti
ve m
easu
res
for
car
park
ing
at M
elbo
urne
air
port
Sh
ort
-ter
m c
ar p
ark
ing
1997–9
81998–9
91999–2
000
2000–0
12001–0
22002–0
32003–0
42004–0
5
Nu
mbe
r o
f day
s sh
ort
-ter
m c
ar p
ark
is o
pen
, fi n
anci
al y
ear
365
365
365
365
365
365
365
365
Nu
mbe
r o
f sh
ort
-ter
m p
arki
ng
spac
es a
vaila
ble
to t
he
pu
blic
, 30
Ju
ne
2 72
92
763
2 76
03
100
3 10
03
088
2 52
23
553
Tota
l an
nu
al t
hro
ugh
pu
t o
f sh
ort
-ter
m c
ar p
ark,
fi n
anci
al y
ear
2 47
2 87
52
553
540
2 64
5 52
02
377
610
2 48
1 17
32
667
214
2 71
8 50
7
Lo
ng-
term
car
par
kin
g
Nu
mbe
r o
f day
s lo
ng-
term
car
par
k is
op
en, fi
nan
cial
yea
r36
536
536
536
536
536
536
536
5
Nu
mbe
r o
f lo
ng-
term
par
kin
g sp
aces
ava
ilabl
e to
th
e p
ubl
ic,
30 J
un
e3
439
3 43
94
189
4 78
94
789
4 92
85
623
6 85
9
Tota
l an
nu
al t
hro
ugh
pu
t o
f lo
ng-
term
car
par
k, fi
nan
cial
yea
r24
7 83
526
6 81
530
3 31
532
7 04
034
9 73
741
2 97
341
7 66
7
Sta
ff c
ar p
ark
ing
Nu
mbe
r o
f par
kin
g sp
aces
for
staf
f1
092
1 30
01
300

QUALITY OF SERVICE REPORT: 2004–05 APPENDIX 2 89
Pert
h ai
rpor
tTa
ble
A19
sho
ws
the
obj
ecti
ves
mea
sure
s fo
r th
e in
tern
atio
nal
ter
min
al a
t Pe
rth
air
po
rt fo
r th
e p
erio
d b
etw
een
199
7–98
an
d 2
004–
05, w
her
e av
aila
ble.
Tabl
e A
19
Obj
ecti
ve m
easu
res
for
the
inte
rnat
iona
l ter
min
al a
t Pe
rth
airp
ort
Ind
icat
or
1997–9
81998–9
91999–2
000
2000–0
12001–0
22002–0
32003–0
42004–0
5
Nu
mbe
r o
f air
craf
t p
arki
ng
bays
77
7 7
7
79
9
Nu
mbe
r o
f aer
obr
idge
s5
55
5
55
55
Nu
mbe
r o
f pas
sen
gers
arr
ivin
g fr
om
inte
rnat
ion
al a
ircr
aft
via
aero
brid
ges
930
506
896
814
1 00
0 18
4
Tota
l nu
mbe
r o
f arr
ivin
g p
asse
nge
rs fr
om
inte
rnat
ion
al a
ircr
aft
959
883
902
093
1 00
5 87
0
Nu
mbe
r o
f arr
ivin
g p
asse
nge
rs95
9 88
390
2 09
31
005
870
Nu
mbe
r o
f arr
ivin
g in
tern
atio
nal
air
craf
t u
sin
g ae
robr
idge
s5
129
4 67
85
167
Nu
mbe
r o
f pas
sen
gers
dep
arti
ng
in in
tern
atio
nal
air
craf
t vi
a ae
robr
idge
s88
0 66
985
8 93
896
6 04
4
Tota
l nu
mbe
r o
f dep
arti
ng
pas
sen
gers
in in
tern
atio
nal
air
craf
t91
1 76
586
4 44
597
1 39
2
Tota
l nu
mbe
r o
f ch
eck-
in d
esks
2424
24 2
4 24
3030
29
Nu
mbe
r o
f ho
urs
wit
h m
ore
th
an 8
0 p
er c
ent
of c
hec
k-in
des
ks
staf
fed
179
6716
0
Tota
l nu
mbe
r o
f ho
urs
an
y ch
eck-
in d
esks
are
op
en52
097
52 7
4366
708
Nu
mbe
r o
f in
bou
nd
imm
igra
tio
n d
esks
16
1616
16
1616
1818
Nu
mbe
r o
f in
bou
nd
bag
gage
insp
ecti
on
des
ks
2020
20 2
0 20
2828
28
Nu
mbe
r o
f ou
tbo
un
d m
igra
tio
n d
esks
1010
10 1
0 10
1010
10
Nu
mbe
r o
f sec
uri
ty-c
lear
ance
sys
tem
s2
22
3
33(a
)3(a
)4
Nu
mbe
r o
f sea
ts in
gat
e lo
un
ges
435
359
357
355
35
544
544
551
2
Squ
are
met
res
of l
ou
nge
are
a1
921
1 85
03
186
Cap
acit
y o
f ou
tbo
un
d b
agga
ge h
and
ling
syst
em, b
ags
per
ho
ur
5 76
05
760
5 76
05
760
5 76
05
760
5 76
05
760
Nu
mbe
r o
f ou
tbo
un
d b
ags
han
dle
d1
045
623
1 00
5 08
41
214
529
Nu
mbe
r o
f ho
urs
ou
tbo
un
d b
agga
ge s
yste
m is
in u
se8
823
8 82
88
648
Nu
mbe
r o
f pla
nn
ed in
terr
up
tio
ns
to o
utb
ou
nd
bag
gage
sys
tem
N/P
88

APPENDIX 2 QUALITY OF SERVICE REPORT: 2004–0590
Ind
icat
or
1997–9
81998–9
91999–2
000
2000–0
12001–0
22002–0
32003–0
42004–0
5
Tota
l nu
mbe
r o
f ho
urs
of p
lan
ned
inte
rru
pti
on
to
ou
tbo
un
d
bagg
age
syst
emN
/P90
60
Nu
mbe
r o
f un
pla
nn
ed in
terr
up
tio
ns
to o
utb
ou
nd
bag
gage
sys
tem
N/P
23
Nu
mbe
r o
f ho
urs
of u
np
lan
ned
inte
rru
pti
on
to
ou
tbo
un
d b
agga
ge
syst
emN
/P8
30.2
Cap
acit
y o
f in
bou
nd
bag
gage
han
dlin
g sy
stem
, bag
s p
er h
ou
rN
/AN
/A8
640
8 6
40
8 64
08
640
8 64
08
640
Nu
mbe
r o
f in
bou
nd
bag
s h
and
led
N
/PN
/AN
/A
Nu
mbe
r o
f ho
urs
inbo
un
d b
agga
ge h
and
ling
syst
em is
in u
seN
/P1
956
3 09
8
Nu
mbe
r o
f pla
nn
ed in
terr
up
tio
ns
to in
bou
nd
bag
gage
sys
tem
N/P
124
Tota
l nu
mbe
r o
f ho
urs
of p
lan
ned
inte
rru
pti
on
to
inbo
un
d
bagg
age
syst
emN
/P66
22
Nu
mbe
r o
f un
pla
nn
ed in
terr
up
tio
ns
to in
bou
nd
bag
gage
sys
tem
N/P
10
Tota
l nu
mbe
r o
f ho
urs
of u
np
lan
ned
inte
rru
pti
on
to
inbo
un
d
bagg
age
syst
emN
/P24
0
Nu
mbe
r o
f wo
rkin
g ac
cess
ible
bag
gage
tro
lleys
700
750
650
Nu
mbe
r o
f FID
(fl i
ght
info
rmat
ion
dis
pla
y) s
cree
ns
5858
74
Nu
mbe
r o
f in
form
atio
n p
oin
ts1
11
Tim
e o
f ave
rage
pea
k h
ou
r fo
r ar
rivi
ng
pas
sen
gers
1500
–160
014
00–1
500
1400
–1
459
Tim
e o
f ave
rage
pea
k h
ou
r fo
r d
epar
tin
g p
asse
nge
rs07
00–0
800
1500
–160
016
00
–165
9
Tota
l nu
mbe
r o
f pas
sen
gers
arr
ivin
g d
uri
ng
aver
age
pea
k h
ou
r70
878
295
6
Tota
l nu
mbe
r o
f pas
sen
gers
dep
arti
ng
du
rin
g av
erag
e p
eak
ho
ur
794
790
972
(a)
Pert
h a
irp
ort
ad
vise
d t
he
ACC
C t
hat
it in
corr
ectl
y re
po
rted
th
e n
um
ber
of s
ecu
rity
-cle
aran
ce s
yste
ms
in t
he
inte
rnat
ion
al
term
inal
in 2
002–
03 a
nd
200
3–04
as
bein
g tw
o. T
his
has
no
w b
een
co
rrec
ted
to
th
ree.

QUALITY OF SERVICE REPORT: 2004–05 APPENDIX 2 91
Table A20 shows the objective measures for the domestic terminal at Perth airport for the years 2003–04 and 2004–05.
Table A20 Objective measures for the domestic terminal at Perth airport
Indicator 2003–04 2004–05
Number of aircraft parking bays 7 15
Number of aerobridges 2 2
Number of arriving passengers 587 417(a) 658 513
Total number of check-in desks 16 16
Number of hours with more than 80 per cent of check-in desks staffed 183 24
Total number of hours any check-in desks are open 10 669 36 179
Number of security-clearance systems 1 3
Number of seats in gate lounges 510 431
Square metres of lounge area 1 877 2 900
Capacity of outbound baggage handling system, bags per hour 4 230 4 230
Number of outbound bags handled 772 950 782 533
Number of hours outbound baggage system is in use 6 752 6 752
Number of planned interruptions to outbound baggage system 4 4
Total number of hours of planned interruption to outbound baggage system 60 30
Number of unplanned interruptions to outbound baggage system 20 6
Number of hours of unplanned interruption to outbound baggage system, including extra hours where interruptions longer than planned
70 30
Capacity of inbound baggage handling system, bags per hour 4 013 4 013
Number of inbound bags handled 753 942 575 235
Number of hours inbound baggage handling system is in use 1 449 1 882
Number of planned interruptions to inbound baggage system 4 4
Total number of hours of planned interruption to inbound baggage system 60 22
Number of unplanned interruptions to inbound baggage system 2 4
Total number of hours of unplanned interruption to inbound baggage system, including extra hours where interruptions longer than planned
55 60
Number of working accessible baggage trolleys 300 385
Number of FID (fl ight information display) screens 16 24
Number of information points 1 1
Time of average peak hour for arriving passengers 1400–1500 2200–2259
Time of average peak hour for departing passengers 1400–1500 2300–2359
Total number of passengers arriving during average peak hour 414 714
Total number of passengers departing during average peak hour 366 608
(a) Perth airport advised the ACCC that it incorrectly reported the number of arriving passengers in 2003–04 as being 1 182 492. This has now been corrected to 587 417.

APPENDIX 2 QUALITY OF SERVICE REPORT: 2004–0592
Table A21 shows the objective measures for car parking at Perth airport for 2002–03 to 2004–05.
Table A21 Objective measures for car parking at Perth airport
Short-term car park—international terminal 2002–03 2003–04 2004–05
Number of days short-term car park is open, fi nancial year 365 365 365
Number of short-term parking spaces available to the public, 30 June 1 077 1 077 1 077
Total annual throughput of short-term car park, fi nancial year 685 316 640 673 679 657
Short-term car park—domestic terminal
Number of days short-term car park is open, fi nancial year 365 365 365
Number of short-term parking spaces available to the public, 30 June 1 030 1 195 1 645
Total annual throughput of short-term car park, fi nancial year 916 494 1 002 611 949 879
Staff car parking
Number of car parking spaces for staff 927 931

QUALITY OF SERVICE REPORT: 2004–05 APPENDIX 2 93
Sydn
ey a
irpor
t Ta
ble
A22
sho
ws
the
obj
ecti
ve m
easu
res
rep
ort
ed fo
r th
e in
tern
atio
nal
ter
min
al a
t Sy
dn
ey a
irp
ort
for
1998
–99
to
200
4–05
wh
ere
avai
labl
e.
Tabl
e A
22
Obj
ecti
ve m
easu
res
for
the
inte
rnat
iona
l ter
min
al a
t Sy
dney
air
port
Ind
icat
or
1998–9
91999–2
000
2000–0
12001–0
22002–0
32003–0
42004–0
5
Nu
mbe
r o
f air
craf
t p
arki
ng
bays
2439
40
39
3939
39
Nu
mbe
r o
f aer
obr
idge
s8
27
27
2732
2727
Nu
mbe
r o
f pas
sen
gers
arr
ivin
g fr
om
inte
rnat
ion
al a
ircr
aft
via
aero
brid
ges
4 17
7 48
74
380
135
5 53
5 04
5
Tota
l nu
mbe
r o
f arr
ivin
g p
asse
nge
rs fr
om
inte
rnat
ion
al a
ircr
aft
4 24
1 10
44
446
838
5 55
9 92
1
Nu
mbe
r o
f arr
ivin
g p
asse
nge
rs4
241
104
4 44
6 83
85
559
921
Nu
mbe
r o
f arr
ivin
g in
tern
atio
nal
air
craf
t u
sin
g ae
robr
idge
s22
481
24 4
0226
859
Nu
mbe
r o
f pas
sen
gers
dep
arti
ng
in in
tern
atio
nal
air
craf
t vi
a ae
robr
idge
s3
934
138
4 45
8 05
45
346
987
Tota
l nu
mbe
r o
f dep
arti
ng
pas
sen
gers
in in
tern
atio
nal
air
craf
t3
994
049
4 52
5 94
35
367
150
Tota
l nu
mbe
r o
f ch
eck-
in d
esks
130
192
21
4 21
419
419
419
2
Nu
mbe
r o
f ho
urs
wit
h m
ore
th
an 8
0 p
er c
ent
of c
hec
k-in
des
ks s
taff
ed0
N/P
0
Tota
l nu
mbe
r o
f ho
urs
an
y ch
eck-
in d
esks
are
op
en50
7 48
058
9 64
946
4 03
8
Nu
mbe
r o
f in
bou
nd
imm
igra
tio
n d
esks
62
62
62
6262
6264
Nu
mbe
r o
f in
bou
nd
bag
gage
insp
ecti
on
des
ks
3545
62
11
487
2646
Nu
mbe
r o
f ou
tbo
un
d m
igra
tio
n d
esks
5454
54
54
5454
54
Nu
mbe
r o
f sec
uri
ty-c
lear
ance
sys
tem
s7
11
12
1220
2017
Nu
mbe
r o
f sea
ts in
gat
e lo
un
ges
2 16
73
196
4 1
09
4 10
94
109
4 10
94
109
Squ
are
met
res
of l
ou
nge
are
a6
335
6 33
56
335
Cap
acit
y o
f ou
tbo
un
d b
agga
ge h
and
ling
syst
em, b
ags
per
ho
ur
4 94
06
270
6 2
70
6 27
06
270
6 27
06
270
Nu
mbe
r o
f ou
tbo
un
d b
ags
han
dle
d5
224
192
5 81
8 74
46
032
949
Nu
mbe
r o
f ho
urs
ou
tbo
un
d b
agga
ge s
yste
m is
in u
se6
570
6 58
86
570
Nu
mbe
r o
f pla
nn
ed in
terr
up
tio
ns
to o
utb
ou
nd
bag
gage
sys
tem
00
0
Tota
l nu
mbe
r o
f ho
urs
of p
lan
ned
inte
rru
pti
on
to
ou
tbo
un
d b
agga
ge s
yste
m0
00

APPENDIX 2 QUALITY OF SERVICE REPORT: 2004–0594
Ind
icat
or
1998–9
91999–2
000
2000–0
12001–0
22002–0
32003–0
42004–0
5
Nu
mbe
r o
f un
pla
nn
ed in
terr
up
tio
ns
to o
utb
ou
nd
bag
gage
sys
tem
6334
37
Nu
mbe
r o
f ho
urs
of u
np
lan
ned
inte
rru
pti
on
to
ou
tbo
un
d b
agga
ge s
yste
m52
104
97
Cap
acit
y o
f in
bou
nd
bag
gage
han
dlin
g sy
stem
, bag
s p
er h
ou
r7
350
11 3
25 1
1 32
5 11
325
11 3
4011
340
11 3
40
Nu
mbe
r o
f in
bou
nd
bag
s h
and
led
5
215
366
4 47
1 54
64
630
269
Nu
mbe
r o
f ho
urs
inbo
un
d b
agga
ge h
and
ling
syst
em is
in u
se6
570
6 58
86
570
Nu
mbe
r o
f pla
nn
ed in
terr
up
tio
ns
to in
bou
nd
bag
gage
sys
tem
00
0
Tota
l nu
mbe
r o
f ho
urs
of p
lan
ned
inte
rru
pti
on
to
inbo
un
d b
agga
ge s
yste
m0
00
Nu
mbe
r o
f un
pla
nn
ed in
terr
up
tio
ns
to in
bou
nd
bag
gage
sys
tem
1023
4
Tota
l nu
mbe
r o
f ho
urs
of u
np
lan
ned
inte
rru
pti
on
to
inbo
un
d b
agga
ge s
yste
m8
6951
Nu
mbe
r o
f wo
rkin
g ac
cess
ible
bag
gage
tro
lleys
3 98
03
400
4 72
5
Nu
mbe
r o
f FID
(fl i
ght
info
rmat
ion
dis
pla
y) s
cree
ns
1 05
01
050
870
Nu
mbe
r o
f in
form
atio
n p
oin
ts4
45
Tim
e o
f ave
rage
pea
k h
ou
r fo
r ar
rivi
ng
pas
sen
gers
0800
–090
007
0006
00
Tim
e o
f ave
rage
pea
k h
ou
r fo
r d
epar
tin
g p
asse
nge
rs09
00–1
000
0900
0900
Tota
l nu
mbe
r o
f pas
sen
gers
arr
ivin
g d
uri
ng
aver
age
pea
k h
ou
r2
432
2 15
42
750
Tota
l nu
mbe
r o
f pas
sen
gers
dep
arti
ng
du
rin
g av
erag
e p
eak
ho
ur
1 59
71
458
1 65
1

QUALITY OF SERVICE REPORT: 2004–05 APPENDIX 2 95
Table A23 shows the objective measures for the domestic terminal which Sydney airport operates for 2002–03 to 2004–05.
Table A23 Objective measures for the domestic terminal at Sydney airport
Indicator 2002–03 2003–04 2004–05
Number of aircraft parking bays 27 27 27
Number of aerobridges 13 13 13
Number of arriving passengers 7 974 100 8 727 230 9 329 539
Total number of check-in desks 33 39 39
Number of hours with more than 80 per cent of check-in desks staffed N/A N/P 6 207
Total number of hours any check-in desks are open N/A 240 597 244 289
Number of security-clearance systems 6 10 10
Number of seats in gate lounges 1 630 1 630 1 630
Square metres of lounge area 4 457 4 457 4 457
Capacity of outbound baggage handling system, bags per hour 3 500 3 500 3 500
Number of outbound bags handled 1 391 101 3 276 885 3 470 462
Number of hours outbound baggage system is in use 4 794 6 588 6 570
Number of planned interruptions to outbound baggage system N/A N/A 0
Total number of hours of planned interruption to outbound baggage system N/A N/A 0
Number of unplanned interruptions to outbound baggage system 40 27 33
Number of hours of unplanned interruption to outbound baggage system 23 15 29.5
Capacity of inbound baggage handling system, bags per hour 3 533 3 533 3 533
Number of inbound bags handled 1 380 000 1 183 183 3 470 462
Number of hours inbound baggage handling system is in use 4 794 6 588 6 570
Number of planned interruptions to inbound baggage system N/P N/P 0
Total number of hours of planned interruption to inbound baggage system N/P N/P 0
Number of unplanned interruptions to inbound baggage system 11 6 1
Total number of hours of unplanned interruption to inbound baggage system
6 3 0.1
Number of working accessible baggage trolleys 300 300 590
Number of FID (fl ight information display) screens 450 450 430
Number of information points N/P N/P 1
Time of average peak hour for arriving passengers 1800 1800 1800
Time of average peak hour for departing passengers 0800 0800 0800
Total number of passengers arriving during average peak hour N/P 1 038 N/P
Total number of passengers departing during average peak hour N/P 1 038 N/P

APPENDIX 2 QUALITY OF SERVICE REPORT: 2004–0596
Tabl
e A2
4 sh
ow
s th
e o
bjec
tive
mea
sure
s fo
r ca
r p
arki
ng
at S
ydn
ey a
irp
ort
for
1998
–99
to 2
004–
05.
Tabl
e A
24
Obj
ecti
ve m
easu
res
for
car
park
ing
at S
ydne
y ai
rpor
t
Sh
ort
-ter
m c
ar p
ark
ing—
inte
rnat
ion
al t
erm
inal
1998–9
91999–2
000
2000–0
12001–0
22002–0
32003–0
42004–0
5
Nu
mbe
r o
f day
s sh
ort
-ter
m c
ar p
ark
is o
pen
365
365
365
365
365
365
365
Nu
mbe
r o
f sh
ort
-ter
m p
arki
ng
spac
es a
vaila
ble
to t
he
pu
blic
(a)
4 12
74
539
4 93
55
039
2 00
01
700
1 56
0
Tota
l an
nu
al t
hro
ugh
pu
t o
f sh
ort
-ter
m c
ar p
ark(b
)1
838
112
2 88
3 86
52
804
809
1 80
3 88
31
477
661
1 60
3 26
31
659
294
Sh
ort
-ter
m c
ar p
ark
—d
om
esti
c te
rmin
al
Nu
mbe
r o
f day
s sh
ort
-ter
m c
ar p
ark
is o
pen
365
365
365
Nu
mbe
r o
f sh
ort
-ter
m p
arki
ng
spac
es a
vaila
ble
to t
he
pu
blic
2 67
82
700
3 04
5
Tota
l an
nu
al t
hro
ugh
pu
t o
f sh
ort
-ter
m c
ar p
ark
1 09
3 74
51
123
178
1 16
4 73
1
Lo
ng-
term
car
par
k
Nu
mbe
r o
f day
s lo
ng-
term
car
par
k is
op
en36
536
536
536
536
536
536
5
Nu
mbe
r o
f lo
ng-
term
par
kin
g sp
aces
ava
ilabl
e to
th
e p
ubl
ic1
320
1 86
72
692
2 69
22
688
2 68
84
361
Tota
l an
nu
al t
hro
ugh
pu
t o
f lo
ng-
term
car
par
k59
564
70 4
4581
046
80 5
8290
278
142
264
169
410
Sta
ff c
ar p
ark
Nu
mbe
r o
f par
kin
g sp
aces
for
staf
f1
698
1 48
51
202
(a)
Fo
r 19
98–9
9 to
200
1–02
, th
e n
um
ber
of s
ho
rt-t
erm
par
kin
g sp
aces
rel
ates
to
a t
ota
l fi g
ure
for
the
inte
rnat
ion
al a
nd
do
mes
tic
term
inal
.
(b)
Fo
r 19
98–9
9 to
200
1–02
, th
e an
nu
al t
hro
ugh
pu
t o
f sh
ort
-ter
m c
ar p
arki
ng
refe
rs t
o a
to
tal fi
gu
re fo
r th
e in
tern
atio
nal
an
d
do
mes
tic
term
inal
.