Quality of groundwater estimated from electric resistivity ...
24
Transcript of Quality of groundwater estimated from electric resistivity ...


STATE OF ILLINOISWILLIAM G. STRATTON, GovernorDEPARTMENT OF REGISTRATION AND EDUCATIONVERA M. BINKS, Director
QUALITY OF GROUNDWATERESTIMATED FROMELECTRIC RESISTIVITY LOGS
by
Wayne A. Pryor
DIVISION OF THE
ILLINOIS STATE GEOLOGICAL SURVEYJOHN C FRYE, Chief URBANA
CIRCULAR 215 1956
ILLINOIS GEOLOGfCAlSURVEY LIBRA Rv
JUN 7 for-

Digitized by the Internet Archive
in 2012 with funding from
University of Illinois Urbana-Champaign
http://archive.org/details/qualityofgroundw215pryo

QUALITY OF GROUNDWATERESTIMATED FROM
ELECTRIC RESISTIVITY LOGSby
Wayne A. Pryor
ABSTRACTThe resistivity of groundwater from 94 wells in Pennsylvanian
sandstone is estimated from electric well logs by using the formula:
Ra64 M x RmRw = —Ra 16"
where: Rw = resistivity of water in the bedrock (called "formationwater")
Ra64" = apparent resistivity of "long normal" resistivity
curve (64" or 71")
Ral6" = apparent resistivity of "short normal" resistivity
curve (16" or 18")
Rm = resistivity of drilling fluid
and converting the resistivity of the formation water to a sodium-chloride (NaCl) solution equivalent in parts per million. Content
of chloride and total solids, determined from chemical analyses of
water from nearby sandstone wells, are compared to NaCl equiva-
lent concentrations computed from electric well logs. Graphs show
the relationship between: 1) NaCl-solution equivalent and measuredchloride content, and 2) NaCl-solution equivalent and measured total
solids in water from Pennsylvanian sandstone strata in the Illinois
Basin. The deflection of the spontaneous potential curve is plotted
against the chloride content of formation water. Results indicate
that any effort to determine the quality of formation water from spon-
taneous potential curves must also take into consideration the resis-
tivity of the drilling fluid and the temperature of the formation, or the
conclusions may be erroneous.
INTRODUCTIONWithin areas of the Illinois Basin where glacial deposits are thin and do
not yield water, sandstone beds in the upper part of the Pennsylvanian bedr<
are a common source of groundwater. Many wells drilled into the sand
beds obtain water of high salinity, although others obtain relatively fresh water.
Unfortunately not enough water analyses are available to indicate the distribu
tion and extent of areas underlain by sandstones that carry fresh wat<
For a number of years, groundwater geologists have used spontaneous DO
tential (SP) logs to evaluate the quality of water in sandstones. The qua]
method of determining the resistivity of interstitial water by m.
flection of the SP curve from the "shale base line," as reported I 8 (19'
has been used successfully. However, the indefinite position of the sh.il.
line in SP curves representing shallow Pennsylvanian sandstone! In the HUB
[1]
ILLINOIS STATE GEOLOGICAL SURVEY
^HRIST.AN|iHELB
~
Yi
CUMBERLAND 1MONTGOMERY ,
• [fayette" iefWnghamL L —
^
i • • *|JASPER • '.CRAWFORD
I
h. ••I
r^"cF L__.. |
[MARTON1
|
"'CHIAND I LAWRENCE
i
* r*». •
t.—•I CLINTON
L- WASHINGTON JEFFERSON
I
Wl_Ji_—
1
IhTm.lton. white
V"anklin " • • *
SALINE ,GALLATIN V
.WILLIAMSON
Fig. 1. - Index map-showing location of pairs of sandstone wells and electric logs used in study.
Basin seriously limits the use of Wyllie's method in Illinois. The position of
the shale base line is indefinite because the sandstone aquifers are near the
surface.
Because the resistivity-log method of estimating water quality is not af-
fected by shallow depth, this investigation was undertaken to evaluate the use-'
fulness of electric resistivity logs to estimate water quality and to supplement :
data from water analyses. Analyses of water from wells in Pennsylvaniansandstones are compared with estimates based on resistivity logs from nearby
wells that penetrated the same aquifer. Figure 1 shows the geographic locatio
of the pairs of wells used in the study.
The Illinois State Water Survey supplied most of the water analyses used
in the study. J. T. Lewis and J. P. Cheevers assisted in collection of data.
The manuscript and data were critically read and checked by George B.
Maxey, Robert E. Bergstrom, and James E. Hackett of the Division of Ground-water Geology and Geophysical Exploration of the Illinois State Geological Sur-
vey. David Swann gave many helpful suggestions in regard to interpretations
of electric logs.
METHODSChemical analyses of groundwater were obtained chiefly from the Illinois
State Water Survey. Only those analyses were selected for water that wasknown to come from sandstone aquifers. Furthermore, to facilitate correlatio
of the aquifers and to assure similarity of water quality, the selections werelimited to analyses of water from sandstone wells that were within one mile of

QUALITY ESTIMATED FROM ELECTRIC LOGS 3
an electrically logged well. The method requires that the electric logs include
a "short normal" resistivity curve, a "long normal" resistivity curve, and aresistivity measurement of the drilling fluid at a given temperature.
Electric Well Logs
Electric well logs consist of two types of curves: 1) an SP curve, and 2)
one or more resistivity curves.
The SP curve (Doll, 1949), shown on the left side of the electric log andexpressed in millivolts, is influenced by the electrochemical effect, which var-ies with the ratio of the salinity of the drilling fluid to the salinity of the forma-tion water, and the electrokinetic effect, produced by the motion of the drilling
fluid into and through the sediments. The magnitude of the electrokinetic forcesdepends chiefly upon pressure difference between the drilling fluid and forma-tion fluids, the volume and nature of the filtrate, the filter medium, and, to
some extent, upon the depth of filtration. The electromotive forces set up by
the electrochemical phenomena act at the contacts of media of different natures.
Most earth materials, particularly porous and permeable formations such
as sandstone, conduct electricity only by means of the mineralized fluids they
contain (Guyod, 1944). Sandstone formations adjacent to well bores may con-
tain two types of fluids: 1) the water contained in the formation, and 2) the drill-
ing fluid that may invade the sandstone. The average depth of invasion is less
than one or two feet, but it varies with the porosity of the sandstone and the
condition of the drilling fluid.
The resistivity curves, shown on the right side of the electric log and ex-
pressed in ohms per meter per square meter, record differences in the appar-
ent electrical resistivity of the strata penetrated. The apparent resistivity of
the strata is recorded by one or more curves which represent different elec-
trode spacings that produce different amounts of penetration of the same beds
and hence yield slightly different resistivities for the same bed.
The short normal resistivity curve is recorded at a measuring electrode
generally located 16 or 18 inches from the current electrode. The apparent
resistivity given by this spacing is largely affected by the true resistivity of
materials within 18 inches of the midpoint between the electrodes. Because
the strata adjacent to the bore have been more or less invaded by the drilling
fluid, the short normal curve is essentially a measurement of the resistivity
of the rock that is saturated with drilling fluid.
The long normal resistivity curve, with an electrode spacing usually of
five or six feet, is largely influenced by the resistivity of the rocks within five
or six feet from the center of the well bore (Guyod, 1944). Because much of
the zone is relatively uncontaminated by drilling fluid, the long normal curve
is essentially a measurement of the resistivity of the rock where it is filled
with formation water.
The resistivity of the drilling fluid and the temperatures at which the
measurements were made are given on log headings. Drilling -fluid resistiv-
ities vary with temperature, and the well-bore temperatures at depth are usu-
ally different from surface temperatures. In Illinois the temperature of the
earth and of the fluids contained therein is variable and fluctuates seasonally
jfrom just below frost level to a depth of about 55 feet below land surface (Ben-

ILLINOIS STATE GEOLOGICAL SURVEY
300,000
200,000
_I00,000c
~ 50,000
"o
E ">. E
10, 000
5,000
000
500
1000.01 0.02 0.05 1 2 05 1.0 2.0
Resistivity ohm-meters
Fig. 2.
5.0 10.0 20-0 50.0 100.0
Resistivity graph for salinity and temperature of sodium chloride solution.
field, 1950), where the temperature is about 55 °F. Below 55 feet the tempera-
ture is believed to increase at a rate of about 1°F. for each 100 feet of depth.
Temperature corrections must be applied to drilling -fluid resistivities meas-
ured at the surface in order to determine their resistivities at depth.
Drilling fluids usually contain several soluble chemicals which vary in
tiieir capacity to conduct electric current. Formation waters in Pennsylvania]!
sandstone aquifers generally contain several ions, other than chloride, in solu-
tion. Some of them are ammonium, calcium, fluoride, iron, magnesium, man-ganese, nitrate, silica, and sulfate.
The quantitative influence that mixtures of the ions have on the resistivi-
ties of formation waters are not well known. The amounts of the various elec-
trolytes are converted to an equivalent concentration of sodium chloride (NaCl)
solution expressed in parts per million (ppm). The NaCl-solution equivalent
is defined as the concentration, in ppm, of pure sodium chloride in water that
has the same resistivity as that of a solution of salts. Figure 2 shows the var-
iation of resistivity at various temperatures in such a solution of sodium chlori
Methods of Calculation
The NaCl-solution equivalent concentration in the formation water is deter-
mined from the resistivity curves by: 1) determining the ratio of the apparent
resistivity of the long normal curve to the resistivity of the short normal curve
2) converting the resistivity of the drilling fluid at the temperature given on the
log heading to its resistivity at the temperature of the formation by the use of
the graph shown in figure 2, 3) calculating the resistivity of the formation water
QUALITY ESTIMATED FROM ELECTRIC LOGS
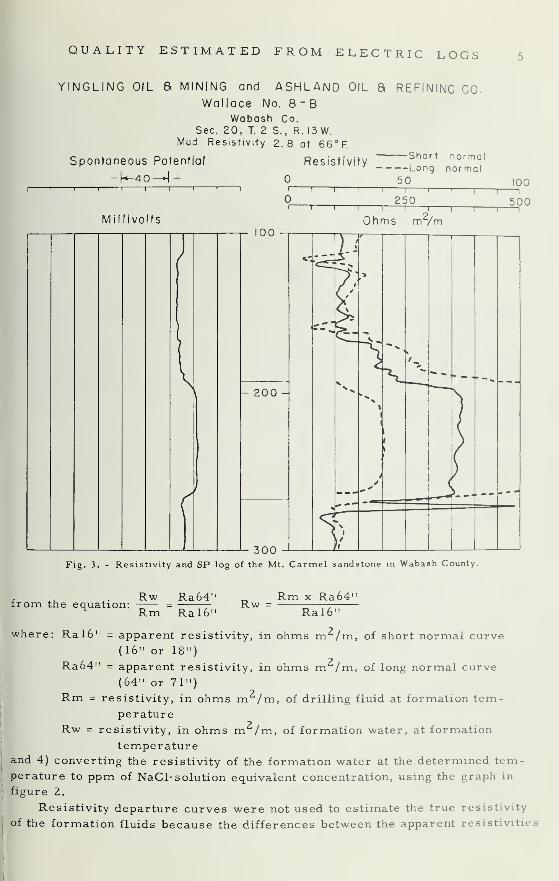
YINGLING OIL 8 MINING and ASHLAND OIL a REFININC CO.Wallace No. 8~B
Wabash Co.Sec. 20, T. 2 S., R. I3W.
Mud Resistivity 2.8 at 66° R
Spontaneous Potentia/
Millivolts
(
Resistivity
i i1 r
i1 1 r
Short normalLong normal
50 100
250
Ohms m /m100
300 -1
500
Fig. 3. - Resistivity and SP log of the Mt. Camel sandstone in Wabash County
i ,, ,. Rw Ra64'from the equation: = Rw Rm x Ra64'
Ral6 MRm Ral6'
where: Ral6" = apparent resistivity, in ohms m^/m, of short normal curve(16" or 18")
Ra64" = apparent resistivity, in ohms m /m, of long normal curve
(64" or 71")
Rm = resistivity, in ohms m /m, of drilling fluid at formation tem-perature
Rw = resistivity, in ohms m /m, of formation water, at formation
temperatureand 4) converting the resistivity of the formation water at the determined tem-
1 perature to ppm of NaCl- solution equivalent concentration, using the graph in
' figure 2.
Resistivity departure curves were not used to estimate the true resistivity
:
.of the formation fluids because the differences between the apparent resistivitie;

ILLINOIS STATE GEOLOGICAL SURVEY
30,000
10,000
5,000
1,000
500
00
50
10
!#^, ,
, ,
fjflf r
/
i
i|
gf
w
- -#4f
f/~rf -/-
J£/ {J-/
—>& ii A~w- -t-iz
/*
> i
\BF "-'7. /
-y i- V/
!W.
j FF :#—3:ty=—
T
—
if'!/* '
T / JEJf /
__I _H /
/
T (
!/-/-*/ffj-=t Lff-:
/ '
r___
r~~
' /r~
\
/ /
i
i
i
i
100 150 200 500 1000 1500 5000 10,000
NaCI-solutlon equivalents, ppm.
50,000
Fig. 4. - Measured chlorides vs. NaCl-solution equivalent concentration.
QUALITY ESTIMATED FROM ELECTRIC LOGS
50,000
10,000
5,000
1,000
500
100
«
•
o<£y
4 7^-^"
^
• >/ y
v"
/ ;/ /Z/ 'i
ri77
•1i 4
>—u-
it v//r
/
/1
-/-n in ji
1 =±Mk-^-,r%!#•;
/'/< /— LH>
;
1
1
1_ _J100 150 200 500 1000 1500 5000 10,000
NaCI-solution equivalents, ppm.
50,000
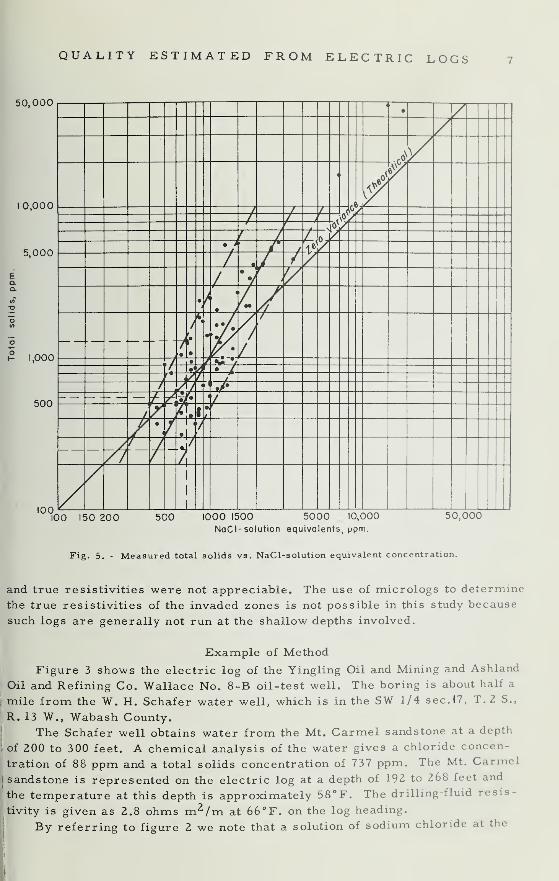
Fig. 5. - Measured total solids vs. NaCI-solution equivalent concentration.
and true resistivities were not appreciable. The use of micrologs to determine
the true resistivities of the invaded zones is not possible in this study because
such logs are generally not run at the shallow depths involved.
Example of Method
Figure 3 shows the electric log of the Yingling Oil and Mining and Ashland
Oil and Refining Co. Wallace No. 8-B oil-test well. The boring is about half a
i
mile from the W. H. Schafer water well, which is in the SW 1/4 sec. 17, T. 2 S.,
: R. 13 W., Wabash County.The Schafer well obtains water from the Mt. Carmel sandstone at a depth
|of 200 to 300 feet. A chemical analysis of the water gives a chloride concen-
tration of 88 ppm and a total solids concentration of 737 ppm. The Mt. Carmel
|
sandstone is represented on the electric log at a depth of 192 to 268 feet and
{the temperature at this depth is approximately 58°F. The drilling-fluid resis-
tivity is given as 2.8 ohms m2/m at 66°F. on the log heading.
By referring to figure 2 we note that a solution of sodium chloride at the

ILLINOIS STATE GEOLOGICAL SURVEY
30,000
10,000
5,000
1,000
500
100
50
10
i©
•VJ
4</>
•
••
• >
•
1
1
' •<
1
>
1
<
m i
<'
J•. >_
!
•
<
•
«
•1
8I
mi
•
1
<
•
i
•
, (
1 i
»
—
i
H»l
•
i-
•;t
•
4
•
—
<
1
I
<
J100 50 50 100
Spontaneous potential deflection in millivolts
Fig. 6. - Measured chloride content vs. SP data.
resistivity and temperature given has a resistivity of about 3.5 ohms m2 /m.The resistivity of the short normal curve is approximately 75 ohms m2/m andthat of the long normal curve approximately 200 ohms m2 /m.
Where: Ral6" = 75 ohms m2/mRa64" = 200 ohms m2 /mRm = 3.5 ohms m2/m
200 x 3.5Rw =75
Rw = 9.4 ohms m2/mFigure 2 shows that water at a temperature of 58°F., with a resistivity of
9.4 ohms m /m, has an NaCl-solution equivalent concentration of approximately700 ppm. Comparison of results from the electric log with the analysis showsthat the total solids closely correspond but that the chlorides do not in this par-ticular example.

QUALITY ESTIMATED FROM ELECTRIC LOGS 9
RESULTSThe results of the investigation are summarized in figures 4, 5, and 6.
In figure 4, data from 94 chemical analyses are plotted against estimatesof water quality based on resistivity curves. Chlorides in ppm (taken fromchemical analyses) are plotted along the vertical axis, and NaCl-solution equiv-alents (determined from resistivity-curve calculations) are plotted along the
horizontal axis.
The distribution of the plotted data, with respect to a theoretical line drawnthrough points where the vertical and horizontal coordinates are the same, call-
ed the "zero variance line," indicates the degree of accuracy of the method.The computed values for NaCl-solution equivalent and the analyzed values for
chloride coincide at about 4,000 ppm and diverge from the zero variance line.
The computed values of NaCl-solution equivalent below 4,000 ppm are generallyhigher than the chloride values and become increasingly higher as the chloride
content decreases. Conversely the computed values of NaCl-solution equiva-
lent above 4,000 ppm are lower than the chloride values and become increas-ingly lower as the chloride content increases.
Figure 4 may be used to estimate the chloride content of formation waterfrom calculations based on resistivity logs. The electric -log calculations fromthe resistivity curves in figure 3 give an NaCl-solution equivalent of 700 ppm.Applying this equivalent solution concentration to the curve in figure 4, one ar-
rives at an estimated concentration of 30 ppm or, by referring to the outer
dashed range curves, a concentration of chlorides ranging from 5 ppm to 200
ppm. A chemical analysis of the water from this formation indicates a chloride
content of about 88 ppm.In figure 5, chemical analyses and resistivity curve computations are plot-
ted for 78 pairs of data. Total solids in ppm (taken from chemical analyses)
are plotted along the vertical axis, and NaCl-solution equivalents (determined
from resistivity-curve calculations) are plotted along the horizontal axis.
A curve drawn through the plotted points, when compared to the zero var-
iance line, generally indicates a low degree of accuracy of estimating total
solids by this method, although a number of the points lie upon or are very
near the zero variance line. The computed values of NaCl-solution equivalent
and the analyzed values of total solids concentration coincide at about 1000 ppm.
Unlike the chloride curve (fig. 4), this series of points is distributed on both
sides of the zero variance line below and above the point of coincidence, but it
generally can be said that below 1000 ppm the computed values of NaCl- solution
equivalent are higher than total solids values and become higher as the content
of total solids decreases. Inversely the computed values of NaCl-solution equiv-
alent above 1000 ppm are lower than total solids values and become increasingly
lower as the content of total solids increases.
The curve in figure 5 may be used to estimate from electric -log calcula-
tions the content of total solids in formation water. The electric -lou calcula-
tions from the resistivity curves in figure 3 give an NaCl-solution equivalent
concentration of about 700 ppm. Applying the solution-equivalent concentral
to the curve in figure 5, one arrives at an estimated concentration of 550 ppn
or, by referring to the dashed range lines, a concentration of total solids ran

10 ILLINOIS STATE GEOLOGICAL SURVEY
ing from 250 pprri to 1300 ppm. A chemical analysis of the water from this for
mation indicates a total solids content of 737 ppm.
Figure 6 is a point-distribution diagram, based on 94 electric logs, that
shows the relationship of the SP deflection from a shale base line to chloride
content of formation water without regard to drilling -fluid resistivities and for-
mation temperatures.
At concentrations of less than 1000 ppm of chlorides, an equal distribution
of both positive and negative SP deflections appears, with the deflections rang-
ing from minus 85 millivolts to plus 30 millivolts. The deflections are general
negative at concentrations higher than 1000 ppm of chlorides.
SUMMARY AND CONCLUSIONSComparison of chemical analyses of formation water to calculated values
of NaCl-solution equivalent for 94 resistivity logs shows that the chloride con-
tent and total solids content of water in Pennsylvanian sandstones of the Illinois
Basin can be determined within a limited range by the use of resistivity logs.
The curves in figures 4 and 5 show that with extremely low or high content of
chloride and total solids, the concentration computed from resistivity logs var-,
ies greatly. Within certain limits, the curves can be used to estimate concen-
trations.
Comparison of the chloride content of formation waters to deflections of <
the 94 SP curves shows that the commonly used method of determining the rela
tive quality of formation waters, as reported by Priddy (1955), by the positionj
of the SP curve relative to the shale base line is likely to lead to erroneous
conclusions. Figure 6 shows that unless the resistivity of the drilling fluid and
the formation temperatures are considered in SP determinations, deflections of
the SP curve may be either positive or negative for formation water that has aj
low chloride content.
We need further study of the part played by electrolytes other than sodium;
chloride in influencing resistivity of drilling fluids and formation fluids. Forformation waters in which sodium chloride is the predominant electrolyte, the
relations shown in figure 2 permit reliable calculations.

QUALITY ESTIMATED FROM ELECTRIC LOGS il
Table 1. - Chemical Analyses and Electric Log Data for94 Wells in Pennsylvanian Sandstones
Location
Analyses (ppm)
Total
Electric logs
NaCl-equiva- SPWater well sec. T. R. Chlorides
BOND
solids lent (ppm) Millivolts
J. D. Biggs 24 4N 2W 230 430 850 -5
B. Boits 26 4N 2W 25 468 950
E. Seidler 37 4N 4W 310 980 1,400
L. Rich 28 5N 4W 9,595 16,590 7,000 -70
Pet Milk 10 5N 3W 1,770 3,920 2,000 -75
Pet Milk 9 5N 3W 181 671 1,000 -30
A. K. Moon 22 6N 2W 590 1,400 950 -30
Unit School 1 35 6N 2W 3,400 4,410 3,500 -50
N. Shidler 8 6N 4W 72
CHRISTIAN
476 400 +5
Bilyeau 1 10 13N IE 26,157
CLAY
44,322 19,000 -100
F. Haymes 14 3N 6E 10 760 550 +20
V. Lewis 33 5N 5E 210
CLINTON
926 1,200 -10
Star Milling 3 IN 4W 220 857 900 -20
J. Schweir 4 IN 4W 162 876 800 +5
New Baden 18 IN 5W 315 1,091 750 + 10
Trenton 20 2N 5W 215
CRAWFORD
750 -10
J. H. Ford 1 5N 12W 1,654 3,379 1,800 -25
L. M. Baker 1 7N 14W 154
EDWARDS
565 1,000 + 15
:ederal Bank 20 IS 14W 153 - 750 -35
>. 0. Bunting 3 2S 10E 29 - 700 -10
.. Siegert 29 2S 14W 47 - 650 -25
lover 4 3S 10E 32
EFFINGHAM
700
'ffingham School 30 7N 6E 720 1,536 1,400 -40
. Tophorn 7 8N 4E 2,700 5,800 2,800 -45

12 ILLINOIS STATE GEOLOGICAL SURVEY
Table 1. - Continued
Lo<:ation
Analyses (ppm)
Total
Electric logs
NaCl-equiva- SP
Water well sec. T. R. Chlorides solids lent (ppm) Millivol
M. P. Smith 31 8N 5E 112 921 1,150 -5
Unit School 40 34 8N 5E 460 1,122 1,400 -10
Shumway School 33 8N 5E 10
FAYETTE
415 750 -20
Smith 36 5N 4E 205 846 1,100
Joy's Cafe 32 5N 4E 98 624 1,200 +5
S. Morrison 8 8N IE 120 690 1,000
Ramsey 17 8N IE 113
FRANKLIN
660 1,300
L. Clayton 30 7S 3E 75 1,853 850 -45
4-H Club 17 7S 4E 11
HAMILTON
366 800 +5
A. L. Eswine 32 3S 6E 50 1,406 1,000
A. N. Allen 24 4S 6E 2,470 5,760 1,500 -5
Webb 14 5S 6E 610 2,200 1,700 -40
Reeves Court 14 5S 6E 610
JASPER
2,220 1,800 -20
0. Jones 6 6N HE 20 609 600 + 10
W. A. Cromer 4 8N 14W 188
JEFFERSON
669 900
F. Frost 4 2S 3E 67 2,461 850 +20
J. E. Lisenby 10 2S 3E 16 839 750 +20
J. E. Atkinson 17 2S 4E 123 956 1,100 +30
111. Central 26 2S 4E 12 903 400 -5
R. C. Ashby 27 2S 4E 169 2,512 1,000 +20
Game Farm 28 3S 3E 211
LAWRENCE
5,810 1,250 -30
St. Francisville 20 2N 11W 10 - 600 -25
E. L. Potts 20 2N 11W 16 373 550 + 15
J. E. Whittaker 24 4N 12W 195 1,281 700 +20
E. H. Eichorn 35 4N 13W 46 _ 550 +25

QUALITY EST IM/lTE D FROhI ELEiZ TRIC LO GS 13
Table .L. - Continued
Location
Analyses (ppm) Electric logs
Total NaCl-equiva- SP
Water well sec. T. R. Chlorides solids lent (ppm) Millivolts
MONTGOMERY
Comm. Unit 3 35 8N 3W 660 2,082 1,100 +30
Glen Heirs 31 9N 3W 340
MARION
1,754 900
Centralia 1 1 2N 2E 14 430 850 -5
Salem 11 2N 2E 243 750 1,400
Iuka School 18 2N 4E 8
PERRY
495 700
0. Bird 13 5S 3W 1,292 3,784 1,600 -20
Willisville 30 6S 4»V 12
RANDOLPH
302 650 -5
Percy 11 6S 5W 18
RICHLAND
322 500 +20
Noble 4 3N 9E 11 591 650 -85
B. Lemon 9 3N 9E 16 474 450 +5
Pure Oil 10 3N 9E 20 373 450 -60
Noble 16 3N 9E 1,700 4,140 1,900 -40
Hazel Hotel 17 3N 9E 246 1,001 1,200 -40
International Shoe 3 3N 10E 715 1,612 1,100 -35
H. A. Keer 4 3N 10E 1,260 2,701 1,500 +30
Olney Sanatorium 34 3N 10E 697 1,680 1,200 + 15
Claremont 4 4N 14W 16
SHELBY
493 500 +20
Baumgarten 1 ION 6E 2,450 5,028 2,500 -40
E. Kribe 13 UN 5E 2,350 5,222 2,500 -5
D. Casey 16 13N 5E 83
WABASH
628 1,100 +20
l
Andrews et al. 4 IN 12W 43 545 750
Allendale High School 11 IN 12W 12 460 850 +30
L. G. Stillwell 12 IN 12W 7 430 650 +20
P. P. Murray 34 IN 13W 9 912 500
E. Crow 9 IS 12W 63 510 600 +20
l,M. W. Willson 20 IS 12W 17 257 650 -40

14 ILLINOIS STATE GEOLOGICAL SURVEY
Table 1. - Continued
Location
Analyses (ppm)
Total
Electric logs
NaCl-equiva- SP
Water well sec. T. R. Chlorides solids lent (ppm) Millivolts
R. Wolf 14 IS 13W 13 500 600
Groff School 19 IS 13W 16 956 750 -15
R. C. Hardy 20 IS 13W 14 1,058 650 + 15
C. P. Steckler 24 IS 13W 112 - 650 -5
W. H. Schafer 7 2S 13W 88 737 700 + 15
WASHINGTON
McKinley 29 3S 3W 2,250
WAYNE
" 2,500 -20
D. Latch 16 IN 6E 20 - 900
Texas Co. 27 IN 6E 710 - 1,300 + 10
Texas Co. 34 IN 6E 410 - 950 -15
Billington 27 IN 7E 41 - 650 +25
L. Finley 6 IS 6E 20 - 900 + 10
M. Schaffer 12 2S 5E 82 - 700 +5
Vaught 33 2S 9E 27,500
WHITE
47,650 15,000 -35
Geff 26 4S 9E 2,050 4,215 2,200
Crossville 23 4S 10E 63 520 650 +5
Enfield 8 5S .8E 144 - 1,200
Enfield 8 5S 8E 15 1,365 750 +5
J. C. Stokes 13 5S 9E 295 1,387 1,100 -10
Kingwood Oil Co. 10 7S 9E 230 1,265 1,150 + 15

QUALITY ESTIMATED FROM ELECTRIC LOGS 15
REFERENCESBenfield, A. E., 1950, The earth heat: Scientific American, v. 183, no. 6, p.
54-57.
Doll, H. G., 1949, The SP log: Theoretical analysis and principle of interpre-tation: Trans. A.I.M.E., v. 179, p. 146-185.
Guyod, Hubert, 1944, Electric well logging (reprint of 16 articles in the Oil
Weekly from Aug. 7 to Dec. 4).
Priddy, R. R., 1955, Fresh water strata of Mississippi as revealed by electric
studies: Mississippi Geol. Survey Bull. 83.
Wyllie, M.R. J., 1949, A quantitative analysis of the electrochemical compo-nent of the S.P. curve: Trans. A.I.M.E., v. 186.


ILLINOIS£widofXtacofoI
CIRCULAR 215
ILLINOIS STATE GEOLOGICAL SURVEYURBANA
114