Advanced Ndt SoADVANCED NDT SOLUTIONS -Website.Doclutions -Website
Process Compensated Resonant Testing
Lessons Learned about a New, but Maturing NDT Method that Detects
Structural Degradation of Parts
Prepared By:
Lemna Hunter Vibrant Corporation
(505) 314 1511 &
Robert Nath Magnaflux Quasar
Magnaflux Vibrant Quality NDT paper final.doc Page 2 of 13
Table of Contents 1. Introduction ....................................................................................................... 3 2. How Process Compensated Resonance Testing (PCRT) Works...................... 3 3. Case Studies..................................................................................................... 7
A. Automotive Case 1 – Aluminum Suspension Links........................................ 7 B. Automotive Case 2 – Suspension Knuckles................................................... 9 C. Aerospace Case 1 – Single Crystal Blades.................................................. 10 D. Aerospace Case 2 – Fatigue Monitoring...................................................... 11
4. Summary......................................................................................................... 13 5. References...................................................................................................... 13
Table of Figures Figure 1 – Data provided by Kovaks1 and Emerson2 showing the link between mechanical property of yield strength and elastic property of resonant frequency..... 4 Figure 2 – Screenshot from PCRT software showing a single resonant frequency for good (green) and bad (red) parts: shows overlap due to acceptable part-to-part variation. .................................................................................................................... 4 Figure 3 – Graphical representation of resonant frequency data for a group of 200 parts containing both goods (green) and bads (red). Clearly, a single frequency cannot be used to properly sort these parts............................................................... 5 Figure 4 – Utilization of two frequencies for categorizing parts. Note that the difference in the two frequencies is greater for the goods (green, top three) than for the bads (reds, bottom three)..................................................................................... 6 Figure 5 – Graphical representation of a perfect sort obtained through the PCRT System....................................................................................................................... 6 Figure 6 – Plot showing very high load fatigue failure cycles for an aluminum automobile knuckle and the corresponding PCRT score that the PCRT System uses to determine its accept/reject criteria. Note that PCRT score is highly correlated with fatigue failure cycles. ................................................................................................. 7 Figure 7 - Comparison of x-ray false accepts and false rejects, the means and standard deviations are also shown........................................................................... 8 Figure 8 - Comparison of ultrasound false accepts and false rejects, the means and standard deviations are also shown........................................................................... 8 Figure 9 - Conventional NDT fail indication versus the actual break location during structural testing, no correlation. ................................................................................ 9 Figure 10 – PCRT sort solution of single crystal blades with part categorization confirmed by X-ray analysis. .................................................................................... 10 Figure 11 – PCRT sort solution showing the results of the visually rejected blades (black diamonds)...................................................................................................... 11 Figure 12 – Resonant frequencies (from ~108 kHz) for an aluminum coupon undergoing fatigue. .................................................................................................. 11 Figure 13 – Plot showing the number of load cycles compared to the percent change in both frequency and elongation. Note that frequency change and elongation are not proportional. ....................................................................................................... 12 Figure 14 – Shift in frequency for the 12.7 kHz mode and crack length versus the number of test cycles. .............................................................................................. 12
Magnaflux Vibrant Quality NDT paper final.doc Page 3 of 13
1. Introduction Process Compensated Resonant Testing (PCRT) was developed to fill a vital need in the automotive and aerospace industries. Traditional methods of nondestructive testing (NDT) and nondestructive inspection (NDI) highlight indications that could represent structural deficiency in a component. These indications may or may not signify a problem with structural integrity of a hard part (metal or ceramic in general). This may often be helpful in monitoring process control parameters, but it does not necessarily let a user know if a part is more likely to prematurely fail in service or assembly. PCRT has the potential to fill this key void left by traditional NDT methods. PCRT detects structurally defective parts and it provides process feedback with respect to parts’ structural integrity. Additionally, it does so in a manner that accounts for normal, acceptable part-to-part variation. This paper will first present a description of PCRT and the fundamentals of how it works. Then specific case studies, from both the automotive and aerospace industries, will be presented along with data demonstrating comparisons between traditional NDT and PCRT using real parts. The application of PCRT to structural process control will be shown along with the effectiveness of PCRT in detecting structurally unacceptable parts and the ability of PCRT to significantly reduce waste by minimizing false rejects as compared to traditional NDT.
2. How Process Compensated Resonance Testing (PCRT) Works Process Compensated Resonant Testing sorts parts by measuring resonant frequencies, which are explicitly determined by the parts’ elastic properties (stiffness), geometry, and mass. The presence of a structural defect changes the stiffness of the part and therefore changes the part’s resonant frequencies. For a fixed geometry and mass, the change in frequency is proportional to the change in stiffness, and also to the severity of the defect. This means that a part’s resonant frequencies can be predictor of its structural integrity. PCRT uses patented pattern recognition algorithms to develop sorting modules that evaluate the frequency responses of tested components. With the sorting modules developed the software provides for rapid, accurate, and operator independent pass fail testing. Below are highlights of the PCRT algorithm capabilities:
Contains built-in pattern recognition which performs data analysis comparing
each test part’s frequency pattern with those generated from the sample part database.
Optimizes the number and choice of resonances necessary for part evaluation.
Compensates for normal part variations to accept these while rejecting parts with unacceptable variations.

Magnaflux Vibrant Quality NDT paper final.doc Page 4 of 13
Figure 1 shows data from Kovaks1 and Emerson2 that links the elastic properties measured by resonant frequency with the mechanical property of yield strength for ferrous castings with variable nodularity.
Figure 1 – Data provided by Kovaks1 and Emerson2 showing the link between
mechanical property of yield strength and elastic property of resonant frequency. There is a practical obstacle to using only a single shift in resonant frequency for NDT. This is due to the fact that acceptable process variations also affect the resonant frequencies, often to the extent that they mask the effect of even a very severe defect. This masking has caused previous attempts to use resonant testing to be ineffective for all except the severest defects. The solution is to compensate for the acceptable process variations. PCRT measures several resonances (generally 3 to 7) for each part and uses a pattern recognition algorithm to compensate for the acceptable process variations. Figure 2, a screenshot from the PCRT software, shows a single resonant frequency’s variation for both good (green) and bad (red) parts, as classified by the manufacturer.
Figure 2 – Screenshot from PCRT software showing a single resonant frequency for
good (green) and bad (red) parts: shows overlap due to acceptable part-to-part variation.
Magnaflux Vibrant Quality NDT paper final.doc Page 5 of 13
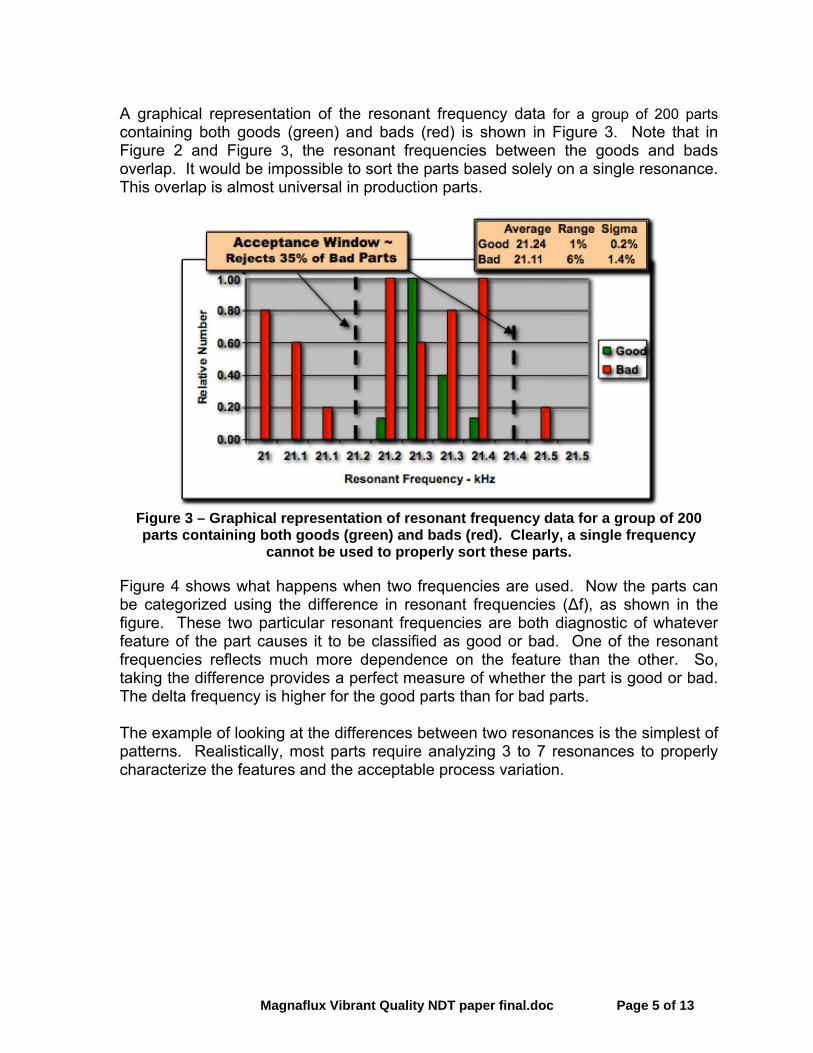
A graphical representation of the resonant frequency data for a group of 200 parts containing both goods (green) and bads (red) is shown in Figure 3. Note that in Figure 2 and Figure 3, the resonant frequencies between the goods and bads overlap. It would be impossible to sort the parts based solely on a single resonance. This overlap is almost universal in production parts.
Figure 3 – Graphical representation of resonant frequency data for a group of 200 parts containing both goods (green) and bads (red). Clearly, a single frequency
cannot be used to properly sort these parts.
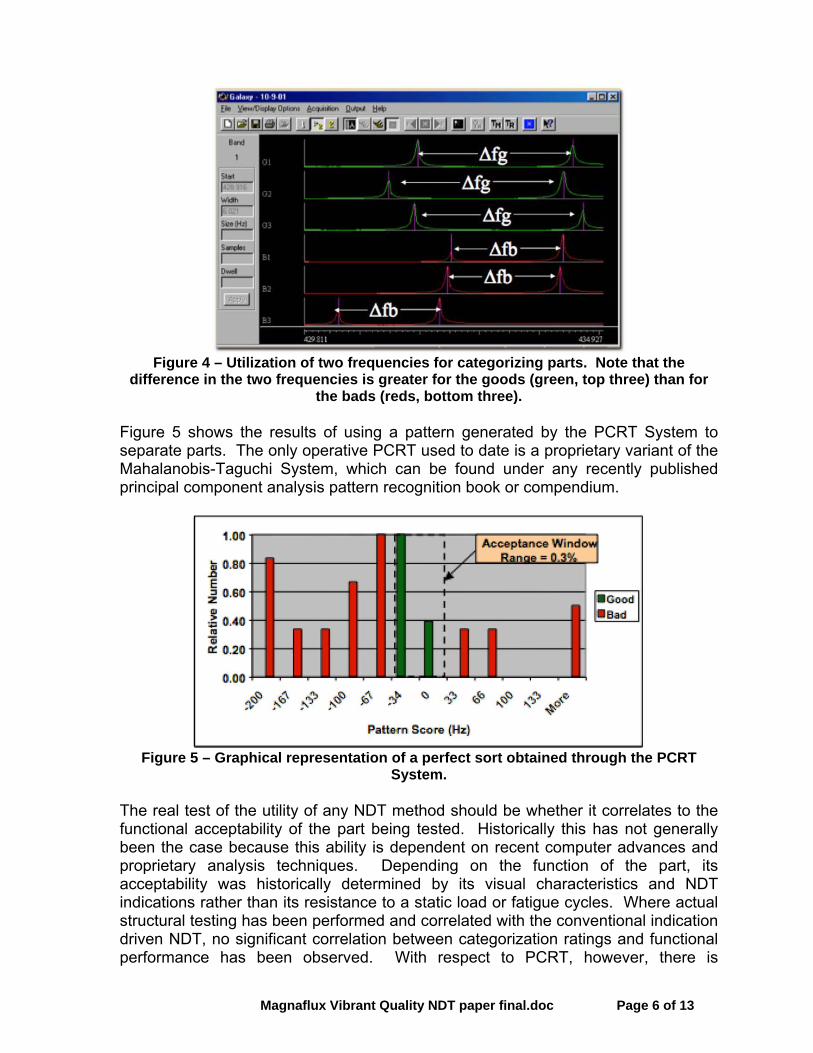
Figure 4 shows what happens when two frequencies are used. Now the parts can be categorized using the difference in resonant frequencies (∆f), as shown in the figure. These two particular resonant frequencies are both diagnostic of whatever feature of the part causes it to be classified as good or bad. One of the resonant frequencies reflects much more dependence on the feature than the other. So, taking the difference provides a perfect measure of whether the part is good or bad. The delta frequency is higher for the good parts than for bad parts. The example of looking at the differences between two resonances is the simplest of patterns. Realistically, most parts require analyzing 3 to 7 resonances to properly characterize the features and the acceptable process variation.
Magnaflux Vibrant Quality NDT paper final.doc Page 6 of 13
Figure 4 – Utilization of two frequencies for categorizing parts. Note that the
difference in the two frequencies is greater for the goods (green, top three) than for the bads (reds, bottom three).
Figure 5 shows the results of using a pattern generated by the PCRT System to separate parts. The only operative PCRT used to date is a proprietary variant of the Mahalanobis-Taguchi System, which can be found under any recently published principal component analysis pattern recognition book or compendium.
Figure 5 – Graphical representation of a perfect sort obtained through the PCRT
System.
The real test of the utility of any NDT method should be whether it correlates to the functional acceptability of the part being tested. Historically this has not generally been the case because this ability is dependent on recent computer advances and proprietary analysis techniques. Depending on the function of the part, its acceptability was historically determined by its visual characteristics and NDT indications rather than its resistance to a static load or fatigue cycles. Where actual structural testing has been performed and correlated with the conventional indication driven NDT, no significant correlation between categorization ratings and functional performance has been observed. With respect to PCRT, however, there is
Magnaflux Vibrant Quality NDT paper final.doc Page 7 of 13
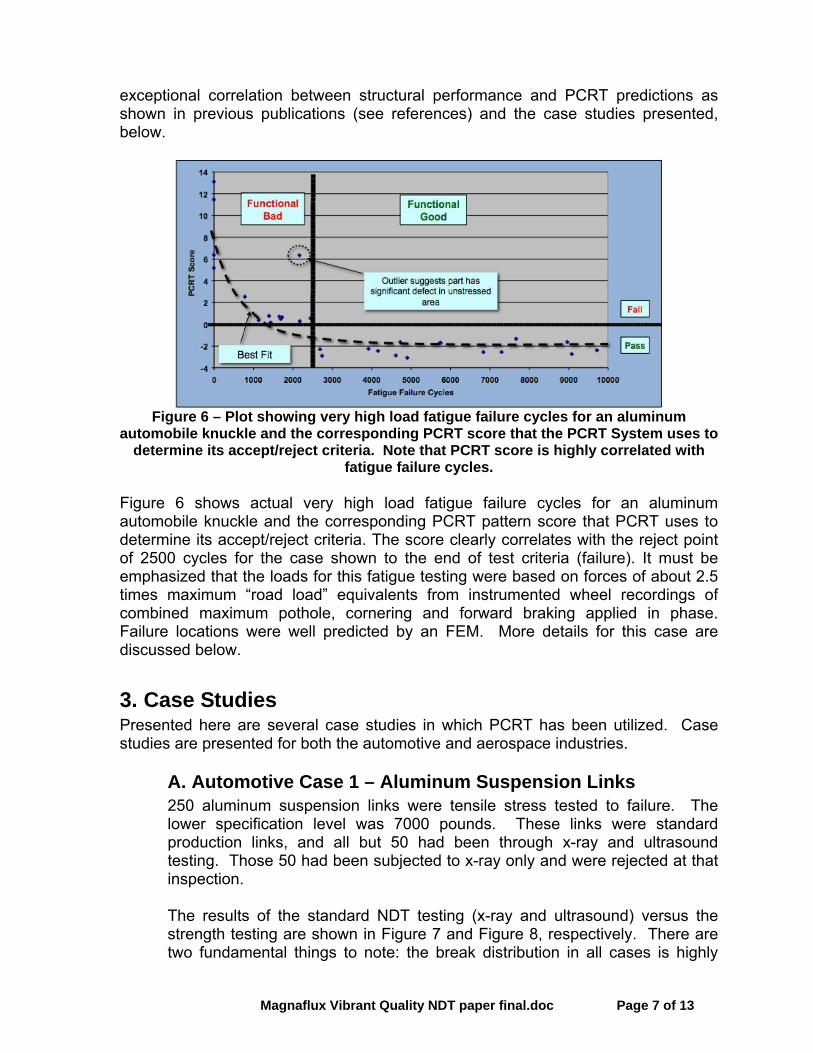
exceptional correlation between structural performance and PCRT predictions as shown in previous publications (see references) and the case studies presented, below.
Figure 6 – Plot showing very high load fatigue failure cycles for an aluminum
automobile knuckle and the corresponding PCRT score that the PCRT System uses to determine its accept/reject criteria. Note that PCRT score is highly correlated with
fatigue failure cycles. Figure 6 shows actual very high load fatigue failure cycles for an aluminum automobile knuckle and the corresponding PCRT pattern score that PCRT uses to determine its accept/reject criteria. The score clearly correlates with the reject point of 2500 cycles for the case shown to the end of test criteria (failure). It must be emphasized that the loads for this fatigue testing were based on forces of about 2.5 times maximum “road load” equivalents from instrumented wheel recordings of combined maximum pothole, cornering and forward braking applied in phase. Failure locations were well predicted by an FEM. More details for this case are discussed below. 3. Case Studies Presented here are several case studies in which PCRT has been utilized. Case studies are presented for both the automotive and aerospace industries.
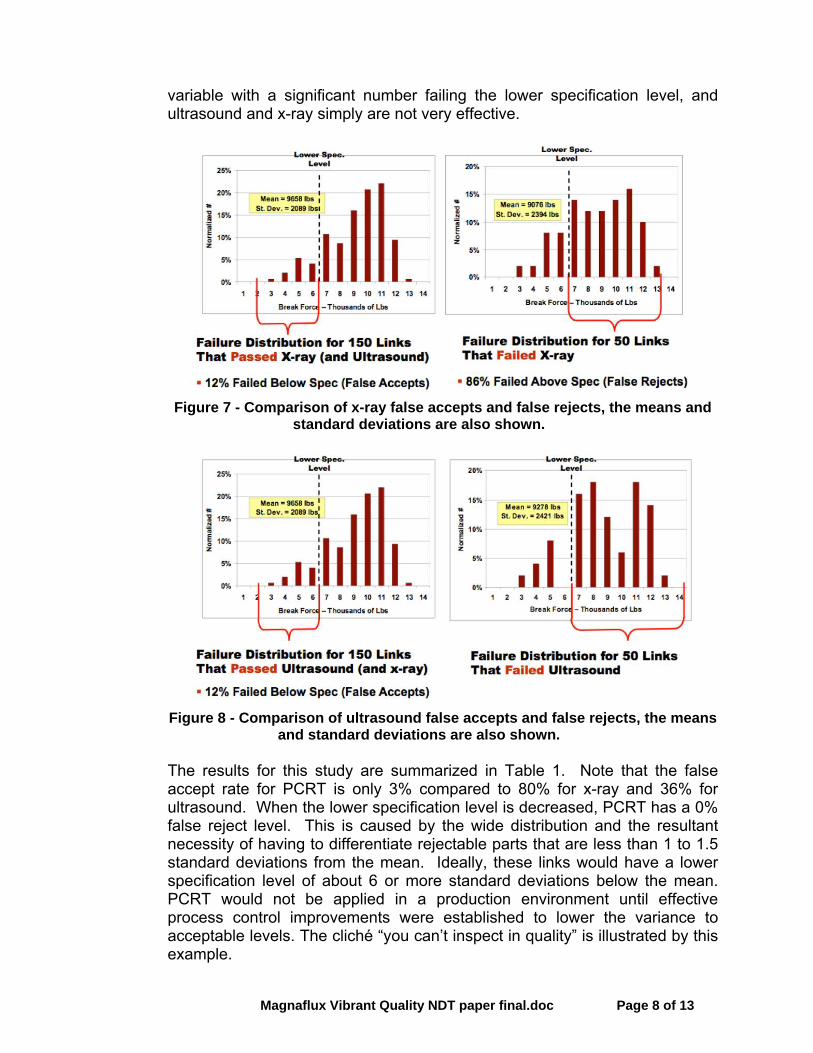
A. Automotive Case 1 – Aluminum Suspension Links 250 aluminum suspension links were tensile stress tested to failure. The lower specification level was 7000 pounds. These links were standard production links, and all but 50 had been through x-ray and ultrasound testing. Those 50 had been subjected to x-ray only and were rejected at that inspection. The results of the standard NDT testing (x-ray and ultrasound) versus the strength testing are shown in Figure 7 and Figure 8, respectively. There are two fundamental things to note: the break distribution in all cases is highly
Magnaflux Vibrant Quality NDT paper final.doc Page 8 of 13
variable with a significant number failing the lower specification level, and ultrasound and x-ray simply are not very effective.
Figure 7 - Comparison of x-ray false accepts and false rejects, the means and
standard deviations are also shown.
Figure 8 - Comparison of ultrasound false accepts and false rejects, the means
and standard deviations are also shown. The results for this study are summarized in Table 1. Note that the false accept rate for PCRT is only 3% compared to 80% for x-ray and 36% for ultrasound. When the lower specification level is decreased, PCRT has a 0% false reject level. This is caused by the wide distribution and the resultant necessity of having to differentiate rejectable parts that are less than 1 to 1.5 standard deviations from the mean. Ideally, these links would have a lower specification level of about 6 or more standard deviations below the mean. PCRT would not be applied in a production environment until effective process control improvements were established to lower the variance to acceptable levels. The cliché “you can’t inspect in quality” is illustrated by this example.
Magnaflux Vibrant Quality NDT paper final.doc Page 9 of 13
Table 1 – Summary of results from the Aluminum Suspension Link case study. The false accept rate for PCRT is significantly better than x-ray or ultrasound.
PCRT X-Ray Ultrasound Reject Rate 29% (72 of 250) 20% (50 of 250) 25% (50 of 200)
False Accept Rate 3% (1 of 35) 80% (28 of 35) 36% (10 of 28)
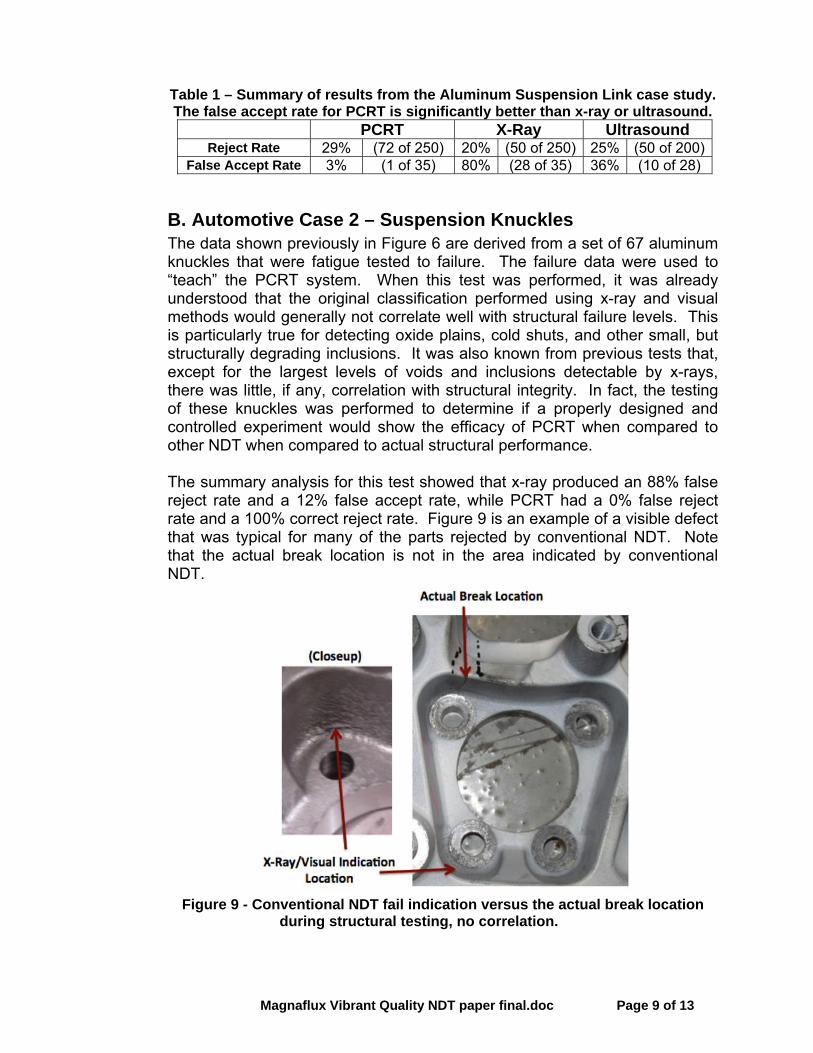
B. Automotive Case 2 – Suspension Knuckles The data shown previously in Figure 6 are derived from a set of 67 aluminum knuckles that were fatigue tested to failure. The failure data were used to “teach” the PCRT system. When this test was performed, it was already understood that the original classification performed using x-ray and visual methods would generally not correlate well with structural failure levels. This is particularly true for detecting oxide plains, cold shuts, and other small, but structurally degrading inclusions. It was also known from previous tests that, except for the largest levels of voids and inclusions detectable by x-rays, there was little, if any, correlation with structural integrity. In fact, the testing of these knuckles was performed to determine if a properly designed and controlled experiment would show the efficacy of PCRT when compared to other NDT when compared to actual structural performance. The summary analysis for this test showed that x-ray produced an 88% false reject rate and a 12% false accept rate, while PCRT had a 0% false reject rate and a 100% correct reject rate. Figure 9 is an example of a visible defect that was typical for many of the parts rejected by conventional NDT. Note that the actual break location is not in the area indicated by conventional NDT.
Figure 9 - Conventional NDT fail indication versus the actual break location
during structural testing, no correlation.
Magnaflux Vibrant Quality NDT paper final.doc Page 10 of 13
This knuckle testing experiment was the first and only highly controlled test of a statistically significant number of samples in which conventional NDT indication locations were tracked along with actual failure locations. This test provided the controlled data to actually demonstrate the fact that indications were generally not associated with structural performance. The knuckles almost always broke at one of the flange corner high stress areas as determined by FEM analysis. This validated the correlation of the FEM prediction with failure from the road load forces imposed in the fatigue cycles Two criteria were used to define an unacceptable part. Either fatigue failure below 2500 cycles OR gross casting defects (such as cold laps and incomplete castings), even when the knuckle exceeded the fatigue bogey because the defects were located in a lightly stressed area. PCRT was able to separate out those parts that would fail at least one of these criteria with 100% accuracy, even though there were often no corresponding NDT indications. It has been hypothesized that PCRT was detecting the presence of significant oxide inclusions that provided initiation sites for fatigue cracks. The relative efficacy of PCRT compared to standard NDT at finding real structural problems was demonstrated.
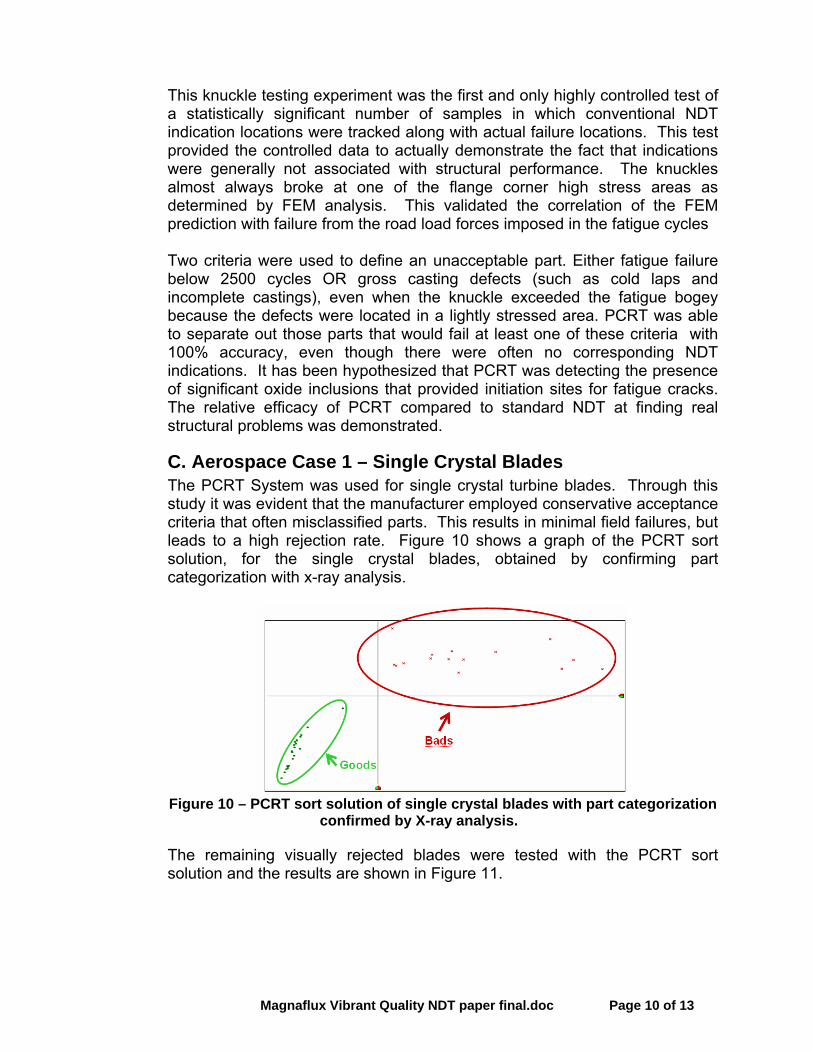
C. Aerospace Case 1 – Single Crystal Blades The PCRT System was used for single crystal turbine blades. Through this study it was evident that the manufacturer employed conservative acceptance criteria that often misclassified parts. This results in minimal field failures, but leads to a high rejection rate. Figure 10 shows a graph of the PCRT sort solution, for the single crystal blades, obtained by confirming part categorization with x-ray analysis.
Figure 10 – PCRT sort solution of single crystal blades with part categorization
confirmed by X-ray analysis.
The remaining visually rejected blades were tested with the PCRT sort solution and the results are shown in Figure 11.
Magnaflux Vibrant Quality NDT paper final.doc Page 11 of 13
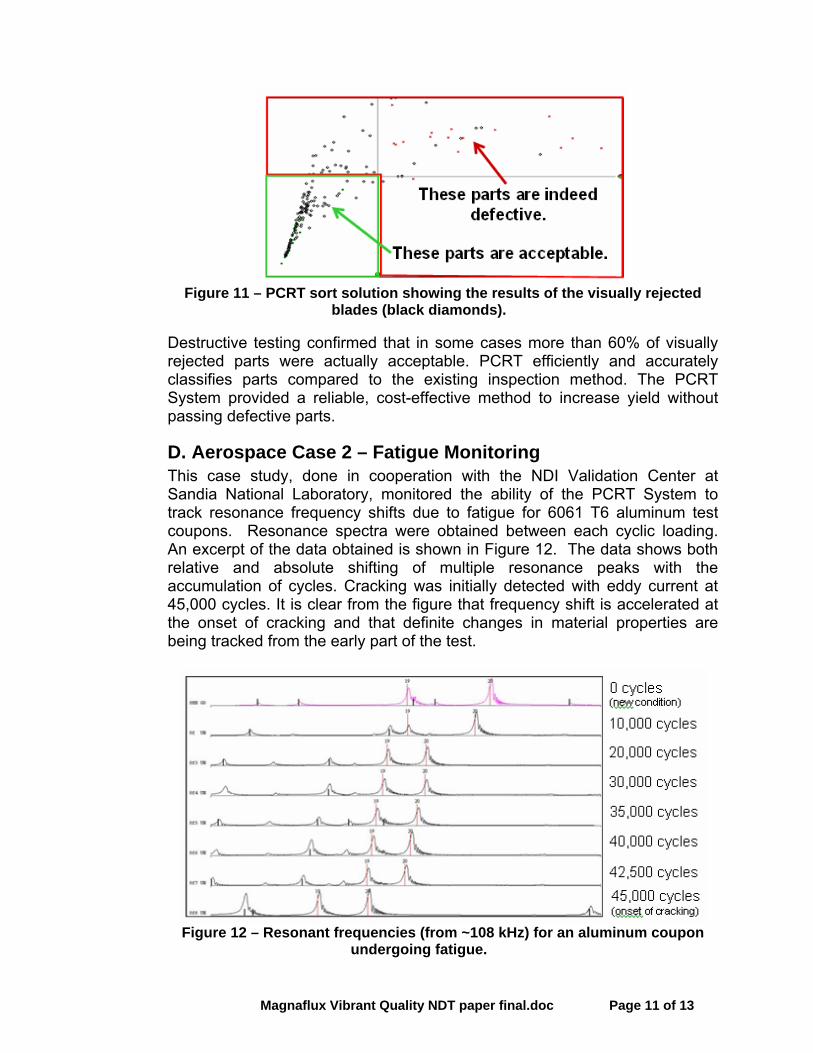
Figure 11 – PCRT sort solution showing the results of the visually rejected
blades (black diamonds).
Destructive testing confirmed that in some cases more than 60% of visually rejected parts were actually acceptable. PCRT efficiently and accurately classifies parts compared to the existing inspection method. The PCRT System provided a reliable, cost-effective method to increase yield without passing defective parts.
D. Aerospace Case 2 – Fatigue Monitoring This case study, done in cooperation with the NDI Validation Center at Sandia National Laboratory, monitored the ability of the PCRT System to track resonance frequency shifts due to fatigue for 6061 T6 aluminum test coupons. Resonance spectra were obtained between each cyclic loading. An excerpt of the data obtained is shown in Figure 12. The data shows both relative and absolute shifting of multiple resonance peaks with the accumulation of cycles. Cracking was initially detected with eddy current at 45,000 cycles. It is clear from the figure that frequency shift is accelerated at the onset of cracking and that definite changes in material properties are being tracked from the early part of the test.
Figure 12 – Resonant frequencies (from ~108 kHz) for an aluminum coupon
undergoing fatigue.
Magnaflux Vibrant Quality NDT paper final.doc Page 12 of 13
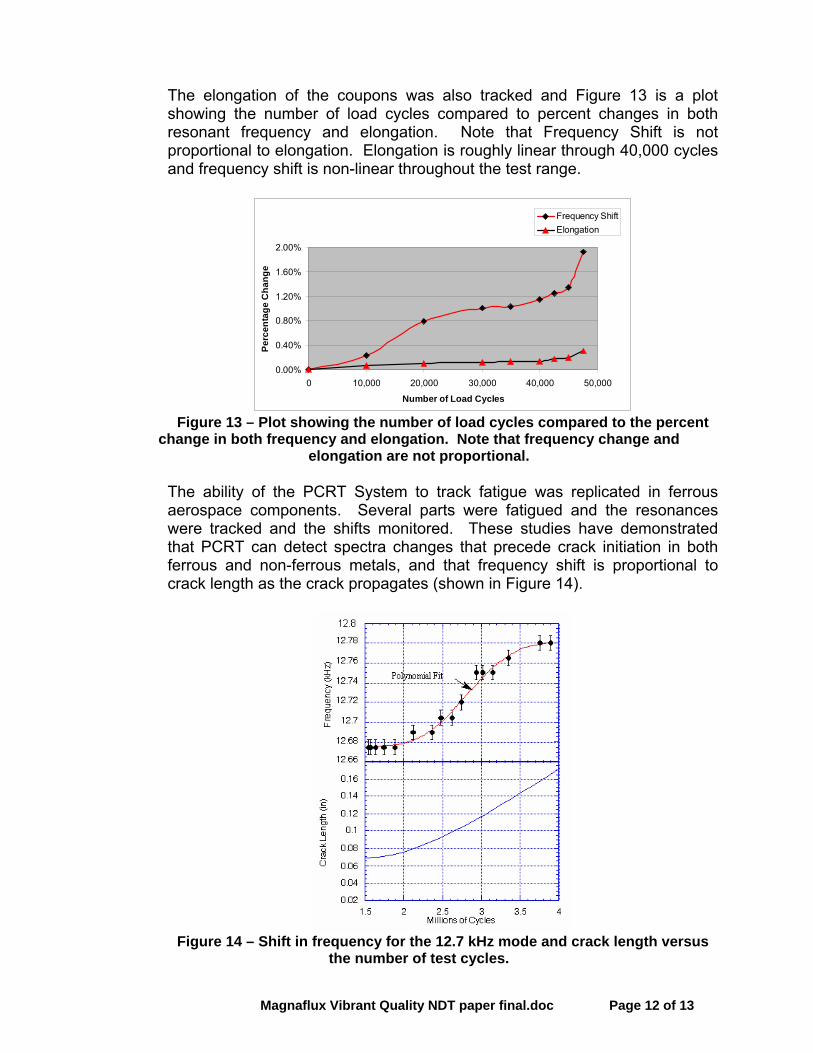
The elongation of the coupons was also tracked and Figure 13 is a plot showing the number of load cycles compared to percent changes in both resonant frequency and elongation. Note that Frequency Shift is not proportional to elongation. Elongation is roughly linear through 40,000 cycles and frequency shift is non-linear throughout the test range.
0.00%
0.40%
0.80%
1.20%
1.60%
2.00%
0 10,000 20,000 30,000 40,000 50,000
Number of Load Cycles
Perc
enta
ge C
hang
e
Frequency ShiftElongation
Figure 13 – Plot showing the number of load cycles compared to the percent
change in both frequency and elongation. Note that frequency change and elongation are not proportional.
The ability of the PCRT System to track fatigue was replicated in ferrous aerospace components. Several parts were fatigued and the resonances were tracked and the shifts monitored. These studies have demonstrated that PCRT can detect spectra changes that precede crack initiation in both ferrous and non-ferrous metals, and that frequency shift is proportional to crack length as the crack propagates (shown in Figure 14).
Figure 14 – Shift in frequency for the 12.7 kHz mode and crack length versus
the number of test cycles.
Magnaflux Vibrant Quality NDT paper final.doc Page 13 of 13
The fatigue monitoring and crack detection capabilities of PCRT form the basis for life monitoring and possibly life extension for critical aerospace components.
4. Summary Process Compensated Resonance Testing (PCRT) is a non-destructive testing approach that combines Resonance Spectroscopy with computer based analytical software to provide cost effective NDT that correlates strongly to the structural integrity of the tested component. When properly applied PCRT has markedly lower false accept and false reject rates in comparison to ultrasound, x-ray, and other NDT techniques. Magnetic particle, penetrant and eddy current are effective in finding indications of anomalies that are too small to cause measurable structural differences but can still provide an initiation site for a fatigue failure. PCRT is also capable of tracking resonance changes of components over time, which provides an excellent basis for life monitoring of critical components.
5. References 1. Kovacs, B.V., “Quality Control and Assurance by Sonic Resonance in Ductile
Iron Castings,” AFS Transactions, pages 499 – 508 (1977) 2. Emerson, P. J., “Assessing the nodularity of nodular iron by ultrasound and sonic
testing,” British Cast Iron Research Association, Pages 503 – 516 (September 1974)
3. Campbell, J., Castings, 2nd ed. Elsevier Butterworth Heinemann, Oxford, UK
(2003) 4. Hands, G., Nath, R. H., “Nondestructive Testing of Small Castings,” Materials
Evaluation, vol 62, No 2, pp 111–115 (2004) 5. Juran, J. M., Godfrey, A. B., Juran’s Quality Handbook, 5th ed. McGraw Hill, New
York, NY (1999) 6. Migliori, A., Sarrao, J. L., Resonant Ultrasound Spectroscopy, John Wiley &
Sons, New York, NY (1997) 7. Pirrello, F. G., Silkauskas, J. M., Schwarz, J. J., “Putting the Brakes on Leakers
with PCRT,” Modern Casting, vol 95, No 5, pp29–34 (2005) 8. Prucha, T. E., Nath, R. H., “New Approach in Nondestructive Evaluation
Techniques for Automotive Castings,” 2003-01-0436, 2003 SAE World Congress, SAE International (2003)