Quality Function Deployment ME – 2110 Creative Decisions ...€¦ · Quality Function Deployment...
27
Quality Function Deployment ME – 2110 Creative Decisions and Design Thomas R. Kurfess, Ph.D., P.E. HUSCO/Ramirez Distinguished Chair in Fluid Power and Motion Control Woodruff School of Mechanical Engineering Georgia Institute of Technology Atlanta, Georgia USA
Transcript of Quality Function Deployment ME – 2110 Creative Decisions ...€¦ · Quality Function Deployment...

Quality Function Deployment
ME – 2110Creative Decisions and Design
Thomas R. Kurfess, Ph.D., P.E.HUSCO/Ramirez Distinguished Chair in Fluid Power and Motion Control
Woodruff School of Mechanical EngineeringGeorgia Institute of Technology
Atlanta, Georgia USA

/ 27
Quality Function Deployment (QFD)
Questions to ask Where can I sell it? How can I sell it? Why will people buy it? Why is it important?
2

/ 27
QFD History
The article that started it all. Harvard Business Review Developed from a study in
the Kobe shipyards
3

/ 27
Quality Function Deployment (QFD)
QFD is not– a control strategy– an approach to begin optimization for quality engineering
QFD is a planning tool– for translating customer needs into appropriate product
development requirements– that identifies the significant item on which to focus time, product
improvement efforts and other resources
QFD enables– the identification of important issues and items– the identification of trade-offs
4

/ 27
QFD
Can be an aid to achieving our goals of– Quality– Cost– Timeliness
QFD is customer driven product development
5

/ 27
Change Comparison
Changes = Money Earlier Changes = Less Money Spent
“Good”Company
“Bad”Company
Time -14 Months90% Complete
ProductionStart
Des
ign
Cha
nges
in P
rogr
ess
6

/ 27
Basic Business Transaction
Customer– Wants– Needs– Desires
Supplier (products or services)– Features– Advantages– Benefits
7

/ 27
Marketing
Mismatch Supplier must pull the levers of marketing– adjust price– increase sales commissions– carry inventory– advertise– public relations
Supplier SupplierCustomer Customer
QFD
8

/ 27
Results of Being Customer Driven
Total Quality Excellence Greater customer satisfaction Increased market share
9

/ 27
The House of Quality
Example: Part of a car door Blank row
– you do not have a how or what
Blank column– customer does not care
10

/ 27
Crane – Problem Understanding Form
11
Eng
inee
ring
Req
uire
men
ts
Stre
nght
Tes
ting
Hoi
st C
apac
ity
Rot
atio
nal S
peed
Ene
rgy
Con
sum
ptio
n
Pay
load
Hoo
k O
pera
tions
Inte
rface
Eas
e of
Use
Set
-Up
Tim
e
Bre
ak-D
own
Tim
e
Slo
pe A
ngle
Sta
bilit
y
Pay
load
Sw
ing
Con
trol
Customer Requirements (Explicit and
Implicit)
Safety ● ○ ▽ ○ ○Low Cost ○Reliability ○ ○ ▽ ● ●
Energy Efficiency ▽ ▽ ●Attractive Appearance ○ ▽

/ 27
House of Quality Revealed
Relationship matrix– qualitative
Importance– to customer
Definition of What is Important– Example: Appearance
• not important for engine• not important for A-10
(Thunderbolt II / Warthog)
12

/ 27
Correlation Matrix
Correlation– Strong - 9– Medium - 3– Weak - 1– Blank - No - 0
Not always intuitive Example: Japanese truck
perceived better than US truck. Technically, this was not true, Why? The US truck– was quieter– had a slight delay– was sturdier / stiffer
13

/ 27
A Cup of Coffee
What– Hot– Taste– Smell– Stimulating– Aesthetics
• cup• brand name
– Color– Cost– Grounds– Not poisonous (assumed)
How– Serving temperature (Hot)– Taste jury (Taste)– Smell jury (Smell)– Measure caffeine level (Stimulating)– Jury (Aesthetics)– Color standard (Color)– Price (Cost)– Filter & weigh (Grounds)– Lethal Dose LD 50 (Not poisonous)
14

/ 27
Cup of Coffee House of Quality
15

/ 27
Cup of Coffee House of Quality (Filled)
Matrix Weights– Strong, = 9
– Medium, = 3
– Weak, = 1
The 181 from column 1 comes from:
The sum of the Absolute Importance row is:
The 0.27 in the first column of the Relative Importance row comes from:
8 9 6 3 9 9 10 1 181b gb g b gb g b gb g b gb g
181 132 54 99 18 108 90 682
181682
0 2654 0 27 . .
16

/ 27
Grounds Quality Chart
17

/ 27
Expectations are Important
Standards are– Set– Change
Examples– Sun visor mirrors– Cargo net
Benchmarking is important– Compare to your competition– What if you have no competition?
18

/ 27
Three Types of Quality/Features
Basic– Expected of assumed– Typical of “invisible” products– Functions of products
Performance– One dimensional– Most market research
Excitement– Pleasant surprises or
customer delights– Unexpected
19

/ 27
Analyzing and Diagnosing the Product Planning Matrix
Look for Blank rows Blank columns Conflicts in the customer vs. technical (engineering) survey. Communication opportunities Sales Points.
– Incorporate competitors features
Determining Planned Quality Resolve Negative Correlations Final Targets Correct What design requirements to be deployed to Phase II (Parts
Deployment)?
20

/ 27
Using the House of Quality
What (Market / Need) How (Manufacture) Relationships Conflicts
– Customer– Producer
Competition
21

/ 27
Back to the Car Door
What (Market / Need) How (Manufacture) Relationships Conflicts
– Customer– Producer
Competition
22
/ 27
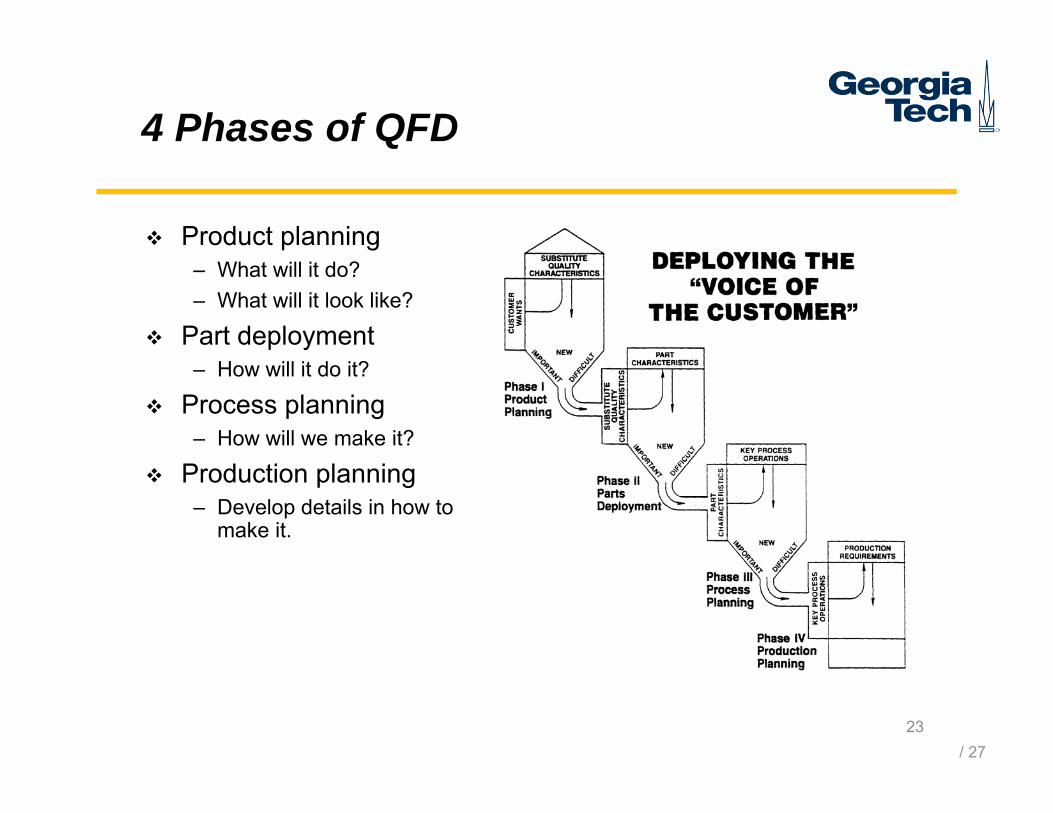
4 Phases of QFD
Product planning– What will it do?– What will it look like?
Part deployment– How will it do it?
Process planning– How will we make it?
Production planning– Develop details in how to
make it.
23

/ 27
4 Phases of QFD (Car Door Example)
Product planning– Close door easily– Close fit
Part deployment– Weather strip– Latch
Process planning (W. Strip)– Extrude
Production planning– Temperature– Pressure– Speed
24

/ 27
Weather Strip
Temperature Pressure Speed
www.infobarrel.com/Media/The_hanging_car_door_seal www.china-hongan.com/
25

/ 27
Steps in QFD
What How How Much Relationship Matrix Correlation Matrix Competitive Analysis Analyze Deploy
26

/ 27
Remember!!!!!
QFD– is a planning tool– is one of many planning tools
Charts– are the means– are not the ends
27


![ME 2110: Creative Decisions and Design Prof J.Rhett Mayor 1 Big Project Theme Autonomous Surgical Robotics Intuitive Surgical Co. [2 ] Intuitive Surgical.](https://static.fdocuments.net/doc/165x107/56649dd15503460f94ac6d4e/me-2110-creative-decisions-and-design-prof-jrhett-mayor-1-big-project-theme.jpg)