
Quality factors in public transport - תחבורה...
7
5– Examination of the perceived total quality of public transport includes the identification and classification of various quality factors, determination of passenger satisfaction with these quality factors and the evalua- tion of the relative significance of the quality factors. The two research projects in the Public Transport Re- search Programme have focused on developing meth- ods to evaluate perceived quality especially in urban bus traffic. A pilot survey was used to study the relative weighting of quality factors based on hierarchical clas- sification of the quality factors. The empirical element of the study further examined the combined effect on the travel experience of driver helpfulness and driving style on the one hand and bus cleanliness and tidiness on the other. The second project involved analysing data from the extensive customer satisfaction surveys conducted on a regular basis in the Helsinki Metro- politan Area (HMA). In these surveys, passengers are asked to rate an average of ten quality factors. The desire to elaborate the research methods in customer surveys is grounded in the changes proposed to the competitive tendering of bus traffic and its incentive systems. What matters to passengers The key issue in analysing the quality factors in pub- lic transport is to discover the vital elements of per- ceived quality and their relative weighting in particular. Quality factors in public transport The perceptions of passengers on public transport quality may differ quite significantly from the technical service level indicators employed by planners. An international literature survey was undertaken first in order to obtain a full picture of the elements of perceived total quality. Additionally, the Finnish and international experts in the European Committee for Standardization CEN were consulted for their views relating to the creation of the public transport quality standard EN 13816. Below are some of the conclusions and observa- tions made from international studies and the discus- sions held: – The perceived total quality of public transport is the result of the combined effect of objective (actual travel time, actual travel costs, accidents, if any, etc.) and subjective factors in individual travel experienc- es accumulated over a longer period of time – Satisfied passengers perceive also the quality of the public transport service they receive as good – Traditional measurable quality and passenger satis- faction partly differ from one another – Passengers may feel overall public transport quality has deteriorated even if monitoring of the operator’s quality criteria indicates it has remained unchanged or has even improved (Friman 2004) – Quality factors that are perceived to be in order and to which little attention is therefore paid in daily travel situations can easily be undervalued (Friman 2004) – Quality factors that are perceived as requiring much improvement are deemed to be important even if Kerkko Vanhanen, M.Sc. (Tech.), WSP Finland Ltd Jari Kurri, M.Sc. (Tech.), Helsinki University of Technology
Transcript of Quality factors in public transport - תחבורה...

5–�
Examination of the perceived total quality of public transport includes the identification and classification of various quality factors, determination of passenger satisfaction with these quality factors and the evalua-tion of the relative significance of the quality factors. The two research projects in the Public Transport Re-search Programme have focused on developing meth-ods to evaluate perceived quality especially in urban bus traffic. A pilot survey was used to study the relative weighting of quality factors based on hierarchical clas-sification of the quality factors. The empirical element of the study further examined the combined effect on the travel experience of driver helpfulness and driving style on the one hand and bus cleanliness and tidiness on the other. The second project involved analysing data from the extensive customer satisfaction surveys conducted on a regular basis in the Helsinki Metro-politan Area (HMA). In these surveys, passengers are asked to rate an average of ten quality factors. The desire to elaborate the research methods in customer surveys is grounded in the changes proposed to the competitive tendering of bus traffic and its incentive systems.
What matters to passengers
The key issue in analysing the quality factors in pub-lic transport is to discover the vital elements of per-ceived quality and their relative weighting in particular.
Quality factors in public transportThe perceptions of passengers on public transport quality may differ quite significantly from the technical service level indicators employed by planners.
An international literature survey was undertaken first in order to obtain a full picture of the elements of perceived total quality. Additionally, the Finnish and international experts in the European Committee for Standardization CEN were consulted for their views relating to the creation of the public transport quality standard EN 13816.
Below are some of the conclusions and observa-tions made from international studies and the discus-sions held:
– The perceived total quality of public transport is the result of the combined effect of objective (actual travel time, actual travel costs, accidents, if any, etc.) and subjective factors in individual travel experienc-es accumulated over a longer period of time
– Satisfied passengers perceive also the quality of the public transport service they receive as good
– Traditional measurable quality and passenger satis-faction partly differ from one another
– Passengers may feel overall public transport quality has deteriorated even if monitoring of the operator’s quality criteria indicates it has remained unchanged or has even improved (Friman 2004)
– Quality factors that are perceived to be in order and to which little attention is therefore paid in daily travel situations can easily be undervalued (Friman 2004)
– Quality factors that are perceived as requiring much improvement are deemed to be important even if
Kerkko Vanhanen, M.Sc. (Tech.), WSP Finland LtdJari Kurri, M.Sc. (Tech.), Helsinki University of Technology
5–2
objectively speaking, they are of minor importance in terms of overall public transport service
– Awareness of quality improvements in a given sector may increase expectations also with regard to other factors impacting on perceived total quality (Friman 2004)
– Negative feedback is given more readily on ele-ments with shortcomings
– Punctuality of service has a very high impact on passenger satisfaction and passengers’ perception of public transport quality (Friman 2004)
– Travel time is an excellent example of a subjectively perceived quality factor (Li 2003):
– if there are several stops en route, total travel time is perceived as shorter if the stops come at irregu-lar intervals
– the more interruptions and disruptions along the way, the longer the travel is perceived to take de-spite actual travel time being exactly the same as in uninterrupted circumstances
Somewhat similar observations were made when ex-amining customer satisfaction surveys which involved the mathematical modelling of ratings given by pas-sengers to the various quality factors. The key conclu-sion relating to survey methods is that the passenger perspective must be taken into account as much as possible when planning customer satisfaction sur-veys to be conducted on public transport vehicles and when interpreting the results of such surveys. For ex-ample, there is no point in asking a passenger about their satisfaction with the driver’s ability to give advice if the passenger has never asked the drivers on the rel-evant route anything. Likewise, the impact of external factors on satisfaction should never be ignored when analysing responses. The fewer other passengers, the better rating passengers give to enjoyability of travel.
Towards the core of quality
Customer satisfaction surveys and other surveys where respondents are asked to rate the various service fac-tors on a given scale can be used to assess passenger satisfaction. However, these surveys fail to determine the relative importance to passengers of the various factors impacting on total perceived quality. To this end, we decided to utilise the Analytic Hierarchy Proc-ess (AHP), which is most commonly used as a tool to support decision-making in small groups of experts. The experts in this context consisted of all public
transport passengers and the elected public officials in charge of decision-making.
The online survey was conducted in Helsinki (with responses from the entire HMA), Kuopio and Oulu. The survey targeted both ordinary public transport passengers and municipal elected officials who take decisions on public transport (municipal councils and public transport boards or technical committees as well as the Board of Helsinki Metropolitan Area Council YTV). A total of 1,552 responses were received.
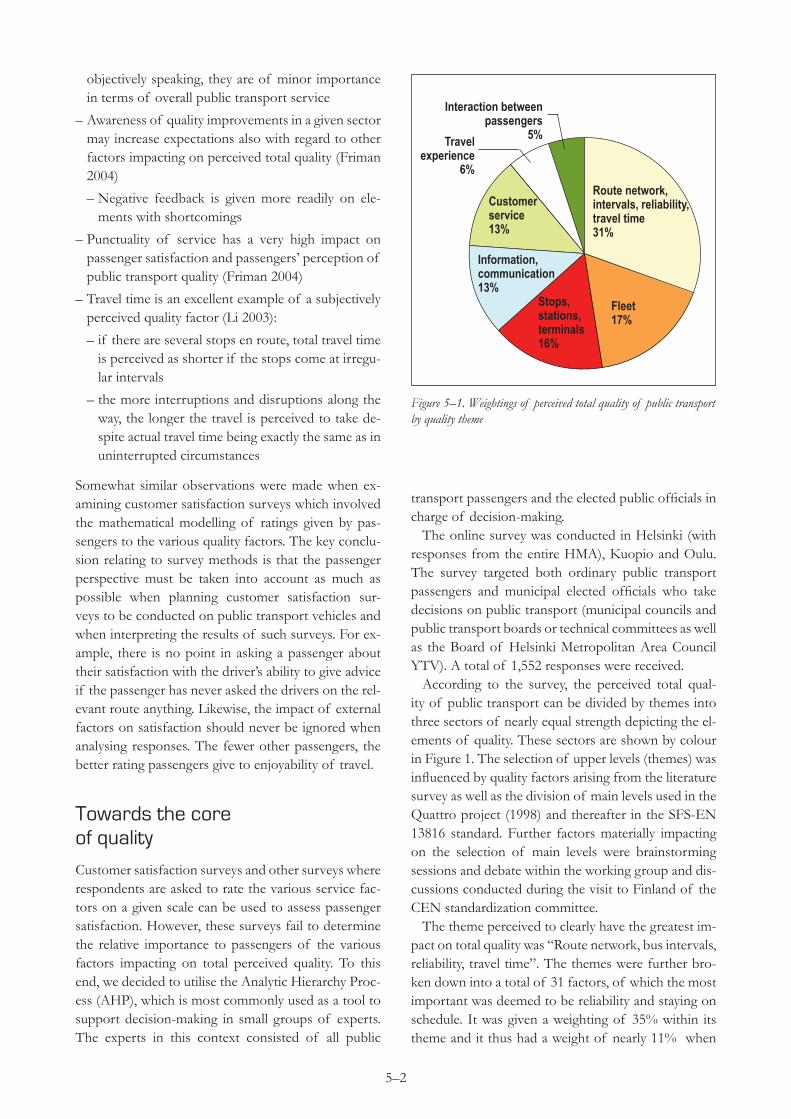
According to the survey, the perceived total qual-ity of public transport can be divided by themes into three sectors of nearly equal strength depicting the el-ements of quality. These sectors are shown by colour in Figure 1. The selection of upper levels (themes) was influenced by quality factors arising from the literature survey as well as the division of main levels used in the Quattro project (1998) and thereafter in the SFS-EN 13816 standard. Further factors materially impacting on the selection of main levels were brainstorming sessions and debate within the working group and dis-cussions conducted during the visit to Finland of the CEN standardization committee.
The theme perceived to clearly have the greatest im-pact on total quality was “Route network, bus intervals, reliability, travel time”. The themes were further bro-ken down into a total of 3� factors, of which the most important was deemed to be reliability and staying on schedule. It was given a weighting of 35% within its theme and it thus had a weight of nearly 11% when
Weightings of percieved total quality
Route network,intervals, reliability,travel time31%
Fleet17%
Stops,stations,terminals16%
Information,communication13%
Customerservice13%
Travelexperience
6%
Interaction betweenpassengers
5%
Figure 5–1. Weightings of perceived total quality of public transport by quality theme

5–3
rating total quality. This survey did not examine the impact of transfers on perceived total quality.
The survey results show that actual basic service factors are perceived as the most important factors impacting on total quality. The quality themes judged to be most important are naturally also highlighted in information materials distributed to passengers: timetables and the bus frequency and travel times ap-pearing therein – along with route maps – constitute fundamental public transport services. The reliability of operations thus described and thus also promised is a natural target for monitoring even if reliability as such is not emphasised in marketing. The theme of public transport reliability has also been exploited in marketing in Stockholm and Gothenburg, Sweden, for example (resegaranti, “travel guarantee”).
Physical and concrete elements easiest to evaluate
The quality of a physical and concrete theme or one of its elements – such as fleet, terminals and route network – would seem to be easier to evaluate than that of information or customer service, for instance, even if shortcomings in the latter might have been ex-perienced en route. This may well partly explain why customer service and information have been largely ignored when setting priorities.
Information and customer service are characterised by the passenger’s participation in their provision to a certain degree. Since public transport has a lengthy history of being a non-customer driven public service, passengers may even now not perceive themselves as part of public transport service provision. Informa-tion, let alone customer service, is thus not perceived as a core element of quality. This interpretation gains further ground from the fact that passengers’ own actions en route are even less deemed to contribute to quality. The survey results indicate that the factors most intensely disconnected from the perceived basic core quality of public transport are personal mood (al-though responsive to the environment) and interaction between passengers. This of course is not meant to suggest that social interaction en route is of no signifi-cance in terms of travel enjoyment. The observation only shows that social interaction is not perceived as an element of the total quality of public transport. In customer satisfaction surveys as well, other passengers are mainly considered to be distractions.
Few differences between groups of respondents
The weighted overall view of perceived total quality formed by the various groups of respondents is highly congruent regardless of respondent background (age, gender, place of residence, etc.). Classification of the themes and the manner in which the survey was ex-ecuted may play a role in this respect. On the other hand, the result shows that all public transport pas-sengers value most the availability and reliability of certain basic characteristics of the service – value add-ing quality factors come in second. For example, the responses of non-car owning women who actively use public transport and car-owning men who only use public transport occasionally were remarkably similar. Certain differences in weighting were of course also revealed:– active users put greater value on route network, fre-
quency and travel time than car-owning occasional users
– the public transport fleet matters more to car-own-ing men than to non-car owning women
The scale of the said differences is only in the region of a couple of percentage points, however. Neither was there great variation between cities. This survey would seem to suggest that commitment to public transport cannot serve as a background variable dif-ferentiating the prioritisation of quality criteria. On the other hand, the explanation may also be found in the survey method employed dictating results to such a degree that possible differences in valuation are not re-vealed. According to the results of the HMA customer satisfaction surveys, statistically significant differences in satisfaction can be observed between frequent and infrequent travellers.
In search of sound economical quality improvements
The improvement of all elements of quality is not equally cost-effective. The potential to alter the various subsets of quality factors or individual quality factors may also vary substantially by city and district.
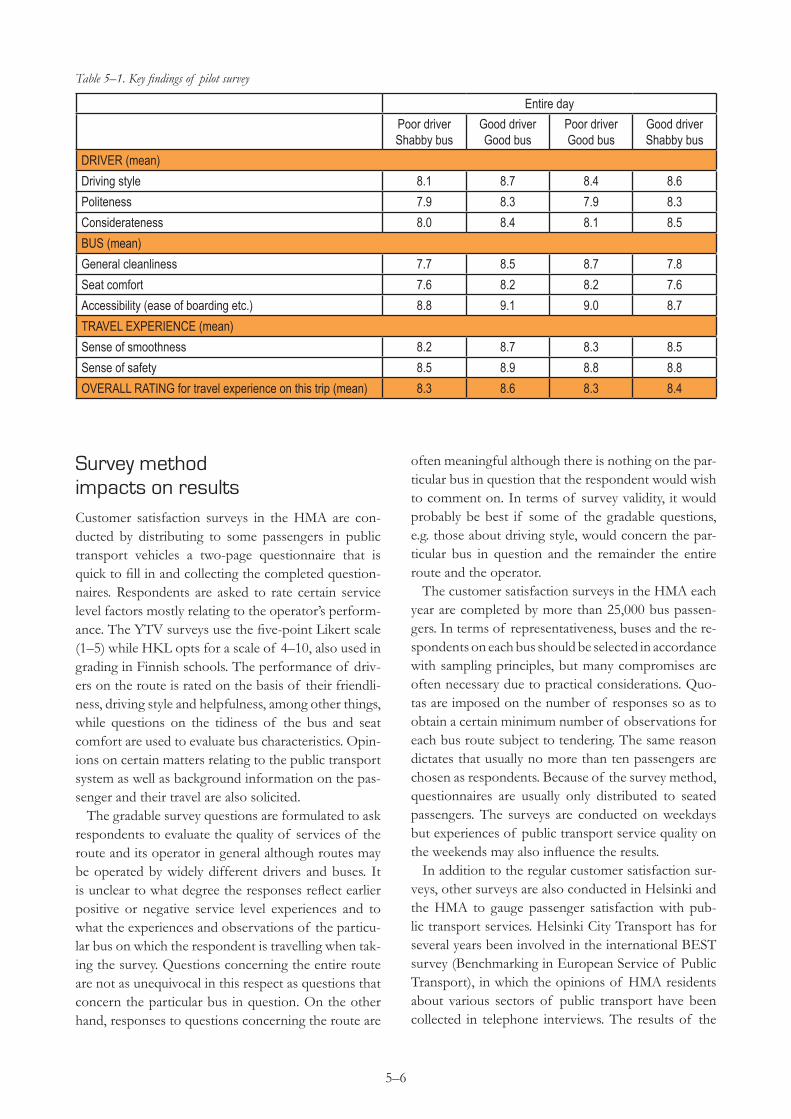
The AHP survey showed driving style was clearly the most important element under the service theme impacting on perceived total quality while bus fleet was deemed slightly more important than customer service in terms of total quality.
The pilot survey examined in greater detail how ob-vious quality differences in the aforementioned factors impacted on passenger satisfaction. The four travel

5–4
situations compared were “good and helpful driver – good and smart new bus”, “good and helpful driver – shabby and dirty older bus”, “careless and indiffer-ent driver – good and smart new bus”, and “careless and indifferent driver – shabby and dirty older bus”.
The drivers were no stereotypical extremes either in driving style or conduct. The good driver worked the shift with understated politeness and steadiness. The “poor driver” in this pilot survey had less experience and was not inclined to be helpful, yet neither his driv-ing style nor conduct was pointedly below par. Safety was never compromised. The poor driver’s driving style could best be characterised as jerky and he did not greet boarding passengers.
One of the buses was only recently deployed and very clean. The role of shabby bus was played by a rat-tling eight-year veteran of the fleet, which had rather
damp seats on one day of the survey due to the bus having been parked outside in heavy rain.
All four combinations of bus and driver were oper-ated in both morning and afternoon rush hour traffic in consecutive shifts (two combinations per day).
The differences between the mean values of the ratings given were quite small. This might well be at-tributable to the notion that notion that on a scale of 4–10, an 8 is a “safe” rating. – average for some, for others the highest possible. With a narrower scale the differences in ratings might be more visible. Ratings typically tend to cluster in customer satisfaction sur-veys.
Although the good driver was rated better on driving style than the poor driver regardless of which bus was in use, the ratings for sense of safety were quite close to each other. In the results of this pilot survey, sense
Figure 5–2. Weightings for each element of total quality within the quality theme “Customer service”; the driver’s driving style matters very much.
Figure 5–3. On left, “good bus”, deployed in 2006, at right, “shabby bus”, deployed in 1998
Politeness of driver/other personnel
Expertise of driver/other personnel
Considerateness of driver/other personnel
Keeping of order
Driving style
0 10 20 30%
Weightings of quality factors within customer service
“Shabby bus”“Good bus”

5–5
of safety did not seem to have a direct correlation to driving style while the sense of smooth travel was in clear correlation to driving style. A smooth ride is also perceived as swift travel, as determined in the literature survey.
The spread between the various combinations was fairly small in the overall ratings of the travel experi-ence. However, it must be observed that a good driver even on a shabby bus can be given a better rating than a weaker driver operating a virtually new vehicle. The good driver was consistently rated better on those fac-tors he could personally impact on.
The emissions points to be granted in the competi-tive tendering of HMA bus traffic will accelerate the rate of fleet renewal. A negative result of this develop-ment is the increase in the amount of capital tied up in the fleet, resulting in correspondingly higher quotes for providing transport service. As the results of the pilot survey show, passenger satisfaction equal to that achievable with a new vehicle can also be achieved with an older vehicle, provided that the driver’s work is outstanding. An ageing bus need not be in poor condi-tion even though in this particular instance it was, at the specific request of the researcher. The money thus saved could e.g. be allocated to increasing the supply of basic services, which the survey suggests is clearly the most important theme in perceived total quality.
Customer satisfaction surveys in the Helsinki Metropolitan Area
Public transport customer satisfaction surveys have been conducted on a regular basis in the HMA since the mid-1990s. One of the aims of these surveys is to systematically compile quantitative data on passenger satisfaction with the quality of public transport serv-ices. The need for customer satisfaction surveys has to do with the competitive tendering of bus traffic initi-ated in 1994. The competitive tendering system is be-ing developed to encourage operators to improve the quality of their services. Means to enhance the quality of customer satisfaction surveys have been examined in the same context.
In the competitive tendering system in the HMA, the client organisation plans the routes and timetables and collects fare revenue. Transport operators sub-mit their tenders indicating the prices and fleets with which they are prepared to operate the routes subject to tender. Points are granted to the tenders on the basis of operating costs tendered and certain quality factors mainly involving fleet characteristics. After the tendering stage, chosen operators are encouraged to
provide good service by payment of small bonuses on the basis of customer satisfaction survey results, for example.
There are also other reasons besides good or infe-rior operator service behind the variance in passenger satisfaction between routes. The bonus determination criteria have been modified slightly as experiences have been accumulated to ensure equal treatment of operators. Small operators have nonetheless usually fared better than larger ones regardless of method of assessment.
Competitive tendering procedures and incentive sys-tems will be further built on to take into account al-ready at the selection stage each operator’s track record in the customer satisfaction surveys of the past two years. It is therefore increasingly important that the questions in the surveys measure specifically the ele-ments intended. One of the factors on which bus pas-senger satisfaction hinges is the number of other pas-sengers on the bus. Research on enhancing customer satisfaction sought to determine through mathemati-cal modelling the impact that the various factors have on satisfaction. According to the models, the number of other passengers was the most significant external factor impacting on quality ratings.
For historical reasons, the planning and commission-ing of public transport in the HMA is divided between two organisations. Helsinki City Transport HKL is in charge of planning public transport in Helsinki and tenders internal city bus routes. HKL also operates trams and the metro, as only bus traffic is subject to tendering. The Helsinki Metropolitan Area Council YTV is in charge of planning and tendering regional traffic that crosses municipal boundaries and internal traffic in cities other than Helsinki. Local trains are op-erated under a separate agreement with Finnish Rail-ways VR, which has exclusive right to operate passen-ger rail traffic in Finland.
Both YTV and HKL conduct or commission cus-tomer satisfaction surveys but their methods differ quite substantially in some respects. YTV surveys are conducted biannually during a few months in spring and autumn while HKL surveys cover nearly the entire year. On the other hand, the samples are smaller in HKL surveys, which are also not conducted later than 6pm. The greatest differences, however, arise from the questions used to determine passenger satisfaction. The availability of different kinds of survey data has only been beneficial in terms of survey development. Our analyses and proposals for improvement are based on data collected between early 2001 and spring 2006.
5–�
Survey method impacts on resultsCustomer satisfaction surveys in the HMA are con-ducted by distributing to some passengers in public transport vehicles a two-page questionnaire that is quick to fill in and collecting the completed question-naires. Respondents are asked to rate certain service level factors mostly relating to the operator’s perform-ance. The YTV surveys use the five-point Likert scale (1–5) while HKL opts for a scale of 4–10, also used in grading in Finnish schools. The performance of driv-ers on the route is rated on the basis of their friendli-ness, driving style and helpfulness, among other things, while questions on the tidiness of the bus and seat comfort are used to evaluate bus characteristics. Opin-ions on certain matters relating to the public transport system as well as background information on the pas-senger and their travel are also solicited.
The gradable survey questions are formulated to ask respondents to evaluate the quality of services of the route and its operator in general although routes may be operated by widely different drivers and buses. It is unclear to what degree the responses reflect earlier positive or negative service level experiences and to what the experiences and observations of the particu-lar bus on which the respondent is travelling when tak-ing the survey. Questions concerning the entire route are not as unequivocal in this respect as questions that concern the particular bus in question. On the other hand, responses to questions concerning the route are
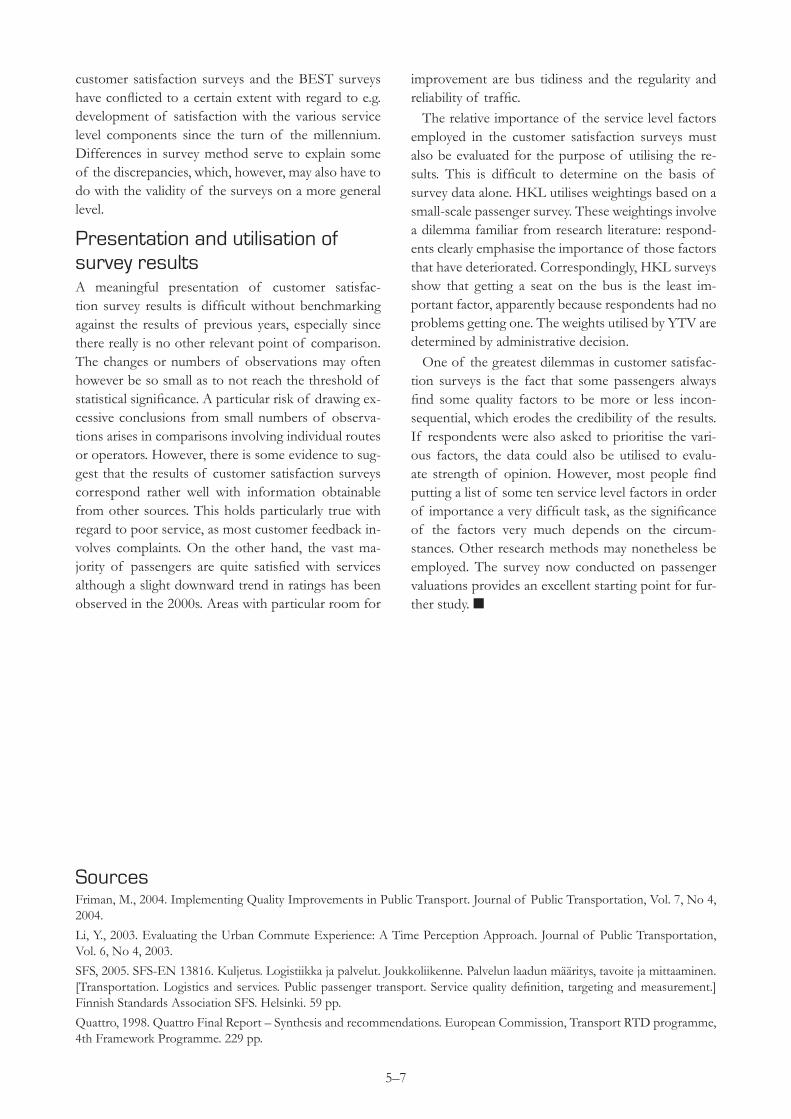
Table 5–1. Key findings of pilot survey
often meaningful although there is nothing on the par-ticular bus in question that the respondent would wish to comment on. In terms of survey validity, it would probably be best if some of the gradable questions, e.g. those about driving style, would concern the par-ticular bus in question and the remainder the entire route and the operator.
The customer satisfaction surveys in the HMA each year are completed by more than 25,000 bus passen-gers. In terms of representativeness, buses and the re-spondents on each bus should be selected in accordance with sampling principles, but many compromises are often necessary due to practical considerations. Quo-tas are imposed on the number of responses so as to obtain a certain minimum number of observations for each bus route subject to tendering. The same reason dictates that usually no more than ten passengers are chosen as respondents. Because of the survey method, questionnaires are usually only distributed to seated passengers. The surveys are conducted on weekdays but experiences of public transport service quality on the weekends may also influence the results.
In addition to the regular customer satisfaction sur-veys, other surveys are also conducted in Helsinki and the HMA to gauge passenger satisfaction with pub-lic transport services. Helsinki City Transport has for several years been involved in the international BEST survey (Benchmarking in European Service of Public Transport), in which the opinions of HMA residents about various sectors of public transport have been collected in telephone interviews. The results of the
Entire day
Poor driver Shabby bus
Good driver Good bus
Poor driver Good bus
Good driver Shabby bus
DRIVER (mean)
Driving style 8.1 8.7 8.4 8.6
Politeness 7.9 8.3 7.9 8.3
Considerateness 8.0 8.4 8.1 8.5
BUS (mean)
General cleanliness 7.7 8.5 8.7 7.8
Seat comfort 7.6 8.2 8.2 7.6
Accessibility (ease of boarding etc.) 8.8 9.1 9.0 8.7
TRAVEL EXPERIENCE (mean)
Sense of smoothness 8.2 8.7 8.3 8.5
Sense of safety 8.5 8.9 8.8 8.8
OVERALL RATING for travel experience on this trip (mean) 8.3 8.6 8.3 8.4
5–�
customer satisfaction surveys and the BEST surveys have conflicted to a certain extent with regard to e.g. development of satisfaction with the various service level components since the turn of the millennium. Differences in survey method serve to explain some of the discrepancies, which, however, may also have to do with the validity of the surveys on a more general level.
Presentation and utilisation of survey resultsA meaningful presentation of customer satisfac-tion survey results is difficult without benchmarking against the results of previous years, especially since there really is no other relevant point of comparison. The changes or numbers of observations may often however be so small as to not reach the threshold of statistical significance. A particular risk of drawing ex-cessive conclusions from small numbers of observa-tions arises in comparisons involving individual routes or operators. However, there is some evidence to sug-gest that the results of customer satisfaction surveys correspond rather well with information obtainable from other sources. This holds particularly true with regard to poor service, as most customer feedback in-volves complaints. On the other hand, the vast ma-jority of passengers are quite satisfied with services although a slight downward trend in ratings has been observed in the 2000s. Areas with particular room for
improvement are bus tidiness and the regularity and reliability of traffic.
The relative importance of the service level factors employed in the customer satisfaction surveys must also be evaluated for the purpose of utilising the re-sults. This is difficult to determine on the basis of survey data alone. HKL utilises weightings based on a small-scale passenger survey. These weightings involve a dilemma familiar from research literature: respond-ents clearly emphasise the importance of those factors that have deteriorated. Correspondingly, HKL surveys show that getting a seat on the bus is the least im-portant factor, apparently because respondents had no problems getting one. The weights utilised by YTV are determined by administrative decision.
One of the greatest dilemmas in customer satisfac-tion surveys is the fact that some passengers always find some quality factors to be more or less incon-sequential, which erodes the credibility of the results. If respondents were also asked to prioritise the vari-ous factors, the data could also be utilised to evalu-ate strength of opinion. However, most people find putting a list of some ten service level factors in order of importance a very difficult task, as the significance of the factors very much depends on the circum-stances. Other research methods may nonetheless be employed. The survey now conducted on passenger valuations provides an excellent starting point for fur-ther study. n
Sources Friman, M., 2004. Implementing Quality Improvements in Public Transport. Journal of Public Transportation, Vol. 7, No 4, 2004.
Li, Y., 2003. Evaluating the Urban Commute Experience: A Time Perception Approach. Journal of Public Transportation, Vol. 6, No 4, 2003.
SFS, 2005. SFS-EN 13816. Kuljetus. Logistiikka ja palvelut. Joukkoliikenne. Palvelun laadun määritys, tavoite ja mittaaminen. [Transportation. Logistics and services. Public passenger transport. Service quality definition, targeting and measurement.] Finnish Standards Association SFS. Helsinki. 59 pp.
Quattro, 1998. Quattro Final Report – Synthesis and recommendations. European Commission, Transport RTD programme, 4th Framework Programme. 229 pp.


