Quality control and assurance in fabrication of welded ... · Quality control and assurance in...
13
RESEARCH PAPER Quality control and assurance in fabrication of welded structures subjected to fatigue loading T. Stenberg 1 & Z. Barsoum 1 & E. Åstrand 2 & A . Ericson Öberg 2 & C. Schneider 3 & J. Hedegård 3 Received: 5 December 2016 /Accepted: 29 May 2017 /Published online: 28 June 2017 # The Author(s) 2017. This article is an open access publication Abstract The current paper presents a comprehensive over- view of weld quality control and assurance of welded struc- tures where the major failure prevention is due to fatigue load- ing. It gives the drawbacks and limitation of quality control systems, international weld quality standards, and guidelines used in today’ s weld production. Furthermore, in recent de- velopment in quality control and assurance of welded struc- tures, a new online method is presented. The main target is to enable a complete, online evaluation of large quantities of welds in an accurate and repeatable fashion. Information gath- ered will not only be used for determining the weld quality level with respect to the fatigue strength but also to be evalu- ated for use in improved process control, in welding power sources, and robot control systems. It is verified that the new online method, a new laser scanning technology, and algo- rithms can successfully be used as modern tools for automated unbiased geometrical weld quality assurance and implement- ed in weld production environment. Keywords (IIW Thesaurus) Welded joints . Imperfections . Fatigue . Quality . Surface measurements . Inspection 1 Introduction Steel is the dominating material for many types of load carry- ing structures and components in construction machineries, loader cranes, forestry machines, mining equipment, transport vehicles, and agricultural equipment. Normally, 60–80% of the vehicle weight consists of steel plates and steel castings in thickness 6–70 mm with welding as the primary joining technology. Structural details in trucks, buses, and trains are also often manufactured using different welding technologies. Thus, a large part of the products being used in the global transport system often consists of heavy steel structures where welding is a dominating joining technology. Structural details and components in many of these products are continuously subjected to variable loading during operation. Typically, a load range for many types of vehicles and machineries is 1000–20,000 cycles per h. This means that during the eco- nomic life of 10,000–25,000 operation hours, the components will sustain 10–500 million load ranges. Thus, fatigue loading is the most common failure mode for the abovementioned products. Material and fabrication technologies for welded structures are continuously developing. The end users are also continu- ing to push the limits of the structures used in automotive, construction, offshore, energy production, and within many other fields. The endeavors to reduce weight and cost, increase energy efficiency, improve performance, and reduce the envi- ronmental impact continue to provide challenges in fatigue design of welded structures. Structures which incorporate welding of high-strength materials also require a fundamental understanding of potential failure modes and mechanisms. In order to enable the production of more lightweight structures, the utilization of high-strength materials is increasing rapidly. However, when designing a welded structure in high-strength steel, the designer needs to consider several important factors Recommended for publication by Commission XIII - Fatigue of Welded Components and Structures * Z. Barsoum [email protected] 1 KTH Royal Institute of Technology, Stockholm, Sweden 2 Volvo Construction Equipment AB, Eskilstuna, Sweden 3 Swerea KIMAB AB, Kista, Sweden Weld World (2017) 61:1003–1015 DOI 10.1007/s40194-017-0490-5
Transcript of Quality control and assurance in fabrication of welded ... · Quality control and assurance in...

RESEARCH PAPER
Quality control and assurance in fabrication of welded structuressubjected to fatigue loading
T. Stenberg1 & Z. Barsoum1& E. Åstrand2
& A . Ericson Öberg2 & C. Schneider3 &
J. Hedegård3
Received: 5 December 2016 /Accepted: 29 May 2017 /Published online: 28 June 2017# The Author(s) 2017. This article is an open access publication
Abstract The current paper presents a comprehensive over-view of weld quality control and assurance of welded struc-tures where the major failure prevention is due to fatigue load-ing. It gives the drawbacks and limitation of quality controlsystems, international weld quality standards, and guidelinesused in today’s weld production. Furthermore, in recent de-velopment in quality control and assurance of welded struc-tures, a new online method is presented. The main target is toenable a complete, online evaluation of large quantities ofwelds in an accurate and repeatable fashion. Information gath-ered will not only be used for determining the weld qualitylevel with respect to the fatigue strength but also to be evalu-ated for use in improved process control, in welding powersources, and robot control systems. It is verified that the newonline method, a new laser scanning technology, and algo-rithms can successfully be used as modern tools for automatedunbiased geometrical weld quality assurance and implement-ed in weld production environment.
Keywords (IIW Thesaurus) Welded joints . Imperfections .
Fatigue . Quality . Surfacemeasurements . Inspection
1 Introduction
Steel is the dominating material for many types of load carry-ing structures and components in construction machineries,loader cranes, forestry machines, mining equipment, transportvehicles, and agricultural equipment. Normally, 60–80% ofthe vehicle weight consists of steel plates and steel castingsin thickness 6–70 mm with welding as the primary joiningtechnology. Structural details in trucks, buses, and trains arealso often manufactured using different welding technologies.Thus, a large part of the products being used in the globaltransport system often consists of heavy steel structures wherewelding is a dominating joining technology. Structural detailsand components in many of these products are continuouslysubjected to variable loading during operation. Typically, aload range for many types of vehicles and machineries is1000–20,000 cycles per h. This means that during the eco-nomic life of 10,000–25,000 operation hours, the componentswill sustain 10–500 million load ranges. Thus, fatigue loadingis the most common failure mode for the abovementionedproducts.
Material and fabrication technologies for welded structuresare continuously developing. The end users are also continu-ing to push the limits of the structures used in automotive,construction, offshore, energy production, and within manyother fields. The endeavors to reduce weight and cost, increaseenergy efficiency, improve performance, and reduce the envi-ronmental impact continue to provide challenges in fatiguedesign of welded structures. Structures which incorporatewelding of high-strength materials also require a fundamentalunderstanding of potential failure modes and mechanisms. Inorder to enable the production of more lightweight structures,the utilization of high-strength materials is increasing rapidly.However, when designing a welded structure in high-strengthsteel, the designer needs to consider several important factors
Recommended for publication by Commission XIII - Fatigue of WeldedComponents and Structures
* Z. [email protected]
1 KTH Royal Institute of Technology, Stockholm, Sweden2 Volvo Construction Equipment AB, Eskilstuna, Sweden3 Swerea KIMAB AB, Kista, Sweden
Weld World (2017) 61:1003–1015DOI 10.1007/s40194-017-0490-5

in order to allow for the lightweight potential, i.e., to reducethe scatter of quality in production and at the same time in-crease the weld quality.
Fatigue failures in welded structures often starts in thewelded joint where the fatigue strength is generally lowercompared to base material and notched components, see Fig.1a. The fatigue life in base material and notched componentsis dominated by the crack initiation phase; however, in weldedstructures, most of the propagation phase is consumed due todefects and imperfections which are induced during thewelding process. There is a great scatter in fatigue life ofwelded joints which is mainly due to the variation of the localweld geometry, size, and location of defects and residualstresses initiated during the welding process. This has beenverified in multiple studies, and it has been incorporated inweld quality standards and recommendations for fatigue de-sign of welded joints [1, 2]. Since defects, imperfections, andother types of irregularities are common in welds, it becomesimportant to have rules and acceptance criteria for them.These weld defects determine the fatigue life which is sup-ported by the Kitagawa diagram, Fig. 1b, which shows thefatigue strength versus defect size at various locations in theweld joint [6]. The weld class system describes many kinds of
imperfections and states the acceptance limits for variouslevels of quality, e.g., ISO 5817 [3], having the classes D, C,and B where B has the highest weld quality and D the lowest.However, current rules given in this system show a weekrelation to fatigue, which has been proven in several investi-gations [4, 5]. Consequently, if the designers use this system toreduce the weight of a load-carrying structure and optimizeplate thicknesses along with the weld geometry for fatigue,they meet the problem of how to decide the appropriate qual-ity expressed as the weld quality level.
Design and manufacturing of welded structures are impor-tant tasks which require accuracy, especially for roboticwelding in serial production. For lightweight welded struc-tures, however, where thinner and high-strength steels are uti-lized, the increased nominal stress levels require considerationof other design aspects such as buckling, plastic collapse, andfatigue strength. High-strength steels suffer from an increasedsensitivity to notches and defects compared to mild steels. Forwelded components, the fatigue strength will be the same forhigh-strength steel and mild steel if no improved weld qualityis achieved [6]. Thus, improving the design of the weldedstructure by using high-strength steel requires improved weldquality, which in turn demands an improved quality assurance.Today, most of the quality assurance for welded componentsis carried out by the audit process, separate to the productionline, using standard handheld gauges. Hammersberg andOlsson [7] concluded that basic standard gauges and methodsfor weld quality assurance are out-dated if care is not taken toinvestigate and improve the used measurement systems rela-tive to the actual variations occurring in production. Thus, tofully achieve lightweight design in welded structures,manufacturing companies which utilize serial production willface challenges in quality assurance when introducing high-strength steel in their products. Other methods and tools whichcan be used for assessing the weld surface geometry are laserprofile sensors or vision systems, in which the scanning de-vice is used to acquire the surface and then an algorithm cal-culates certain surface features of the welded joint being mea-sured [8–10].
This current study gives a brief description of how to defineweld quality, different weld quality systems for weld qualitycontrol, and assurance for welded structures subjected to fa-tigue loading. Furthermore, it brings light into aspects that areimportant for quality assurance of welded structures and howwelds could be designed and fabricated for a purpose. Finally,a new online method is presented for unbiased geometricalweld quality assurance, which is successfully verified withtesting. The focus of this study is to cover aspects of outershape of the weld geometry; hence, internal aspects such aspenetration and lack of fusion are not covered.
Design and manufacturing of welded structures are impor-tant tasks which require accuracy, especially for roboticwelding in serial production. For lightweight welded
Fig. 1 a Schematic illustration of fatigue strength in base material andnotched and welded components. b Kitagawa diagram, fatigue strengthversus defect size, with indicated weld positions [6]
1004 Weld World (2017) 61:1003–1015

structures, however, where thinner and high-strength steels areutilized, the increased nominal stress levels require consider-ation of other design aspects such as buckling, plastic col-lapse, and fatigue strength. High-strength steels suffer froman increased sensitivity to notches and defects compared tomild steels. For welded components, the fatigue strength willbe the same for high-strength steel and mild steel if no im-proved weld quality is achieved [6]. Thus, improving the de-sign of the welded structure by using high-strength steel re-quires improved weld quality, which in turn demand an im-proved quality assurance. Today, most of the quality assurancefor welded components is carried out by the audit process,separate to the production line, using standard gauges.Hammersberg and Olsson [7] concluded that basic standardgauges and methods for weld quality assurance are outdated ifcare is not taken to investigate and improve the used measure-ment systems relative to the actual variations occurring inproduction. Thus, to fully achieve lightweight design inwelded structures, manufacturing companies which utilize se-rial production will face challenges in quality assurance whenintroducing high-strength steel in their products.
This current study gives a brief description of differentweld quality systems for weld quality control and assurancefor welded structures subjected to fatigue loading.Furthermore, it brings light into aspects that are importantfor quality assurance of welded structures and how weldscould be designed and fabricated for a purpose. Finally, anew onlinemethod is presented for unbiased geometrical weldquality assurance, which is successfully verified with testingand implementation in weld production environment.
2 Weld quality standards
The weld quality quantifies the welded joints’ ability to per-form the functional requirements of the weld during the ser-vice life of the structure. This could be either durability instatic and/or dynamic loading, corrosion resistance, appear-ance, or any other mechanical function. Insufficient qualitymust be avoided due to profound consequences in safety andcost, i.e., failure occurs at an early stage. Excessive quality onthe other hand may result in increased fabrication cost whichdoes not add more customer value to the product. It is alsonecessary as a design engineer to specify the sufficient qualityin the relevant locations of the structure, as various locationsin the structure may experience increased loading due to localstress raisers such as stiffeners, holes, and notches [6]. Thegeometry of the weld depends on several factors such as weldfiller material, orientation of the work piece during welding,and process parameters [11–13]. Also, different weld discon-tinuities and geometrical imperfections affect the fatigue lifeof the welded joint differently. An efficient fabrication ofwelded structures requires a quality system to work with.
This should support best practice and give predicted fatiguelife properties of the structures. The weld requirements are themost important factors in the quality systemwhich determinesboth fabrication cost and the fatigue life.
In a comparison of six international and national standardsfor welding quality criteria, demands are in general based onworkmanship rather than fatigue properties. One standard ap-plies to fitness for purpose, but this standard is used for nucle-ar power plants and is not widespread [14].
2.1 International standard SS-EN ISO 5817
SS-EN ISO5817 is a European standard for fusionwelded jointsin steel, nickel, titanium, and their alloys with quality levels andimperfections [3]. The weld quality is defined by quality levels(B, C, or D), where B is the highest and D the lowest weldquality, respectively. The letters represent different quality levelswith acceptance limits defined for each weld discontinuity andimperfection. The standard covers more than 40 different dis-continuities and weld imperfections for the different qualitylevels; Fig. 2 presents some of these discontinuities. The ISO5817 standard was designed in the 1960s using a German stan-dard DIN 5863, by welding workshops which were followingthe principle of Bgood workmanship.^ Many requirements lacka connection to fatigue and are unnecessary demanding, likeoverlap and excess weld metal. Other requirements are too gen-erous like, incompletely filled groove, or linear misalignmentand can ruin the fatigue life if they are present. In an idealwelding standard, there should be a clear and consistent connec-tion; assuring that a certain welding quality level always resultsin a certain fatigue life of the welded joint.
Karlsson and Lenander [5] conducted a comprehensivestudy of the relation between the acceptance limits withinISO 5817 and the resulting fatigue life using fracture mechan-ics. It was shown that for some imperfections, there was adirect relationship between the acceptance limit and theresulting fatigue life, i.e., a higher quality level should resultin longer fatigue life compared to a lower quality level.However, this was not consistent for all discontinuities, whereseveral shows little or no relationship between the qualitylevel and the fatigue life. Figure 3 gives examples of discon-tinuities which have poor correlation between weld qualityand fatigue life (1.10 excessive convexity and 1.16 unequalleg length) and good correlation (1.17 root concavity and 3.2angular misalignment), respectively. One of the most criticallocal weld geometry features is the weld toe radius [13, 15, 16]which is vaguely regulated by acceptance limits with a simplerequirement of smooth transition. One of the reasons is thatuntil presently, it has been difficult to quantify the weld toeradius accurately and robustly. Instead, ISO 5817 gives accep-tance level for the weld toe angle.
At the current state, the designers have no other choice thanto assume average fatigue strength due to missing guidelines
Weld World (2017) 61:1003–1015 1005

for high quality in production and absent instructions for tak-ing advantage of the high-quality welds in the design [17]. Inthe current version of ISO 5817, an annex has been added foradditional requirements for welds in steel subjected to fatiguewhich is based on Volvo Group STD 181-0004 [1]. In partic-ular, it relates the weld quality levels to the fatigue strengthand gives acceptance limits for the different weld qualitylevels based on, e.g., the weld toe radii.
2.2 Volvo Group STD 181-0004
A new weld quality standard was introduced by Volvo Group[1] in 2008 with quality levels with relation to the fatiguestrength. The new weld quality system [1] is divided into four
different quality levels (VE, VD, VC, VB) for fatigue loadedstructures and one for static loaded structures (VS). Qualitylevel VE, which has the lowest requirements regarding dis-continuities, should be used for welds where the root and weldpenetration is critical.
VD and VC stands for the Bas welded condition,^ normalquality (VD) and high quality (VC). The last and highest level(VB) stands for Bpost treated welds^ regardless of kind oftreatment. The quality system defines rules for imperfectionson the surface and embedded. The weld root is not consideredin the quality system and should be a dimension on the draw-ing. One important feature in the weld quality system is thatthe acceptance limits reflect the fatigue life, and those imper-fections which do not have an impact on the fatigue life are not
Fig. 2 Examples of welddiscontinuities covered in SS-ENISO 5817 [3]
Fig. 3 Example of relation between weld quality acceptance limits in ISO 5817 and the resulting fatigue life [1]
1006 Weld World (2017) 61:1003–1015

included. If the quality level is increased one step, the fatiguelife should be expected to increase a factor of 2 or alternativelythe allowed stress level could be increased by 25%. Exampleof acceptance limits for different discontinuities in STD 181-0004 is given in Table 1.
2.3 IIW guidelines on weld quality
The International Institute of Welding (IIW) have recentlypublished a Guideline on weld quality in relation to fatiguestrength [18] with the intention to provide quantitative andqualitative measures of geometric features and imperfectionsof welded joints to ensure that it meets the fatigue strengthdemands found in IIW [2] based on different assessmentmethods [2, 19, 20]. It also defines acceptance criteria basedon weld geometry and imperfections which results in in-creased fatigue strength which are defined in S-N curves fordifferent fatigue assessment methods.
3 Design and weld for purpose
The overall trend nowadays is to develop, design, and fabri-cate optimized cost-effective welded structures which shouldconsider the aspects of the material, production, and dimen-sioning methods to achieve the objectives concerning weight,quality, and cost, which often are contradictory. Therefore, it isimportant to consider the purpose of the weld and to Bdesignfor purpose.^ This means that the weld should be dimensionedso that it can carry the load it is subjected to, see Fig. 4. Thiswould mean that if the joint is subjected to the load F1, theweld root would be the critical location of the welded jointassuming partial penetration and an ordinary throat thickness.If the throat thickness is very large compared to the platethickness, the weld toe can be critical. When the joint is
subjected to the load F3, the weld toe is critical. This shouldbe considered when dimensioning the weld in order to havethe correct weld quality requirements. The easiest scenariowould be the load Q2, where the load results in shear stressin the weld, hence a loss in shear strength capacity.
There are still some problems connected to the weld qualitysystems in relation to the desired principle to have differentwelding procedures for various load conditions. The weldclasses are inexplicit, and it is then hard to specify differentrequirements according to the load. This leads to a situationwhere many or most of the specified requirements are notrelevant to the fatigue strength of the joint while other signif-icant demands are not stated at all or drowned among all otherrequirements. This is visualized in Fig. 5. The welder or robotprogrammer has to follow the standard even though the fa-tigue life could be increased and the production cost reducedwith optimized requirements. The most important geometricalparameters of the welds are the notch radius in the weld toeand depth of penetration in the root [18]. The discrepancy
Table 1 Example of acceptance limits for quality level in STD 181-0004 [1]
Discontinuity types VS VE VD VC VBWeld class for Static strength Fatigue strength
Cold lap Permitted a ≤ 1 mm a < 0.5 mm a < 0.1 mm Not permitted
Internal lack of fusion a ≤ 0.2t Not permitted Not permitted Not permitted Not permitted
Weld toe transitionradius
No requirements No requirements R > 0.3 mm R > 1 mm R > 4 mm
Undercuta a ≤ 0.2t [max 2.0 mm] a ≤ 0.1t [max 1.0 mm] a < 0.05t [max 1.0 mm] a < 0.04t [max 1.0 mm] Not permitted
Underpassedthroat dimension
a ≥ 0.8a a ≥ 0.9a [max 2.0 mm] a ≥ 0.9a [max 2.0 mm] Not permitted Not permitted
Edge displacement(linearmisalignment)
a ≤ 1.5t + 0.25t [max 5.0 mm] a ≤ 1.0t a < 0.1t a ≤ 0.05t Not permitted
a Valid for butt welds, higher acceptance limits for fillet welds
a throat thickness (mm)
t plate thickness (mm)
Fig. 4 Example of how to categorize weld based on the loading
Weld World (2017) 61:1003–1015 1007

between the requirements and the structural integrity may giverise to problems and unnecessary cost in the weld shop.Typically, the weld size and quality level are similar for allload conditions, meaning that same welding procedures areused. These results give a misdirected focus were the welderdo not consider the critical characteristics of the weld beforeany other requirement. All requirements are getting the sameattention, according to good workmanship, while many ofthem do not add any value to the customer regarding structuralintegrity. In the worst case, fulfillments of non-critical require-ments are done on behalf of the critical characteristic [21].Studies show a contradiction between large throat size andextensive weld penetration, meaning that it can be beneficialto specify and aim for a smaller throat size and receive adeeper penetration and by that an improved fatigue strength[18, 19]. The welding standard has a high influence on the costand a reviewwhich only states that the critical requirements ofthe weld can reduce the cost and increase the quality.
4 Measurement systems for quality assuranceof the weld surface geometry
Today, numerous handheld manual gauges are available toassess the weld quality in production and inspection, seeFig. 6. The gauges for measuring the weld toe radius are theradius gauge and the radius master, Fig. 6a, b. The radiusgauge contains a set of blades where the end of every bladehas a predefined radius. Themeasuring operation is performedmanually, where the operator compares different blades with
the weld toe radius being assessed. The weld toe radius isdetermined as the radius of the blade which has the best fit.The radius master is manufactured from a solid block usingelectrical discharge machining to achieve a high precisionsurface geometry, ±0.03 mm. The master resembles a weldedcruciform joint where the four different sides contain a weldtoe radius which correlates to the requirements within the weldquality system [1]. The measuring is conducted by visual in-spection of the weld toe on the specimen being assessed.Using the radius master as a reference, the operator estimatesthe weld toe radius based on the visual difference between thespecimen and the radius master.
When using a single manual gauge—or even an auto-mated measurement system—for repeated measurementson a part, there will be a scatter or variation in the results.The variability in the measurement system can be inves-tigated by conducting a measurement system analysis.Depending on the type of measurement data, GaugeR&R can be used. In that case, several operators conductrepeated measurements on several parts. The statisticalanalysis can then determine which part of the measure-ment system contributes the most to the variation: thegauge, the operator, or the measured parts. It is desiredthat the major source of the variation is the part-to-partvariation, meaning that the variation stems from actualdifferences between the parts. To decide whether a gaugeis appropriate for quality assurance or not depends on (i)what feature the system is supposed to measure, (ii) thespecified tolerance width of that feature on the part, and(iii) if the gauge’s contribution to the variation is
Fig. 5 Critical positions in a filletfor different load condition,illustrating the concept of weldfor purpose
Fig. 6 Gauges for measuring the local weld geometry. a Radius gauge. b Radius master. c Gauge for throat thickness and depth of undercut
1008 Weld World (2017) 61:1003–1015

significantly lower than the tolerance width of the part. Ifthe feature is measured in the millimeter range, a rule ofthumb is that the measurement system should be able tomeasure in the 1/10 mm range. A standard requirement isthat for making Go/No Go decisions, the measurementsystem should not contribute more than 9% of the totalvariation in measurements. For process development, thecontribution should be <4% [7]. Hammersberg andOlsson [7] conducted a measurement system analysis onthe gauge in Fig. 6c when measuring the weld throatthickness, see Fig. 7. It was concluded that the gaugehad a contribution of almost 60% of the total variation,which is too large for Go/No Go decisions (>9%) andprocess development (>4%).
The gauges mentioned above are only able to measure onone single position at a time. Performing such an inspection is,therefore, time-consuming and subjective, which makes thesegauges inappropriate for a lean, tact-timed production
environment where the fast feedback of continuously chang-ing local weld geometry is required.
Other tools available for measuring the local weld geome-try are vision systems, where the welded surface is scanned,and the evaluation is performed in a computerized environ-ment. The assessment is done by manually placing measure-ment points—a minimum of 3—in the area of interest on thecross-section curve of the measured surface. The programthen calculates the radius using the least square method, seeFig. 8. Thus, it is the operator who decides where the programcalculates the weld toe radius and does the judgment if theradius fit is right or not. An equivalent way to measure radi-uses is to do a weld impression analyze (WIA). For this mea-sure, a dental impression material is used to create a replica ofthe weld surface. The impression is sliced in thin sections, andthe measurement is done on a microscope picture in a com-puter with from the section, where a 3-point circle is drawnandmeasured on the weld toe transition. Gauge R&R analyses
Fig. 7 Measurement system analysis of gauge for measuring the throat thickness [7]
Fig. 8 Welded surface is measured and divided into several cross sections where each cross section is evaluated individually
Weld World (2017) 61:1003–1015 1009

show excellent results forWIAwhere only 2% of the variationrelates to the measurement system [22].
It is needed to knowwho want to make a decision and whattype of information support is then necessary to choose theright measurement system. Ericson Öberg and Hammersbergdescribe different scenarios depending on the informationneed of the welder, programmer, or engineer [23, 24].Depending on the information need, different methods formeasuring weld toe radius are suitable. Unrelated to methods,standardized measure procedures which can be instructions orprogrammed algorithms are important.
5 ONWELD—ONline WELD quality assurance
As discussed in Sect. 1, the resulting fatigue strength of jointswelded with high-strength steel is entirely dependent on theproduced weld quality. This prevents designers to introducehigh-strength steel in their welded components unless produc-tion departments have the necessary tools for quality assur-ance in serial production. These tools should result in onlinemonitoring and control of the weld quality for real-time con-trol and feedback on the quality produced. This will result inminimizing final inspection, audit, and repair, thus enablingcost-effective weld production and optimized lightweightwelded structures with desired structural performance, e.g.,in relation to fatigue.
Such a system has been developed, ONline method forquality assurance of WELDed structures (ONWELD),where concepts for quality measurements [6] have beenimplemented in a robotic cell. Figure 9 shows a pictureof the complete system. A laser profile sensor is mountedon the robot head to scan the welded surface. Positioncoordinates of where the scanning is conducted are alsoacquired. The measured data is then sent for analysis, andthe resulting weld geometry is presented to the operator inquantitative terms such as throat thickness, depth of
undercut, and weld toe radius. The operator can alsochoose which quality standards (e.g., ISO 5817, STD181-0004) should be used to check the acceptance limitsagainst. Furthermore, the operator can specifically selectwhich defect type/property that needs to be assessed andat what quality level, with respect to the acceptance limits.The properties that can be monitored with the system arethroat size, transition radii, leg deviation, plate angles, andundercut size. This is illustrated in Fig. 10. The output willthen be presented on a BGo/No Go^ bar for the individualimperfections selected for evaluation over the measureddistance. A BGo^ would mean that the weld is satisfyingthe weld quality levels defined for the imperfection, and a
Fig. 9 ONWELD system; laserprofile sensor, position coordinatescanning, and robot
Fig. 10 Illustration of the properties/imperfections inspected: throatsize (a), transition radius (r), leg deviation (h), plate angle (p), andundercut (d)
1010 Weld World (2017) 61:1003–1015

BNo Go^ means that the requirements are not met andactions are necessary to either improve the weld qualityor if applicable to downgrade the weld quality level forthat particular position. Figure 11 gives a schematic illus-tration of the Graphical User Interface (GUI) for theONWELD system.
5.1 ONWELD—measurement system analysis
In order to test how reliable the ONWELD system is, repeat-ability tests were conducted. Welded samples were scanned
with 100 Hz three times, resulting in more than 600 measure-ments each time for each sample. Figure 12 shows three rep-resentative samples with different weld geometry where thewelded specimens do show undercuts at the weld toe, chang-ing throat thickness, etc. Compared to a similar study conduct-ed 1 year before, several improvements were noticed, e.g.,lower sensitivity to vibrations and reduced number of returnederror values (−1).
Since the connection to the exact position was not yetavailable in this actual test system, the start position for themeasurements had to be estimated based on when the systemreturned measurements (on the weld) instead of error values(outside the weld). This can be a source of errors in the casethe estimated start positions are not exactly the same betweenthe samples.
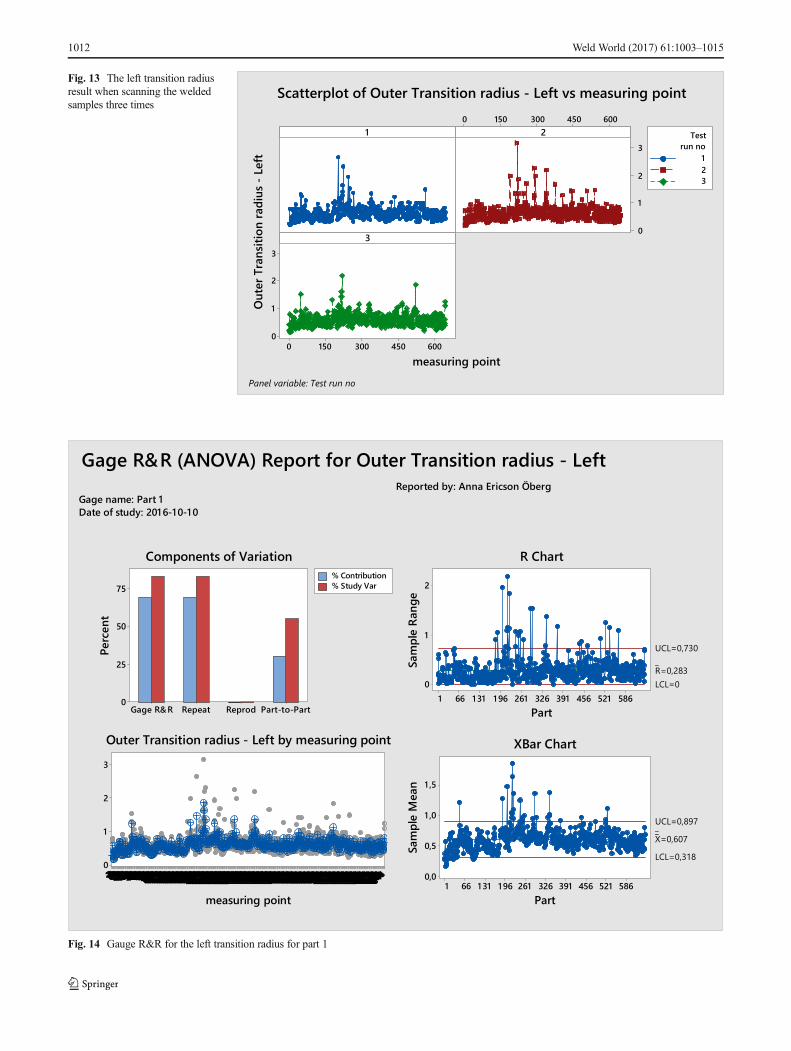
The variation stemming from the measurement systemvaried depending on the property monitored. Figure 13shows the results when scanning the weld sample threetimes. The variation and scatter in the results are small forthe throat size measurements which illustrate the repeat-ability potential of the system. As an example, Fig. 14shows the Gauge R&R for the left transition radius fortest part 1 where the range average, the difference be-tween the measured results for each measuring point,was 0.283 mm. More than 30% of the variation in themeasurement system for this property was stemming fromthe measurement system itself. When instead measuringthroat thickness, as displayed in Fig. 15, the range aver-age was only 0.036 mm and the variation stemming fromthe measurement system was only 1.5%. Table 2 showsthe range average for the di fferent proper t ies /imperfections when six test parts and a test block were
Fig. 11 GUI for the ONWELD system
Fig. 12 Some welded test samples that were scanned multiple times totest repeatability
Weld World (2017) 61:1003–1015 1011
Gage name: Part 1 Date of study: 2016-10-10
Reported by: Anna Ericson Öberg
Part-to-PartReprodRepeatGage R&R
75
50
25
0
Perc
ent
% Contribution% Study Var
648647
646
64564
464364
264
164063963863763663563463363263163062
962
862762662562
462
362262162061
961 861 761 661561
461 361 261 161 060960860760660560460360
260
160059959859
759
659559459359
259
159058958858
758
658558458358258
158057957857757657557
457
357257157056
956856756656556
456356256156
055
955855755655
555
455355255155054954854754654554454354
254
154053
953853
753
653553453353
253
153052952852
752652552452352252152051 951 851 751 651 551
451 351 251 151
050
950850750650
550
450350250150
049
949849749649549449349249149048
948848
748
648548448348
248
148047947847
747647547447347
247147046946
846746646546446346246146045
945845745645
545
445345245145
044
944844
744644
544
444344244144
043
943843743643543443343243143042942842
742
642542442342
242142041 941841
741 641 541 441
341
241 141 040940840740640
540440340240140
039
939839739639
539
439339239139
038
938838738638
538
438338238138037937837737637537437337
237137036936836
736636536436
336
236136035935
835
735635
535435335235135034934834734634
534
434334234134
033
933833733633
533
433333233133
032932832732632532432332232132031 931 831
731 631 531 431
331
231 131 030930
830
730630530430
330
230130029929
829
729629529429329
229129028928828728628
528
428328228128
027927827727627
527427327227
127
026926826726626526426326226126025925
825
725625525425
325
225125
024924
824
724624524424
324
224124023923823723623523423323223123
022
922822722622
522422322222
122
021 921 821 721
621
521 421321 221 121 020920820720620520420
320
220120
01 991 9
81 9
71 961 951 941 9
31 9
21 911 901 891 8
81 871 861 851 841 831 821 811 8017
91 781 771 761 7
51 741 731 721 711 7
01 691 681 671 6
61 6
51 641 631 621 6
11 6
01 5915
81 571 5
61 5
51 541 531 521 511 501 491 481 471 461 451 441 4
31 4
21 411 401 391 3
813
71 361 351 341 3
31 321 311 301 291 2
81 271 261 251 241 231 221 211 201 1 91 1 81 1 711
61 1
51 1 41 1 31 1 21 1
11 1
01 091 081 071 0
61 0
51 041 031 021 0
11 0
099989796959493929190898887868584838281807978777675747372717069686766656463626160595857565554535251504948474645444342414039383736353433323130292827262524232221201 91 81 7161 51 41 31 21 11 0987654321
3
2
1
0
measuring point
5865214563913262611 96131 66 1
2
1
0
Part
Sam
ple
Rang
e
_R=0,283
UCL=0,730
LCL=0
5865214563913262611961 31 66 1
1 ,5
1 ,0
0,5
0,0
Part
Sam
ple
Mea
n
__X=0,607
UCL=0,897
LCL=0,318
Components of Variation
Outer Transition radius - Left by measuring point
R Chart
XBar Chart
Gage R&R (ANOVA) Report for Outer Transition radius - Left
Fig. 14 Gauge R&R for the left transition radius for part 1
6004503001500
3
2
1
0
6004503001500
3
2
1
0
1
measuring point
Out
er T
rans
ition
radi
us -
Left
2
3
123
run noTest
Scatterplot of Outer Transition radius - Left vs measuring point
Panel variable: Test run no
Fig. 13 The left transition radiusresult when scanning the weldedsamples three times
1012 Weld World (2017) 61:1003–1015
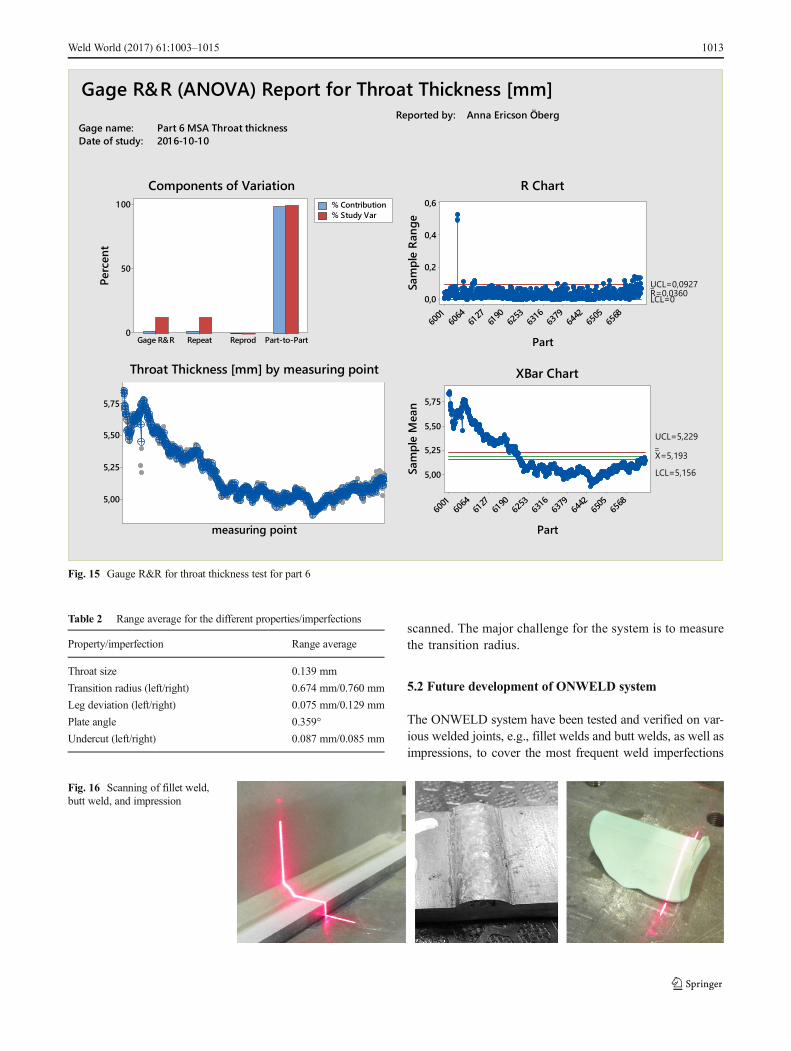
scanned. The major challenge for the system is to measurethe transition radius.
5.2 Future development of ONWELD system
The ONWELD system have been tested and verified on var-ious welded joints, e.g., fillet welds and butt welds, as well asimpressions, to cover the most frequent weld imperfections
Gage name: Part 6 MSA Throat thicknessDate of study: 201 6-1 0-10
Reported by: Anna Ericson Öberg
Part-to-PartReprodRepeatGage R&R
1 00
50
0
Perc
ent
% Contribution% Study Var
5,75
5,50
5,25
5,00
measuring point
6568
6505
6442
6379
631 6
6253
6190
6127
6064
6001
0,6
0,4
0,2
0,0
Part
Sam
ple
Rang
e
_R=0,0360UCL=0,0927LCL=0
6568
6505
6442
6379
6316
6253
6190
6127
6064
6001
5,75
5,50
5,25
5,00
Part
Sam
ple
Mea
n
__X=5,193
UCL=5,229
LCL=5,156
Components of Variation
Throat Thickness [mm] by measuring point
R Chart
XBar Chart
Gage R&R (ANOVA) Report for Throat Thickness [mm]
Fig. 15 Gauge R&R for throat thickness test for part 6
Table 2 Range average for the different properties/imperfections
Property/imperfection Range average
Throat size 0.139 mm
Transition radius (left/right) 0.674 mm/0.760 mm
Leg deviation (left/right) 0.075 mm/0.129 mm
Plate angle 0.359°
Undercut (left/right) 0.087 mm/0.085 mm
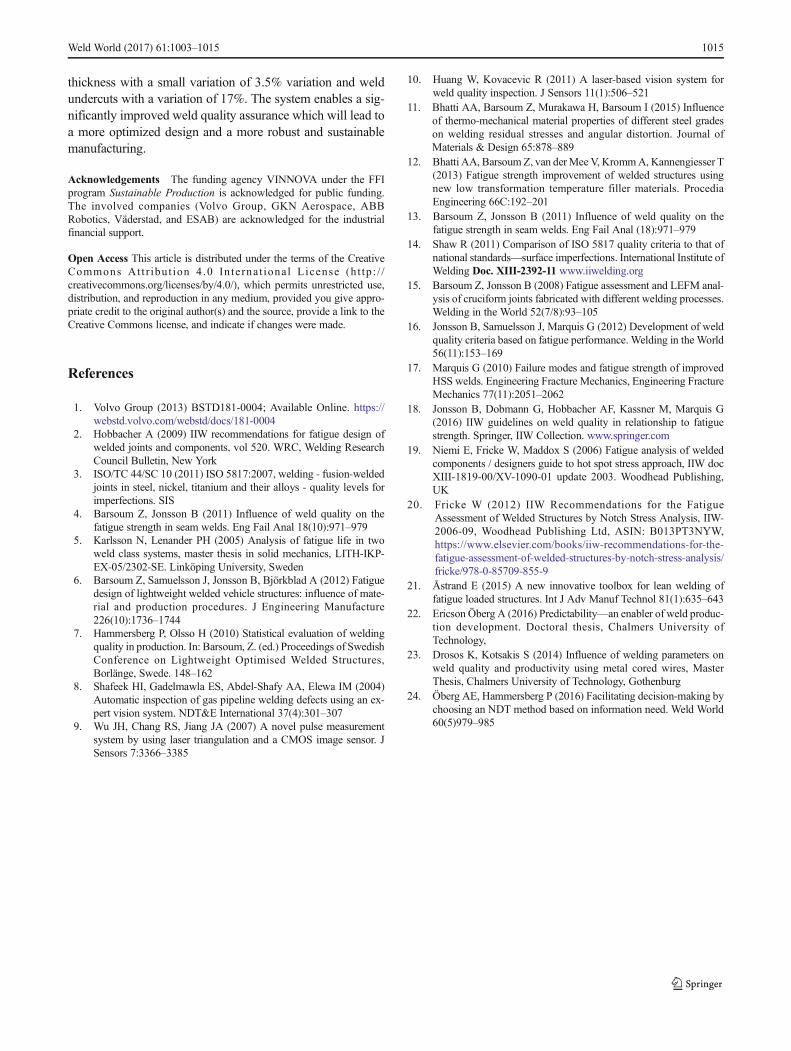
Fig. 16 Scanning of fillet weld,butt weld, and impression
Weld World (2017) 61:1003–1015 1013

included in the different weld quality standards; Fig. 16 showsexamples of such scanning. The tests show that it is possible tomeasure the weld geometry and verify the weld class whichhas a direct link to the fatigue properties of the welded joint.The most difficult property to measure is transition radius. Animprovement in range average can be expected when the robotpositions can be accurately attained to make sure the exactsame position is evaluated every time.
The next step in the development of the ONWELDsystem is to use the measurement data for the weld jointsfor rapid feedback on how the weld quality is influencedby different setups of the welding parameters such as cur-rent, voltage, wire feed rate, travel speed, and gun angle.This will enable an adjustment of the welding processparameters in situ to achieve the required weld qualitysystem during the production. Figure 17 illustrates theconceptual future application of the ONWELD systemwhere the feedback communication can be used for opti-mizing the welding process to achieve weld qualityrequired.
6 Conclusions
Weld quality assurance and control is an integral part for thedevelopment of optimization of welded structures subjectedfor fatigue loading in order to achieve increase in the durabil-ity and reduce variation for a sustainable production. To createa framework for efficient fabrication of welded structures sub-jected to fatigue, it is necessary to pass the following steps:
& Identify critical points of the welds which set the fatiguelife of the welded structure
& Develop welding procedures to optimize the fatigue prop-erties of the weld in relation to the load conditions. Thismeans improved properties at the weld toe or at the weldroot.
& Define appropriate weld requirements which contribute toa high focus on critical characteristics, merging best
knowledge of the welding process, fatigue properties andthe weld requirements
& Set design rules for the improved welding procedures toconnect the expected fatigue properties of the weld and thedesign limits
& Use the new requirements and design guideline to designstructures which are optimized for both cost and fatigue
The concept of design for purpose could be adopted byusing the ONWELD system and focusing on quality assuringthe critical weld toe based on the knowledge on how the weldsin the structure are loaded which in return would result in acost-effective quality control.
The current international standards for weld quality criteriaare mostly based on workmanship rather than the effect ofweld quality on the structural performance of the structure,e.g., fatigue properties. However, recent development of weldquality systems enables a link between acceptance criteria,quality levels, and the fatigue strength [1, 2]. Furthermore,high weld quality levels, with high requirements on the accep-tance criteria for the weld imperfection, in order to increase theoverall performance and quality of the structures, might not befulfilled due to the difficulties of control and assurance. Mostof the quality control and inspection measurement tools usedtoday in welding production are handheld and the measure-ments results in large unreliable scatter where the repeatabilityis poor. One approach to reduce the amount of unnecessaryquality control of welds is to adopt the concept of Bweld forpurpose,^ that is the weld is dimensioned and produced tohave the correct weld quality requirements based on, e.g.,the loading and the environment it is subjected to.
Within the scope of the research work reported herewith, anew system has been developed, ONWELD (ONline methodfor quality assurance of WELDed structures) with hardwareand software to assess the weld quality of fillet, overlap, andbutt welds. The system shows acceptable variation of contin-uous scanning of weld toe radii of 0.5 mm and a slightly largervariation at weld toe radii around 1 mm. The system is alsocapable of continuous measurement of the weld throat
Fig. 17 ONWELD system;future application for weldingprocess optimization
1014 Weld World (2017) 61:1003–1015
thickness with a small variation of 3.5% variation and weldundercuts with a variation of 17%. The system enables a sig-nificantly improved weld quality assurance which will lead toa more optimized design and a more robust and sustainablemanufacturing.
Acknowledgements The funding agency VINNOVA under the FFIprogram Sustainable Production is acknowledged for public funding.The involved companies (Volvo Group, GKN Aerospace, ABBRobotics, Väderstad, and ESAB) are acknowledged for the industrialfinancial support.
Open Access This article is distributed under the terms of the CreativeCommons At t r ibut ion 4 .0 In te rna t ional License (h t tp : / /creativecommons.org/licenses/by/4.0/), which permits unrestricted use,distribution, and reproduction in any medium, provided you give appro-priate credit to the original author(s) and the source, provide a link to theCreative Commons license, and indicate if changes were made.
References
1. Volvo Group (2013) BSTD181-0004; Available Online. https://webstd.volvo.com/webstd/docs/181-0004
2. Hobbacher A (2009) IIW recommendations for fatigue design ofwelded joints and components, vol 520. WRC, Welding ResearchCouncil Bulletin, New York
3. ISO/TC 44/SC 10 (2011) ISO 5817:2007, welding - fusion-weldedjoints in steel, nickel, titanium and their alloys - quality levels forimperfections. SIS
4. Barsoum Z, Jonsson B (2011) Influence of weld quality on thefatigue strength in seam welds. Eng Fail Anal 18(10):971–979
5. Karlsson N, Lenander PH (2005) Analysis of fatigue life in twoweld class systems, master thesis in solid mechanics, LITH-IKP-EX-05/2302-SE. Linköping University, Sweden
6. Barsoum Z, Samuelsson J, Jonsson B, Björkblad A (2012) Fatiguedesign of lightweight welded vehicle structures: influence of mate-rial and production procedures. J Engineering Manufacture226(10):1736–1744
7. Hammersberg P, Olsso H (2010) Statistical evaluation of weldingquality in production. In: Barsoum, Z. (ed.) Proceedings of SwedishConference on Lightweight Optimised Welded Structures,Borlänge, Swede. 148–162
8. Shafeek HI, Gadelmawla ES, Abdel-Shafy AA, Elewa IM (2004)Automatic inspection of gas pipeline welding defects using an ex-pert vision system. NDT&E International 37(4):301–307
9. Wu JH, Chang RS, Jiang JA (2007) A novel pulse measurementsystem by using laser triangulation and a CMOS image sensor. JSensors 7:3366–3385
10. Huang W, Kovacevic R (2011) A laser-based vision system forweld quality inspection. J Sensors 11(1):506–521
11. Bhatti AA, Barsoum Z, Murakawa H, Barsoum I (2015) Influenceof thermo-mechanical material properties of different steel gradeson welding residual stresses and angular distortion. Journal ofMaterials & Design 65:878–889
12. Bhatti AA, BarsoumZ, van derMeeV, KrommA, Kannengiesser T(2013) Fatigue strength improvement of welded structures usingnew low transformation temperature filler materials. ProcediaEngineering 66C:192–201
13. Barsoum Z, Jonsson B (2011) Influence of weld quality on thefatigue strength in seam welds. Eng Fail Anal (18):971–979
14. Shaw R (2011) Comparison of ISO 5817 quality criteria to that ofnational standards—surface imperfections. International Institute ofWelding Doc. XIII-2392-11 www.iiwelding.org
15. Barsoum Z, Jonsson B (2008) Fatigue assessment and LEFM anal-ysis of cruciform joints fabricated with different welding processes.Welding in the World 52(7/8):93–105
16. Jonsson B, Samuelsson J, Marquis G (2012) Development of weldquality criteria based on fatigue performance. Welding in the World56(11):153–169
17. Marquis G (2010) Failure modes and fatigue strength of improvedHSS welds. Engineering Fracture Mechanics, Engineering FractureMechanics 77(11):2051–2062
18. Jonsson B, Dobmann G, Hobbacher AF, Kassner M, Marquis G(2016) IIW guidelines on weld quality in relationship to fatiguestrength. Springer, IIW Collection. www.springer.com
19. Niemi E, Fricke W, Maddox S (2006) Fatigue analysis of weldedcomponents / designers guide to hot spot stress approach, IIW docXIII-1819-00/XV-1090-01 update 2003. Woodhead Publishing,UK
20. Fricke W (2012) IIW Recommendations for the FatigueAssessment of Welded Structures by Notch Stress Analysis, IIW-2006-09, Woodhead Publishing Ltd, ASIN: B013PT3NYW,https://www.elsevier.com/books/iiw-recommendations-for-the-fatigue-assessment-of-welded-structures-by-notch-stress-analysis/fricke/978-0-85709-855-9
21. Åstrand E (2015) A new innovative toolbox for lean welding offatigue loaded structures. Int J Adv Manuf Technol 81(1):635–643
22. Ericson Öberg A (2016) Predictability—an enabler of weld produc-tion development. Doctoral thesis, Chalmers University ofTechnology,
23. Drosos K, Kotsakis S (2014) Influence of welding parameters onweld quality and productivity using metal cored wires, MasterThesis, Chalmers University of Technology, Gothenburg
24. Öberg AE, Hammersberg P (2016) Facilitating decision-making bychoosing an NDT method based on information need. Weld World60(5)979–985
Weld World (2017) 61:1003–1015 1015