
QUALITY ASSURANCE MANUAL FOR THE VANDERBILT SAMPLE ANALYSIS PROGRAM · PDF file ·...
69
Appendix 8.E QUALITY ASSURANCE MANUAL FOR THE VANDERBILT SAMPLE ANALYSIS PROGRAM IN THE AMCHITKA INDEPENDENT ASSESSMENT Department of Civil and Environmental Engineering Vanderbilt University Nashville, TN June 9, 2005
Transcript of QUALITY ASSURANCE MANUAL FOR THE VANDERBILT SAMPLE ANALYSIS PROGRAM · PDF file ·...

Appendix 8.E
QUALITY ASSURANCE MANUAL FOR THE
VANDERBILT SAMPLE ANALYSIS PROGRAM
IN THE AMCHITKA INDEPENDENT ASSESSMENT
Department of Civil and Environmental Engineering Vanderbilt University
Nashville, TN
June 9, 2005

1
TABLE OF CONTENTS
SECTION 1: Project Quality Assurance Responsibilities
SECTION 2: Procedures
SECTION 3: Training
SECTION 4: Instrument Quality Control
SECTION 5: Sample Chain-of-Custody
SECTION 6: Analytical Quality Control
SECTION 7: Data Quality Control (Validation) and Reporting
SECTION 8: Document Quality Control
Appendix A: Canberra “Execute Sequence” setup
Reviewed and Approved by: Approval Date:
Quality Assurance Manager Reviewed and Approved by: Approval Date:
Program Director

2
SECTION 1. PROJECT QUALITY ASSURANCE RESPONSIBILITIES Program description The Amchitka Independent Assessment is a scientific investigation of the hazards and risks associated with the Amchitka underground nuclear tests to achieve closure of the site by the US Department of Energy (DOE ) and to plan for long-term stewardship of Amchitka as a National Wildlife Refuge under the management of the US Fish and Wildlife Service (USFWS). Performance of activities is managed within a framework of policies and procedures which assure the validity and quality of the developed data. Purpose and Scope The purpose of this manual is to provide Program policy and oversight for the maintenance of Quality Assurance (QA) and Quality Control (QC) within the Amchitka assessment program. This manual describes administrative systems, as well as specific quality control procedures, which apply to all functional groups in the program. 1.1 RESPONSIBILITIES Program Director
Establish policies & procedures Monitor training operations Monitor data collection, development, and management Host, and if necessary, initiate external audits Review final survey reports prior to release Authorize exceptions to the requirements of this manual.
Laboratory Manager
Oversee maintenance of the project Laboratory Procedures Manual Oversee modifications and maintenance of the project databases Monitor laboratory quality control to ensure compliance and sound practice Oversee training and certification for laboratory personnel Provide (where applicable) the Purchasing Section with specifications for
purchased equipment, services, materials, reagents, and chemicals Ensure inspections/tests of newly purchased items are completed to meet
established requirements Review developed laboratory data; including that received from contracted
laboratories; Review final survey reports prior to release Oversee validation, including associated record keeping, for laboratory software. Oversee interim and final disposition of samples Maintain and calibrate computer based equipment for radiometric measurements
and maintain records for these activities

3
Maintain and calibrate laboratory survey instruments Review laboratory data sheets Maintain files of original data sheets including undeveloped and developed data
until archival is requested Maintain quality and quantity of laboratory supplies and chemicals Maintain laboratory equipment in operating condition Accept and maintain chain-of-custody of samples during analysis and archival Maintain a program for checking and documenting reagent quality Maintain records of laboratory standard certification documentation Perform and/or oversee inspections/tests of newly purchased items to ensure that
established requirements are met. QA Manager
Oversee the Quality Assurance Manual Maintain files of traceable standard calibration documentation Oversee laboratory quality control procedures including cross check analysis,
duplicates, spikes, blanks, calibration, and daily analytical instrument checks Oversee maintenance of training and certification records Maintain and calibrate laboratory survey instruments Oversee validation, including associated record keeping, for laboratory software. Oversee the training and certification program for personnel Monitor administrative quality control activities to ensure compliance and sound
practice. Program Technicians
Become familiar with project procedures and duties and assist as assigned. Perform peer reviews, as requested Provide input to Project Managers regarding work process improvements
4
SECTION 2: PROCEDURES
2.1 PURPOSE Definition of calibration and analytical procedures. 2.2 RESPONSIBILITIES Laboratory Manager
Serve as the author for procedures or assign the responsibility for procedure development and testing.
Identify appropriate calibration and analytical techniques. Identify staff members to execute routine calibration and analytical procedures. Approve techniques, and criteria for equipment performance, detection limits, and
other variables. Initiate and oversee laboratory participation in external intercomparison/round
robin validation programs. Ensure documentation on calibration and analytical procedures is up-to-date.
All Staff
Complete equipment maintenance, quality assurance, and sample analysis activities as directed.
Enter acquired data into the QA maintenance logs and sample database. Perform periodic backup of electronic data. Maintain sample storage.
Administrative Assistant
Maintain analytical and QA records Assist with entry of data into the QA maintenance logs and sample database.
2.3 DEFINITIONS Minimum Detectable Activity (MDA): The amount of radionuclide, which if present in the sample, would be detected with a 5% probability of non-detection while accepting a probability of 5% of erroneously detecting that radionuclide in a blank sample. In other words, that amount of radioactive material, as measured by activity that would be detected with equal (5%) probability of errors of the first and second kind, i.e. probability of accepting false positive and probability of rejecting a true positive. Often used interchangeably with Minimum Detectable Concentration, since the difference between the two terms is only one of unit conversion.
5
2.4 PROCEDURES 2.4.1 Gamma Counting
Samples will be received as wet or frozen materials in plastic vials of approximately 120 ml.
Place sample containers (as was used for calibration using traceable standards) on either the Canberra BeGe or the Ortec Coaxial Ge detector system.
Count samples for times adequate to attain the required Minimum Detectable Activity (MDA), as predetermined by analyses considering dose/risk levels of interest, available sample sizes, and other variables.
Save and analyze spectrums as follows:
CANBERRA: 1. Save spectrum: File → Save As → select appropriate folder and enter
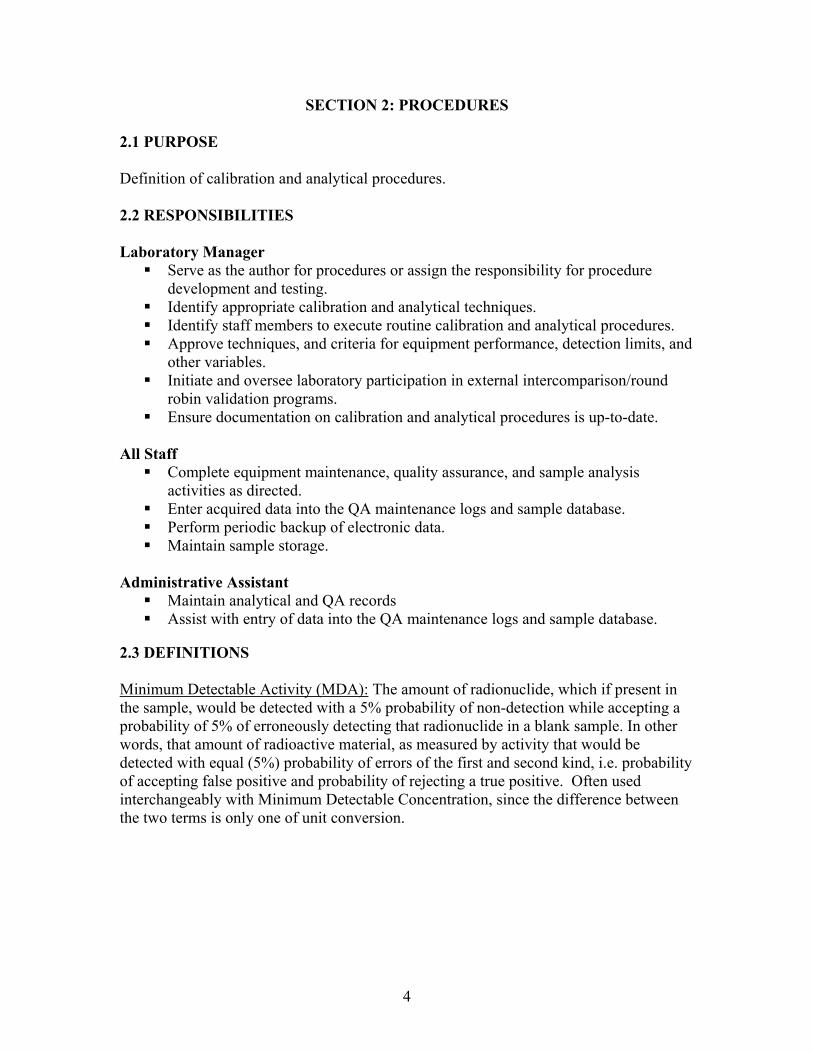
sample ID 2. Analyze the sample results. Procedure: 3. Select Edit → Sample Information.
a. Sample Title → enter sample ID in sample title. b. Sample ID → input name of .cal file used in analysis.
c. Load Cal → select appropriate .CAL file for sample (i.e. full meat.cal).

6
d. Select OK
4. Select Analyze→ Execute Sequence → Amchitka Samples (See Appendix A for procedures in creating a “Execute Sequence” file)
5. Results should now appear in the report window.
7
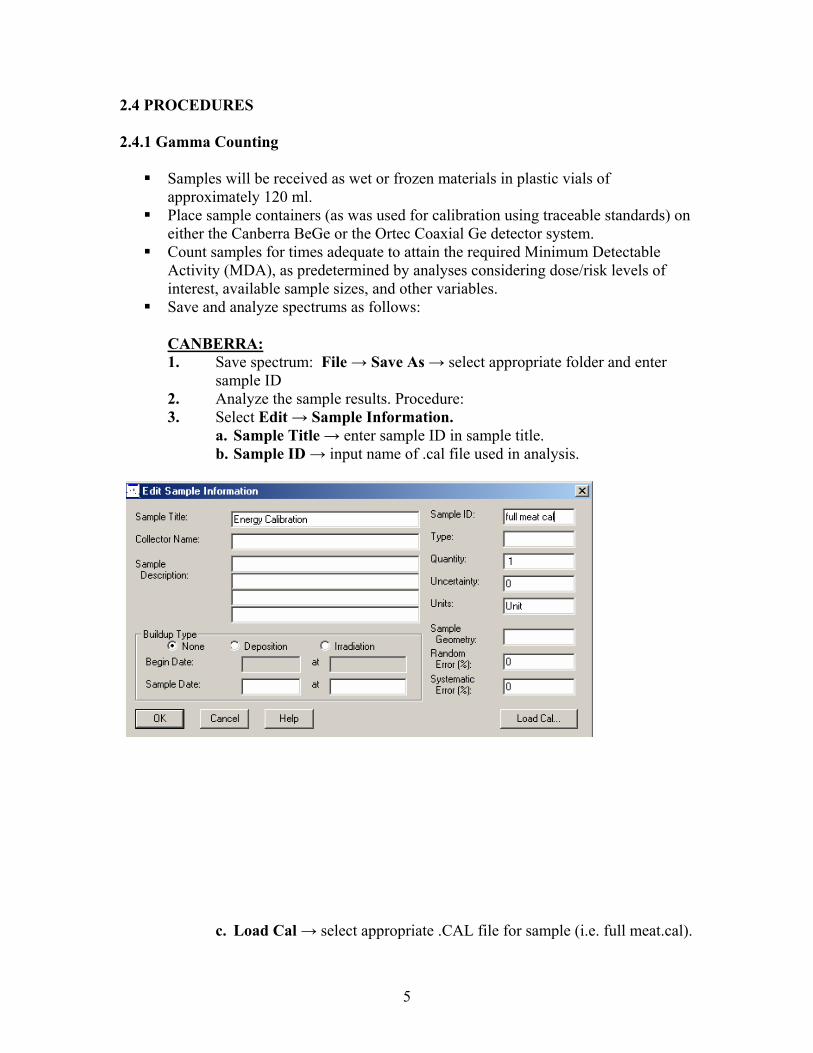
6. Select Option → Report Window → Copy Contents to Clipboard.
7. Open Notepad.exe and paste results. Save this .TXT file, named as sample
ID, in appropriate folder.

8
9
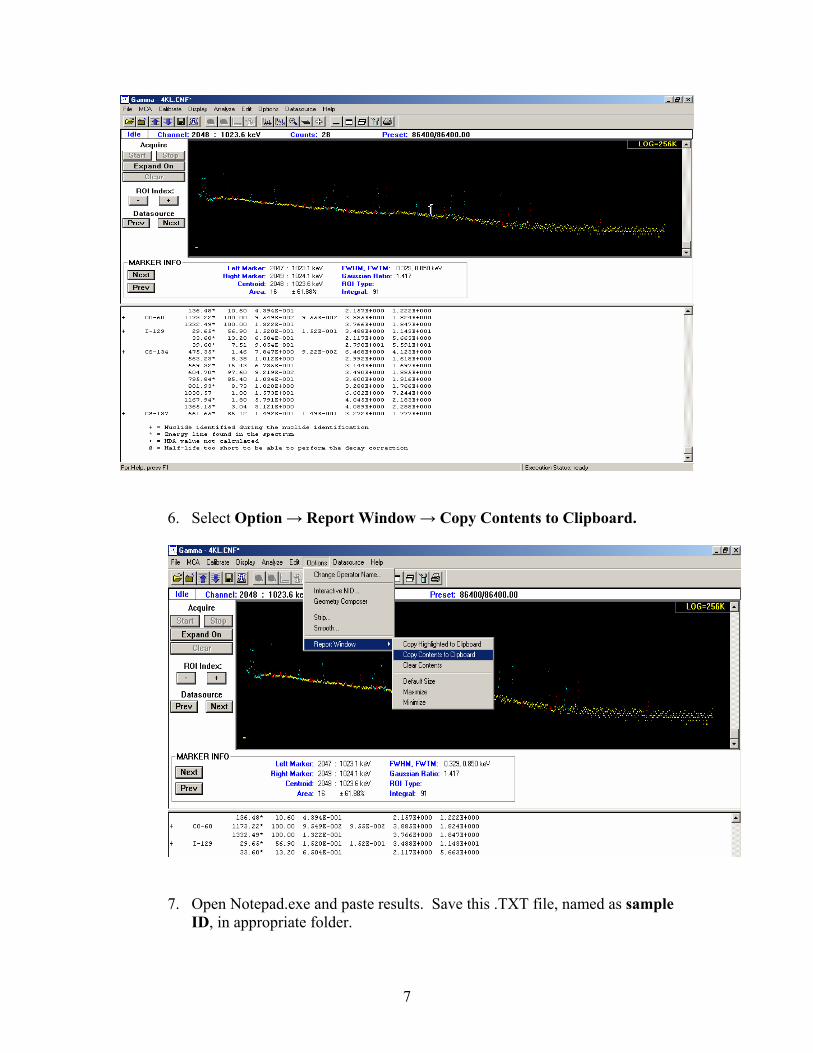
ORTEC: 1. Save spectrum: File → Save As → select appropriate folder & enter sample ID 2. Analyze the sample results. Procedure: 3. Select Analyze → Settings → Sample Type

10
a. Sample Tab: i. Browse File:
ii. Select Default.Sdf:
iii. Browse Calibration: iv. Select appropriate .Clb file (i.e. full meat.clb)

11
b. Systems Tab:
c. Decay Tab:

12
d. Report Tab:
e. Analysis Tab:

13
f. Corrections Tab:
g. Isotopes Tab:
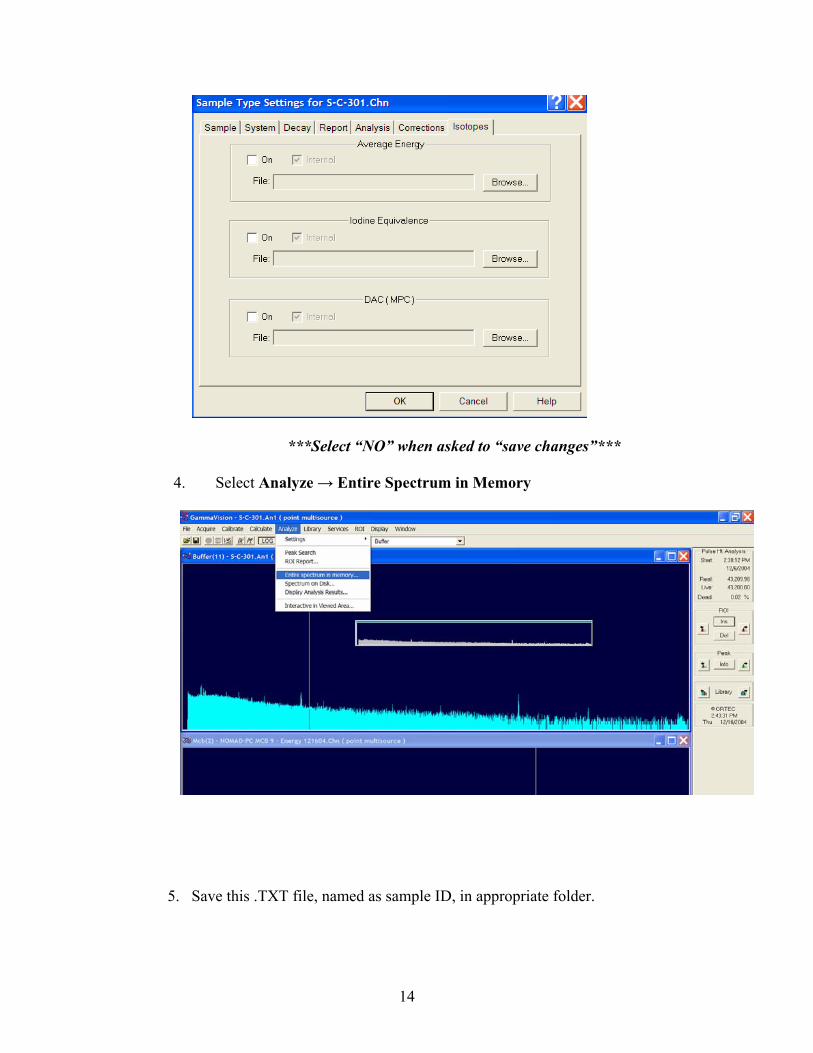
14
***Select “NO” when asked to “save changes”***
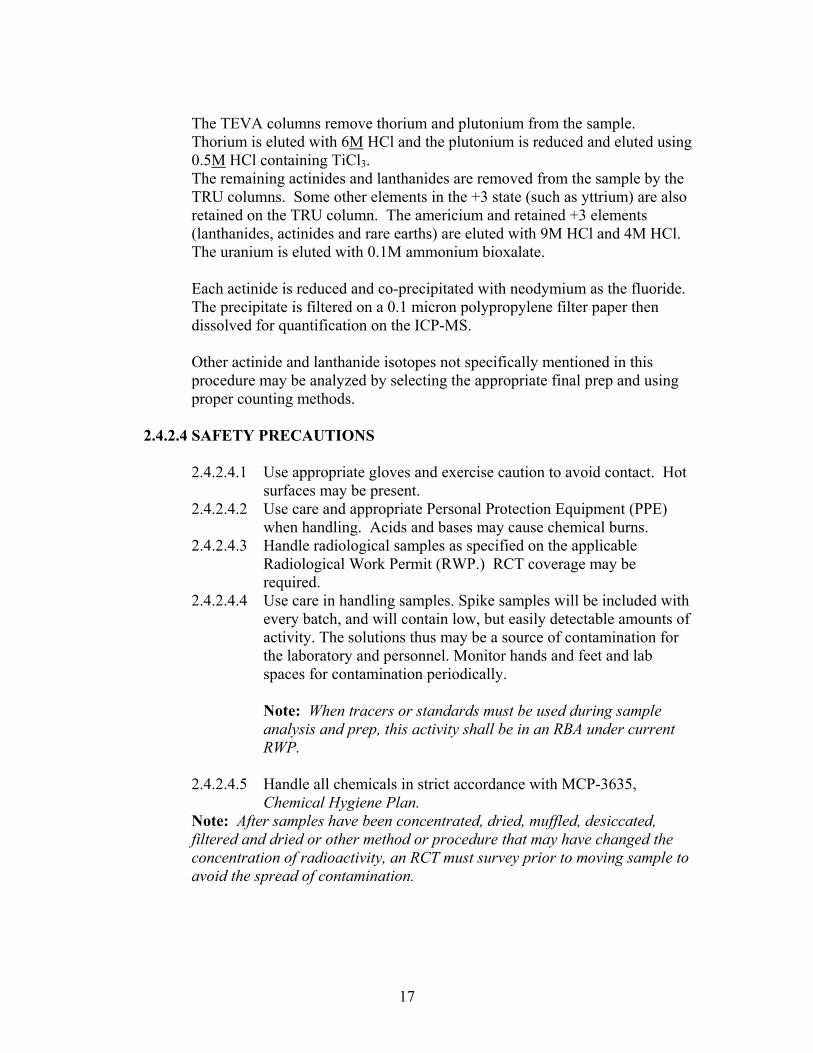
4. Select Analyze → Entire Spectrum in Memory
5. Save this .TXT file, named as sample ID, in appropriate folder.

15
The MDA in a radioactive sample is given as:
σb = standard deviation of the background counts T = counting time per sample Y = radiation yield per disintegration ε = absolute detector efficiency M = sample size (g) k = unit conversions (cts/sec to pCi, etc.)
Raw results from the detector systems will be archived electronically, with weekly backup made of all electronic records.
Samples will be maintained as described in section 5, Sample Chain of Custody. Specific results (activity levels or activity concentrations) will be entered daily
into the project reporting database.
kMYTMDA b
εσ 71.266.4 +
=

16
2.4.2 Inductively Coupled Plasma/Mass Spectrometry (ICP/MS)
MODIFIED VERSION OF INEEL METHOD ACMM-3816 2.4.2.1 ABSTRACT
A Solid Phase Extraction (SPE) technique is described for the selective separation of americium, curium, strontium, plutonium, and uranium from soil, animal and vegetation matrices. Environmental soils are dissolved and the strontium and actinides are separated from nitric acid using the SPE (TRU and TEVA) columns in a serial configuration. Sr-90 is separated by classical sulfate precipitation and then the Y-90 daughter is allowed to grow in. The actinides are co-precipitated with neodymium fluoride, mounted then dissolved for quantification by ICP-MS.
2.4.2.2 APPLICABILITY This method is designed to selectively separate strontium and actinides from environmental soil samples up to 10 grams and vegetation samples up to 120 grams in size. The samples are digested in a combination of nitric and hydrofluoric acids followed by a lithium meta-borate fussion to achieve total dissolution. Other sample matrixes and sizes may be run by this procedure. Adjustments in reagent amounts and dish/beaker sizes may be made for these samples. Section 7.1 through 7.5 may be used for initial dissolution and preconcentration and then the elements of interest may be separated by other procedures.
2.4.2.3 DISCUSSION
Dried animal tissue or vegetation samples are ashed and then treated the same as soil samples. Up to 120 grams of dry vegetation samples may be used. Actinides are separated from environmental soil samples up to 10 grams in size as well as highly radioactive soils containing mixed fission products using this method. The soils are digested in a combination of nitric and hydrofluoric acids followed by a lithium-borate fusion. The fusion cake is dissolved in dilute nitric acid and lanthanides, actinides and some strontium are concentrated with a hydroxide precipitation. The rest of the strontium is collected using a carbonate precipitation. The matrix is adjusted to 4M nitric acids and the plutonium oxidation state is adjusted to +4 using ascorbic acid and sodium nitrite. This solution is passed through one TEVA and two TRU columns stacked in tandem. The strontium passes through all the columns and is collected and purified using strontium sulfate and yttrium oxalate precipitations.
17
The TEVA columns remove thorium and plutonium from the sample. Thorium is eluted with 6M HCl and the plutonium is reduced and eluted using 0.5M HCl containing TiCl3. The remaining actinides and lanthanides are removed from the sample by the TRU columns. Some other elements in the +3 state (such as yttrium) are also retained on the TRU column. The americium and retained +3 elements (lanthanides, actinides and rare earths) are eluted with 9M HCl and 4M HCl. The uranium is eluted with 0.1M ammonium bioxalate. Each actinide is reduced and co-precipitated with neodymium as the fluoride. The precipitate is filtered on a 0.1 micron polypropylene filter paper then dissolved for quantification on the ICP-MS. Other actinide and lanthanide isotopes not specifically mentioned in this procedure may be analyzed by selecting the appropriate final prep and using proper counting methods.
2.4.2.4 SAFETY PRECAUTIONS
2.4.2.4.1 Use appropriate gloves and exercise caution to avoid contact. Hot
surfaces may be present. 2.4.2.4.2 Use care and appropriate Personal Protection Equipment (PPE)
when handling. Acids and bases may cause chemical burns. 2.4.2.4.3 Handle radiological samples as specified on the applicable
Radiological Work Permit (RWP.) RCT coverage may be required.
2.4.2.4.4 Use care in handling samples. Spike samples will be included with every batch, and will contain low, but easily detectable amounts of activity. The solutions thus may be a source of contamination for the laboratory and personnel. Monitor hands and feet and lab spaces for contamination periodically.
Note: When tracers or standards must be used during sample analysis and prep, this activity shall be in an RBA under current RWP.
2.4.2.4.5 Handle all chemicals in strict accordance with MCP-3635, Chemical Hygiene Plan.
Note: After samples have been concentrated, dried, muffled, desiccated, filtered and dried or other method or procedure that may have changed the concentration of radioactivity, an RCT must survey prior to moving sample to avoid the spread of contamination.

18
2.4.2.4.6 Use care and proper PPE to avoid contact. Ensure concentrated HF burn gel is available at the work area. Contact with concentrated HF can result in severe burns.
2.4.2.4.7 Seek more information on safety from the Material Safety Data Sheets (MSDS), laboratory supervision, and industrial Safety Personnel.
2.4.2.5 APPARATUS AND REAGENTS
2.4.2.5.1 Apparatus
0.100 µm polypropylene filters, 25 mm ICP-MS system Centrifuge with 50-mL tubes Vacuum oven Muffle furnace or vacuum oven Pipettes, Eppendorf or equivalent, assorted sizes, plus tips 250 mL Platinum (Pt) dish Polypropylene beakers, assorted sizes Pyrex beakers, assorted sizes Stirring hot plate, with stir bars TEVA extraction columns available from EIChrom Industries, Inc.
(Evanston, IL) TRU extraction columns available from EIChrom Industries, Inc.
(Evanston, IL) Vacuum manifold and filtering apparatus
2.4.2.5.2 Reagents
Acetic acid, glacial Aluminum nitrate solution (50% by weight): 500 g of Al(NO3)3 •
9H2O, per 1 L of water Ammonium bioxalate, (NH4)HC2O4, 0.1M: Dissolve 7 g of
ammonium oxalate, (NH4)2C2 O4• H2O and 3.5 g of oxalic acid (HOOCCOOH•2 H2O) in 1 L of water
Ammonium hydroxide, NH4OH 2M ammonium thiocyanate +0.1M acetic acid: 152 g of NH4SCN
in 1 L of water 0.4M ammonium thocyanate: Dissolve 30.2 g of NH4SCN in 1 L of
water Ascorbic acid solution, 10%: Prepare fresh before each use by
dissolving 1 g in 10mL of water Hydrochloric acid, HCl: • 12M: concentrated (38%) • 9M: 750mL concentrated HCl diluted to 1 L with water • 6M: 500 mL concentrated HCl diluted to 1 L with water • 4M: 330 mL concentrated HCl diluted to 1 L with water • 1M: 83 mL concentrated HCl diluted to 1 L with water

19
• 0.5M: 42 mL concentrated HCl diluted to 1 L with water
Hydrofluoric acid, concentrated HF, concentrated (49%) Lithium metaborate, LiBO2 Lithium sulfate Neodymium solution, 0.5 mg/mL: Dissolve 0.583 g of neodymium
oxide with 20mL of 4M HCl and dilute to 1 L with water Nitric acid, HNO3: • 16M: concentrated (69%) • 4M: 250mL concentrated HNO3, diluted to 1 L with water • 2.5M: 156mL concentrated HNO3, diluted to 1 L with water • 2.0M: 125mL concentrated HNO3, diluted to 1 L with water
Oxalic acid solution, 0.03M in 1M HCl: Add 83 mL of concentrated HCl to 500 mL of H2O and mix, then add 3.8 g oxalic acid (HOOCCOOH•2 H2O) and dilute to 1 L with water. Shake to dissolve the oxalic acid.
Reagent alcohol Sodium nitrite solution, 5% NaNO2: Prepare fresh before each use
by dissolving 0.5 g in 10 mL of water Sodium sulfate, Na2SO4 Strontium carrier 100 mg/mL, dissolve 30 g of strontium chloride in
100 mL of water Strontium chloride 0.1%: Dissolve 5 g of strontium chloride,
SrCl2•(6H2O), in 500 mL of water Titanium trichloride, TICl3, 20% solution, commercially available
2.4.2.6 SAMPLE HANDLING
2.4.2.5.3 Samples are assumed to arrive wet, and will be dried on site.
2.4.2.7 PROCEDURES
Note 1: Not all sections are required to be performed. Sections may be repeated as needed in support of operational flexibility. Note 2: All steps within a given section are to be performed in sequence unless other instructions are provided. 2.4.2.7.1 Sample Setup
Laboratory Analyst: Weigh soil sample (usually 10 grams) into a 250 mL Pt dish and record weight.
Weigh biota sample (up to 120 grams) into a beaker and record weight.
Ash vegetation sample in a muffle furnace at 520° C using a 1° C / minute heat-up rate.

20
2.4.2.7.2 Acid Digestion Laboratory Analyst: Transfer ashed vegetation sample to a 250-mL Pt
dish using 2M HNO3 as necessary to wash the beaker. Slowly add 2M HNO3 until the sample is wet. Slowly add concentrated HF until the sample is covered. Slowly take the samples to dryness on a hotplate. Wash down the sides of the Pt dish with 2M HNO3. Add concentrated HF until the sample is covered. Slowly take the samples to dryness on a hotplate. Wash down the sides of the Pt dish with concentrated HF until the
sample is covered. Slowly take the samples to dryness on a hotplate. Wash down the sides of the Pt dish with concentrated HNO3. Slowly take the samples to dryness on a hotplate. Wash down the sides of the Pt dish with 2M HNO3 Slowly take the samples to dryness on a hotplate. Wash down the sides of the Pt dish with 2M HNO3 Slowly take the samples to dryness on a hotplate. Can repeat above steps a couple more times if analyzing soils.
2.4.2.7.3 Fusion
Laboratory Analyst: Heat sample in a muffle furnace at 520° C for about 3 minutes.
Cool and add 9 grams of lithium meta-borate (LiBO2) Fuse the sample by heating in a muffle furn. at 1020° C. Swirl the
melt occasionally until a uniform clear melt is obtained. Let the sample cool slightly then dip outside in cool water to crackle
the solidified melt.
2.4.2.7.4 Dissolving Laboratory analyst: Put small stir bar in the Pt dish. Place the Pt dish in a 1000 mL beaker and cover the melt with about
600 mL of water Add 25 mL of concentrated HNO3. Heat on a stirring hotplate until fusion cake is dissolved. Remove the Pt dish.
2.4.2.7.5 Concentrating
Laboratory Analyst: Add 0.5 mL of 10% FeCl3 solution to sample while stirring
Slowly add 50% NaOH to sample to establish a pH of 9 to 10 while stirring. (A rust-colored precipitate should form.) Continue stirring sample for 10 minutes.
Remove the stir bar, and let the precipitate settle (usually overnight). Decant and save the solution for Sr-90 analysis. Transfer the precipitate to a 250-mL centrifuge tube with water.
21
Centrifuge and decant the solution. Combine solutions from Steps 7.5.4 and Steps 7.5.6 and save for Sr-90
analysis (SrCO3 preconcentration in procedure ACMM-3815 from INEEL).
Dissolve the precipitate with 5 mL of concentrated HNO3 and transfer solution to a 250 mL beaker and dilute to about 100 mL.
2.4.2.7.6 Actinide Separation
Laboratory Analysis: Add 20 mL of 50% Al(NO3)3•9H2O solution. Add 2 mL of 10% ascorbic acid and heat near boiling until sample
turns yellow or for 10 minutes. Remove samples from heat. Carefully add 2 mL of 5% NaNO2 and heat at or near boiling for 10
minutes. Cool to room temperature and adjust volume to 140 mL with water
before loading onto columns. Stack a TEVA with a reservoir extension above two TRU columns
with reservoirs. Make two sets for each soil sample. Condition the TEVA and TRU columns with a 7 mL of 4M HNO3. Split the soil samples into two 70 mL samples. Load the samples onto the columns. Once the samples have passed through all three columns, rinse
columns with 5 mL of 4M HNO3. Collect the load solution and the rinse for Sr-90 analysis for later use in Section 7.12.
Rinse the columns with an additional 7.5 mL of 4M HNO3. Collect the rinse as waste.
Separate the columns.
2.4.2.7.7 TEVA Columns (Pu analysis) Laboratory Analyst: Elute Thorium from TEVA columns with two 7.5
mL aliquots of 6M HCl. Collect the “Thorium fraction” as waste. Elute Plutonium from the first TEVA columns with 15 mL of 0.5M
HCl + 0.20 mL of TiCl3. (Mix the HCl and the TiCl3 just before pouring through columns.) Collect this “plutonium fraction” in centrifuge tubes and save for final precipitation and mounting for later use in Section 7.11.
2.4.2.7.8 TRU Columns (Am analysis)
Laboratory Analyst: Rinse the TRU columns twice with 7.5 mL of 4M HNO3. Collect the rinse as waste.
Elute the Americium fromt eh TRU columns with 2 mL of 9M HCl followed by 15 mL of 4M HCl. Collect this “Americium fraction” in centrifuge tubes and save for the “rare earth separations” for later use in Section 7.10.

22
2.4.2.7.9 TRU Columns (U analysis) Laboratory Analyst: After the Am is eluted, rinse only the first TRU
column with two 10-mL aliquots of 0.03M oxalic acid in 1M HCl. Collect the rinse as waste.
Elute Uranium from the TRU columns with 20 mL of 0.1M ammonium bioxalate. Collect this “Uranium Fraction” in centrifuge tubes and save for “final precipitation and mounting” for later use in Section 7.11.
2.4.2.7.10 Separation of Americium From Rare Earths
Laboratory Analyst: Combine all “americium fractions” for each sample in a beaker. (4 for soil and 2 for vegetation.)
Evaporate the samples to dryness. Dissolve the residue in 10 mL of (2M ammonium thiocyanate + 0.1M
Acetic acid) solution by gently heating. Allow the samples to cool to room temperature.
Condition the new TEVA column with 10 mL of (2M ammonium thiocyanate + 0.1M Acetic acid) solution.
Load the Sample onto the TEVA column. Add 10 mL of (2M ammonium thiocyanate + 0.1M Acetic acid)
solution to the original beakers, and heat until just boiling. Allow to cool to room temperature and load onto the TEVA column.
Wash the TEVA column with 10 mL of ( 2M ammonium thiocyanate + 0.1M Acetic acid) solution.
Elute Americium with 20 mL of ( 0.2 M ammonium thiocyanate + 0.25M HCl.) Make fresh each day by combining equal volumes of 0.4M Ammonium Thiocyanate and 0.5M HCl.) Collect the eluant in centrifuge tubes and continue with the “final precipitation and mounting.”
2.4.2.7.11 Final Precipitation and Mounting
Laboratory Analyst: For U analysis only, add 0.5 mL of TiCl3 to each tube and mix, and let stand at least 5 minutes. (Note: It is better to add an extra 0.5 mL TiCl3 to the tube than to accidentally skip one.)
For Pu analysis only, if the Ti purple color does not persist from the elution process add 0.2 mL of TiCl3, mix and let stand at least 5 minutes.
To all fractions (U, Pu, and Am) add 0.2 mL of 0.5 mg/mL Nd solution to each centrifuge tube and mix. For each soil sample, there should be two tubes for Pu, two tubes for U, and one tube for Am. For each vegetation sample, there should be one tube for Pu, one tube for U, and one tube for Am.
Add at least 5 mL of concentrated HF, and mix. Set up the filtration apparatus with a 0.1 micron polypropylene filter.
Wet the filter with reagent alcohol.
23
Filter the sample, washing first with a small amount of water and then with a small amount of reagent alcohol. (Note that the U and Pu soil samples each consist of two centrifuge tubes and that the sample in both of these centrifuge tubes should be filtered through one filter.)
Place the filter in a labeled 15-ml centrifuge tube with the ID of the sample written on it.
Dissolve contents 10 mL of 1% nitric acid. In a warm water bath, immerse the 15-mL tube to continue with the
dissolution. Remove the sample from the bath and add 20 µL of internal standard.
2.4.2.7.12 Sr-90
Laboratory Analyst: Generally, each sample will have four 50-mL centrifuge tubes containing the “Sr Fraction”. Add and dissolve 3.5 grams of Li2SO4 in each tube.
To each tube, add 0.1 mL of 100 mg/mL Sr carrier, mix and wait at least 5 minutes (A strontium sulfate precipitate will form.)
Add 3 mL aliquots of 0.1% SrCl2, mixing and waiting at least 3 minutes after each addition.
Allow to sit overnight. Centrifuge, decant and save the supernate. With the strontium sulfate precipitate, continue with the Sr-90 analysis
in ACMM-3815 Section 7.9 of INEEL procedures:
7.9 ACMM-3815 Sr-90 via Y-90
7.9.1 Laboratory Analyst : To the precipitate from Section 7.7.5, add 10 mL of 0.25 M EDTA, 5 drops of TB, vortex, and heat in a boiling water bath until the precipitate has dissolved completely. 7.9.2 Transfer the solution to the centrifuge tube containing CO3 precipitate from Section 7.8.5. 7.9.3 If the solution fades from blue during the dissolution, add 50% NaOH dropwise to the blue endpoint of the TB. 7.9.4 When all the precipitate has been dissolved, add 1 to 2 drops of 10% Fe Cl 3 and 1 to 2 drops of 50% NaOH. 7.9.5 Heat the sample in a boiling water bath for 2 to 3 minutes. (iron hydroxide precipitates and will gather any interfering actinides and about 50% of the Ra.) 7.9.6 Centrifuge the solution for 20 minutes and decant into another 50-mL centrifuge tube. (COC- Sr)
7.9.6.1 Save the iron hydroxide precipitate for possible reanalysis.
7.9.7 Swirl the solution, and add 10 mL of 10% lithium sulfate and 4 drops of bromocresol green (BCG).

24
NOTE: If the acidity of the solution is increased much further, calcium sulfate will precipitate with the strontium sulfate and might not dissolve in the limited amount of EDTA in the subsequent dissolution. If the pH of the solution is much higher than 4.0, the strontium sulfate will be precipitated incompletely. 7.9.8 Add HCl dropwise until the solution turns light blue-green.
7.9.8.1 Add three 1-mL portions of glacial acetic acid to the yellow endpoint of the bromocresol green to precipitate strontium sulfate (pH of 4).
7.9.8.2 Record this time as the start time for the 90 Y ingrowth.
7.9.9 Heat the precipitated solution in a boiling water bath for 5 minutes. 7.9.10 Centrifuge the precipitate for 12 minutes. 7.9.11 Decant the supernate. If there is any question as to the completeness of precipitation, count the supernate for Sr-85 before discarding. (COC-Sr) 7.9.12 Add 10 mL of 0.25 M EDTA, and 3 drops of thymol blue to the precipitate, vortex to suspend the precipitate, then add 50% NaOH dropwise to the blue endpoint of the indicator and vortex. 7.9.13 Place the centrifuge tube in a bath of boiling water for 5 minutes to dissolve the precipitate completely. 7.9.14 Allow to cool and then count for 300 seconds for Sr-85 to determine the strontium yield. 7.9.15 Cap the tube to prevent evaporation and set aside for at least 7 days to permit 90 Y to ingrow to at least 90% of equilibrium with the 90 Sr. 7.9.16 After 90 Y ingrowth, add l.0 mL of yttrium carrier (10mg/mL) and mix. 7.9.17 Add 5.0g of KOH. 7.9.18 Heat in a boiling water bath for 15 minutes to ensure complete precipitation of yttrium hydroxide.
7.9.18.1 Record this time as the end of the 90 Y ingrowth.
7.9.19 Centrifuge the solution for 5 minutes while still hot. 7.9.20 Decant and save the supernate for possible reanalysis. (COC-Sr) 7.9.21 Wash the precipitate with 10 mL of 0.25 M NaOH. 7.9.22 Centrifuge, decant and discard the wash. 7.9.23 Dissolve the hydroxide precipitate in 5 mL of 4 M nitric acid then vortex. NOTE: The yttrium purification steps will purify the yttrium from
25
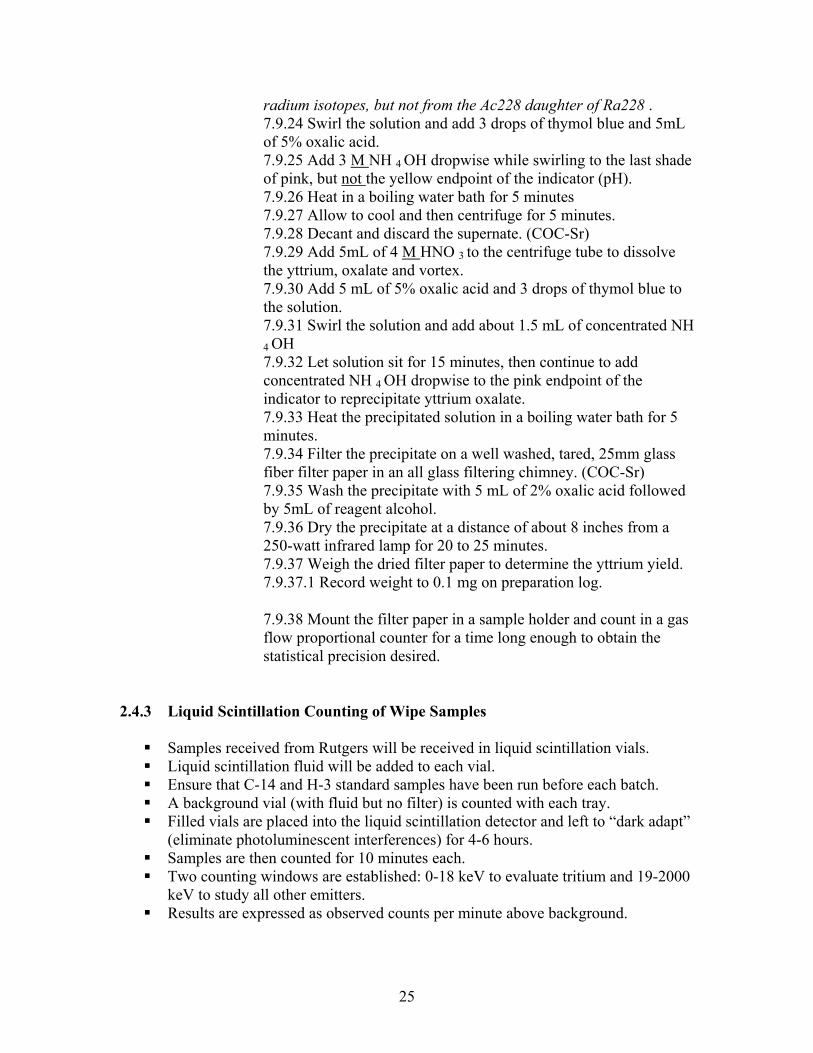
radium isotopes, but not from the Ac228 daughter of Ra228 . 7.9.24 Swirl the solution and add 3 drops of thymol blue and 5mL of 5% oxalic acid. 7.9.25 Add 3 M NH 4 OH dropwise while swirling to the last shade of pink, but not the yellow endpoint of the indicator (pH). 7.9.26 Heat in a boiling water bath for 5 minutes 7.9.27 Allow to cool and then centrifuge for 5 minutes. 7.9.28 Decant and discard the supernate. (COC-Sr) 7.9.29 Add 5mL of 4 M HNO 3 to the centrifuge tube to dissolve the yttrium, oxalate and vortex. 7.9.30 Add 5 mL of 5% oxalic acid and 3 drops of thymol blue to the solution. 7.9.31 Swirl the solution and add about 1.5 mL of concentrated NH 4 OH 7.9.32 Let solution sit for 15 minutes, then continue to add concentrated NH 4 OH dropwise to the pink endpoint of the indicator to reprecipitate yttrium oxalate. 7.9.33 Heat the precipitated solution in a boiling water bath for 5 minutes. 7.9.34 Filter the precipitate on a well washed, tared, 25mm glass fiber filter paper in an all glass filtering chimney. (COC-Sr) 7.9.35 Wash the precipitate with 5 mL of 2% oxalic acid followed by 5mL of reagent alcohol. 7.9.36 Dry the precipitate at a distance of about 8 inches from a 250-watt infrared lamp for 20 to 25 minutes. 7.9.37 Weigh the dried filter paper to determine the yttrium yield. 7.9.37.1 Record weight to 0.1 mg on preparation log.
7.9.38 Mount the filter paper in a sample holder and count in a gas flow proportional counter for a time long enough to obtain the statistical precision desired.
2.4.3 Liquid Scintillation Counting of Wipe Samples
Samples received from Rutgers will be received in liquid scintillation vials. Liquid scintillation fluid will be added to each vial. Ensure that C-14 and H-3 standard samples have been run before each batch. A background vial (with fluid but no filter) is counted with each tray. Filled vials are placed into the liquid scintillation detector and left to “dark adapt”
(eliminate photoluminescent interferences) for 4-6 hours. Samples are then counted for 10 minutes each. Two counting windows are established: 0-18 keV to evaluate tritium and 19-2000
keV to study all other emitters. Results are expressed as observed counts per minute above background.
26
If any positive counts are seen in the upper window, recounts with longer count times and more specific energy windows may be performed to further evaluate the identity and level of any emitter.
2.5 QUALITY CONTROL REQUIREMENTS
2.5.1 Analyze a blank with each batch. Blank values are used during calculations for accurate results.
2.5.2 Analyze a control sample with each batch. Repeat any control that is beyond 20% of known values or beyond the acceptance criteria specified by the customer.
2.5.3 Analyze any additional QC samples as required by project requirements.
2.6 RECORDS
2.6.1 Samples, upon arrival, will be logged in the Samples Logbook. The Chain-of-Custody form will be faxed to inform the sender of their condition/delivery.
2.6.2 Notes on sample preparation will be included in the Samples Logbook.
2.7 REFERENCES
Determination of Selected Actinides and Sr-90 in Soil and Vegetation, Idaho National Engineering and Environmental Laboratory, ACMM-3804.
MODIFIED VERSION OF INEEL METHOD ACMM-3705 (Tc-99) ABSTRACT
Technetium is “trapped” on an Eichrom TEVA® resin to preconcentrate this analyte and to remove potential interferences. To do this from a biological sample, the sample is first treated with ammonia to stabilize the analyte, dried at 65°C (<75°C) to remove water and limit analyte loss, and finally ashed at 550°C to remove organic matter. The ash is then treated with 8 N nitric acid (HNO3) and hydrogen peroxide to oxidize and extract the 99Tc. The leachate is diluted to < 0.5 N HNO3 and the 99Tc concentrated on an Eichrom TEVA® resin. The 99Tc is eluted with 8 N HNO3 and the 99Tc determined by inductively coupled plasma mass spectrometry (ICPMS). Rhenium (Re) is used as a recovery (yield) standard because it is not radioactive, has been shown to behave chemically similar to Tc and can be determined simultaneously with the 99Tc.
APPLICABILITY
This procedure describes the basic steps necessary to determine Technetium-99 (99Tc) in biological matrices including plant and animal tissue.

27
This method is a relatively simple, effective and, depending upon the initial sample size, sensitive method to determine trace 99Tc in biological matrices. The method can also be used with other types of samples including waters and soils, but the recoveries have not been specifically verified. The method avoids some if the interferences encountered in standard radiochemical counting methods and eliminates the need to perform a separate count for a radioactive Tc tracer.
DISCUSSION
The Eichrom TEVA® resin is a liquid stationary phase consisting of a quanternary amine on a solid support. Technetium is “trapped” on an Eichrom TEVA® resin to preconcentrate this analyte and to remove potential interferences. To do this from a biological sample, the sample is first treated with ammonia to stabilize the analyte, dried at 65°C (<75°C) to remove water and limit analyte loss, and finally ashed at 550°C to remove organic matter. The ash is then treated with 8 N nitric acid (HNO3) and hydrogen peroxide to oxidize and extract the 99Tc. The leachate is diluted to < 0.5 N HNO3 and the 99Tc concentrated on an Eichrom TEVA® resin. The column is rinsed with 1 N HNO3 to remove interferences. The 99Tc is then eluted with 8 N HNO3 and the 99Tc determined by inductively coupled plasma mass spectrometry (ICPMS). Rhenium (Re) is spiked onto the samples in the very first step and is used as a recovery (yield) standard because it is not radioactive, has been shown to behave chemically similar to Tc and can be determined simultaneously with the 99Tc.
The most probable interferences are molybdenum hydride (99Mo1H) and Ruthenium (Ru) at m/z 99. The relative abundances for Ru at m/z 99 and m/z 101 are 12.6% and 17%, respectively. The Ru interference can be corrected for by estimating the contribution of Ru at m/z 99 from the Ru response at m/z 101 (17% abundance) and subtracting it from the m/z 99 response. The probability of a significant interference by MoH is not likely but can be the possibility of having this interference can be determined by monitoring Mo at m/z 95 and/or Mo at m/z 98.
Tungsten hydrides (184W1H and 186W1H) and 187Os may interfere with the Re measurements. Tungsten at m/z 182 can be monitored to assess the probability of a significant WH interference. An interelement correction for Os can be made using the Os response at m/z 189.
The W, Os, Mo and Ru interferences should be largely removed during the extraction and preconcentration of 99Tc and Re on the TEVA® resin.
With seaweed samples, a variation of this method gave >90% recovery of 99Tc and Re and it was determined that Re was a good chemical recovery (“yield”) standard for 99Tc (Tagami 2003, Mas). A variation reported 80-90% recovery for biota and 50-70% for sediment3. Recovery of 99Tc from soils was also adequate using a slightly different variation of this method without the Re (Tagami 2000). It does appear that Re behaves similarly to Tc in the environment (Wakoff). In

28
general, Tc and Re are trapped efficiently on the TEVA at very low HNO3 concentrations. Poor chemical recoveries are due mostly to the actual sample matrix. Therefore, one should expect to correct for all bias with the Re recovery. In a recent test, Re and 99Tc recoveries were 80+% with 10 g wet weight and somewhat less with samples as large as 25g. However with correction by the Re, the 99Tc was 97±4% for all samples. Possible under estimation of 99Tc may result from Re actually in the sample. Generally, Re is <1-2% of the Re tracer added to the sample.
SAFETY PRECAUTIONS
Chemical Handling
Handling of acids and bases and chemical vapors generated from these chemicals is a safety consideration in this procedure. Handle all chemicals will be handled per MCP-3635, “Chemical Hygiene Plan.” Use proper personal protective equipment (PPE) per PRD-5121, “Personal Protective Equipment.” At a minimum wear PPE consisting of safety glasses with side shields, nitrile gloves, and any additional PPE specified by the RWP, RCT or IH. Handle all the acids and bases in this procedure in a ventilation hood. Obtain more safety information on specific chemicals can be obtained, as needed, from MSDS sheets (available on the INEEL intranet), laboratory supervision, and industrial safety personnel. MSDS sheets can be found on the INEEL intranet.
Handle chemical spills in accordance with Appendix A of MCP-3635, “Chemical Hygiene Plan”.
Avoid contact with hot surfaces on hot plates and heating blocks. Use care when removing beakers from hot plate. Use heat resistant gloves as appropriate, particularly when using the muffle furnace. Handle samples in hot crucibles with crucible tongs as appropriate.
99Tc - Radioactive Materials and Sample Hazards
In general no radioactive samples are anticipated, as the major intent of this procedure is to determine 99Tc at near environmental levels in biological samples. However, broader application of the procedure might imply its use for samples determined to be radioactive. For radioactive samples, perform all work under an applicable Radiological Work Permit (RWP) for the area (see MCP-7, “Radiological Work Permit”). Perform all radiological work in a bench top work area, a radioactive fume hood, glove box, or hot cell as per the hazard index and the requirements and instructions listed on the RWP. Obtain RCT support as necessary when preparing 99Tc solutions or when performing sample spiking with 99Tc.
29
Waste Disposition Handle all waste generated from the performance of this method as directed by Waste Generator Services.
APPARATUS AND REAGENTS
Apparatus
Porcelain (or Pt or quartz) crucibles (50 mL)
Analytical balance, with at least 0.01 g readability, calibrated by the INEEL S&CL
15 mL graduated polyethylene vials 50 mL graduated polyethylene vials Beakers, various sizes Watch glasses, preferably Teflon®
Mechanical pipettors and associated tips, various sizes 250 mL polyethylene bottles 10 and 50 mL polyethylene syringes 0.45 and 1 µm Acrodisc CR syringe filters or equivalent Oven Furnace Hot plate TEVA® extraction columns or cartridges available from Eichrom Technologies, Inc. (Evanston, IL) Inductively Coupled Plasma Mass Spectrometer Reagents Deionized water Nitric Acid (15.7 N) – concentrated
Nitric Acid (1 N)
Nitric Acid (8 N)
Nitric Acid (0.1 N)
30% Hydrogen Peroxide
Rhenium stock solution (ideally 185Re) – 200 ng/mL in 0.1 N HNO3
99Tc stock solution –10 ng/mL in 0.1 N HNO3 (0.17 nCi/mL = 170 pCi/mL = 6.29 Bq/mL = 377 DPM/mL) – 1-2 mL should be enough to run 10-20 batches
NOTE: A 185Re enriched standard is preferred in order to compensate for any natural Re in the sample via an isotope dilution determination of Re.

30
Indium stock solution – 100 ng/mL in 0.1 N HNO3
Ammonia solution (20% NH3)
ICP-MS Calibration Standards: Prepare 50-mL volumes in 0.1 N HNO3, including a blank and four different concentration levels for 99Tc and Re. Standards should be prepared fresh at least on a monthly basis. Examples are given below.
Std0 = 1 ng/mL In
Std1 = 1 ng/mL In, 0.5 ng/mL Mo, 0.5 ng/mL Os and 0.5 ng/mL Ru.
NOTE: Std1 can be used to standardize the instrument to determine the interference concentration levels or simply to verify that the “interelement corrections” from 7.4.2 are good.
Std2 = 1 ng/mL In, 1 ng/mL Re, 100 pg/mL 99Tc (1.7 pCi/mL = 6.29x10⁻² Bq/mL = 3.77 dpm/mL).
Std3 = 1 ng/mL In, 2 ng/mL Re, 200 pg/mL 99Tc (3.4 pCi/mL = 0.126 Bq/mL = 7.55 dpm/mL).
Std4 = 1 ng/mL In, 3 ng/mL Re, 300 pg/mL 99Tc (5.1 pCi/mL = 0.189 Bq/mL = 11.3 dpm/mL).
Std5 = 1 ng/mL In, 4 ng/mL Re, 400 pg/mL 99Tc (6.8 pCi/mL = 0.252 Bq/mL = 15.1 dpm/ml).
ICP-MS Calibration Verification Standard, 1 ng/mL In, 2 ng/mL Re, and 0.1 ng/mL 99Tc: Prepare 50-mL volume in 0.1 N HNO3 from independent stock solutions if possible. Standards should be prepared fresh at least on a monthly basis.
After analyses are complete, bring final solution to pH neutrality. SAMPLE HANDLING
Biological samples
Should remain frozen or refrigerated until use.
31
PROCEDURES
Sample Preparation
Record crucible mass.
Weigh wet sample into the tared crucible (<25 g wet weight) and record the sample mass.
Using Re as a recovery standard add 100 µL of a 200 ng/mL stock to every sample (i.e. 20 ng of Re-would prefer to have 185Re enriched standard to compensate for any natural Re in the sample via an isotope dilution determination of Re).
NOTE: Re needs to be added to every sample at this point in order to correct for losses that occur during the procedure.
For 99Tc-spiked samples add 100 µL of a 10 ng/mL standard (corresponds to addition of 1 ng or 17 pCi of 99Tc).
NOTE: At least one blank sample and one duplicate sample (if available) or a set of duplicates (if available) is spiked with 99Tc for each batch of samples prepared. Simple fortified blanks will not work (i.e. no sample matrix) as losses of 99Tc and Re are excessive.
Add 10 mL or enough to wet the sample of 20% ammonia solution as an analyte retention/ashing aid and mix with sample.
Dry at <75°C for 24 hr or until mass is stable.
NOTE: If time is an issue, the drying temperature can go as high as 110°C with little or no effect (Tagami 2003).
Cool and record mass of the crucible with the now dried sample.
Place sample into an oven/furnace at <250°C and raise the temperature to 550°C and “ash” for 3 hr.
Cool and record mass of the crucible with the ashed sample.
Add 10 mL of 8 N HNO3, 2.5 mL of 30% H2O2 directly to the crucible and heat at <75°C for 3 hr under reflux conditions (i.e. covered with watchglass).
Cool, decant and filter with a syringe through a 0.45 µm Acrodisk CR filter into a 250 mL polypropylene bottle.
IF filtering is difficult, THEN stack a 1-µm Acrodisk CR filter with the 0.45-µm Acrodisk CR filter for ease of filtering.

32
IF filtering of plant samples is difficult due to the presence of micro particulates, THEN use vacuum filter units employing 0.45-µm pore size filter membranes as necessary.
Rinse remaining solids at least 2 times with aliquots of deionized water, decanting and filtering the solution through the 0.45 µm Acrodisk CR filter into the 250 mL polypropylene bottle.
Dilute to >200 mL with deionized water.
Eichrom TEVA Cartridge/Column Preparation
Precondition with 5 mL of 8 N HNO3 and discard the solution.
Follow with 10 mL of 0.1 N HNO3 and discard the solution.
Eichrom TEVA Column Separation and final dilution
Load sample from 7.1.13 onto the TEVA column/cartridge at an average flow rate of between 1 and 1.5 mL/min.
NOTE: The 99Tc and Re will be retained on the column/cartridge.
If necessary to achieve a reasonable flow rate then use a pump or the vacuum box to achieve this flow rate with the cartridges or substitute 2 mL columns with larger particles for sufficient gravity flow.
Discard the liquid.
Wash (to remove Mo, Ru and W) with 20 mL of 1 N HNO3. The analytes are retained on the column, so the liquid coming through the column is discarded.
NOTE: Larger concentrations of HNO3 may preelute some of the 99Tc and Re with the contaminants.
Elute the 99Tc and Re with 5+ mL of 8 N HNO3 into a 15 mL graduated polyethylene tube or directly into the beaker to be used for evaporation.
Spike with 100 µL of 100 ng In/mL to be used as an internal standard.
Evaporate to near dryness at <75°C on a hot plate (because 8 N HNO3 should not be aspirated directly into the ICP-MS).

33
NOTE: Keeping the temperature <75°C will minimize the probability of any losses or differential losses due to the volatility of Tc and Re as HTcO4 and HReO4.
Dilute to with 0.1 N HNO3, transfer to a 15 mL graduated polyethylene tube and dilute to 10 mL with 0.1 N HNO3. The resulting solution should be 0.1+ N HNO3 (i.e. ≅ 1% HNO3).
After analyses are complete, bring final solution to pH neutrality.
ICP-MS Instrument Setup
Use the following masses 95Mo (15.9%), 98Mo (24.1%, 1.9% Ru), 99Tc, 101Ru (17%), 102Ru (31.6%, optional line to confirm Ru interference potential), 115In (95.7%), 118Sn (24.2%), 185Re (37.4%), 187Re (62.6%), 182W (26.3%) and 189Os (16.1).
Interelement corrections include • 99Tc = 99Tc – 0.747 * 101Ru
• 115In = 115In – 0.0140 * 118Sn
• 187Re = 187Re – 0.0994 * 189Os
• 98Mo = 98Mo – 0.112 * 101Ru
• 102Ru = 102Ru – 0.0448 * 105Pd (optional)
Tune ICP-MS using manufacturer specification.
Make three replicate determinations per analysis with a total acquisition time of three minutes per sample, assuming an uptake rate of ≤1 mL/minute.
Analysis steps
Calibrate using the standards in 7.4.4.1-7.4.4.6 and verify that the R2 for 99Tc and Re is greater than 0.99.
NOTE: Std1 can be used to standardize the instrument to determine the interference concentration levels or simply to verify that the “interelement corrections” from 7.4.2 are good.
Analyze the blank (Std0).

34
Analyze the calibration verification solution.
IF the blank and calibration verification are not acceptable (e.g blank <1 pg/mL and calibration verification ±10%), THEN repeat 7.4.5.1 through 7.4.5.3.
IF the blank and calibration verification are acceptable (e.g blank <1 pg/mL and calibration verification ±10%), THEN run five samples.
Repeat 7.4.5.2 through 7.4.5.5 until all samples have been analyzed ending the analysis sequence with a successful blank and calibration verification.
Perform instrument shutdown, maintenance and troubleshooting, as necessary, per guidance in the ICPMS vendor-supplied literature.
QUALITY CONTROL REQUIREMENTS
Since this is a destructive analysis, the actions to be taken should a QC sample result fall outside of the expected range may be limited. Repeating the instrumental analysis may be possible if enough solution remains, but repeating the sample preparation may not be possible due to limited sample availability. Specific actions must be discussed with and agreed to by the requestor.
At a minimum prepare one 99Tc spiked sample preparation for every 20 samples if there is enough sample. As previously noted, the 99Tc recovery can vary widely however, after correction with the Re recovery the 99Tc should be in the range of 100±20% or other value specified by the requestor.
At a minimum prepare one duplicate sample preparation for every 20 samples if there is enough sample to do so. Sample homogeneity and concentration level may affect the results, however in general, duplicate samples should be within ±20% or a values specified by the requestor.
At a minimum prepare one blank sample preparation (i.e. a blank reference material) for every 20 samples. These should be non-detects.
NOTE: Simple reagent blanks generally exhibit high losses of Tc and Re so the blank reference material should be some type of material closely related to the sample material.
At a minimum prepare one 99Tc spiked blank sample preparation (i.e. spike a blank reference material) for every 20 samples. The 99Tc recovery can
35
vary widely however, after correction with the Re recovery should be in the range of 100±20%.
NOTE: Simple reagent blanks generally exhibit high losses of Tc and Re so the blank reference material should be some type of material closely related to the sample material.
CALCULATIONS
Useful conversions and factors: 99Tc activity = 0.017 Ci/g
1 Bq = 2.7x10⁻¹¹ Ci = 27 pCi.
Dry weight % = %DW = 100*Wdry/Wwet
Ash content %= %DW * Wash/Wdry
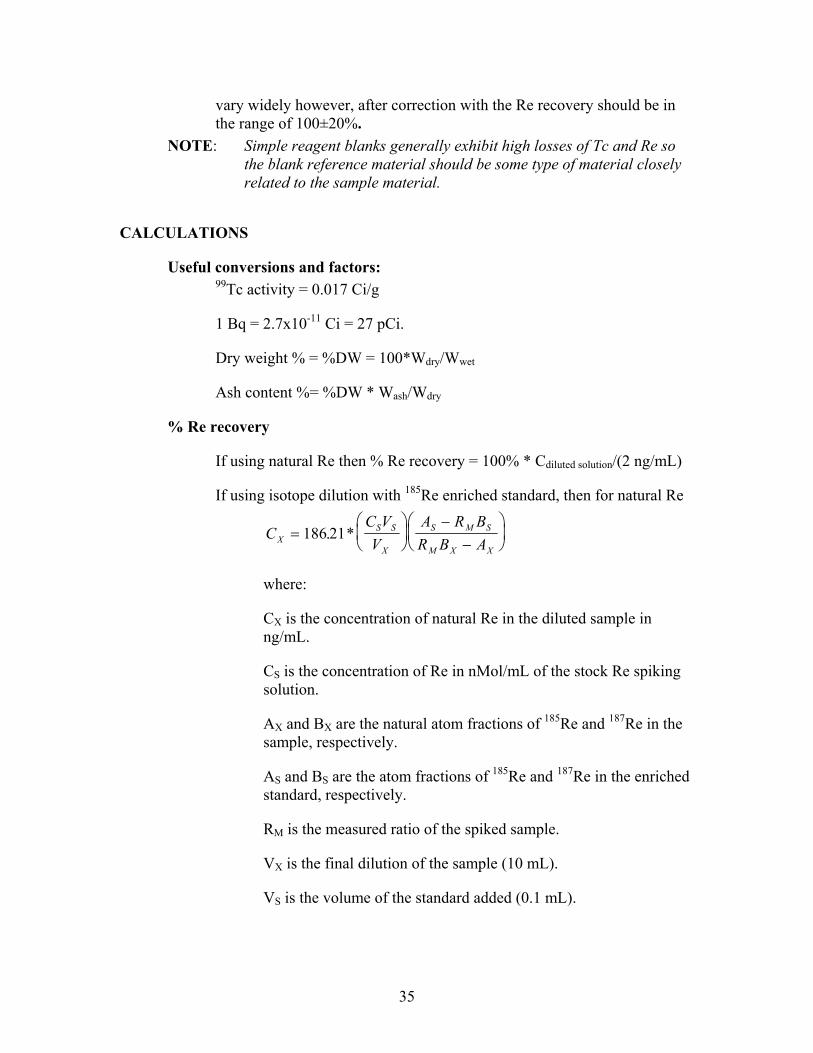
% Re recovery
If using natural Re then % Re recovery = 100% * Cdiluted solution/(2 ng/mL)
If using isotope dilution with 185Re enriched standard, then for natural Re
CC VV
A R BR B AX
S S
X
S M S
M X X=
−−
186 21. *
where:
CX is the concentration of natural Re in the diluted sample in ng/mL.
CS is the concentration of Re in nMol/mL of the stock Re spiking solution.
AX and BX are the natural atom fractions of 185Re and 187Re in the sample, respectively.
AS and BS are the atom fractions of 185Re and 187Re in the enriched standard, respectively.
RM is the measured ratio of the spiked sample.
VX is the final dilution of the sample (10 mL).
VS is the volume of the standard added (0.1 mL).

36
After solving for Cx, the contribution of the natural Re at m/z 185 is subtracted from the response at m/z 185 to determine the concentration of the 185Re enriched spike from a calibration curve. Once the concentration of the Re spike has been determined, use equation in 9.2.1.
For 99Tc
pg Tc g CC V
WTc wetTc X
wet
99 = =−
*
pCi Tc g AC V
WTc wetTc X
wet
99 0 0170= =−
** .
pCi Tc g AA
Tc wet correctedTc wet
rec
99 = =− −−
% Re
where:
CTc-wet is the dry weight 99Tc concentration.
ATc-wet is the dry weight 99Tc activity.
CTc is the 99Tc concentration in the final dilution (pg/mL).
VX is the final dilution volume in mL (10 mL).
Wwet is the dry weight used in the analysis.
0.0170 is the activity of 99Tc in pCi/pg.
Values are adjusted for “yield” by dividing by the % Re recovery.
Total uncertainty Total uncertainty is a term that is inclusive of all of the sources of error in the analysis. For the determination of 99Tc in this procedure, this will include the uncertainty of the 3 determinations of the 99Tc and Re intensities and the uncertainty associated with the instrument variability over time.
[ ]TotalUncert Tc RSD RSD RSDcorrected Tc CalibrationChecks. Re= ⋅ + +99 2 2 299
Where RSD is the relative standard deviation of the various measurements
and RSDsx
=

37
Detection limits Detection limits will be dependant upon the Ru in the sample which adversely affects the precision of the 99Tc measurement at m/z 99. Therefore, the detection limits are determined on a sample by sample basis by multiplying the 99Tc standard deviation or total uncertainty from the 3 replicates by the single-sided Student t value at p=0.01 for 2 degrees of freedom or 6.965.
REFERENCES
Tagami, K.; Uchida, S., 2003, "Pretreatment of plant samples for the
determination of Re by ICP-MS," Journal of Radioanalytical and Nuclear Chemistry, Vol. 255, 547-551.
Mas, J. L.; Tagami, K.; Uchida, S., 2004, "Method for the detection of Tc in seaweed samples coupling the use of Re as a chemical tracer and isotope dilution inductively coupled plasma mass spectrometry," Analytica Chimica Acta, Vol. 509, 83-88.
McCartney, M.; Rajendran, K.; Olive, V.; Busby, R. G.; McDonald, P., 1999, "Development of a novel method for the determination of Tc-99 in environmental samples by ICP-MS," Journal of Analytical Atomic Spectrometry, Vol. 14, 1849-1852.
Tagami, K.; Uchida, S.; Hamilton, T.; Robison, W., 2000, "Measurement of technetium-99 in Marshall Islands soil samples by ICP-MS," Applied Radiation and Isotopes, Vol. 53, 75-79.
Wakoff, B.; Nagy, K. L., 2004, "Perrhenate uptake by iron and aluminum oxyhydroxides: An analogue for pertechnetate incorporation in Hanford waste tank sludges," Environmental Science & Technology, Vol. 38, 1765-1771.
MCP-7,“Radiological Work Permit”
MCP-3635,“Chemical Hygiene Plan”
PRD-5121,“Personnal Protective Equipment”
MCP-3562,“Hazard Identification, Analysis and Control of Operational Activities”

38
SECTION 3: TRAINING
3.1 PURPOSE Training is provided to ensure that employees develop and maintain the skills needed to perform their duties and responsibilities. 3.2 RESPONSIBILITIES Project Manager
Approve and oversee procedures or assign the responsibility for procedure development and testing.
Laboratory Manager
Serve as the author for procedures or assign the responsibility for procedure development and testing.
Identify procedures for which training, proficiency testing, refresher training, and recertification are required.
Identify staff members required to complete training and proficiency testing. Approve proficiency testing criteria. Establish and maintain training database. Ensure training documentation is up-to-date.
All Staff
Complete training and proficiency testing as directed. Enter training documentation into the training database.
Administrative Assistant
Maintain training and certification records. Assist with entry of training documentation into the training database.
3.3 DEFINITIONS Certification: Documentation indicating completion of training and/or proficiency testing. Developmental Training: Training that is not required but is performed to enhance the individuals professional development and may be part of the Individual Performance Plan. On-the-job Training: Training related to controlled procedures, provided by staff members. Proficiency testing: Demonstration of the ability to perform procedure steps independently and meet specified criteria for results. Procedures for which proficiency testing is required, and acceptance criteria are identified by the cognizant Manager.
39
Recertification: Periodic update to previous proficiency testing to ensure skill level is maintained and instruction on new information and lessons learned related to the procedure are shared. Recertification is required annually, within a year and one month of the previous certification. Refresher training: Periodic update to previous training which does not include proficiency testing. Training: Instruction regarding a new or revised procedure provided by the procedure author or another individual who has demonstrated proficiency. 3.4 PROCEDURES Training types and documentation requirements
Reading and understanding procedures Required for all new and revised procedures; Some procedures or procedure revisions require only reading the procedure and
requesting clarification from the author for the individual to be able to implement the procedure requirements.
Documentation of completion is maintained in the employee training files.
Procedure training The cognizant Manager determines which procedures require training is and
which staff members are required to complete training. The procedure author, or another person who has demonstrated knowledge of the
procedure, provides training. The author’s certification is approved by the supervisor by virtue of the knowledge gained during procedure development and testing.
Documentation of completion is maintained in the employee training files. The need for refresher training, and the content, is determined by the cognizant
manager.
Proficiency testing The cognizant manager determines which procedures require proficiency testing
and which staff members are required to complete proficiency testing. The procedure author, or another person who has demonstrated knowledge of the
procedure, provides training. The trainer’s certification is approved by the supervisor by virtue of the knowledge gained during procedure development and testing.
Recertification of proficiency testing must be updated annually for all staff responsible for performing the procedure.
Documentation of completion is maintained in the employee training files.
Documentation

40
When training or recertification has been performed on a specific procedure for an individual by the laboratory manager or his/her designee, documentation of the satisfactory completion of the training shall be maintained in a notebook, showing the name of the trainee, the person supervising the training or recertification, the name of the procedure (as identified in the official Procedures Manual), and the date.
When a procedure is performed in the laboratory, the person performing the procedure and the date shall be clearly noted in the program files. Only persons whose training or recertification on that procedure has been performed in the last year shall perform those procedures.

41
SECTION 4: INSTRUMENT QUALITY CONTROL
4.1 PURPOSE The identification, calibration frequencies, and responsibilities for instrumentation are provided in this section. 4.2 RESPONSIBILITIES Laboratory Manager
Identify parameters to be measured. Establish acceptable performance criteria. Ensure documentation is maintained Perform reviews of performance documentation and work with managers to
initiate corrective actions, as appropriate. Laboratory Staff
Record performance data and compare it to established criteria. Field Site Coordinators are responsible for assuring implementation of these
requirements on survey sites. 4.3 INSTRUMENT IDENTIFICATION New equipment and instrumentation items are uniquely identified upon receipt to allow for independent traceability. 4.4 CALIBRATION AND OPERATIONAL REQUIREMENTS - STANDARDS Calibrations are based on standards traceable to the National Institute of Standards and Technology (NIST). If NIST-traceable standards are unavailable or prohibitively expensive, standards of an industry-recognized organization may be used. 4.5 CALIBRATION AND OPERATIONAL REQUIREMENTS - EQUIPMENT 4.5.1 Gamma Spectroscopy 4.5.1.1 Applicable instrumentation
Fixed Ge Gamma Spectrometer - Canberra Broad Energy Ge (BEGe) detector. Portable Ge Gamma Spectrometer – Ortec GEM Series Coaxial HPGe detector.
4.5.1.2 Calibration of Laboratory Instrumentation
The Laboratory Manager establishes operational parameters to be monitored for laboratory instrumentation, and determines appropriate methods and frequencies for its monitoring.
Calibration procedures are performed according to the methods defined in the Procedures Section.

42
Calibration documentation is reviewed and approved by the Laboratory Manager prior to the next use of the instrument.
Items sent to a manufacturer for calibration have an operational check performed before usage to ensure no damage occurred during shipment.
Initial calibration of instrumentation is performed as part of the set up. Recalibration of laboratory instrumentation is performed when control charts,
extensive repairs, or relocation of instrumentation may invalidate earlier calibration data.
4.5.1.3 Operational Checks 4.5.1.3.1 Background count
A background count is acquired by counting the empty detector. Background counts are performed weekly. Procedure for the Canberra/ Genie detector: • From the Gamma Acquisitions and analysis window:
o Select File → Open Datasource → mark Detector→ select DET01→ select open→ select MCA→ clear → data → select MCA → select Acquire Setup → mark Live time and type in the time needed to count in seconds (usually 1000 for energy counts and 50400 for 14 hour background counts.)→ select OK → select MCA → Acquire Start. Allow count to finish.
o Select Analyze→ Peak Locate→ 2. User Specified→ select Use ROI file → Select → expand folder Camfiles → Genie 2K folder→ Amchitka folder → Bkgds or Energy Cal folder depending on which you are reporting→ select appropriate background or energy ROI in one of these folders → Select → Execute → Analyze → c. Peak Area → 1. Sum Non-linear (make sure the “generate report” is checked) → Execute
o Data should now appear in the report window. o Save file in the appropriate background (Bkgds) or Energy Cal folder:
Background should be saved by count time, Bkgrd as the identity, and the numerical date similar to the following: (example for June 1, 2004) 14hrBkgrd060104. Data should be plotted on the appropriate excel chart according to the 352, 511, 609, and 1460 keV Net peak areas.
Energy report should be saved by Energy identity and the numerical date similar to the following: (example for June 1, 2004) Energy060104. Data should be plotted on an excel chart according to the Cs-137 (662keV) Net Peak area and FWHM.
• Procedure for the Ortec/ Maestro detector: Select the GammaVision Icon to open the window:
o Make sure the tool bar reads the 0001MCB9 label not Buffer. o If checking energy efficiency, place the check source on the appropriate
holder, face up under the “down looking” detector. Close door completely.

43
o If doing a background count, make sure the source is removed and the door is shut completely.
o Select Acquire → MCB Properties → Preset tab → Live Time type time in seconds needed for appropriate count (usually 1000 for energy counts and 50400 for 14 hour background counts.) → select Close → select GO tab on the tool bar to start the count. Allow count to complete.
o When count is complete select ROI → Clear all (if some peaks are already marked in red) → Recall File → GammaVision select appropriate folder from list (Bkgds for background count or Energy Cal for energy counts) → select the ROI file within that folder → click on Open. Peaks should now be marked in red. → select File from tool menu → Save As → open appropriate folder as above.
o Type in the file name as follows then click Save: Background should be saved by count time, Bkgrd as the identity,
and the numerical date similar to the following: (example for June 1, 2004) 14hrBkgrd060104.
Energy report should be saved by Energy identity and the numerical date similar to the following: (example for June 1, 2004) Energy060104.
o Analyze → ROI Report → check box for Print to Display → select OK. Window should appear with the ROI data.
o Minimize the big window and go to and open the appropriate background or energy Excel file. R
Record and plot the energy Centroid energies for the 122, 662, and 1836 keV peaks and save the file.
Record and plot the background energy according to the 352, 511, 609, and 1460 keV Net peak areas.
4.5.1.3.2 Sample Reporting
For both detectors: Activity in the 352, 511, 609, and 1461 keV full energy peaks are recorded and plotted over time. The 352 and 609 keV peaks indicate the presence of Ra-226 progeny, either from free Rn-222 in the room air or Ra-226 in the building materials. The 1461 keV peak is from natural K-40 in the environment. Th-228 peaks at 238 and 583 keV are also routinely seen in the background spectra.
Results are evaluated over time to watch trends in the data and evaluate the need for any specific adjustments to background values to be subtracted from individual photopeaks identified as positive in sample results.
4.5.1.3.3 Reproducibility Check
A reproducibility check is performed by counting a known standard in a reproducible geometry daily whenever samples are counted.
The source is counted in the predetermined geometry, and the following data are recorded and plotted over time:
o Energy centroid for 122, 661, and 1836 keV photons.
44
o Full width at half-maximum of the 661 keV peak. o Area under the 661 keV full energy peak.
Results must be within 3 sigma of the established mean values. Any changes in detector gain to correct for drift are recorded.
4.5.2 ICP-MS
4.5.2.1 Instrumental Parameters
Typical Plasma and Sample Introduction Conditions and Settings
Argon: 50 psi Plasma Argon Flow: 15 to 17 L/min. Auxiliary Argon Flow: 0.95 to 1.2 L/min. Nebulizer Argon Flow: 1.0 L/min. RF Power: 1400 watts Lens Voltage: 5 to 9V.
4.5.2.2 Instrument Startup and Optimization
Four main power switches are located on the left-hand side of the ICP-MS. The sequence for turning these switches on is System-Electronics-RF Power-Vacuum Pumps. Wait 7 seconds before turning on each switch.
Open the ELAN software from the computer. On the instrument panel, turn on the vacuum pump and wait 30 minutes before plasma ignition. (The ICP-MS normally runs with the main vacuum system ON unless an extended shutdown is scheduled. Proceed to plasma ignition when the instrument is on.)
Inspect the sample introduction system tubing for brittleness or discoloration. Check the pump rollers and ensure they move freely. Check the probe for blockage. Check the spray chamber for deposits.
Inspect the Autosampler tubing for brittleness or discoloration. Check the pump rollers and make sure they move freely.
Inspect the interface region (plasma torch, cones, RF load coil) for deposits and replace as needed.
On the instrument panel, ignite the plasma and wait 30 minutes before conducting a daily performance check. Aspirate deionized water during this warm-up period.
Aspirate the Perkin Elmer tuning solution and open the Daily Performance method. Run the method and ensure the instrument meets these criteria: Mg Sensitivity ≥ 3000 cps; In and U Sensitivity ≥ 10,000 cps; Doubly-charged Ions ≤ 0.03; Oxides ≤ 0.03; Background ≤ 30 cps; and Noise SD ≤ 5 cps.

45
If the Daily Performance check does not meet the given criteria, perform optimization procedures according to the ELAN DRC Operations Manual. Log instrument settings used for calibration and analysis in the Maintenance/Operations Logbook.
4.5.2.3 Calibration and Analytical Run Sequence
Go to the Autosampler software and turn on the autosampler. The pump speed should be set on 20 rpm.
Load the blank, calibration standards, ICV (initial check verification), and CCV (continuing check verification) in Tray 1 and the samples in Tray 2 and 3.
Open the appropriate method (detailed description will be written when samples become available) listing the analyte (isotope) for analysis in standard mode. The sample flush is set at 45 sec at a speed of 18 rpm. The read delay is set at 5 sec and the analysis set at 12 rpm. The rinse is set 60 sec and at a speed of 18 rpm. The report output will be saved in the hard drive.
Run a seven-point calibration standard with blank. The calibration standard concentrations are 0.1, 1, 10, 25, 50, and 100µg/L. Ensure that the correlation coefficient is ≥ 0.995 for each analyte. (If the calibration does not meet this criterion, run the calibration again. If it fails again, make a new set of standards.)
Save the calibration analysis.
Run the following sequence of samples: Blank-ICV-Blank-CCV-Blank-10 Samples. Repeat. If the Blank, ICV, and CCV values drift ±10%, run your calibration again.
Note that variations in the Blank, ICV, and CCV concentrations due to instrumentation may be caused by contaminated parts. Check the sample introduction system (tubes, spray chamber, probe), cones, and lens voltage between running a set of 50 samples.
4.5.2.4 Sample Reporting
Preparation of calibration standards, ICV, CCV, and samples is logged in the Samples Logbook for ICP-MS. Preliminary preparation (acid digestion, fusion, filtration, etc.) is logged on a separate logbook (ACMM-3816 Method).
The ELAN software saves a copy of the method, calibration, and results on the hard drive. A backup copy of these files will be made daily.

46
Concentrations of each species will be logged manually in the project database.
4.5.2.5 Preparation of Calibration Standards, ICV, and CCV
4.5.2.5.1 Blank Mass a 50-mL container. Tare. Add 100 µL of Internal Standard. Mass. Dilute with approximately 50-mL of 1% HNO3. Mass.
4.5.2.5.2 Calibration Standard (100 µg/L)
Mass 125-mL container. Tare. Add 1 mL of Calibration Standard Solution. Mass. Dilute with approximately 100-mL of 1% HNO3. Mass
Calculate concentration in µg/L: Divide Mass of Calibration Standard solution by Mass of the acid and then multiply by 10,000. (Original 100 µg/L Concentration)
Mass 50-mL container. Tare Add 100 µL of Internal Standard. Mass. Add approximately 50 mL of solution from the 125-mL stock. Mass.
Calculate concentration in µg/L: Subtract Mass of Internal Standard from Final Mass to get Sample Mass. Divide Sample Mass by Final Mass and then multiply by original 100 µg/L concentration.
4.5.2.5.3 Calibration Standard (50 µg/L)
Mass 50-mL container. Tare. Add 25 mL of 100 µg/L Standard from the 125-mL stock. Mass. Add 100 µL of Internal Standard. Mass. Dilute with approximately 100-mL of 1% HNO3. Mass.
Calculate concentration in µg/L: Divide Sample Mass by Mass of the acid and then multiply by original 100 µg/L concentration.
4.5.2.5.4 Calibration Standard (25 µg/L)
Mass 50-mL container. Tare. Add 12.5 mL of 100 µg/L Standard from the 125-mL stock. Mass. Add 100 µL of Internal Standard. Mass. Dilute with approximately 100-mL of 1% HNO3. Mass.
Calculate concentration in µg/L: Divide Sample Mass by Mass of the acid and then multiply by original 100 µg/L concentration.
4.5.2.5.5 Calibration Standard (10 µg/L)
Mass 50-mL container. Tare. Add 5 mL of 100 µg/L Standard from the 125-mL stock. Mass. Add 100 µL of Internal Standard. Mass.

47
Dilute with approximately 100-mL of 1% HNO3. Mass. Calculate concentration in µg/L: Divide Sample Mass by Mass of the acid and then multiply by original 100 µg/L concentration.
4.5.2.5.6 Calibration Standard (1 µg/L)
Mass 50-mL container. Tare. Add 5 mL of 10 µg/L Standard. Mass. Add 100 µL of Internal Standard. Mass. Dilute with approximately 100-mL of 1% HNO3. Mass.
Calculate concentration in µg/L: Divide Sample Mass by Mass of the acid and then multiply by calculated 10 µg/L concentration.
4.5.2.5.7 Calibration Standard (0.1 µg/L)
Mass 50-mL container. Tare. Add 0.5 mL of 10 µg/L Standard. Mass. Add 100 µL of Internal Standard. Mass. Dilute with approximately 100-mL of 1% HNO3. Mass.
Calculate concentration in µg/L: Divide Sample Mass by Mass of the acid and then multiply by calculated 10 µg/L concentration.
4.5.2.5.8 CCV
Mass 50-mL container. Tare. Add 0.25 mL of Calibration Standard Solution. Mass. Add 100 µL of Internal Standard. Mass. Dilute to approximately 50-mL of 1% HNO3. Mass.
Calculate concentration in µg/L: Divide Mass of Calibration Standard solution by Mass of the acid and then multiply by 10,000.
4.5.2.5.9 ICV
Mass 50-mL container. Tare. Add 0.25 mL of Calibration Standard Solution (different manufacturer).
Mass. Add 100 µL of Internal Standard. Mass. Dilute to approximately 50-mL of 1% HNO3. Mass.
Calculate concentration in µg/L: Divide Mass of Calibration Standard solution by Mass of the acid and then multiply by 10,000.
4.5.2.6 Preparation and Storage of Samples
Samples will be prepared from a modified version of the INEEL method ACMM-3816. Further preparation for ICP-MS includes a dissolution step of the filtered material with 1% nitric acid.

48
Samples will be stored in the cold room of the Environmental Engineering Laboratory.
4.5.3 Laboratory Balance 4.5.3.1 Calibration and Checkout
Balances are calibrated monthly in-house and annually by a calibration service. Operational checks of balances are performed prior to each day’s use and
recorded in either paper or electronic logbooks. 4.5.3.2 Procedures and Requirements
Background or reproducibility counts which do not meet the acceptance criteria are repeated and evaluated. Repairs or corrections to the system are performed, as necessary, until acceptable results are obtained and calibration parameters are either verified or re-established.
Results of operational checks of instruments are placed on control charts or tables. Original data values used to generate control charts are organized and readily available.
Analyses for which operational check results do not meet the guidelines required by this procedure are evaluated by the Laboratory Manager in conjunction with the Project Manager, if applicable. Information such as data end use and sample matrix characteristics are used to determine whether reanalysis is necessary. In all such cases explanatory comments are added to the project file.
Analytical data for which operational check results meet the requirements of this procedure are considered acceptable for use in project reports. When re-analysis of samples is performed all analytical results determined to be technically sound by the Laboratory Manager will be reported.
When operational check-out conditions are not met the operational checks must be rerun successfully two times in succession, or the instrument will be taken out of service until the problem is resolved.
Operational performance is reviewed by the Laboratory Manager and recorded at least weekly for completeness, conformance with acceptance criteria, undesirable trends, and resolution or corrective actions.
4.5.4 Data Backup
All QA and sample data are backed up nightly from both computers on which the data are gathered using the automatic backup service at the Civil and Environmental Engineering Department. This copies the data from the personal computer to a separate server within the department. Data are also copied from the original computers to another personal computer (in a separate building, Medical Center North) once per week.

49
SECTION 5: Sample Chain-of-Custody
5.1 PURPOSE The procedures and responsibilities for sample chain of custody (COC) are provided in this section. 6.2 RESPONSIBILITIES Program Director
Identify COC procedures to be followed as samples are transferred between laboratories on the project.
Laboratory Staff
Follow established COC procedures when receiving or sending project samples. Maintain integrity of samples and internal COC when processing project samples.
5.3 PROCEDURES Upon receipt of samples, the Lab Manager will:
1. Open the container and obtain the chain-of-custody form. 2. Verify the contents against the chain-of-custody form. 3. Check and note the condition of the samples before storage. Log date of receipt and
sample ID in log notebook. 4. Store biological samples in the sub-zero freezer in Room 161 (before gamma
analysis). 5. Non-biological samples (e.g. wipe samples for liquid scintillation analysis) will be
stored in a locked cabinet in the radiochemistry laboratory. 6. Photocopy chain-of-custody form and place in log notebook. File the original in the
Lab Manager office. Notify Rutgers by e-mail that the samples have arrived. 7. Samples with original sample ID numbers will be counted in their original
containers for I-129, general gamma emitters, and liquid scintillation counting. 8. Samples will be returned to the Room 161 freezer or radiochemistry laboratory after
any gamma analyses to await Alpha Spec and Mass Spec analyses.
Additional chain-of-custody forms for drying/ashing, radiochemistry, alpha spec, and ICP-MS will contain the following information:
1. ID of original sample – e.g. S-F-1 2. New ID of sample – must include original ID first then e.g.
a. S-F-1-DA (dried and ashed) b. S-F-1-R (radiochemistry – need to consider the multiple steps in which
the sample will be moved from one container into another container – demineralization, fusion, columns, filtering)
c. S-F-1-AS-Am (Alpha Spec Americium) or AS-U or AS-Sr d. S-F-1-MS-Am (ICP-Mass Spec Americium)
3. Date the sample is processed

50
4. Brief description of analysis performed on the sample Notes
All laboratories in the Vanderbilt CEE program are accessible only by cleared lab personnel with electronic or mechanical key access. Samples left for periods, for gamma counting, drying, ashing, chemical procedures, etc. will remain in locked rooms.
All analyses for Alpha Spec and Mass Spec are destructive, and no sample is expected to remain after analyses.
Additional samples analyzed only for gamma emitters will be held in long term freezer storage, with original sample identifiers intact.

51
SECTION 6: Analytical Quality Control
6.1 PURPOSE The procedures and responsibilities for analytical quality control are provided in this section. 6.2 RESPONSIBILITIES Program Director
Identify parameters to be measured and quality samples to be employed. Establish acceptable performance criteria. Ensure documentation is maintained. Perform reviews of quality data (section 7). Perform reviews of performance documentation and work with managers to
initiate corrective actions, as appropriate. QA Manager
Review performance data. Respond to any observed variations from accepted tolerance limits for quality
control samples and institute corrective action if needed. Laboratory Staff
Record and report performance data. Respond to any requests by the Laboratory Manager for data, tracing of analytical
results and corrective action. 6.3 PROCEDURES
Analytical quality control on this project complements instrument quality control primarily via the introduction of blind spike and blank samples in each batch of samples analyzed.
Blank and spike samples shall be provided to the project by personnel at the DOE’s Radiological and Environmental Sciences Laboratory (RESL). These samples shall be prepared and then shipped to Rutgers University for assignment of sample numbers and inclusion in each batch of samples.
These blind quality control samples will be received within each batch with a sample number that is completely identical in nature to other samples. Results are to be reported as for all other samples.
The program director and QA manager will have a list of encoded and unencoded sample numbers. Reported results for laboratory blinded spikes and blanks will be evaluated with each batch during data validation (section 7).
Tolerance for spikes shall be + 30% of the expected values. Tolerance for blanks shall be + 2 standard deviations of routine background.

52
SECTION 7: Data Quality Control (Validation) and Reporting
7.1 PURPOSE Definition of data validation and reporting procedures. 7.2 RESPONSIBILITIES Project Manager
Approve procedures and assign the responsibility for data validation procedure development and testing.
Identify appropriate data validation techniques. Perform routine data validation methods, with QA manager. Report results of data validation methods to Amchitka project managers. Initiate and oversee corrective actions needed as a result of findings from data
validation procedures. Ensure documentation of data validation procedures and maintain in up-to-date
status. QA Manager
Assist project manager in data validation process and maintenance of data validation records.
Assist with reporting of data validation results and possible corrective actions based on data validation findings.
Laboratory Manager
Supervise and assist laboratory personnel in sample analyses. Organize and report results of analyses to QA Manager and Project Manager. Respond to any inquiries from QA Manager or Project Manager for data,
clarifications, corrections, etc. regarding validation of laboratory results. Direct sample processing in accordance with directives from QA Manager and
Project Manager. All Staff
Promptly report results of sample analyses for validation. Process samples only when authorized by Laboratory Manager. Promptly respond to requests for corrective actions as a result of data validation
findings. 7.3 DEFINITIONS Data validation: A process used to determine if data are accurate, complete, or meet specified criteria.
53
7.4 PROCEDURES
7.4.1 Data Validation
• Samples collected in the field will have been stored, labeled, given identification numbers, then assigned coded identification numbers, and will have been organized into batches (as described in the “Sample Batches” document).
• Batches will be shipped via courier, as described in the “Sample Management” section of the project procedures manual, to the labs at Vanderbilt University and Idaho National Engineering and Environmental Laboratory.
• Each analytical batch of samples will include a known spike and blank of a similar matrix that has been prepared by RESL, with the sample identification encoded so that the identity of the prepared spike and blank is not known to the analytical laboratory personnel.
• Upon receipt at these laboratories, the batch contents will be verified against the prescribed contents, including the presence of the correct number of spike and blank samples. The shipment must contain an itemized list of the shipment contents, in both original and coded identification numbers. Each laboratory will notify receipt of the sample shipment by e-mail to David Kosson ([email protected]), Vikram Vyas ([email protected]), Joanna Burger ([email protected]) and Chuck Powers ([email protected]).
• The sample identifications and analyte list for each sample must be verified by David Kosson against the master list of sample analysis and encoding against original sample identification. Upon verification, the analytical laboratory (INEEL or VU) will be authorized to proceed by e-mail notification by David Kosson, to Gracy Elias for INEEL ([email protected]) or Rossane Delapp ([email protected])
• The contents of each batch will be forwarded to the laboratory personnel, who will know only the coded identification number. Laboratory personnel will thus be blinded from knowing the sample origin (i.e. physical location from which the sample originated), specific species type (species types will be encoded, but distinguishable, i.e. Mackerel may be species A and Turbot species B – project supervisors and data validation members will know this, but laboratory personnel will not), and whether a sample is a spike or a blank. They will know that a sample is soft tissue, bone or kelp, by the batch identifier.
• After LEPS and gamma spectroscopic analysis (for I-129, Cs-137, and other gamma emitters), the data will be reported to the data validation personnel at Vanderbilt University for internal validation, to note any irregularities (spikes or blanks out of tolerance, switched results, etc.) or cases in which a result of interest is close to detection limits and should be counted for a longer period. Internal validation includes:
o Verification that the appropriate number of spikes and blanks (blind and internal controls) were included.
o Review of detector analytical spectra.
54
o Verification that instrument background readings were in a normal range during the analyses.
o Verification of equipment calibration and logs during the analyses. o Verification of sample identities and masses. o Evaluation of data internal consistency, spiked sample % recovery, and
sample blank values. o Evaluation of consistency of any split samples.
Subsequent steps in sample analysis (i.e., sample drying, ashing and digestion) will not proceed until gamma and LEPS data, as well as spike and blank results (section 6), have been validated and approved by data validation personnel at Vanderbilt University. When validation procedures are completed, the Laboratory Manager will be notified that further analyses may progress, and a signed letter will be forwarded by facsimile to Vikram Vyas, attesting to the acceptance of the numerical values.
• If samples are returned to the laboratory for further analysis, sample identity will continue to be encoded (i.e. laboratory personnel will still be blinded).
• When validation is successfully completed, the samples in the batch will be permitted to proceed to digestion and alpha spectroscopic analysis. The entire sample is submitted to the digestion process, and at the end, is contained on a small filter. This digestion step also results in additional separation column eluates for beta analysis for Tc-99 and Sr-90.
• After alpha spectroscopic analysis, the data are again reported to data validation personnel at Vanderbilt University for validation, before being dissolved and subjected to Inductively Coupled Plasma – Mass Spectroscopy (ICP-MS) analyses. Validation of alpha spectroscopic analysis will include
o Verification that the appropriate number of spikes and blanks (blind and internal controls) were included.
o Review of detector analytical spectra. o Verification that instrument background readings were in a normal range
during the analyses. o Verification of equipment calibration and logs during the analyses. o Verification of sample identities and masses. o Evaluation of data internal consistency, spiked sample % recovery, and
sample blank values. o Evaluation of consistency of any split samples.
Subsequent steps in sample analysis (i.e., filter dissolution for ICP-MS analysis) will not proceed until alpha spectroscopy data, as well as spike and blank results (section 6), have been validated and approved by data validation personnel at Vanderbilt University. When validation procedures are completed, the Laboratory Manager will be notified that further analyses may progress, and a signed letter will be forwarded by facsimile to Vikram Vyas, attesting to the acceptance of the numerical values.
• If samples are returned to the laboratory for further analysis, sample identity will continue to be encoded (i.e. laboratory personnel will still be blinded).

55
• When validation is successfully completed, the samples in the batch will be permitted to proceed to dissolution and ICP-MS analysis. The entire filter sample is dissolved in nitric acid prior to ICP-MS analysis.
• After ICP-MS analysis, the data will be internally validated, including o Verification that the appropriate number of spikes and blanks (blind and
internal controls) were included. o Review of detector analytical spectra. o Verification that instrument background readings were in a normal range
during the analyses. o Verification of equipment calibration and logs during the analyses. o Verification of sample identities and masses. o Evaluation of data internal consistency, spiked sample % recovery, and
sample blank values. o Evaluation of consistency of any split samples.
Data validation will be completed by data validation personnel at Vanderbilt University. When validation procedures are completed, the Laboratory Manager will be notified that further analyses may progress, and a signed letter will be forwarded by facsimile to Vikram Vyas, attesting to the acceptance of the numerical values.
• If samples are returned to the laboratory for further analysis, sample identity will continue to be encoded (i.e. laboratory personnel will still be blinded).
• After beta analysis of separate eluates for Tc-99 and Sr-90, the data will be internally validated, including
o Verification that the appropriate number of spikes and blanks (blind and internal controls) were included.
o Review of detector analytical spectra. o Verification that instrument background readings were in a normal range
during the analyses. o Verification of equipment calibration and logs during the analyses. o Verification of sample identities and masses. o Evaluation of data internal consistency, spiked sample % recovery, and
sample blank values. o Evaluation of consistency of any split samples.
Data validation will be completed by data validation personnel at Vanderbilt University. When validation procedures are completed, the Laboratory Manager will be notified that further analyses may progress, and a signed letter will be forwarded by facsimile to Vikram Vyas, attesting to the acceptance of the numerical values.
• If samples are returned to the laboratory for further analysis, sample identity will continue to be encoded (i.e. laboratory personnel will still be blinded).
• All data recording will be checked by an independent data checker. • Upon completion of data validation and acceptance by data validation personnel
at Vanderbilt University, final data for each analyte within each batch will be sent via e-mail to Vikram Vyas for entry into the project data base and distribution to Joanna Burger, Mike Gochfeld, Hank Mayer and Chuck Powers.

56
• The following table shows the estimated detection limits (MDAs) for several important analytes in each matrix type in the project. These calculations are based on 100 g samples and efficiency curves from the Canberra detector. The Ortec detector cannot see I-129, and has somewhat lower efficiencies overall. Longer count times will be used on this detector to offset the lower efficiencies.
MDA (Bq/g)
Nuclide Count time (min) Soft Tissue Kelp Bone
Cs-137 480 1.15E-03 1.05E-03 1.06E-03 Am-241 480 9.38E-04 9.26E-04 8.11E-04 I-129 480 7.62E-04 5.52E-04 8.21E-04 Eu-152 480 1.61E-03 1.43E-03 1.38E-03 Cs-137 720 9.28E-04 8.46E-04 8.57E-04 Am-241 720 7.59E-04 7.50E-04 6.56E-04 I-129 720 6.18E-04 4.48E-04 6.66E-04 Eu-152 720 1.31E-03 1.16E-03 1.12E-03 Cs-137 1440 6.46E-04 5.89E-04 5.96E-04 Am-241 1440 5.31E-04 5.25E-04 4.59E-04 I-129 1440 4.33E-04 3.14E-04 4.67E-04 Eu-152 1440 9.17E-04 8.13E-04 7.89E-04 Cs-137 2880 4.51E-04 4.12E-04 4.17E-04 Am-241 2880 3.73E-04 3.68E-04 3.22E-04 I-129 2880 3.04E-04 2.20E-04 3.28E-04 Eu-152 2880 6.45E-04 5.72E-04 5.55E-04 Cs-137 4320 3.67E-04 3.34E-04 3.39E-04 Am-241 4320 3.03E-04 3.00E-04 2.62E-04 I-129 4320 2.48E-04 1.79E-04 2.67E-04 Eu-152 4320 5.25E-04 4.66E-04 4.52E-04
7.4.2 Data Reporting
• Original data for the project will come from a number of analytical instruments. Most of these instruments have some computer-controlled elements involved in both controlling the instrument and reporting and/or analyzing the results. Some of these reported results are spectral in nature (i.e. many data points are displayed in channels that represent a spectrum of energies, for example), and some results are simply integral counts.
• The selection of the appropriate data from the instrument output that represent the radioactivity levels or concentrations by mass is the responsibility of the laboratory personnel.
• Data for radionuclides will be reported as the observed value, with an associated uncertainty (one standard deviation). Detection limits may be derived from the reported uncertainty.
• Data for ICP-MS will be reported as concentrations (ug/g wet wt) with associated method detection limit and method quantification limit, and also as calculated activities (bq/g wet wt).
57
• All results will be reported with a coded value representing the method used to perform the analysis.
• Radionuclide data will also report the counting time used. • The true sample wet mass will be reported for each sample (note that deionized
water may have been added to some samples to attempt to standardize the sample volume for counting). Sample dry and ash masses will not be reported.
• Data will be hand-entered into Microsoft Excel spreadsheets for data validation and ultimate reporting at Vanderbilt.
• All hand-entered data will be verified by a second person prior to data validation.
• All data (instrument raw data and spectra, including extracted results as reported in the spreadsheets) will be backed up daily to the remote server.
• Any changes needed to reported data, from results of data validation procedures or other review, will be made immediately by the Laboratory Manager or laboratory personnel.
7.4.3 Summary of Analytical Quality Assurance and Quality Control QA/QC for sample analysis is being carried out at multiple levels, summarized as follows:
• Every instrument used for specific analysis has usage and maintenance log sheets, and for each set of analyses, calibration standards, blanks and background checks.
• Every analytical procedure will have been validated using analogous sample matrixes (soft tissue, bone or skeletal material, kelp) that have been spiked (with the spike amount unknown to the laboratory analyst) and analyzed with acceptable recovery and accuracy. Analytical procedures will be independently validated at each laboratory at which they are employed (e.g., separate validation for INEEL and VU laboratories).
• All procedures and documentation will be reviewed by an independent evaluator for consistency and appropriateness.
• Every batch of samples analyzed will include a blind spike and blank. • Every analytical result will undergo data validation as described above. • Approximately 20% of each sample type will be analyzed by a second laboratory.
For soft tissue gamma analysis, split samples will be used when possible, providing direct inter-laboratory comparison of results. For alpha spectroscopy, ICP-MS, and beta analytes, sample homogeneity cannot be assumed. Therefore, statistical comparison of pools of sample analyses will be used to provide inter-laboratory comparison.
• A significantly larger number of samples (ca. 300) will be subject to gamma analysis at VU. This analysis will include I-129, Cs-137, Co-60 and any other gamma emitters detected in the resulting spectra. Any samples with unusual or elevated results can also be subjected to more extensive analysis because the gamma analysis is non-destructive. More extensive analysis may be subject to budget limitations.

58
SECTION 8: Document Quality Control
8.1 PURPOSE Definition of document quality control procedures. 8.2 RESPONSIBILITIES Project Manager
Oversee maintenance of official approved procedures and quality assurance documents for the project.
Sign approved procedures in each official copy of approved procedures and quality assurance documents for the project.
Quality Assurance Manager
Maintain official approved procedures and quality assurance documents for the project.
Oversee changes made to official approved procedures and quality assurance documents for the project.
Co-sign approved procedures in each official copy of approved procedures and quality assurance documents for the project.
All Staff
Ensure maintenance of approved procedures in each official copy of approved procedures and quality assurance documents for the project in safe locations within the laboratories (i.e. away from potential damage from water, heat, chemicals, etc.)
Use only approved procedures in each official copy of approved procedures and quality assurance documents when performing procedures in the project.
Maintain training in approved project procedures. Maintain familiarity with changes made in approved procedures in each official
copy of approved procedures and quality assurance documents for the project. 8.3 DEFINITIONS Approved procedures and quality assurance document: A procedures manual that is known to contain correct and up-to-date analytical and other methods for use in the project.
8.4 PROCEDURES
It is essential that only approved procedures and quality assurance documents be used in the laboratory for reference during analytical procedures. Use of incorrect or out of date procedures may result in compromise of the validity of reported results.
59
“Unofficial” copies of procedures and quality assurance documents may exist, but they must be clearly marked as such and should be easily and quickly recognized as being unofficial (for example by using a unique color coding for binders containing the official copies).
Official copies of procedures and quality assurance documents must be easily identifiable. A limited number of such documents will be produced and approved by the project manager and quality assurance manager. Typically, the project manager and quality assurance manager each have one copy in their offices, and one copy is made for one or more of the important laboratory areas in the project.
When project procedures have been agreed upon, the first version of the procedures and quality assurance manual is accepted and approved by the project manager and quality assurance manager, with dated signatures indicating acceptance for use in the project.
After this point, any changes to the manuals must be approved by the quality assurance manager. Changes must be made simultaneously to all official copies of the procedures and quality assurance documents, with documentation of the change maintained by the quality assurance manager.
Any deviations from established procedures in the laboratory must be reported promptly to the laboratory manager and quality assurance manager, to ensure that there is no compromise of data quality. Repeated deviations from procedures in a given area may suggest the need for revision of the procedures and quality assurance manual.
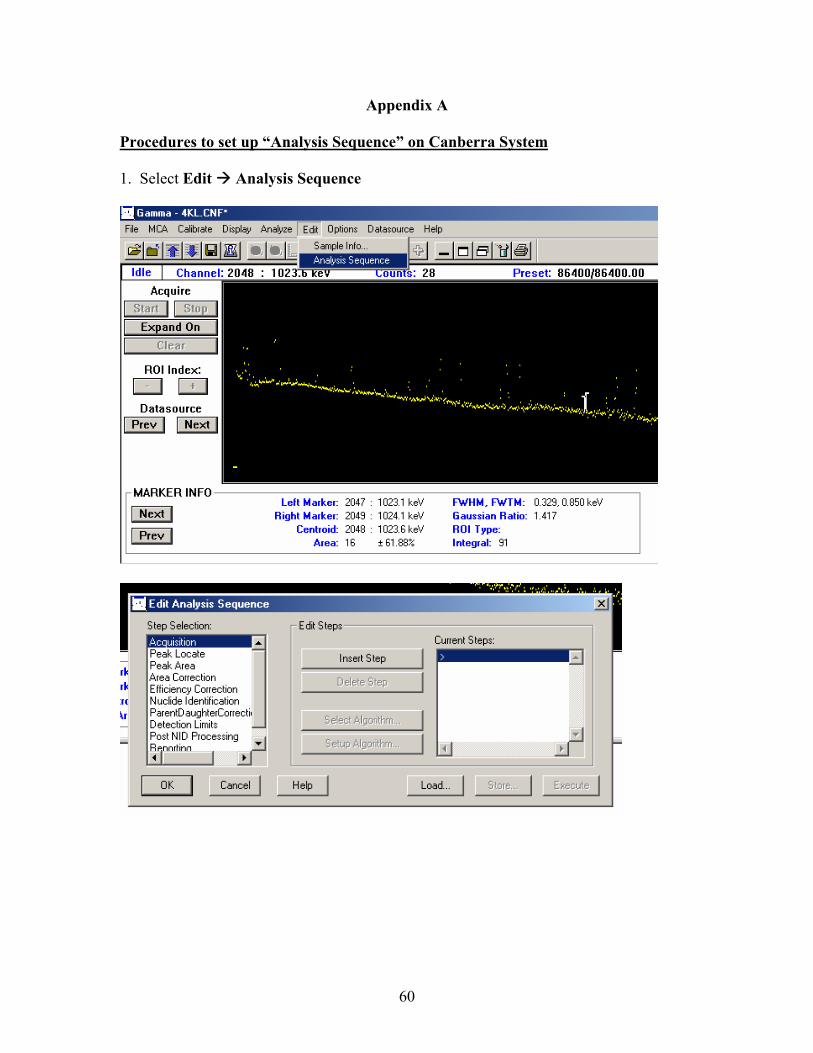
60
Appendix A
Procedures to set up “Analysis Sequence” on Canberra System 1. Select Edit Analysis Sequence

61
2. Load Analysis Sequence: 3. Select “Amchitka Samples”
4. Current Steps:
a. Reporting (1)
Setup Algorithm:
Select Algorithm:

62
b. Peak Locate:
Setup Algorithm: Select Algorithm:
c. Peak Area
Setup Algorithm: Select Algorithm:
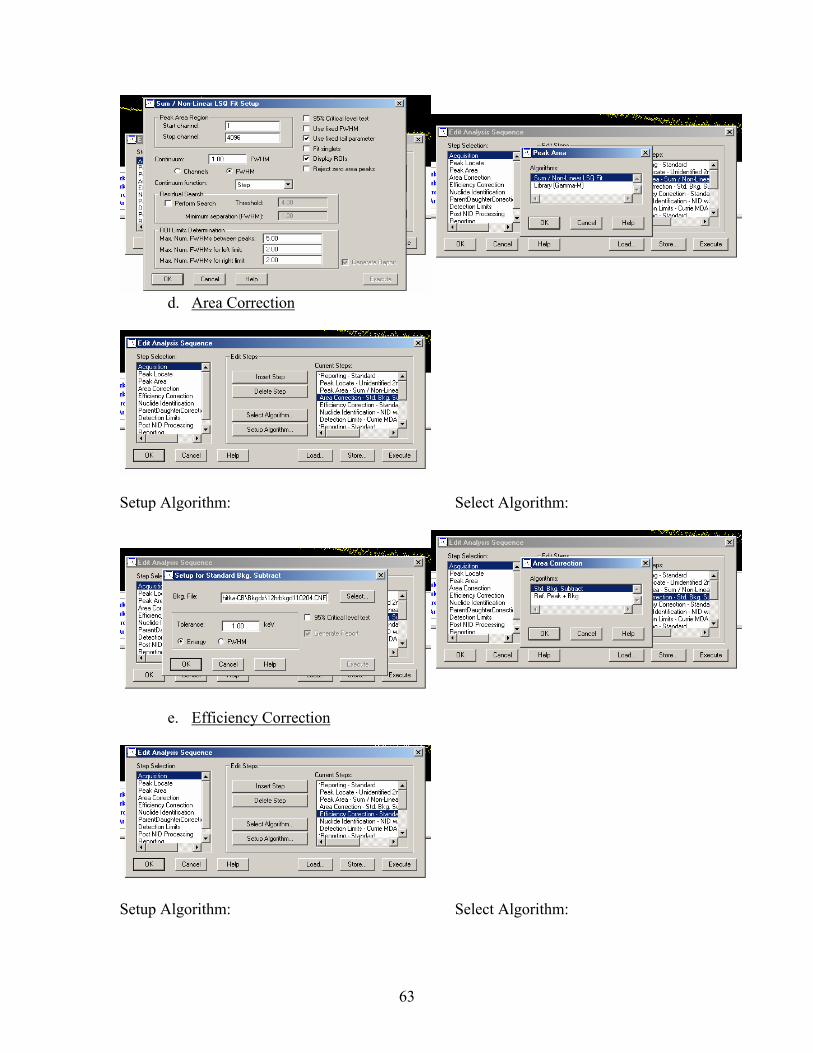
63
d. Area Correction
Setup Algorithm: Select Algorithm:
e. Efficiency Correction
Setup Algorithm: Select Algorithm:

64
f. Nuclide Identification
Setup Algorithm: Select Algorithm:
g. Detection Limits
Setup Algorithm: Select Algorithm:
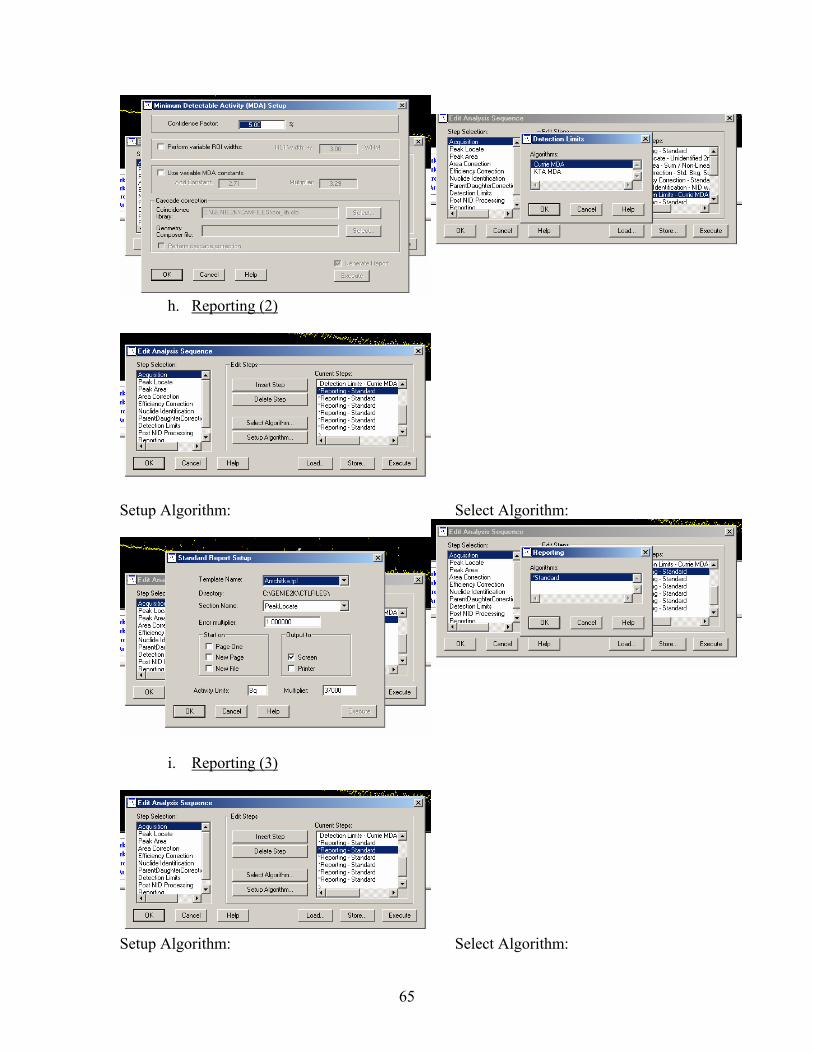
65
h. Reporting (2)
Setup Algorithm: Select Algorithm:
i. Reporting (3)
Setup Algorithm: Select Algorithm:

66
j. Reporting (4)
Setup Algorithm: Select Algorithm:
k. Reporting (5)

67
Setup Algorithm: Select Algorithm:
l. Reporting (6)
Setup Algorithm: Select Algorithm:
m. Reporting (7)
Setup Algorithm: Select Algorithm:
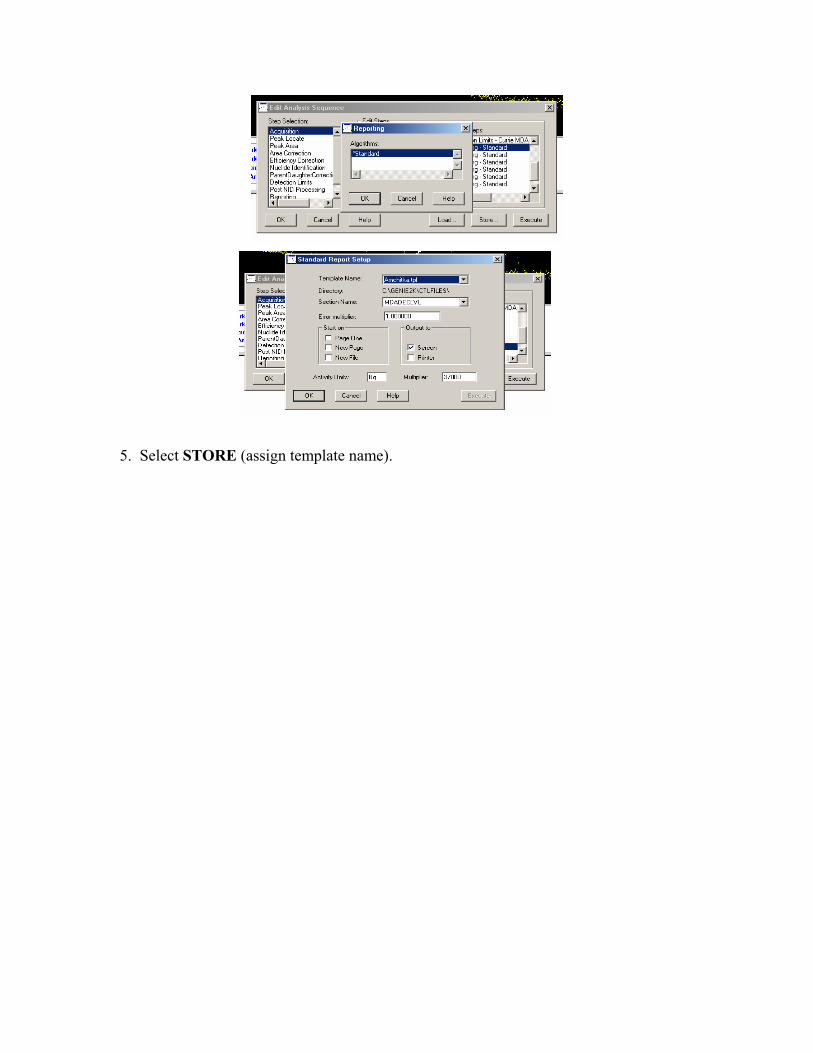
5. Select STORE (assign template name).


![resume - NamFahproject.namfah.com/resume.pdf · Siam Outlet Co., Ltd. System [2016] Vanderbilt New York Brand Website by Murjani Group [2016] "Muangthai Life Assurance" Website [2015]](https://static.fdocuments.net/doc/165x107/5fd4081e30dd724a7802100e/resume-siam-outlet-co-ltd-system-2016-vanderbilt-new-york-brand-website-by.jpg)