Quality assurance in clinical trials - CRASH-2 · Quality assurance in clinical trials Marc Buyse...
25
Quality assurance in clinical trials Marc Buyse IDDI, Louvain-la-Neuve, Belgium Sensible Guidelines for the Conduct of Clinical Trials Washington, January 25-26, 2007
Transcript of Quality assurance in clinical trials - CRASH-2 · Quality assurance in clinical trials Marc Buyse...

Quality assurance in clinical trials
Marc BuyseIDDI, Louvain-la-Neuve, Belgium
Sensible Guidelines for the Conduct of Clinical TrialsWashington, January 25-26, 2007

Outline
1. Data errorsDo they matter?
2. On-site monitoring Is it useful?
3. Statistical data checking Is it possible?

Quality Assurance – why ?
The purpose of quality assurance is not to ensure that the data are 100% error-free.
Its purpose is to ensure that the clinical trial results are reliable, i.e.
• observed treatment effects are real• their estimated magnitude is unbiased

A taxonomy of errors
Random errors*– Measurement errors (eg due to assay precision or
frequency of visits)– Errors due to slopiness (eg transcription errors)– Many types of fraud (most cases of data fabrication)
Systematic errors– Design flaws (eg exclusion of patients with
incomplete treatment or unequal schedule of visits)– Some types of fraud (most cases of data falsification)
* Random with respect to treatment assignment

– Random errors do not matter much– Systematic errors do matter but are largely
preventable through proper trial design
Do data errors matter?

A randomized trial of anti-VEGF therapy for age-related macular
degeneration
Sham
3 mg
Patientswith
exudativeAMD
Stratify by - Center- Lesion
subtype- Prior
therapy
Intra-ocular injections
0.3 mg1 mg
Ref: Gragoudas et al. N Engl J Med 2004;351:2805

Trial endpoint: visual acuity over time(assessed through vision chart)
Visual acuity = numbers of letters read correctly

Changes in visual acuity from baselineto 1 year by treatment arm
Visit time
VA
S c
hang
e
Week 0 Week 6 Week 12 Week 18 Week 24 Week 30 Week 36 Week 42 Week 48 Week 54
-17-16-15-14-13-12-11-10-9-8-7-6-5-4-3-2-10 0.3 mg
1 mg3 mgSham
0.3 mg vs sham P = 0.00011 mg vs sham P = 0.00033 mg vs sham P = 0.03

Impact of adding random errors to visual acuity
• Let σ² be the within-patient variance of visual acuity over time
• Add random error ∼ N(0, σ²) to given proportion of patients selected at random
• Simulate 1,000 trials with added random errors• Calculate 1,000 t-test P-values• Report the median (and quartiles) of the
distribution of these P-values

Median simulated t-test P-values (and interquartile range)
0.00001
0.0001
0.001
0.01
0.1
1
0 0.1 0.2 0.3 0.4 0.5
Proportion of patients with random error
P-Va
lue
(Log
sca
le)
3mg 1mg 0.3mg

Systematic errors
Errors avoidable by design (and analysis), e.g.• No post-randomization exclusions• No “per-treatment received” analyses• Identical follow-up schedules• Blinding to avoid endpoint assessment bias• Etc.
Fraud (“intention-to-cheat”)

Prevalence of fraud?
• Industry (Hoechst, 1990-1994)1 case of fraud in 243 (0.43%) randomly selected centers
• FDA (1985-1988)1% of 570 routine audits led to a for-cause investigation
• CALGB (1982-1992)2 cases of fraud in 691 (0.29%) on-site audits
• SWOG (1983-1990)no case (0%) of fraud in 1,751 patients
→ fraud is probably rare (but possible underestimation ?)
Ref: Buyse et al, Statist in Med 1999;18:3435

Impact of fraud
Most frauds have little impact on the trial results because:• they introduce random but not systematic errors (i.e.
noise but no bias) in the analyses• they affect secondary variables (e.g. eligibility criteria)• their magnitude is too small to have an influence (one site
and/or few patients)
Refs: Altman, Practical Statistics for Medical Research 1991Peto et al, Controlled Clin Trials 1997;18:1
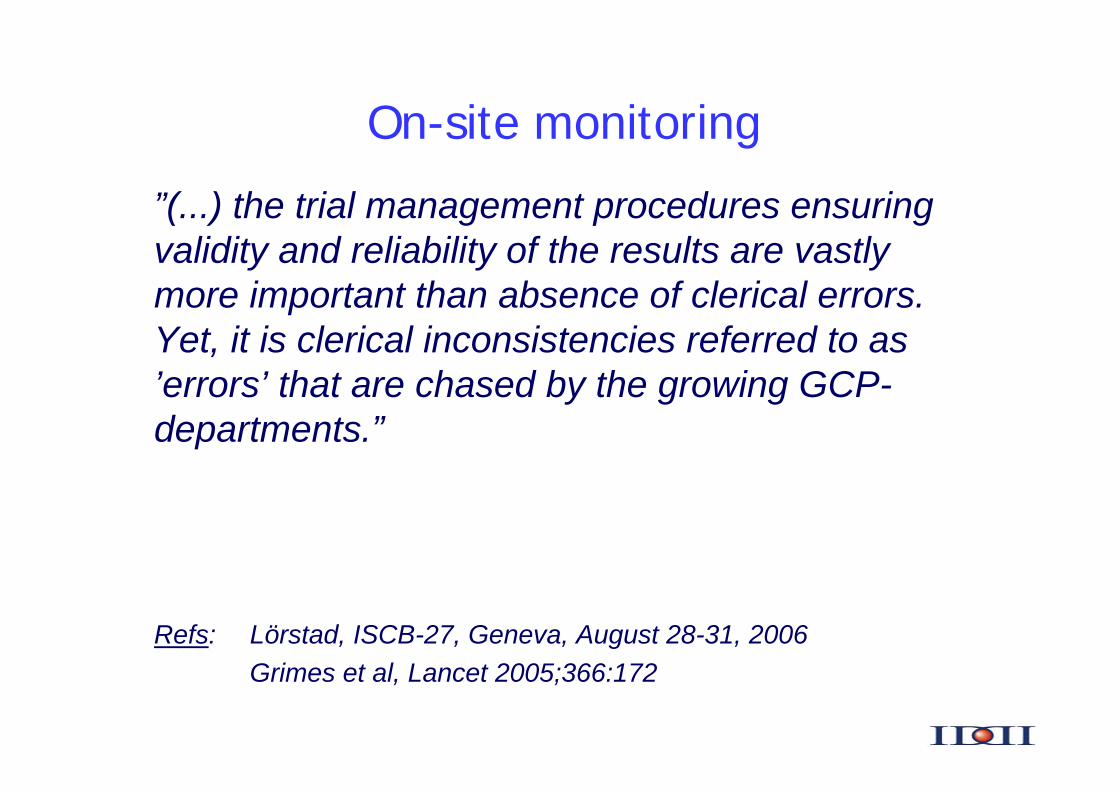
On-site monitoring
”(...) the trial management procedures ensuringvalidity and reliability of the results are vastlymore important than absence of clerical errors. Yet, it is clerical inconsistencies referred to as ’errors’ that are chased by the growing GCP-departments.”
Refs: Lörstad, ISCB-27, Geneva, August 28-31, 2006 Grimes et al, Lancet 2005;366:172

A phase IV randomized trial of adjuvant treatment for breast cancer
6 x FEC *
4 x FEC → 4 x T **
Patientswith node-
positiveresectedbreastcancer
Stratify by - Center- Patient’s
age- Number of
positive nodes
* 5FU, Epirubicin, Cyclophosphamide** Taxol

A randomized study of the impact of on-site monitoring
Group A (site visits)
Group B (no visits)
Centersaccruingpatientsin trial AERO B2000
Stratify by - Type
(Academicvs Private)
- Location (Paris vs Province)
Ref: Liénard et al, Clinical Trials 2006;3:1-7

No difference
Impact of initiation visits on patient accrual
16 (24%)15 (22%)6 +
11 (16%)12 (18%)3-5
7 (11%)8 (12%)1-2
33 (49%)33 (48%)0
B (no visits)67 centers
A (site visits)68 centers
Nr patients accrued by
opened center

No difference
Impact of initiation visits on volume of data submitted
114 (42%)162 (54%)0
17 (6%)12 (4%)6 +
96 (36%)77 (25%)3-5
44 (16%)51 (17%)1-2
B (no visits)271 patients
A (site visits)302 patients
Nr CRF pages submitted by
patient
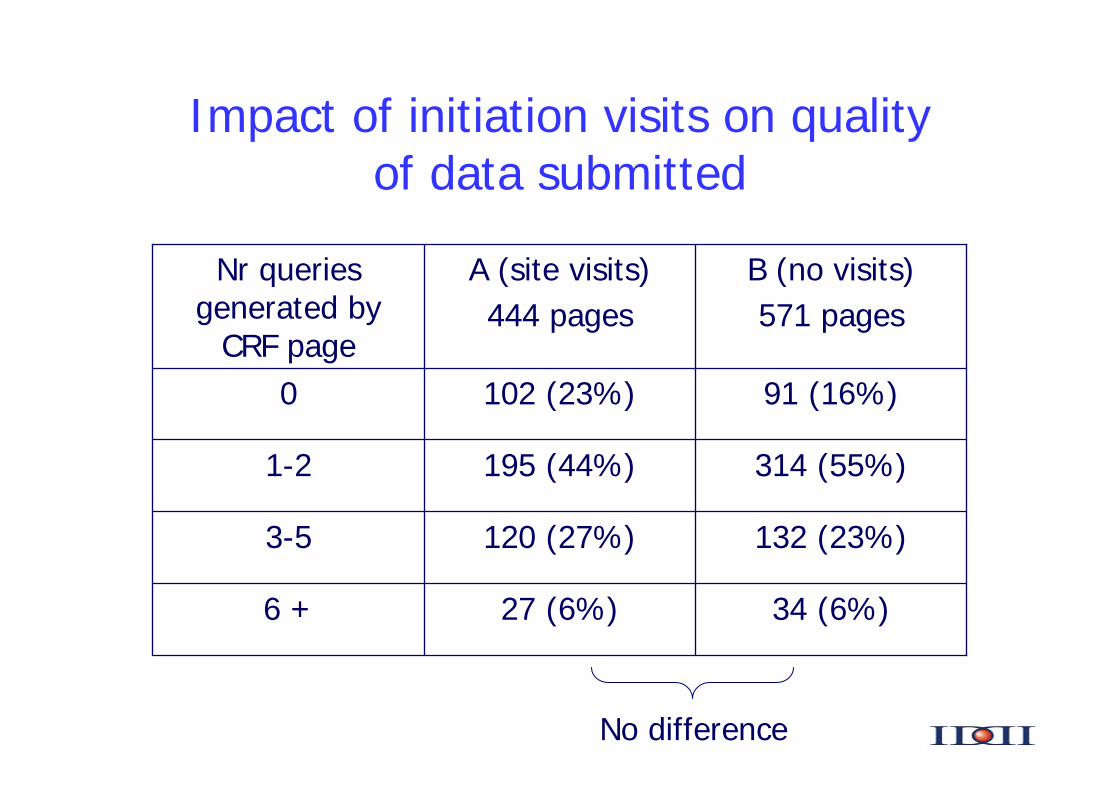
No difference
Impact of initiation visits on qualityof data submitted
34 (6%)27 (6%)6 +
132 (23%)120 (27%)3-5
314 (55%)195 (44%)1-2
91 (16%)102 (23%)0
B (no visits)571 pages
A (site visits)444 pages
Nr queriesgenerated by
CRF page

Statistical approaches to data checking
• Humans are poor random number generators → test randomness (e.g. Benford’s law)
• Plausible multivariate data are hard to fabricate → test correlation structure
• Clinical trial data are highly structured→ compare expected vs observed
• Clinical trial data are rich in meaning→ test plausibility (e.g. dates)
• Fraud or gross errors usually occur at one center→ compare centers

Non-parametric approach
• In multicentric trials, the distribution of all variables can be compared between eachcenter and all others, through– χ² statistics for discrete variables– t-test to compare means of continuous variables– F-test to compare variances– mutivariate test statistics for more than one variable– etc.

Brute force approach• These tests can be applied automatically,
without regard to meaning or plausibility• They yield very large number of center-
specific statistics• Meta-statistics can be applied to these
statistics to identify outlying centers• These ideas are currently implemented in the
project « SAFE » (Statistical Alerts For Errors)

SAFE – prototype overview
Working datasets
Data checking modules
Reports
Results datasets
Meta-statistics modules
Data preparation modules
Trial original datasets

Quality Assurance – how ?
“Total Quality Management” has been used successfully in other industries (nuclear power, aviation and space industry). It requires
- A working definition of quality (“fitness for use”)- Error prevention (rather than cure)- Performance data - Statistical process control- Continuous improvement
Ref: Lörstad, ISCB-27, Geneva, August 28-31, 2006

Conclusions
We lack evidence on the (cost-)effectiveness of current trial procedures, such as intensive monitoring and 100% source data verification
A statistical approach to quality assurance could yield huge cost savings without compromising the reliability of the trial results
Quality assurance in clinical trials is in great need of re-engineering. More regulations such as GCP or ICH, useful as they are, will not achieve this goal.