
QUALITY ASSESSMENT & REGULATION DIVISION
76
QUALITY ASSESSMENT & REGULATION DIVISION ANNUAL REPORT 2019
Transcript of QUALITY ASSESSMENT & REGULATION DIVISION

QUALITY ASSESSMENT & REGULATION DIVISION
ANNUAL REPORT 2019

DATA RELIABILITY STATEMENTData included in this report is primarily sourced from the National Quality Agenda IT System. Data regarding previous years may be slightly different than previously published, as records may be updated for accuracy.
ROUNDINGPercentages may not always sum up to 100% due to rounding.
© State of Victoria (Department of Education and Training) 2020.
Quality Assessment and Regulation Division Annual Report 2019 is provided under a Creative Commons Attribution 4.0 International licence. You are free to re-use the work under that licence, on the condition that you credit the State of Victoria (Department of Education and Training), indicate if changes were made and comply with the other licence terms, see: Creative Commons Attribution 4.0 International https://bit.ly/1rMF155.
The licence does not apply to:• any images, photographs, trademarks or branding, including the
Victorian Government logo and the DET logo; and• content supplied by third parties.
Authorised by the Department of Education and Training, 2 Treasury Place, East Melbourne, Victoria, 3002.Copyright queries may be directed to [email protected].

3
CONTENTSCONTENTS
MESSAGE FROM OUR EXECUTIVE DIRECTOR ............................................ 4
ABOUT THE REGULATOR ................................................................................................................................... 6
Strategic Objectives ......................................................................................................................................................................... 6Statement of Expectations .................................................................................................................................................. 6Governance framework .............................................................................................................................................................. 7Our Operations .......................................................................................................................................................................................... 7
REGULATORY FRAMEWORK ...................................................................................................................... 10
National Quality Framework .............................................................................................................................................. 10Children’s Services Act 1996 Objectives ........................................................................................................ 11
ABOUT THE SECTOR ...................................................................................................................................................... 12
What We Regulate ................................................................................................................................................................................ 12Education and Care Services Regulated under the NQF ............................................... 13Statistical overview ............................................................................................................................................................................ 14
SECTOR PROFILE ................................................................................................................................................................... 16
Overall quality rating comparisons by care type ......................................................................... 21Centre-Based Care Overview .......................................................................................................................................... 22Case study 1: Kindergarten for three year old children ...................................................... 25Case study 2: Kindergarten Quality Improvement Program ..................................... 26
SUPPORTING THE SECTOR ......................................................................................................................... 34
Enquiries and support ................................................................................................................................................................... 34Quality Assessment and Regulation Update newsletter ................................................. 35Information sessions ........................................................................................................................................................................ 36Early childhood website ............................................................................................................................................................. 36Sector reference groups ............................................................................................................................................................ 37Red-tape reduction ............................................................................................................................................................................ 37Stakeholder Satisfaction Survey ................................................................................................................................ 37Design guidelines ................................................................................................................................................................................... 38Supporting government school Outside School Hours Care programs ... 38School readiness funding and early childhood languages program ......... 38
REGULATORY PERFORMANCE ........................................................................................................... 40
Risk-Based Regulator ..................................................................................................................................................................... 40Applications and Notifications ...................................................................................................................................... 41Assessment and Rating .............................................................................................................................................................. 43Case study 3: Spotlight on Excellence .............................................................................................................. 44Case study 4: A Journey from Working Towards NQS to Exceeding NQS ... 45Monitoring and Compliance ............................................................................................................................................... 46Case study 5: Inappropriate Discipline ........................................................................................................... 47Enforcement .................................................................................................................................................................................................... 47
REFORMS AND INITIATIVES ......................................................................................................................... 48
Education and Care Services National Amendment Regulations 2019 48NQF Review 2019 ...................................................................................................................................................................................... 48Children’s Services Act ................................................................................................................................................................. 50Children’s Services Act and Regulations Review ........................................................................... 50Co-Regulatory Partners ............................................................................................................................................................ 51
GLOSSARY ................................................................................................................................................................................................ 54
DATA TABLES ...................................................................................................................................................................................... 58

INTRODUCTION
2019 closed with some of the most severe bushfires we have seen across Australia in recent times, which continued into early 2020, with some of our communities then impacted by floods. A few months later, Coronavirus (COVID-19) reached Australia.
These events are an illustration of the important role of early childhood education and care services in our communities. These are places not only in which children learn and develop essential skills for life, but also where families connect and build relationships. We continue to work with providers to ensure services remain open and safe for families, wherever possible.
I wish to offer my sincere thanks and appreciation to all educators, service providers and the sector generally for their efforts in maintaining a reliable and assuring presence in these uncertain times. The same sentiment has been expressed by families and communities
across the state, who appreciate the roles played by providers, services and educators. Thank you to the sector for continuing to work with us to operate and provide the high level of quality education and care that Victorian families expect for their children. I also wish to thank the QARD staff for their continual hard work and dedication.
The sector profile continues to evolve. In 2019, the data shows a continued trend for slow but steady increase in private for-profit providers in the market, primarily Long Day Care (LDC) and Outside School Hours Care (OSHC). At the same time, there is a lack of growth in some other areas, such as standalone kindergarten, which may be regarded as declining when compared with population growth. There is a range of factors at play, including some consolidation of small, single-unit provision towards multi-service provision, and an absence of capital investment in the not-for-profit sector. Other market influences include the availability of State funding for kindergarten programs for three-year-old children, Commonwealth Government funding policies designed to support workforce participation, and families seeking comprehensive services that meet their needs efficiently.
MESSAGE FROM OUR EXECUTIVE DIRECTOR
I AM PLEASED TO PRESENT THE QUALITY
ASSESSMENT AND REGULATION DIVISION
ANNUAL REPORT FOR 2019.
4 QARD ANNUAL REPORT 2019

A highlight in 2019 was the reform of the Children’s Services regulatory regime, with a Bill passed by the Victorian Parliament to amend the Children’s Services Act 1996 (CS Act) to align it with the National Quality Framework (NQF), where appropriate. The law reform process continued into 2020. After an extensive consultation with the sector, the Children’s Services Regulations 2020 (CS Regulations) were made, and the revised regulatory regime came into effect on 17 May 2020. Existing services have already seen immediate benefits, such as no longer needing to apply to renew fixed term licences.
Another milestone in 2019 was the making of the Education and Care Services National Amendment Regulations 2019. These amendments ensured the workability of the requirement for a second early childhood teacher or, alternatively, a “suitably qualified person” when 60 or more children preschool age or under are being educated and cared for on a given day, which commenced on 1 January 2020.
The second five-yearly review of the NQF also began in 2019. Sector feedback from consultation over an initial Issues Paper has helped to inform the development of more detailed proposals for change, which are expected to be consulted on in 2021.
As the Victorian Regulatory Authority, we continue to focus on modernising and streamlining our practice of risk-based compliance and enforcement, and on continuing to improve our communication and engagement with the sector.
Madeleine SmithExecutive DirectorQuality Assessment and Regulation Division
QARD ANNUAL REPORT 2019 5

ABOUT THE REGULATOR
STRATEGIC OBJECTIVES
The Quality Assessment and Regulation Division’s (QARD) objectives and strategic plans are informed by broader Department of Education and Training (the Department) objectives and:
• the Department’s strategic intent and strategic plan 2018-2022
• obligations and duties of the regulatory authority under the Education and Care Services National Law Act 2010 (National Law) and the CS Act
• the Statement of Expectations (SoE) from the Minister for Education (the Minister)
• the NQF and CS Act objectives.
STATEMENT OF EXPECTATIONS
The Administration and enforcement of our regulatory framework is guided by the SoE issued by the Minister which, along with the QARD response, was published on the Department’s website in September 2019.
We continually evolve our approach to strengthen regulatory performance to meet the imperative of ensuring the safety, health and wellbeing of children attending early childhood services and improving educational and developmental outcomes. This report outlines our initiatives and regulatory performance against our focus on promoting efficiency and effectiveness in the administration and enforcement of regulation.
6 QARD ANNUAL REPORT 2019
ABOUT THE REGULATOR

GOVERNANCE FRAMEWORK
QARD’s governance framework is designed to ensure accountable and transparent management of regulatory risk, oversight of performance, and engagement of staff in the formulation of regulatory policy and practice.
The Regulatory Risk Committee (RRC) was established in 2018 to strengthen oversight and monitoring of regulatory risk and performance. The RRC is supported by the Policy and Practice Committee (PPC) and the People and Culture Committee (PaCC). The two Communities of Practice, Investigations and Assessment and Rating, focus on improving process efficiency and consistency.
OUR OPERATIONS
Part of the Early Childhood Education Group (ECE) of the Department of Education and Training Victoria, QARD regulates services operating under the NQF and the CS Act and CS Regulations in Victoria under delegation from the Secretary. QARD is comprised of three centrally-managed branches and nine regional teams:
QUALITY ASSESSMENT AND REGULATION DIVISION OBJECTIVES
Confidence in the regulator: Effective administration of our legislative frameworks to maintain community confidence in the system of regulation overseeing the provision of Victorian early childhood education and care.
Being a high-performing regulator: Exemplifying best regulatory practice to efficiently deliver regulatory outcomes.
Engaging with the sector: Engaging and guiding services to facilitate the provision of high-quality education and care services.
Supporting reforms and initiatives: Being responsive to government reforms and initiatives, and community priorities.
Excellent workforce: Developing a high-performing, valued and empowered workforce.
7QARD ANNUAL REPORT 2019

QARD REGIONAL AREAS
Executive Director
Director, Operations
Manager, Operations
Assistant Manager
Manager, Service Quality
& Legislation
Manager, Monitoring & Compliance
Manager, Consistent Practice &
Support
Manager, Systems
Administration & Performance
Manager, Early Childhood
Legislative Reform
Manager, Investigations
Manager, Service
Administration & Support
Manager, Business
Systems & Review
South-Western RegionNorth-Western Region
Manager, Loddon
Mallee Area
Manager, Northern
Metro Area
South-Eastern Region
Manager, Barwon
South West Area
Manager, Grampians
Area
Manager, Western
Metro Area
North-Eastern Region
Manager, Hume Area
Manager, Eastern
Metro Area
Assistant Manager
Manager, Gippsland
Area
Manager, Southern
Metro Area
Assistant Manager
ABOUT THE REGULATOR
8 QARD ANNUAL REPORT 2019

Service Quality and Legislation Branch
Monitoring and Compliance Unit (MCU): manages and supports matters involving significant non-compliance and supports appropriate enforcement action.
Consistent Practice and Support Unit (CPSU): monitors and supports the assessment and rating process and the training of authorised officers.
Systems Administration and Performance Branch
Service Administration and Support Unit (SASU): provides a first point of contact for prospective, new and existing providers of early childhood services through the administration and assessment of applications, notifications of change of circumstances, and assesses applicants’ fitness and propriety.
Business Systems and Review Unit (BSRU): maintains QARD’s information management, provides user support, undertakes systems improvement, reporting, data analytics, business planning, budget planning, risk assurance and governance, stakeholder engagement and communications functions.
Executive
Legislative Reform Unit (LRU): provides legislative policy advice and support on the National Law and National Regulations (where Victoria is the host jurisdiction) and the CS Act and CS Regulations.
Investigations Unit (INVU): leads and manages serious and complex investigations. The unit conducts investigative planning, provides advice and recommendations on investigations, sanctions and other compliance matters. The unit also prepares and provides training and development material to support authorised officers in their regulatory functions.
Operations Branch
Located in four regions, the Operations Branch manages and supports nine area-based regional teams. The teams comprise authorised officers and support staff who assess and rate NQF services against the NQS, conduct inspections to monitor compliance with regulatory requirements and investigate alleged non-compliances. Regional teams engage with the sector through forums and other opportunities to support and guide providers of early childhood services.
QARD Regional Teams:
North-Western Victoria
• Loddon Mallee
• Northern Metropolitan
South-Western Victoria
• Barwon South West
• Grampians
• Western Metropolitan
North-Eastern Victoria
• Eastern Metropolitan
• Hume
South-Eastern Victoria
• Gippsland
• Southern Metropolitan
Wimmera South West4DET Regions
9QARD regional teams across Victoria
9
ABOUT THE REGULATOR
QARD ANNUAL REPORT 2019
REGULATORY FRAMEWORK
We are responsible for the approval, and regulation of almost 4,600 early childhood services in Victoria. We regulate providers of early childhood services in Victoria with the objective of driving continuous improvement of quality in the provision of education and care.
The Department’s regulatory functions are established by the National Law, the Education and Care Services National Regulations 2011 (National Regulations), the CS Act and CS Regulations.
As the regulatory authority for Victoria under the National Law, and the regulatory authority under the CS Act, the Secretary of the Department of Education and Training Victoria (the Department) has delegated this responsibility to staff members of QARD.
NATIONAL QUALITY FRAMEWORK
The NQF promotes high quality education and care services through a legislative framework which comprises:
• National Law
• National Regulations
• National Quality Standard (NQS).
Administratively, responsibility for implementing and administering the NQF is shared between State Regulatory Authorities and the National Authority, the Australian Children’s Education and Care Quality Authority (ACECQA).
Of the almost 4,600 early childhood services in Victoria at the end of 2019, 4,200 were education and care services approved under the NQF.
10 QARD ANNUAL REPORT 2019
REGULATORY FRAMEWORK

NATIONAL QUALITY FRAMEWORK OBJECTIVES
• Ensure the safety, health and wellbeing of children attending education and care services.
• Improve educational and developmental outcomes for children attending education and care services.
• Promote continuous improvement in the provision of quality education and care services.
• Reduce the regulatory and administrative burden for education and care services by enabling information to be shared between participating jurisdictions.
• Improve public knowledge, and access to information, about the quality of education and care services.
• Establish a system of national integration and shared responsibility between participating jurisdictions in the administration of the NQF.
CHILDREN’S SERVICES ACT 1996 OBJECTIVES
Amendments to the CS Act in 2019 aligned that Act with the National Law, where appropriate. Notably, the amendments introduced objectives into the CS Act that are identical to the first three objectives of the NQF.
This establishes a clear expectation that the Children’s Services regulatory regime is designed to promote high quality children’s services.
Just over 300 early childhood services in Victoria were children’s services approved under the CS Act.
11QARD ANNUAL REPORT 2019

ABOUT THE SECTOR
WHAT WE REGULATE
Our regulatory approaches are designed to facilitate and motivate service providers to provide high quality services that ensure the safety, health and wellbeing of children and improve children’s educational and developmental outcomes.
Victoria’s early childhood education sector plays a significant role in contributing to a harmonious, healthy and prosperous society.
The foundations for long-term development are laid in the early years, where children develop crucial cognitive and emotional skills such as reasoning, problem solving, and how to get along with others. The pivotal time for the development of vision, emotional control and language is before the age of three, and the development of social skills is before the age of six. These and other important skills such as creativity, resilience and communication are enhanced through participation in high quality early childhood education.
QARD ANNUAL REPORT 2019
ABOUT THE SECTOR
12

EDUCATION AND CARE SERVICES REGULATED UNDER THE NQF
CENTRE-BASED CARE:
Delivered on premises suitable for education and care, including:
Kindergarten/Pre-School:
• Program for young children delivered by qualified early childhood teachers.
• Children go to a kindergarten program in the year before starting school, usually when they are four years old.
• Some services also offer kindergarten programs for three-year-old children.
• The kindergarten program for three-year-old children is being progressively expanded in Victoria.
Long Day Care:
• Delivered by early childhood teachers and diploma level-qualified educators.
• Primarily aimed at children aged 0–6 years of age.
• Most often part-time or full-time education and care programs which are created around the developmental needs, interests and experiences of each child.
Outside School Hours Care:
• Usually located at or close to primary schools.
• Care provision for primary school aged children (typically 5 to 12 years) outside school hours and during school vacations.
• Education and care may also be provided on student free days and school holidays.
FAMILY DAY CARE:
• Program is based on the developmental needs, interests, and experiences of each child.
• Can be provided to children from birth through to school age.
• Generally provided in the educator’s own home.
• May be available overnight/weekends for families who are on-call or work shifts.
QARD ANNUAL REPORT 2019 13

STATISTICAL OVERVIEW
1,733 approved providers operating NQF services in Victoria
280 providers operate more than one service
1,453 single-service provider
410,000 children attending NQF services
188,000 children in centre-based care (long day care)
28,000 children in kindergarten (long day care settings)
52,000 children in kindergarten (all other settings)
106,000 children in outside school hours care (including vacation care)
36,000 children in family day care
4,546 approved early childhood services in Victoria
4,043 centre-based services
186 family day care services
317 CS Act services
280,416 approved early childhood places in Victoria
272,414 for centre-based services
8,002 under the CS Act
14 QARD ANNUAL REPORT 2019
ABOUT THE SECTOR

Table 1: Number of approved CS Act services and places, 2013-2019
2013 2014 2015 2016 2017 2018 2019
Services 457 453 430 406 379 358 317
Places 11,248 11,078 10,569 10,103 9,516 9,140 8,002
CHILDREN’S SERVICES REGULATED UNDER THE CHILDREN’S SERVICES ACT 1996
Children’s services regulated under the CS Act are excluded from regulation under the NQF. While the scope of early childhood services regulated under the CS Act did not change, the children’s services law reform made changes to service licensing/approval categories, with effect from 17 May 2020. The list below relates to the service types and licence categories that existed in 2019. All children’s services provide centre-based care.
STANDARD SERVICE• Provides care or education
for each child for more than 5 hours per day or more than 15 hours per week. Can be an early childhood intervention service, an occasional care service, a mobile service or a budget-based service.
OCCASIONAL CARE• Provides care primarily on an ad
hoc or casual basis which is not usually full-time, all day or on an ongoing basis.
• Most of the children are not school children.
LIMITED HOURS SERVICE• Type 1: Each child is cared for or
educated for not more than two hours a day and not more than a total of six hours a week.
• Type 2: Each child is cared for or educated for not more than five hours a day and not more than a total of 15 hours a week. e.g. A children’s service operating at a sport and leisure facility or a neighbourhood house (typically known as occasional care).
15QARD ANNUAL REPORT 2019
ABOUT THE SECTOR

SECTOR PROFILE
At the end of 2019 there were 4,546 early childhood education and care services in Victoria providing 280,416 approved places.
Overall, there has been a small net decline in the number of approved services in the early childhood sector, with 21 fewer services than in 2018. This can be attributed to the continuing decline in the number of approved family day care services. While there has been a decline in the number of services, there has been continued growth in the number of places available as can be seen in Figure 1 below.
Figure 1: Number of approved ECEC services and places, 2013-2019
5,000
4,500
4,000
3,500
3,000
2,500
2,000
1,500
1,000
500
0
300,000
250,000
200,000
150,000
100,000
50,000
02013 2014 2015 2016 2017 2018 2019
Services (LHS) Places (RHS)
TO
TA
L N
UM
BE
R O
F A
PP
RO
VE
D S
ER
VIC
ES
TO
TA
L N
UM
BE
R O
F A
PP
RO
VE
D P
LA
CE
S
4,2654,381 4,457 4,514 4,612 4,567
212,057220,721 228,856
241,748257,659
268,682 4,546
280,416
Note: ‘Places’ only relates to centre-based services and services regulated under the CS Act. Places data for FDC services is not collected. The number of places reflects services’ approved or licensed capacity.
4,546 early childhood education and
care services were available in Victoria
at the end of 2019, providing 280,416 approved places
16 QARD ANNUAL REPORT 2019
SECTOR PROFILE

Approved places at a centre-based service is the maximum number of children that can be educated and cared for by the service at any one time. Some services, like kindergartens, may also operate multiple daily sessions, so while approved for 60 places, they may operate twice daily for a total of 120 children.
In 2019, 74 per cent of new approved places under the NQF were provided in LDC. Family day care services are not limited to a specific number of approved places, but instead each family day care educator employed by a service is able to educate and care for up to seven children at one residence depending on the ages of the children. The average family day care service employs around 40 educators.
Figure 2: Number of new NQF services and places, 2013–2019
300
250
200
150
100
50
0
20,00018,00016,00014,00012,00010,0008,0006,0004,0002,0000
2013 2014 2015 2016 2017 2018 2019
Services (LHS) Places (RHS)
NU
MB
ER
OF
NE
W S
ER
VIC
ES
NU
MB
ER
OF
NE
W P
LA
CE
S
251
214 224
7,3768,293
9,664
198
11,767
233
17,623
204
14,303
192
15,817
Note: Number of new services refers to services approved in that year and excludes services suspended, surrendered or cancelled in the same year.
74% of new approved places under the NQF were provided in Long Day Care
17QARD ANNUAL REPORT 2019

The number of new NQF services entering the Victorian market continues to grow although at a slower rate than in past years, as the trend has been for increased places at existing services. In 2019, a total 192 new services received approval to operate and provide 15,817 additional places for children.
Figure 3: Number of approved NQF services by care type, 2013–2019
1,800
1,600
1,400
1,200
1,000
800
600
400
200
02013 2014 2015 2016 2017 2018 2019
LDC KGN OSHC FDC
NU
MB
ER
OF
AP
PR
OV
ED
SE
RV
ICE
S
1,220 1,244 1,2801,342
1,457
1,211 1,197 1,197 1,203 1,205
1,110 1,148 1,168 1,192
1,224
267339 382 371 347
1,520
1,194
1,247
248
1,607
1,186
1,250
186
SECTOR PROFILE
QARD ANNUAL REPORT 201918

Figure 4: Number of approved services
by care type, 2019
Figure 5: Number of centre-based places
by care type, 2019
Long day care
Outside school hours care
Kindergarten
Children’s Services Act
Family Day Care
Long day care
Outside school hours care
Kindergarten
Children’s Services Act
35%1,607
28%1,250
26%1,186
7%317
4%186
50%140,255
29%81,086
18%51,073
3%8,002
Note: ‘Places’ only relates to centre-based services and services regulated under the CS Act. Places data is not collected for FDC services. The number of places reflects services’ approved or licensed capacity.
For NQF services, private for profit is the largest single entity type, operating 2,022 (48 per cent) of NQF services as can be seen in Figure 4. Of these, 1,407 (70 per cent) are run by multi-service providers, many of whom have services in other jurisdictions. Private for-profit type providers continue to grow steadily as a proportion of the sector.
QARD ANNUAL REPORT 2019
SECTOR PROFILE
19

Table 2: Number of approved services and places by care type, 2019
Care type Approved services Approved places
Total 4,546 280,416
NQF 4,229 272,414
Centre-Based Care 4,043 272,414
Long day care 1,607 140,255
Kindergarten 1,186 51,073
Outside school hours care 1,250 81,086
Family Day Care 186 -
CS Act 317 8,002
Note: ‘Places’ only relates to centre-based services and services regulated under the CS Act. Places data is not collected for FDC. The number of places reflects services’ approved or licensed capacity.
The data in table 2 shows a continued trend for slow but steady increase in private for-profit providers across both the NQF and the CS services. There is a growth in LDC and OSHC services, which is not seen in other care types such as standalone kindergarten. Some kindergartens run as stand-alone services (for example, community kindergartens). Other kindergarten programs are run through long day care centres or schools.
Figure 6: Number of approved NQF services by provider management type, 2019
49%/51% 131
Multi-service provider Single-service provider
0 500 1,000 1,500 2,000
Catholic school
Government school
Independent school
Local government
Not for profit community managed
Not for profit other
Private for profit
15%/85% 26
70%/30% 2,022
58%/42% 1,074
95%/5% 386
93%/7% 346
7%/93% 244
Note: ’Multi-service providers’ refers to providers that provide more than one service nationally.
SECTOR PROFILE
20 QARD ANNUAL REPORT 2019

OVERALL QUALITY RATING COMPARISONS BY CARE TYPE
One objective of the NQF is to promote continuous improvement in the provision of quality education and care services.
The introduction of the requirement for services to deliver a program based on an approved learning framework has raised the benchmark for educational programs and practice. Over time we have witnessed a steady increase of services achieving Meeting NQS rating in Victoria, improving from 46 per cent in 2015 to 53 per cent in 2019.
Quality Area 1: Educational program and practice is one of the most challenging quality areas for education and care services to meet. Nationally 85 per cent of services received a rating that was Meeting NQS or above. The relatively stronger performance of Victorian services in Quality Area 1 of 90 per cent Meeting NQS or above can be attributed to the stronger performance of kindergartens and their historical focus on educational programs and practice delivered by early childhood teachers. 29 per cent of Victorian services across all care types were rated Exceeding NQS in Quality Area 1 in 2019.
Figure 7: Overall quality ratings by care type and rating level, 2019
Significant improvement required Working towards NQS Meeting NQS Exceeding NQS Excellent
NU
MB
ER
OF
SE
RV
ICE
S W
ITH
A R
AT
ING
3,989
1,499
1,163
1,173
154
All services
LDC
KGN
OSHC
FDC
0% 20% 40% 60% 80% 100%
32%53%15%
27%57%15%
61%33%6%
13%68%19%
10%36%54% PR
OP
OR
TIO
N O
F R
AT
ING
S M
EE
TIN
G
NQ
S O
R A
BO
VE
85%
85%
94%
81%
46%
Victoria is performing well compared to other jurisdictions on a national basis with 85 per cent of all care types receiving a rating of Meeting NQS or above (see Figure 7). Kindergartens again lead with 61 per cent receiving the highest possible rating, Exceeding NQS.
Figure 8: Overall quality ratings by rating level, 2015–2019
60%
50%
40%
30%
20%
10%
0
2015 2016 2017 2018 2019
Significant improvement
required
Working towards NQS
Meeting NQS Exceeding NQS Excellent Total services with an NQS rating
3,9
89
3,9
30
3,9
08
3,79
2
3,4
0720
%
15%
16%18%
15%
46
% 51%
49
%
48
% 53%
33
%
33
%
34
%
34
%
32%
0.2
%
0.2
%
0.3
%
0.2
%
0.3
%
0%
0%
0.2
%
0.4
%
0%
Overall, there has been a steady increase in the number of all services receiving a rating of Meeting NQS since 2015, and a corresponding decrease in those receiving a rating of Working Towards NQF as can be seen in Figure 8.
21QARD ANNUAL REPORT 2019
SECTOR PROFILE

CENTRE-BASED CARE OVERVIEW
Long Day Care
The LDC sector makes up the largest component (38 per cent) of services under the NQF, offering half (51 per cent) of NQF approved childcare places in Victoria. Most LDC services (79 per cent) are funded to provide a kindergarten program.
Table 3: Number of new centre-based services approved within each year by care type, 2013–2019
Care type 2013 2014 2015 2016 2017 2018 2019
Long Day Care 93 97 79 98 104 105 112
Kindergarten 48 51 58 51 44 50 48
Outside School Hours Care 47 45 47 52 60 53 51
There has been steady growth in the number of approved private for profit LDC services (see Figure 9) and the number of approved places in LDC as a result (see Figure 10).
Figure 9: Number of approved LDC services, 2013–2019 Figure 10: Number of approved LDC places (rounded), 2013–2019
1000
800
600
400
200
0
Not for profit Private for profit Other
NU
MB
ER
OF
AP
PR
OV
ED
SE
RV
ICE
S
2013 2014 2015 2016 2017 2018 2019
635
760700
666
854917
445 453452443470 475
140 129128135 133 128
90,000
80,000
70,000
60,000
50,000
40,000
30,000
20,000
10,000
0
Not for profit Private for profit Other
NU
MB
ER
OF
AP
PR
OV
ED
PL
AC
ES
2013 2014 2015 2016 2017 2018 2019
48,300
62,500
55,40052,200
72,100
79,700
33,100 35,10034,50033,40037,700 38,700
10,100 10,0009,8009,900 10,500 10,300
1,005
474
128
89,900
39,300
11,100
SECTOR PROFILE
22 QARD ANNUAL REPORT 2019

Long Day Care quality rating
Figure 11: Number and proportion of LDC services with quality ratings at the end of the year,
by rating level 2015-2019
60%
50%
40%
30%
20%
10%
0
2015 2016 2017 2018 2019
Significant improvement
required
Working towards NQS
Meeting NQS Exceeding NQS Excellent Total services with an NQS rating
1,4
99
1,4
12
1,319
1,24
6
1,156
19%
15%
13%15%
15%
51% 54
%
54%
52% 57
%
30
%
30
%
32%33
%
27%
0.5
%
0.4
%
0.5
%
0.5
%
0.4
%
0%
0%
0%
0%
0%
The quality ratings of LDC services have remained stable, with the vast majority rated Meeting NQS in Victoria, followed by services rated Exceeding NQS.
Figure 12: Overall LDC quality ratings by provider management type and rating level, 2019
Significant improvement required Working towards NQS Meeting NQS Exceeding NQS Excellent
NU
MB
ER
OF
SE
RV
ICE
S W
ITH
A R
AT
ING 1,499
29
5
90
465
910
All LDC
Catholic/Independent school
Government school
Local government
Not for profit
Private for profit
0% 20% 40% 60% 80% 100%
PR
OP
OR
TIO
N O
F R
AT
ING
S M
EE
TIN
G
NQ
S O
R A
BO
VE
85%
97%
60%
92%
91%
81%
20%
76%21%
20%20%40%
58%34%8%
38%52%9%
17%64%19%
27%57%15%
3
As seen in Figure 12, a large portion of local government and school operated services have a high proportion of services that are rated Exceeding NQS.
QARD ANNUAL REPORT 2019
SECTOR PROFILE
23

Kindergarten
The standalone kindergarten (KGN) sector in Victoria has been stable over time. The sector is almost exclusively operated by not-for-profit and local government managed providers (89 per cent of all services as at 2019). Of these, 70 per cent of services are managed by providers that operate more than one kindergarten service.
Victoria regulates the highest number of standalone kindergartens across Australia, with 1,200 approved services at the end of 2019, compared with New South Wales (768 services), Queensland (512 services) and South Australia (407 services).
Figure 13: Number and proportion of kindergarten services with quality ratings at the end of the year,
by rating level, 2015–2019
0.2
%
0.3
%
0.3
%
0.2
%
0.3
%
60%
50%
40%
30%
20%
10%
0
2015 2016 2017 2018 2019
Significant improvement
required
Working towards NQS
Meeting NQS Exceeding NQS Excellent Total services with an NQS rating
1,16
3
1,16
8
1,183
1,173
1,14
4
10%
7%6%7% 6%
39
%
34
%
36
%
38
%
33
%
51%
59%
58%
55% 6
1%
0%
0%
0%
0%
0%
Kindergarten services have the highest quality ratings compared with other service types, in both Victoria and nationally. The vast majority (94 per cent) of services in Victoria had a rating of Meeting NQS or above at the end of 2019 (see Figure 7).
Kindergarten services tend to have a higher proportion of services rated Exceeding NQS compared to other service types.
Almost all rated kindergarten services are Meeting NQS or Exceeding NQS in the quality areas related to Physical Environment (Quality Area 3) and Collaborative Partnerships with Families and Communities (Quality Area 6).
Services that receive funding to provide 4-year-old kindergarten programs (including services that provide LDC) perform better in Quality Area 1 Educational Program and Practice and Quality Area 7 Governance and Leadership, compared with LDC and kindergarten services that do not receive this funding.
SECTOR PROFILE
24 QARD ANNUAL REPORT 2019

Figure 14: Overall kindergarten quality ratings by provider management type and rating level, 2019
Significant improvement required Working towards NQS Meeting NQS Exceeding NQS Excellent
NU
MB
ER
OF
SE
RV
ICE
S W
ITH
A R
AT
ING 1,163
83
36
238
799
7
All KGN
Catholic/Independent school
Government school
Local government
Not for profit
Private for profit
0% 20% 40% 60% 80% 100%
PR
OP
OR
TIO
N O
F R
AT
ING
S M
EE
TIN
G
NQ
S O
R A
BO
VE
94%
96%
60%
83%
95%
86%
75%20%
39%44%17%
65%29%6%
59%35%5
43%43%14%
61%33%6%
4
Within the high-performing kindergarten care type, kindergarten programs operated by Catholic or independent schools performed the best, with 75 per cent receiving ratings of Exceeding NQS and 96 per cent receiving a rating of Meeting NQS or above. This is even stronger than local government operated services with 75 per cent receiving Exceeding NQS ratings.
CASE STUDY 1: KINDERGARTEN FOR THREE YEAR OLD CHILDREN
The Grampians team worked closely with several approved providers located across three local government areas in the Wimmera, to help services to prepare to implement the new three-year-old funded kindergarten program in 2020. This involved attending staff meetings, participating in working groups and forums, visiting services and providing advice and support. The team provided advice about operational models that would efficiently meet regulatory outcomes, be responsive to community needs and meet the government reform initiative targets.
The Grampians team also worked closely and collaboratively with two providers in Warracknabeal to create a new shared model or care. The Yarriambiack Shire was approved to provide a four-year-old kindergarten program, and Uniting Victoria and Tasmania Ltd was approved to provide a LDC service. With QARD’s help, both providers moved to operate from a council owned community facility that met the needs of the community by:
• ensuring the building premises and play space meet the National Law and National Regulations
• facilitating a collaborative process which resulted in the existing LDC and three-year-old programs being delivered across shared premises, including shared use of the outdoor spaces
• meeting the community need for the provision of 15 hours of three-year-old kindergarten
• an ‘after kindergarten care’ component through the LDC program.
Yarriambiack Shire will apply for a children’s services capital grant for an additional room in 2021.
25QARD ANNUAL REPORT 2019
SECTOR PROFILE

CASE STUDY 2: KINDERGARTEN QUALITY IMPROVEMENT PROGRAM
The Kindergarten Quality Improvement Program provided the Quality Assessment and Regulation Division with the opportunity for multi-agency collaboration to improve outcomes for services that were rated as Working Towards NQS.
A kindergarten in the Southern Metropolitan area is an example of a service achieving successful outcomes through this multi-agency collaboration. This kindergarten was managed by an Incorporated Committee of Management and provided three and four-year-old kindergarten to a culturally diverse community that often experienced high levels of vulnerability.
The service had a history of being unable to meet the minimum requirements of the Education and Care Services National Law and Regulations. The service received an overall rating of Working Towards NQS in 2013 and 2016, and in Quality Area 7, Governance and Leadership both years.
In July 2018, the service joined Phase 1 of the Kindergarten Quality Improvement Program, focussing on Quality Area 7, Governance and Leadership. The service actively participated in this program, improving their service philosophy, reviewing their Quality Improvement Plan and engaging with professional development to support the management of the service. The Regulatory
Authority provided continued support to the service through their regulatory functions and communicated regularly with the Kindergarten Quality Improvement Program mentor.
In June 2019, the service participated in Phase 2 of the Kindergarten Quality Improvement Program, focussing on Quality Area 1, Educational Program and Practice. The Educational Leader was supported by the program’s mentor, providing professional development, coaching and professional reading in order to implement positive changes to educators’ practice and program documentation.
In November 2019, the service achieved an overall rating of Meeting NQS, attributing their success to the support they received from the Kindergarten Quality Improvement Program and the Regulatory Authority.
The collaboration of organisations with a focussed goal of improving outcomes for children resulted in positive changes in a service and improved practices for individuals within the service environment.
Monitoring and support from QARD, intertwined with the professional development, coaching and support from the Kindergarten Quality Improvement Program equipped mentors with the tools required to create a positive change. A wide range of risk factors were able to be addressed and this, in turn, contributed to better outcomes for children.
26 QARD ANNUAL REPORT 2019
SECTOR PROFILE

Outside School Hours Care
There is a trend toward schools engaging third party providers to deliver their OSHC programs. The main operators in Victoria are private for-profit providers with 866 services. Multi-service, private for-profit providers manage two-thirds (69 per cent) of OSHC services, while government schools only managed 16 per cent of these services in 2019.
Figure 15: Number of approved OSHC services, 2013–2019 Figure 16: Number of approved OSHC places (rounded),
2013–2019
1000
800
600
400
200
0
Government school Local government
Private for profit Other
NU
MB
ER
OF
AP
PR
OV
ED
SE
RV
ICE
S
60,000
50,000
40,000
30,000
20,000
10,000
0
Government school Local government
Private for profit Other
NU
MB
ER
OF
AP
PR
OV
ED
PL
AC
ES
2013 2014 2015 2016 2017 2018 20192013 2014 2015 2016 2017 2018 2019
540
728684
626
785834
303250264281
235 218201181181191
174 173
66333950 30 22
32,500
45,90041,800
37,800
49,90053,900
16,600 15,80016,00016,300 15,500 14,60011,700 10,60010,50011,100 10,500 10,300
3,8002,0002,3002,900 1,800 1,500
866
201
162
21
56,000
13,900
9,800
1,400
27QARD ANNUAL REPORT 2019
SECTOR PROFILE
Outside School Hours Care quality rating
Figure 17: Number and proportion of OSHC services with quality ratings at the end of the year,
by rating level, 2015–2019
0%
0%
0%
0%
0%
60%
50%
40%
30%
20%
10%
0
2015 2016 2017 2018 2019
Significant improvement
required
Working towards NQS
Meeting NQS Exceeding NQS Excellent Total services with an NQS rating
1,173
1,152
1,126
1,09
5
931
29%
18%20
%25%
19%
53%
67%
64
%
58%
68
%
18%
15%17%
17%
13%
0%
0%
0.1%
0%
0%
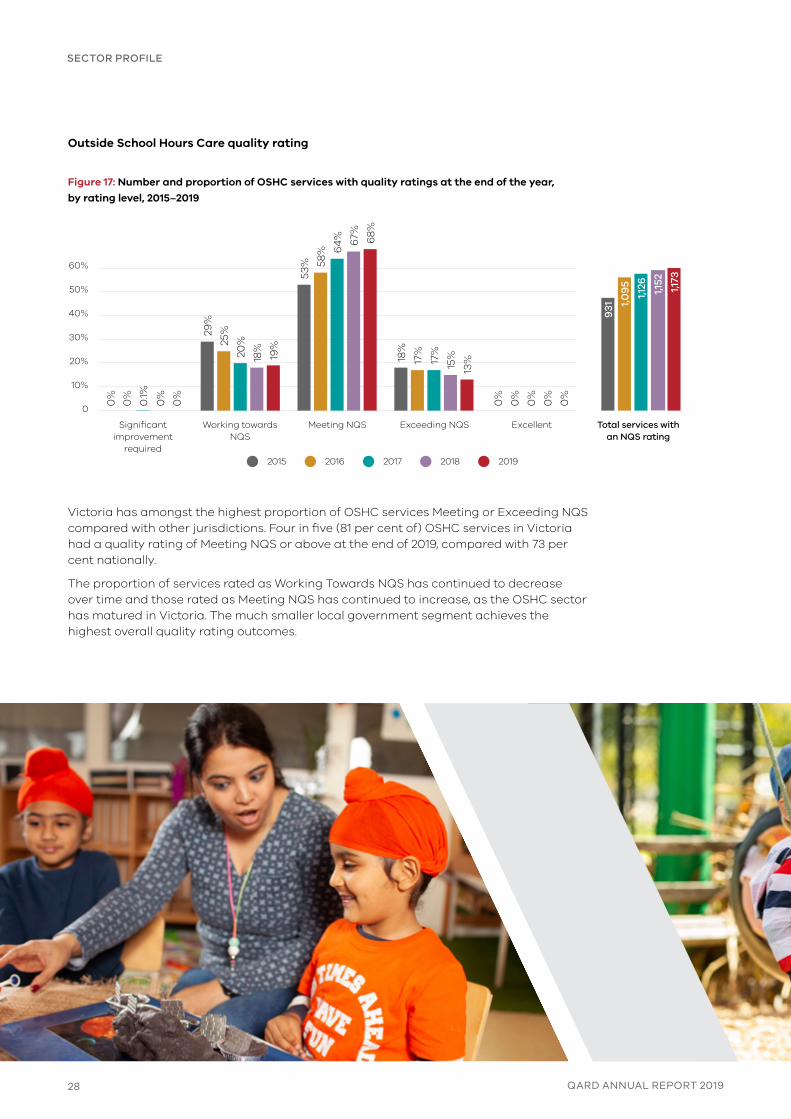
Victoria has amongst the highest proportion of OSHC services Meeting or Exceeding NQS compared with other jurisdictions. Four in five (81 per cent of) OSHC services in Victoria had a quality rating of Meeting NQS or above at the end of 2019, compared with 73 per cent nationally.
The proportion of services rated as Working Towards NQS has continued to decrease over time and those rated as Meeting NQS has continued to increase, as the OSHC sector has matured in Victoria. The much smaller local government segment achieves the highest overall quality rating outcomes.
SECTOR PROFILE
28 QARD ANNUAL REPORT 2019

Figure 18: Overall OSHC quality ratings by provider management type and rating level, 2019
Significant improvement required Working towards NQS Meeting NQS Exceeding NQS Excellent
NU
MB
ER
OF
SE
RV
ICE
S W
ITH
A R
AT
ING 1,173
39
198
19
113
804
All OSHC
Catholic/Independent school
Government school
Local government
Not for profit
Private for profit
0% 20% 40% 60% 80% 100%
PR
OP
OR
TIO
N O
F R
AT
ING
S M
EE
TIN
G
NQ
S O
R A
BO
VE
81%
69%
65%
95%
70%
86%
13%56%
16%49%35%
26%68%5
10%60%30%
12%74%14%
13%68%19%
31%
In particular, Victorian OSHC services have performed better than the national OSHC average in the following quality areas:
• Quality Area 6 Collaborative partnerships with families and communities – Ninety-seven per cent (97%) of rated services Meeting or Exceeding NQS compared with 90 per cent nationally
• Quality Area 3 Physical environment – Ninety-four per cent (94%) of rated services Meeting or Exceeding NQS compared with 87 per cent nationally
• Quality Area 1 Educational program and practice – Eighty-eight per cent (88%) of rated services Meeting or Exceeding NQS compared with 80 per cent nationally.
Larger approved providers of OSHC have indicated that the predominantly part-time and transient workforce can create challenges in staff retention. This can affect quality in the sense that educators require time to understand each child’s individual needs and may be less likely to form enduring relationships with the community and families.
SECTOR PROFILE
29QARD ANNUAL REPORT 2019
Family day care
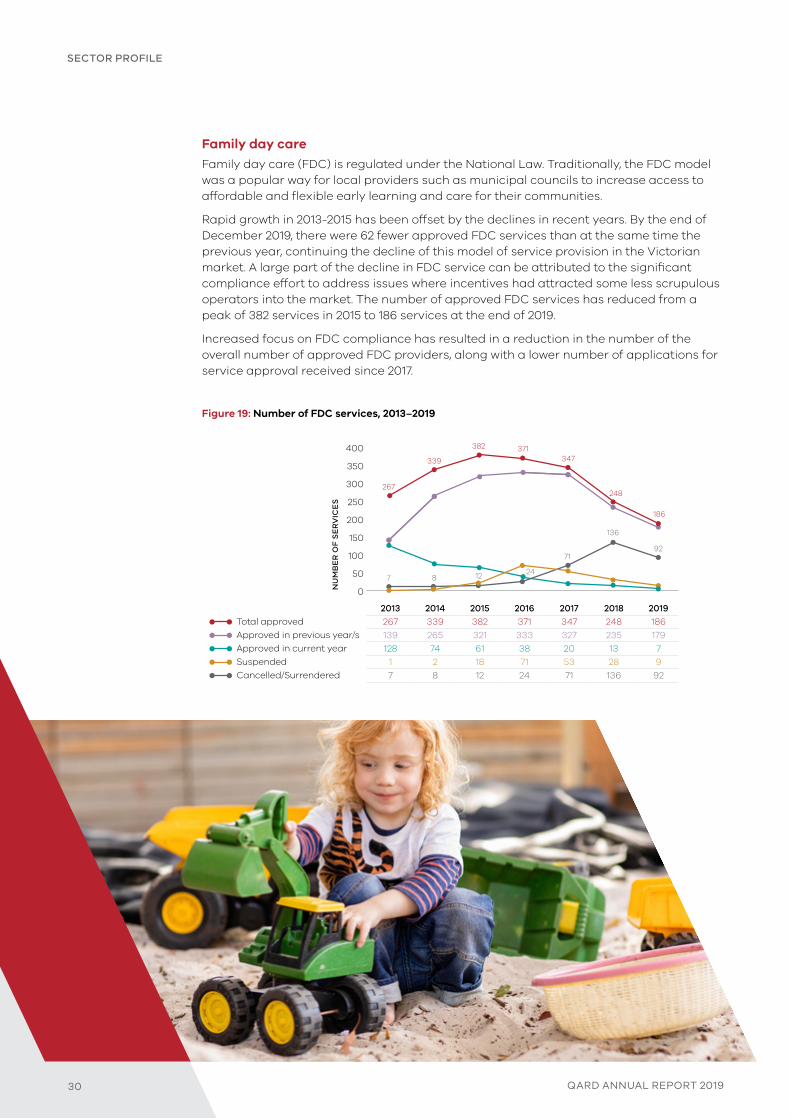
Family day care (FDC) is regulated under the National Law. Traditionally, the FDC model was a popular way for local providers such as municipal councils to increase access to affordable and flexible early learning and care for their communities.
Rapid growth in 2013-2015 has been offset by the declines in recent years. By the end of December 2019, there were 62 fewer approved FDC services than at the same time the previous year, continuing the decline of this model of service provision in the Victorian market. A large part of the decline in FDC service can be attributed to the significant compliance effort to address issues where incentives had attracted some less scrupulous operators into the market. The number of approved FDC services has reduced from a peak of 382 services in 2015 to 186 services at the end of 2019.
Increased focus on FDC compliance has resulted in a reduction in the number of the overall number of approved FDC providers, along with a lower number of applications for service approval received since 2017.
Figure 19: Number of FDC services, 2013–2019
267
400
350
300
250
200
150
100
50
0NU
MB
ER
OF
SE
RV
ICE
S
371382
339 347
248
2013 2014 2015 2016 2017 2018 2019
Total approved 267 339 382 371 347 248 186
Approved in previous year/s 139 265 321 333 327 235 179
Approved in current year 128 74 61 38 20 13 7
Suspended 1 2 18 71 53 28 9
Cancelled/Surrendered 7 8 12 24 71 136 92
724128
71
136
186
92
SECTOR PROFILE
30 QARD ANNUAL REPORT 2019

Family day care quality ratings
Comparatively, sections of the FDC sector have experienced challenges achieving the quality of service provision set by the NQS. However, indications of improving quality can be seen with gradual increases to proportions of FDC services with a Meeting NQS rating (and declines in the Working Towards NQS rating).
Figure 20: Number and proportion of FDC services with overall quality ratings at the end of the
calendar year, by rating level, 2015–2019
60%
50%
40%
30%
20%
10%
0
2015 2016 2017 2018 2019
Significant improvement
required
Working towards NQS
Meeting NQS Exceeding NQS Excellent Total services with an NQS rating
154
198
280
278
176
49
%
57%60
%
55%
54%
30
%
31%
25%27%
36
%
21%
12%
11%12%
10%
0%
0%
0%
0%
0%
0%
0%2.
9%
5.4
%
0.5
%
The 30 local government operated FDC services with a quality rating in 2019 significantly out-performed those operated by the private for profit management type on their quality rating outcomes, with 73 per cent of local government operated FDC Meeting or above NQS compared to 37 per cent of private for profit operated FDC. The introduction of the NQS produced scope for improved oversight and support within FDC to achieve better compliance and quality across the whole sector.
Figure 21: Overall FDC quality ratings by provider management type and rating level, 2019
Significant improvement required Working towards NQS Meeting NQS Exceeding NQS Excellent
NU
MB
ER
OF
SE
RV
ICE
S
WIT
H A
RA
TIN
G
154
30
14
110
All FDC
Local government
Not for profit
Private for profit
0% 20% 40% 60% 80% 100%
PR
OP
OR
TIO
NS
OF
RA
TIN
GS
M
EE
TIN
G N
QS
OR
AB
OV
E
46%
73%
57%
37%
10%36%54%
37%37%27%
7%50%43%
35%63%
There remain broader quality issues with FDC services. As at 31 December 2019, 54 per cent of services did not meet NQS, down from 58 per cent in 2018. The percentage of rated FDC services with a Significant Improvement Required (SIR) rating decreased from three per cent (3%) in 2017, to less than one per cent (0.5%) in 2018, and zero (0%) in 2019, further demonstrating the significant work that QARD has undertaken to improve the integrity and quality of the FDC sector.
31QARD ANNUAL REPORT 2019
SECTOR PROFILE

Overall rating comparisons by provider type – all service types
Local government and school providers operate one in five services. The not for profit sector is a major provider of kindergarten services, which historically have performed better compared to other care types. Lower quality ratings in the private sector reflect recent service growth in LDC and OSHC as well as the private sector being the main provider of FDC services.
Figure 22: Overall quality ratings by provider management type and rating level, 2019
Significant improvement required Working towards NQS Meeting NQS Exceeding NQS Excellent
NU
MB
ER
OF
SE
RV
ICE
S W
ITH
A R
AT
ING 3,989
151
239
377
1,391
1,831
All services
Catholic/Independent school
Government school
Local government
Not for profit
Private for profit
0% 20% 40% 60% 80% 100%
PR
OP
OR
TIO
N O
F R
AT
ING
S M
EE
TIN
G
NQ
S O
R A
BO
VE
85%
89%
68%
92%
91%
81%
59%30%
20%48%32%
59%33%8%
48%43%9%
14%67%19%
32%53%15%
11%
SECTOR PROFILE
32 QARD ANNUAL REPORT 2019

33QARD ANNUAL REPORT 2019

SUPPORTING THE SECTOR
QARD’s regulatory approaches include providing education, guidance and support to the early childhood education and care sector to facilitate the provision of high quality early childhood services in Victoria. QARD actively maintains a wide variety of engagement channels with the early childhood sector.
ENQUIRIES AND SUPPORT
QARD provides a dedicated 1300 number telephone line and email for enquiries to support the ECEC sector and other stakeholders.
In 2019, approximately 11,500 calls were received and managed from educators, service staff and members of the public making enquiries about service operations or requirements. Depending on the nature of these enquiries, callers are provided information, directed towards resources or referred to an authorised officer for detailed guidance or support.
SUPPORTING THE SECTOR
34 QARD ANNUAL REPORT 2019

QUALITY ASSESSMENT AND REGULATION UPDATE NEWSLETTER
QARD maintains a monthly email newsletter to inform providers and services of current regulatory issues and opportunities for improvement. During 2019, twelve editions of the Quality Assessment and Regulation Update newsletter were published and distributed to an average of 4,406 sector contacts (total of 52,876 emails sent).
Topics covered in 2019 included:
• safety issues i.e. cladding, bushfires, water activities, glass safety, toxic smoke, transportation
• funding opportunities
• quality improvement plans
• emergency management plans
• mandatory reporting requirements
• healthy eating
• educator resources, requirements and professional development opportunities
• seasonal compliance reminders
• guidance on further Early Childhood Teacher (ECT) requirements due to take effect 1 January 2020
• law reform i.e. the Children’s Services law reform and the 2019 NQF Review.
Figure 24: Percentage of email recipients who engaged with the newsletter
60%
50%
40%
30%
20%
10%
0JAN FEB MAR APR MAY JUN JUL AUG SEP OCT NOV DEC
Open rate Click rate CTOR
PE
RC
EN
TA
GE
OF
EM
AIL
RE
CIP
IEN
TS
49%47% 47%
53%48% 48% 46%
40%
52%
44%
53%
45%
Note: Open rate (opened the email), and CTOR (click through open rate represents the number of unique clicks divided by the number of unique opens).
QARD ANNUAL REPORT 2019 35
INFORMATION SESSIONS
New applicants
The Service Administration and Support Unit provides approved providers or stakeholders working with them (architects, consultancy agencies), the opportunity to consult about their proposed designs of new builds or renovated premises. These consultations offer guidance about the suitability for meeting legislative requirements. In 2019, the Regulatory Authority conducted 10 consultation meetings to offer such guidance, in addition to responding to correspondence seeking advice on the design of education and care services.
The Service Administration and Support Unit delivers centre-based and family day care assessment sessions throughout
the year. The primary purpose of these sessions is to inform the assessment of the fitness and propriety of an applicant. The sessions also serve to reinforce the legislative obligations and requirements of individuals involved in the provision of ECEC services.
Regional sessions
The QARD regional teams and authorised officers engage regularly with local services and educators to ensure a better understanding of the NQF and encourage compliance with regulatory obligations. They provide information sessions focused on current issues and areas of change, such as the NQF and the Reportable Conduct Scheme, and encourage dialogue and information sharing among our team, services and partners.
EARLY CHILDHOOD WEBSITE
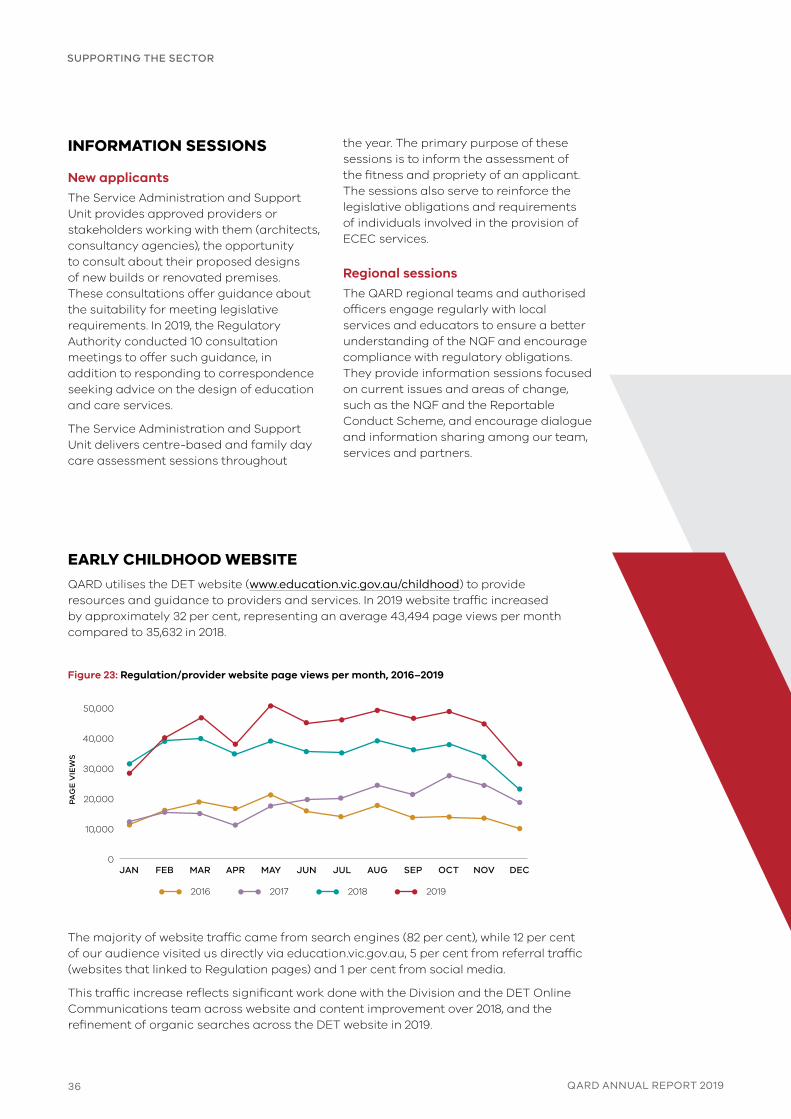
QARD utilises the DET website (www.education.vic.gov.au/childhood) to provide resources and guidance to providers and services. In 2019 website traffic increased by approximately 32 per cent, representing an average 43,494 page views per month compared to 35,632 in 2018.
Figure 23: Regulation/provider website page views per month, 2016–2019
JAN FEB MAR APR MAY JUN JUL AUG SEP OCT NOV DEC
50,000
40,000
30,000
20,000
10,000
0
2016 2017 2018 2019
PA
GE
VIE
WS
The majority of website traffic came from search engines (82 per cent), while 12 per cent of our audience visited us directly via education.vic.gov.au, 5 per cent from referral traffic (websites that linked to Regulation pages) and 1 per cent from social media.
This traffic increase reflects significant work done with the Division and the DET Online Communications team across website and content improvement over 2018, and the refinement of organic searches across the DET website in 2019.
36 QARD ANNUAL REPORT 2019
SUPPORTING THE SECTOR

SECTOR REFERENCE GROUPS
Relationships continued to strengthen with stakeholders in 2019 with occurrence of the Early Childhood Education and Care Regulatory Reference Group, where 20 key industry representatives were brought together to discuss trends and issues within the sector. This complemented an additional 15 forums and regular meetings with major providers and peak bodies.
RED-TAPE REDUCTION
QARD continually works to improve processes and reduce red-tape. QARD provides ongoing support for improvements to the NQA ITS public portal through a workplan coordinated and managed by ACECQA to streamline and standardise data capture for service providers. The CS Act has changed to simplify licensing arrangements for providers and ensure more consistent minimum standards across both the NQF and CS Act and CS Regulations.
Overall satisfaction with QARD’s regulatory support and guidance:
64% satisfied (+11%)
26% neutral (-2%)
10% dissatisfied (-9%)
Effective and efficient systems and processes:
82% of respondents (strongly and somewhat) agreed that QARD uses effective IT solutions and that the public portal is easy to use
Providing compliance assistance and advice:
84% of respondents agreed that QARD staff are knowledgeable and responsive when providing information
Communicating with and engaging stakeholders:
85% of respondents agreed that QARD communicates simply using relevant formats and provides opportunities to engage with stakeholders
Experience of regulatory practices:
80% of respondents were satisfied with their experience of QARD’s regulatory practices.
87% of respondents agreed that regulatory requirements were clear
82% of respondents agreed that compliance assistance and advice were clear
STAKEHOLDER SATISFACTION SURVEY
In 2019, QARD conducted its second annual stakeholder satisfaction survey to gauge the quality of its compliance related assistance and advice. Information received from the survey is used to improve QARD’s delivery in these areas. The survey was distributed to over 4,200 services in Victoria. A 64 per cent response rate was received, with 905 responses in 2019 compared to 497 responses in 2018.
Qualitative responses indicate that QARD continues to be accessible and receptive to the sector, with room to improve upon consistency of advice across regions and situations.
37
SUPPORTING THE SECTOR
QARD ANNUAL REPORT 2019

DESIGN GUIDELINES
A comprehensive Early Childhood Centre Design Guide to support the sector in the design of compliant buildings that incorporate best practice is being developed.
The rise in number of approved places is reflected in the increasing number of multi-storey service developments. Multi-storey services require careful design to ensure children have access to quality outdoor spaces on each level that allow them to explore the natural environment.
Table 4: Number of approved multi-storey services, 2013–2019
2013 2014 2015 2016 2017 2018 2019
Services 64 74 84 104 126 145 187
Note: This includes only services that have been identified to be operating in multi-storey buildings at the end of 2019.
SUPPORTING GOVERNMENT SCHOOL OUTSIDE SCHOOL HOURS CARE PROGRAMS
Working with Community Child Care and regional representatives, QARD co-delivered nine educative information sessions for government school principals and third-party OSHC providers on school-sites. These sessions aimed to build an understanding of principals’ obligations as either an approved provider or manager of outsourced OSHC arrangements.
SCHOOL READINESS FUNDING AND EARLY CHILDHOOD LANGUAGES PROGRAM
QARD has worked with central and regional teams to support the implementation of the school readiness funding programs and the early childhood languages program, through contributing to forums, information sessions, and regulatory advice.
SUPPORTING THE SECTOR
38 QARD ANNUAL REPORT 2019

39QARD ANNUAL REPORT 2019

REGULATORY PERFORMANCE
RISK-BASED REGULATOR
Our primary objective as the regulator of early childhood services is to ensure they protect children’s safety, health and wellbeing and deliver quality education and care to support children’s learning and developmental outcomes.
We are committed to exemplifying best practice regulation across our regulatory functions and activities. To meet our regulatory objectives and deliver outcomes efficiently and effectively, we apply risk-based approaches to focus attention on areas or problems that present the greatest risk to the safety, health and wellbeing of children.
Our actions are responsive and proportionate to the problem being addressed.
QARD is responsible for:
• assessing an applicant’s suitability to operate an early childhood education and care service
• assessing the suitability of premises for providing education and care services, supporting and guiding service providers and staff to meet their regulatory obligations
• assessing and rating service quality against the NQS through the assessment and rating process
• receiving and investigating notifications of incidents and complaints
• monitoring compliance with and enforcing requirements of the National Law and Regulations and CS Act and CS Regulations.
QARD ANNUAL REPORT 2019
REGULATORY PERFORMANCE
40

2,656 applications were submitted to QARD in 2019, an increase of 309 from the previous year
APPLICATIONS AND NOTIFICATIONS
QARD is responsible for assessing and determining new applications, notifications of change of circumstances and applicants’ fitness and propriety.
Applications
There were 2,656 applications submitted to QARD in 2019, an increase of 309 from the previous year (2,347). The majority of applications processed by QARD were related to amendment of existing approvals (48 per cent) or a combination of applications for new provider and service approvals (21 per cent).
In 2019, there were 299 applications for new provider approvals, and 248 applications for new service approvals, both of which decreased in 2019. Following assessment, 134 new provider applications were granted and 47 refused, and 214 new service applications were granted and 7 refused.
Applications for amendment to approval are used for changes to maximum number of approved places, removal of existing conditions and name changes of services and changes to approved provider details such as entity details or changes to persons with management or control of an ECEC service. Some application types, such as amendments to approvals by the regulatory authority, are internally generated to facilitate system driven administrative processes.
The increase was mostly due to a one-off administrative process to facilitate amendments to service approvals by the regulatory authority. It was necessary to update the conditions applying to services on the Department’s bushfire at risk register, relating to the preparation and submission of their emergency management plans. These amendments impacted about 630 services (including FDC).
Waiver applications increased slightly to 310 and were mainly related to staff qualifications.
41QARD ANNUAL REPORT 2019

Figure 25: Number of applications submitted by application type, 2013–2019
1,300
1,200
1,100
1,000
900
800
700
600
500
400
300
200
100
0
NU
MB
ER
OF
AP
PL
ICA
TIO
NS
2013 2014 2015 2016 2017 2018 2019
Provider approval 366 447 389 356 390 355 299
Service approval 322 320 369 380 335 265 248
Amendment of approval 432 529 658 635 543 881 1,288
Service or temporary waiver 127 106 182 222 290 303 310
Voluntary suspension 19 20 41 112 102 130 99
Other 438 378 542 434 486 413 412
Notifications of change of circumstances
QARD receives and processes notifications of changes of certain circumstances and information, which include change in the management or control of an approved provider or responsible persons at the service, surrenders of service or provider approval, and change of information about an early childhood service.
There were 8,960 notifications of change of circumstances received by QARD in 2019.
Sixty-three per cent (63%) of these notifications in 2019 were related to changes to services, with the majority of them related to the changes in nominated supervisors of services.
Twenty-seven per cent (27%) of these notifications in 2019 were related to change of contact details, most of them related to services’ contact details.
REGULATORY PERFORMANCE
42 QARD ANNUAL REPORT 2019

ASSESSMENT AND RATING
Assessment and rating is a core regulatory activity for delivering the NQF’s continuous improvement objective. In accordance with the National Law, authorised officers assess service quality against the 40 elements of the NQS by undertaking a desktop review of service’s quality improvement plans, history of compliance and other information, and by conducting a service visit to discuss and observe practice and sight documents. Services are assessed and rated against the NQS to promote continuous improvement and to improve knowledge and access to information about the quality of education and care services
Following analysis, officers determine a quality rating and report the outcome to service providers including identifying areas for improvement. Prior to the rating being finalised, the approved provider is issued with a draft rating report and can provide feedback.
Quality rating assessments
At the end of 2019, QARD had rated 94 per cent of approved services in Victoria, and 98 per cent of eligible services. Services are eligible for assessment and rating after 12 months of operation. In 2019 QARD conducted 981 quality assessment and ratings, to 24 per cent of eligible services.
Figure 26: Number of assessment and rating
visits completed, 2016–2019
1000
800
600
400
200
0NU
MB
ER
OF
VIS
ITS
2016 2017 2018 2019
8849871,007 984
Eighty-five per cent (85%) of Victorian services with a quality rating received an overall rating of Meeting NQS or above.
Victorian education and care services continue to maintain a consistent level in quality as the proportions of overall ratings of Meeting NQS or above over the last two years has remained relatively stable. Quality Areas with the greatest opportunity for improvement are Quality Area 7 Governance and Leadership, Quality Area 1 Educational Program and Practice and Quality Area 2 Children’s Health and Safety where 10 per cent, 10 per cent and 8 per cent of ratings (respectively) result in a Working Towards NQS.
Next Assessment and Rating
The assessment and rating process provides the benchmark of the NQF’s continuous improvement objective. Next assessment and rating visits (reassessments) represent an opportunity for services to demonstrate their improvements against the NQS.
By the end of 2019, QARD had conducted 2,967 subsequent assessment and rating visits with 32 per cent of these services receiving a higher rating. 72 per cent of reassessments for services with a prior rating of Working Towards NQS resulted in a higher rating.
Excellent rated services
At the end of 2019, ten Victorian services were rated as Excellent, the highest level rating (six LDC and four kindergartens). An Excellent rating is assessed and determined by ACECQA following application from a service. The service must be rated Exceeding NQS in all quality areas in order to apply for an Excellent rating.
Those services were:
• Millville Childcare Centre
• Balnarring Pre-School
• Albert Park Preschool Centre
• Clarendon Children’s Centre Co-op
• Wesley College Melbourne Glen Waverley Early Childhood Learning Centre
• Jindi Woraback Children’s Centre
• Bonkers Beat Music Kinder & Childcare Aspendale
• Cambrian Preschool
• Doveton College Early Learning Centre
• Gowrie Victoria Broadmeadows Valley.
10 Victorian services were rated as Excellent, the highest level rating (six LDC and four kindergartens)
43QARD ANNUAL REPORT 2019
REGULATORY PERFORMANCE

CASE STUDY 3: SPOTLIGHT ON EXCELLENCE
Gowrie Victoria Broadmeadows Valley (GVBV) is a 128
place education and care service located in the outer
northern suburbs of Melbourne
In 2017, GVBV was rated Exceeding NQS in all seven
Quality Areas. The service remained on a path of
continuous quality improvement and in 2019 GVBV
achieved an Excellent rating in recognition of the
high-quality and inclusive education and care
practices embedded at the service.
Children from diverse backgrounds attend GVBV,
including those from the local community, wider
community, and children who are known to Child
Protection, or are from vulnerable backgrounds.
The service is located on a Department of Education
hub site, shared between Broadmeadows Valley
Primary School, Hume Valley Secondary School,
Broadmeadows Special Development School, and
Collingwood English Language School, and is an
example of how this connectivity and collaboration
between educational settings can maximise
outcomes in the early years of a child’s life. Educators
at GVBV use trauma-informed practice (a strengths-
based framework) to meet the educational and
wellbeing needs of children attending the service.
They are committed to providing each child with the
foundations to be ready for school and prepared for
life-long learning.
The service joins 10 other Victorian education and
care services that have achieved this rating and
adds to the diverse range of services that have been
recognised under the NQF as achieving excellence.
The different contexts of these early childhood
education and care settings highlights the outcomes-
based foundation of the NQF and recognises that
exceptional practice can be celebrated across a
range of communities, locations and service types.
Significant Improvement Required
At the end of 2019, Victoria had no services with a Significant Improvement Required (SIR) rating, a decrease from one at the end of 2018.
Reviews of ratings
The National Law allows service providers to request a review of the service’s rating if the provider disagrees with the rating given. The review of ratings by the regulatory authority is referred to as a ‘first tier review’. Thirteen ratings given in 2019 resulted in a first tier review, compared with 14 ratings given in 2018.
Approved providers have applied for a first tier review for less than two per cent of ratings in the last four years. If the approved provider is still not satisfied after the first tier review, they may apply to the National Authority (ACECQA) for a further review (a ‘second tier review’) by a ratings review panel. There were two second tier reviews undertaken, for a rating given in 2018 and another rating given in 2019, both completed in 2019 by the ratings review panel.
Table 5: Proportion of ratings with a first or second tier review, 2016–2019
2016 2017 2018 2019
Second tier reviews 0 0 1 1
First tier reviews 12 15 14 13
Ratings given 838 979 1003 993
Proportion of ratings resulting in a second tier review 0% 0% 0.01% 0.01%
Proportion of ratings resulting in a first tier review 1.4% 1.5% 1.4% 1.2%
Note: Count of ratings given excludes partial reassessment and re-ratings. Ratings relate to those finalised in that year, where some visits were completed in the previous year.
AT THE END OF 2019,
VICTORIA HAD NO SERVICES
WITH A SIGNIFICANT
IMPROVEMENT REQUIRED
(SIR) RATING
44 QARD ANNUAL REPORT 2019
REGULATORY PERFORMANCE

CASE STUDY 4: A JOURNEY FROM WORKING TOWARDS NQS TO EXCEEDING NQS
This 85 place service is located in Melbourne’s eastern suburbs and is listed on the Bushfire Risk Register.
The service received a rating of Working Towards NQS in 2016 for not meeting Quality Area 1, Educational Program and Practice, Quality Area 2, Children’s Health and Safety and Quality Area 7, Leadership and Service Management. Although the team were disappointed, they recognised that these were areas they could improve. A change in service leadership in 2018 motivated the team to improve.
The team updated their Quality Improvement Plan (QIP) to focus on areas of improvement identified in the assessment and rating report. The service engaged with families and children to inform a new service philosophy, that reflected the shared values and intentions of the service.
Educators collaborated and shared information about the educational program and curriculum decisions. They reflected on their practice which enabled positive changes in the delivery of education and care programs.
The service focused on continuous improvement, recognising and valuing the input of families and each child’s social, emotional and learning requirements. A collaborative and ethical culture was established where all educators were involved in decision-making and educators were supported to develop new approaches to programs, routines, transitions and communication methods.
In 2019 the service achieved an overall rating of Exceeding NQS in recognition of the service’s efforts and improvements.
The assessment and rating process has assisted the service in identifying their strengths and areas of improvement. It has resulted in educators building on their strengths and working with their colleagues to establish new skills. The educators’ passion for engaging in meaningful relationships is reflected in the educational programs offered for each child.
REGULATORY PERFORMANCE
45QARD ANNUAL REPORT 2019

MONITORING AND COMPLIANCE
QARD implements a range of compliance strategies to motivate compliance with legislative requirements. In 2019, authorised officers completed a total of 2,775 compliance inspection visits to services. 2,650 were to services operating under the NQF and 125 were to services operating under the CS Act.
Table 6: Number of compliance visits completed per 100
services by care type, 2018–2019
Care type 2018 2019
Long day care 83 86
Kindergarten 42 39
Outside school hours care 55 54
Family day care 68 72
CS Act service 47 39
Note: A compliance visit is defined here as any of the following visit types in NQA ITS: application/assessment, change of ownership, complaint, incident, investigation and post-approval. Some compliance visits relate to services that were cancelled or surrendered by the end of 2019.
Managing family day care compliance risk
QARD has been acting strongly on compliance issues in FDC for some time, and rigorously assesses applicants before they are approved to operate.
Where services fall into serious non-compliance, QARD will take enforcement action, including imposing conditions on service approvals, suspending or cancelling provider and service approvals, or taking prosecution action.
Notification of Serious Incidents
The National Law and CS Act outline the circumstances under which services must notify QARD of a complaint or an incident. These include:
• the death of a child
• any incident involving serious injury or trauma to, or illness of, a child
• any incident where the attendance of emergency services was required
• any circumstance where a child being educated and cared for by an early childhood education and care service appears to be missing or cannot be accounted for.
In addition, QARD is required to be notified of incidents affecting the hours and days of operation of a service, any circumstance that poses a risk to a child and matters related to FDC venues. In 2019 QARD received around 3,900 notifications of serious incidents from early childhood education and care services.
Table 7: Number of reported serious incidents per 100 NQF
services by care type, 2018–2019
Care type 2018 2019
Long day care 149 157
Kindergarten 62 57
Outside school hours care 38 46
Family day care 40 56
Note: Some serious incidents may relate to services that were not operating at the end of each year.
Retrospectively incidents have increased year on year for the last four years (using 2016 as a baseline and excluding a decrease only seen in 2018).
Incident notifications increased in 2019 (serious incidents from 3395 to 3895 and other incidents from 1010 to 1549). The increase is mostly due to a combination of sector growth, particularly of LDC and OSHC services. Data for notification increases in other incidents per 100 services, broken down by service type, reveals a concentration of increases in LDC and OSHC, the two areas that have seen the most growth.
Another possible factor to explain the increase in incident notifications is the early childhood sector transitioning into the reportable conduct scheme from 1 January 2019. This increased general awareness and vigilance of reporting obligations and compliance with requirements.
All incident notifications are assessed by QARD for further action.
Complaints
QARD receives complaints about services both directly from parents and members of the public, and through notifications from service providers. Providers are required to lodge a notification of complaints they have received from parents at a service. All complaints are assessed and investigated as required.
In 2019 QARD received 1,996 complaints in total; 1,965 about services operating under the NQF, 13 about services operating under the CS Act and 18 regarding alleged unlicensed services.
Complaint notifications increased by 27 per cent in 2019 to 1323. A large proportion, 955 or 72 per cent, of these notifications are received from LDC services which also represents the largest growth segment of the ECEC market in Victoria. Another factor contributing to the increases in notifications was the transition of the ECEC sector into mandatory reporting scheme in March 2019 which has increased awareness of reporting obligations and compliance with requirements.
46 QARD ANNUAL REPORT 2019
REGULATORY PERFORMANCE
CASE STUDY 5: INAPPROPRIATE DISCIPLINE
A visitor to a service reported that she had seen an educator pick up a child by one arm and carry him for a short distance when the child would not sit down during an activity. The investigation established that the educator had picked up the child and carried him as described by the visitor. The educator outlined that they had been under severe stress due to personal circumstances and had been educating for more than twenty years without any previous incidents.
The educator agreed to a statutory enforceable undertaking to undergo training and development before returning to a role as an educator.
ENFORCEMENT
QARD takes a responsive approach to its enforcement actions which are escalated depending on the provider’s response to identified non-compliance. Enforcement actions are proportionate to the seriousness of the non-compliance, risk and the potential harm to the safety and welling of children attending a service.
We use a range of regulatory tools to address non-compliance ranging from providing information and guidance through to prosecution before a court or cancelling a provider’s approval to operate.
In 2019, the Department applied 93 statutory enforcement sanctions, that were published on the Department’s website, relating to serious non-compliances. This compares to 85 similar actions in 2018. The Department publishes all applicable enforcement actions on its website.
In Victoria there continues to be significant compliance issues within FDC services. In 2019, the Department undertook 58 published enforcement actions in relation to FDC services. This included 48 cancellations of provider approvals.
Strengthening investigative capability
A dedicated investigation unit has been embedded into QARD to provide investigative support and technical advice to regional authorised officers.
Our continued focus on empowering and equipping investigators with technical skills has resulted in the development of resources and training for authorised officers in best practice investigative process and investigative and interviewing techniques.
The Investigations Community of Practice provides a forum to ensure authorised officers are supported in their investigative work and investigations are conducted effectively, efficiently and consistently across all regions.
REGULATORY PERFORMANCE
47QARD ANNUAL REPORT 2019

REFORMS AND INITIATIVES
EDUCATION AND CARE SERVICES NATIONAL AMENDMENT REGULATIONS 2019
As host of the National Law, Victoria leads the national Legislation Working Group which develops legislative and regulatory proposals in accordance with policy decisions of the Ministerial Council.
The Education and Care Services National Amendment Regulations 2019 made a range of amendments, primarily to staffing provisions in the National Regulations. These amendments ensured the workability of the regulatory requirement for a second early childhood teacher or, alternatively, a ”suitably qualified person” (as determined by the Board of ACECQA) when 60 or more children preschool age or under are being educated and cared for on a given day, which commenced on 1 January 2020. The requirement for a second early childhood teacher or ”suitably qualified person” was the final, planned step-up in staffing requirements in the NQF.
NQF REVIEW 2019
The second five-yearly review of the NQF began in 2019, continuing the important national conversation about quality children’s education and care in Australia that started a decade ago.
A dedicated website was established at www.nqfreview.com.au to support community engagement on the review. A national working group developed an initial Issues Paper to support the first phase of public consultation. The Issues Paper canvassed four broad topics:
• approvals
• operational requirements
• public awareness of quality
• compliance and enforcement.
A series of questions was developed to guide discussions at consultation sessions held around Australia between April and June 2019, and to inform an online survey that was open for 11 weeks.
48 QARD ANNUAL REPORT 2019
REFORMS AND INITIATIVES

There was a high level of engagement during this first consultation phase. In Victoria, just under 300 people attended 13 consultation sessions in metropolitan and regional locations. Nationally, there were:
• 17,500 website visits
• 2,500 participants attending 79 face-to-face consultation sessions
• 1,769 online survey responses
• 17 written submissions.
The major issues that consultation participants felt were not covered in the Issues Paper were:
• aspects of the quality assessment and rating process
• sector workforce and qualifications issues
• the need for review of the approved learning frameworks.
A summary report on the consultation is available on the NQF Review website.
17,500 website visits
2,500 participants attending 79 face-to-face consultation sessions
1,769 online survey responses
17 written submissions
The sector’s participation in the Review and feedback
has helped inform the next phase of consultation on a
Consultation Regulation Impact Statement (CRIS) that
will set out proposed options for regulatory change
and their potential impact on the sector and families.
Consultation on the CRIS was intended to occur in
mid-2020 but has been delayed due to COVID-19.
The CRIS is now expected to be released for public
consultation in early 2021, and all are encouraged to
get involved to help shape improvements to the NQF.
49QARD ANNUAL REPORT 2019

CHILDREN’S SERVICES ACT
Children’s services in Victoria that fall outside the scope of the NQF are regulated under the CS Act and CS Regulations. These services include occasional care services, limited hours services, school holidays care services, early childhood intervention services, and former Budget Based Funded services.
At 31 December 2019 there were 317 services operating under the CS Act, a reduction of 41 services from the previous year, which partly reflects some services transitioning to a service approval under the National Law in order to operate for longer hours.
CHILDREN’S SERVICES ACT AND REGULATIONS REVIEW
Following a national decision in 2017 to keep occasional care, former Budget Based Funded and mobile services outside the scope of the NQF, the Victorian children’s services regulatory regime has been reformed to align it with the NQF, where appropriate. The purpose of the reform was to simplify arrangements for service providers and ensure more consistent minimum standards across all Victorian early childhood services.
Sector consultation through State-wide information sessions in mid-2019 indicated broad support for the proposed reform. Amendments to the CS Act were passed by Parliament in November 2019 (although not brought into effect until May 2020). Key changes to the CS Act included:
• adopting the (relevant) objectives and guiding principles in the NQF, focusing on quality educational and development outcomes, and the safety, health and wellbeing of children
• requiring the educational program delivered by services to be based on an approved learning framework, as in the NQF
• changing terminology to be consistent with the NQF
• changing the licensing structure, replacing fixed term licences with ongoing provider and service approvals, and enabling the transfer of services between approved providers
• streamlining application processes, replacing the previous two-step process for premises approval with a one-step integrated process
• aligning compliance, monitoring and enforcement approaches with those in the NQF.
Public consultation on proposed new CS Regulations and a Regulatory Impact Statement (RIS) took place in early 2020, giving participants the ability to complete an online survey, make written submissions and attend information sessions in a mix of metropolitan and regional locations, including via video-conference.
The revised CS Act and new CS Regulations 2020 commenced on 17 May 2020.
50 QARD ANNUAL REPORT 2019

CO-REGULATORY PARTNERS
Our team works alongside national and state regulatory authorities to support the successful implementation of the NQF. This includes regular interaction with all jurisdictions and ACECQA regarding the effectiveness of operational policy, training, systems, business processes, information management and sector support. We collaborate within a ‘community of practice’ designed to improve regulatory practice, identify emerging issues and reduce risk.
We collaborate with other regulators to promote coherence through information sharing and to build capability within the education and care sector through our compliance, monitoring and inspection regime.
Commission for Children and Young People
QARD has continued to hold regular meetings and share information with the Commission for Children and Young People (CCYP).
Reportable Conduct Scheme
On 1 January 2019 all heads of organisations operating education and care services and children’s services became subject to the Reportable Conduct Scheme. The Reportable Conduct Scheme requires heads of organisations to investigate allegations of child abuse and to notify the CCYP about the allegations and the organisations’ responses to the allegations. QARD worked closely with the CCYP and the Centre for Excellence in Child and Family Welfare to support the development of advice and guidance for the early childhood sector. Regular liaison with CCYP during 2019 focussed on sharing information between QARD and CCYP during the implementation phase of the scheme and raising awareness with early childhood services about the Reportable Conduct Scheme.
Child Safe Standards
In 2019 QARD continued to manage referrals from the CCYP to determine services’ compliance with the Child Safe Standards (CSS). QARD monitored aspects of services’ compliance with the CSS as part of the assessment and rating process for services and raised awareness of the CSS though existing QARD communication channels.
The CSS were reviewed in 2019 by the Department of Health and Human Services.
QARD provided input into the review and ensured key early childhood stakeholders were also consulted.
The report recommendations include:
• QARD becomes the single regulator of the CSS for early childhood services regulated by QARD under the CS Act and the National Law
• that there is a nationally consistent approach to CSS and that Victoria aligns its standards with the National Principles for Child Safe Organisations (National Principles).
QARD has also been involved in contributing to the Review of the NQF and specifically in considering a national approach to the National Principles.
QARD ANNUAL REPORT 2019
REFORMS AND INITIATIVES
51

New mandatory reporters for early childhood services
On 1 March 2019 the Children, Youth and Families Act 2005 was amended. For education and care services operating under the National Law in Victoria and children’s services operating under the CS Act the persons, mandated to report a reasonable belief of child physical or sexual abuse to child protection authorities, were extended to include the approved provider, nominated supervisor and a person with a post-secondary qualification in the care, education or minding of children, employed or engaged by, a children’s service or an education and care service operating in Victoria.
QARD worked with the Department of Health and Human Services, Child Protection to provide information and guidance to early childhood services in relation to these new mandatory reporting obligations.
Victorian Registration and Qualifications Authority
The Victorian Registration and Qualifications Authority (VRQA) and the Secretary continue to have a number of shared interests, including school councils that are the providers of early childhood education and care services (such as OSHC), and the provision of early childhood-related qualifications by Registered Training Organisations (RTOs) regulated by the VRQA. The Department has a Memorandum of Understanding (MoU) with the Director of the VRQA signed in 2018. This MoU allows for continued joint investigations and fosters collaboration to align policy and minimise regulatory burden for the jointly regulated sector.
Department of Health and Human Services
Alongside the Department of Health and Human Services (DHHS), we work with Nutrition Australia and the Healthy Eating Advisory Service to develop resources and strategies to raise awareness that supports:
• early childhood services to provide food and beverages that are nutritious and to promote healthy eating
• authorised officers’ capacity to assess services‘ compliance with the food and beverage provisions and the promotion of healthy eating.
No Jab, No Play
QARD works closely with DHHS to support the requirements of the No Jab, No Play (NJNP) legislation.
During visits to services, authorised officers continue to monitor services’ compliance with the NQF and the CS Act by checking children’s enrolment records to ensure the required documentation is in place to meet NJNP requirements.
QARD has continued support of NJNP through multiple communications via the monthly newsletter and forums to ensure providers are aware of the requirements under NJNP. QARD responds regularly to individual services’ issues and requests for information regarding NJNP.
Information Sharing Schemes
The Child Information Sharing Scheme (CISS) allows authorised organisations and services to share information in order to promote the wellbeing and/or safety of children. The Family Violence Information Sharing Scheme (FVISS) enables authorised organisations and services to share information to facilitate the assessment and management of family violence risk to children and adults.
Multi-Agency Risk Assessment and Management (MARAM)
The MARAM framework (formally known as the Common Risk Assessment Framework, or the CRAF) sets out the responsibilities of different workforces in identifying, assessing and managing family violence risk. The MARAM tool guides information sharing under the CISS and the FVISS wherever family violence is present.
52 QARD ANNUAL REPORT 2019
REFORMS AND INITIATIVES

Department of Justice and Community Safety (DJCS)
We share information with DJCS where there are concerns a relevant person may not hold or be eligible to hold a Working with Children Check.
WorkSafe Victoria
Collaboration with WorkSafe Victoria ensures issues of shared interest impacting on the safety, health and wellbeing of children are addressed. There is collaboration where each agency is involved in an investigation of the same matter.
Victorian Institute of Teaching
We maintain close relationships with the Victorian Institute of Teaching through an established MoU and regular liaison regarding registration of early childhood teachers.
Commonwealth Department of Education and Training
Regular collaboration and information sharing between QARD and the Commonwealth DET contributes to the identification of non-compliant services and providers. Sanctions taken by the Commonwealth in relation to child care funding are considered, and action taken to cancel provider approvals as appropriate. This has contributed to a large reduction in the number of family day care services in Victoria with concerning compliance issues.
Victoria Police
QARD works closely with Victoria Police on alleged criminal matters as required.
53QARD ANNUAL REPORT 2019

GLOSSARY
Term Acronym Meaning
Approved provider An entity which holds a provider approval under the NQF.
Approved serviceAn approved early childhood education and care service for which a service approval exists under the NQF.
Assessment and Rating A&RThe process by which services are assessed and rated by their regulatory authority against the NQS and given a rating for each of the seven quality areas and an overall rating based on these results.
Care type
Centre-based services offering more than one type of service are classified as follows: services which provide long day care in addition to any other service type are classified as long day care services; services which provide kindergarten services as well as outside school hours care services are classified as kindergarten services; services which provide outside school hours care services only are classified as outside school hours care services.
Centre-based serviceAn education and care service other than a family day care service. This includes most long day care, preschool/kindergarten and outside school hours care services that are delivered at a centre.
Early childhood education and care services/early childhood services
ECECBlanket terms, used in reference to all early childhood education and care services under both the NQF and CSA.
Incident notification See Notification
Integrated serviceRegulated under the Children’s Services Act 1996, a service that consists of two or more service types (other than a short-term service) provided at one premises by one licensee.
Licensed serviceA service regulated under the Children’s Services Act 1996 for which a licence exists.
Limited hours serviceRegulated under the Children’s Services Act 1996, a service that provides education and care to a child at a sports and leisure centre or shopping centre where the parent is a patron.
National Law
The NQF operates under an applied law system, comprising the Education and Care Services National Law Act 2010 and the Education and Care Services National Regulations. The purpose of the applied law system is to set a national standard for children’s education and care across Australia. In effect it means the same law is applied in each state and territory, but with some varied provisions as applicable to the needs of each state or territory. In this case Victoria passed the Education and Care Services National Law Act 2010 and other jurisdictions adopted that law through an Application Act or passed corresponding legislation.
54 QARD ANNUAL REPORT 2019
GLOSSARY

GLOSSARY
Term Acronym Meaning
National Quality Agenda for Early Childhood Education and Care
NQA
The overarching name given to the quality reforms to early childhood education care, which incorporate the NQS, including the Early Years Learning Framework, the assessment and rating system and the National Regulations.
National Quality Framework NQF
The NQF covers services providing or intending to provide education and care on a regular basis to children under the age of 13 years. This includes family day care services, long day care services, outside school hours care services and preschools (kindergartens). The NQF comprises the National Law, National Regulations and NQS and Approved Learning Frameworks.
National Quality Standard NQS
The NQS sets a high national benchmark for early childhood education and care and outside school hours care services in Australia. The NQS includes 7 quality areas that are important outcomes for children. Services are assessed and rated by their regulatory authority against the NQS, and given a rating for each of the 7 quality areas and an overall rating based on these results.
No Jab, No Play NJNP
Under the No Jab, No Play legislation, before enrolling a child, early childhood education and care services have to first obtain evidence that the child is up to date with all vaccinations that are due for their age, or that they are able to receive.
NotificationApproved providers are required to notify the regulatory authority about incidents, complaints and changes to information.
National Quality Agenda IT System
NQA ITS
A web-based information system to assist state and territory regulatory authorities and ACECQA to manage the approval, monitoring and quality assessment of children’s education and care services. The system also enables services, providers and educators to submit application and notification forms online to regulatory authorities and ACECQA.
Occasional CareRegulated under the Children’s Services Act 1996. Casual, occasional care services that offer care of less than two hours per day and less than six hours per week, which includes crèches at gyms and shopping centres.
Outside School Hours Care OSHC
Regulated under the NQF. Not defined in the National Law or Regulations. A service that provides care for primary school aged children (typically 5 to 12 years) before and after school and can also operate during school holidays (vacation care) and on pupil free days (National Partnership Agreement on the National Quality Agenda for Early Childhood Education and Care, p. 7). Outside school hours care services are usually provided from primary school premises. Services may also be located in child care centres or community facilities.
55QARD ANNUAL REPORT 2019
GLOSSARY

Term Acronym Meaning
Places
Places only relates to centre-based services and services regulated under the Children’s Services Act. The maximum number of children who can be educated and cared for by a service at any one time, stated on the service approval. Number of places reflects services’ approved or licensed capacity. Places data for FDC services is not collected.
Preschool
Not defined in the National Law or Regulations. A service that provides an early childhood education program, delivered by a qualified teacher, often but not necessarily on a sessional basis in a dedicated service. Alternative terms used for preschool in some jurisdictions include kindergarten, pre-preparatory and reception (National Partnership Agreement on the National Quality Agenda for Early Childhood Education and Care).
Provider management typeThe type of legal or social entity responsible for managing the delivery of an early childhood education and care service.
Provider See Approved provider
Quality Improvement Plan QIP
The approved provider must ensure a Quality Improvement Plan (QIP) is in place for each service. The aim of a QIP is to help providers self-assess their performance in delivering quality education and care, and to plan future improvements. The QIP also helps regulatory authorities with assessing the quality of the service.
GLOSSARY
56 QARD ANNUAL REPORT 2019

Term Acronym Meaning
Reportable Conduct SchemeScheme to improve oversight of how organisations respond to allegations of child abuse and child-related misconduct, commenced on 1 July 2017.
School holidays care serviceLicensed under the Children’s Services Act 1996. Cares for or educates children for no more than 4 weeks per calendar year during school holidays.
Serious incident
Serious incidents that occur while a child is being educated and cared for by an education and care service include: the death of a child; a serious injury or trauma to a child; the serious illness of a child requiring hospital attendance; an emergency for which emergency services attended; circumstances where a child is missing or unaccounted for/is taken or removed/is mistakenly locked in or out of the service/service premises.
Service approvalA person must have service approval to operate an education and care service under the National Law and Regulations. Regulatory authorities are responsible for assessing and determining applications for service approval.
Waiver
An exemption from a requirement that an approved education and care service comply with a prescribed element(s) of the NQS or regulation of the National Regulations. While a waiver is in force, the approved service is not required to comply with the element(s) or regulation(s) specified in the waiver.
GLOSSARY
57QARD ANNUAL REPORT 2019

DATA TABLES
DATA IN THIS APPENDIX RELATE ONLY TO VICTORIAN SERVICES.
Appendix Table 1: Number of new ECEC services by care type, 2013–2019
Care type 2013 2014 2015 2016 2017 2018 2019
Total services 251 214 289 223 260 219 206
NQF services: 251 214 224 198 233 204 192
Centre-based care 123 140 163 160 213 191 185
• Long day care 34 36 54 75 116 81 105
• Kindergarten 31 23 30 22 19 22 23
• Outside school hours care 58 81 79 63 78 88 57
Family day care 128 74 61 38 20 13 7
CSA services na na 65 25 27 15 14
Note: Total new services for 2013 and 2014 excludes new CSA services
Appendix Table 2: Number of new places for centre-based services by care type, 2013–2019
Care type 2013 2014 2015 2016 2017 2018 2019
Total places 7,376 8,293 11,433 12,308 18,319 14,760 16,177
NQF places: 7,376 8,293 9,664 11,767 17,623 14,303 15,817
• Long day care 3,172 3,501 4,246 7,348 12,092 8,520 11,777
• Kindergarten 1,474 1,166 1,731 1,117 828 1,107 1,110
• Outside school hours care 2,730 3,626 3,687 3,302 4,703 4,676 2,930
CSA places na na 1,769 541 696 457 360
Note: Total new places for 2013 and 2014 excludes new CSA places
Appendix Table 3: Number of new ECEC services by provider management type, 2013–2019
Provider type 2013 2014 2015 2016 2017 2018 2019
Total services 251 214 289 223 260 219 206
Catholic school 1 0 2 2 2 1 0
Government school 10 7 6 5 4 5 3
Independent school 5 3 2 7 5 4 4
Local government 7 10 31 11 9 12 8
Not-for-profit community managed 34 27 56 34 37 36 20
Not-for-profit other 4 5 15 5 16 13 11
Private for profit 190 162 174 159 187 148 160
Other 0 0 3 0 0 0 0
Note: Total new services for 2013 and 2014 excludes new CSA services
58 QARD ANNUAL REPORT 2019
DATA TABLES

59
Appendix Table 4: Number of new places for centre-based services by provider management type, 2013–2019
Provider management type 2013 2014 2015 2016 2017 2018 2019
Total places 7,376 8,293 11,433 12,308 18,319 14,760 16,177
Catholic school 40 0 35 65 86 20 0
Government school 389 290 186 191 117 214 45
Independent school 343 170 69 294 309 192 320
Local government 659 630 1,832 574 386 520 777
Not-for-profit community managed 1,946 956 2,461 1,476 1,960 1,939 1,199
Not-for-profit other 281 216 548 213 2,182 759 674
Private for profit 3,718 6,031 6,270 9,495 13,279 11,116 13,162
Other 0 0 32 0 0 0 0
Appendix Table 5: Number of approved ECEC services by care type, 2013–2019
Care type 2013 2014 2015 2016 2017 2018 2019
Total services 4,265 4,381 4,457 4,514 4,612 4,567 4,546
NQF services: 3,808 3,928 4,027 4,108 4,233 4,209 4,229
Centre-based care 3,541 3,589 3,645 3,737 3,886 3,961 4,043
• Long day care 1,220 1,244 1,280 1,342 1,457 1,520 1,607
• Kindergarten 1,211 1,197 1,197 1,203 1,205 1,194 1,186
• Outside school hours care 1,110 1,148 1,168 1,192 1,224 1,247 1,250
Family day care 267 339 382 371 347 248 186
CSA services 457 453 430 406 379 358 317
Appendix Table 6: Number of approved places for centre-based ECEC services by care type, 2013–2019
Care type 2013 2014 2015 2016 2017 2018 2019
Total places 212,057 234,951 228,856 241,748 257,659 268,682 280,416
NQF approved places: 200,809 223,873 218,287 231,645 248,143 259,542 272,414
• Long day care 91,493 109,743 99,683 107,605 120,343 128,664 140,255
• Kindergarten 44,736 46,101 48,077 49,811 50,099 50,567 51,073
• Outside school hours care 64,580 68,029 70,527 74,229 77,701 80,311 81,086
CSA licensed places 11,248 11,078 10,569 10,103 9,516 9,140 8,002
59QARD ANNUAL REPORT 2019
DATA TABLES

Appendix Table 7: Number of approved ECEC services by provider management type, 2013–2019
Provider management type 2013 2014 2015 2016 2017 2018 2019
Total services 3,808 3,928 4,457 4,514 4,612 4,567 4,546
Catholic school 44 41 41 39 33 29 26
Government school 338 320 309 295 279 260 244
Independent school 133 129 123 127 132 131 131
Local government 458 433 496 484 467 456 440
Not-for-profit community managed 1,130 1,114 1,294 1,281 1,285 1,261 1,221
Not-for-profit other 312 309 373 363 375 378 373
Private for profit 1,393 1,582 1,818 1,922 2,040 2,051 2,110
Other 0 0 3 3 1 0 0
Appendix Table 8: Number of approved places for centre-based ECEC services by provider management type, 2013–2019
Provider management type 2013 2014 2015 2016 2017 2018 2019
Total places 200,809 223,873 228,856 241,728 257,659 268,682 280,416
Catholic school 2,398 2,144 2,106 1,996 1,758 1,567 1,484
Government school 18,311 18,267 18,335 18,535 18,296 17,400 16,870
Independent school 9,190 9,133 8,492 8,738 9,044 8,960 9,374
Local government 19,125 18,575 21,183 21,589 21,333 20,986 21,185
Not-for-profit community managed 47,646 62,491 53,738 54,193 55,330 55,587 54,885
Not-for-profit other 22,923 22,997 24,990 25,205 27,069 27,692 28,020
Private for profit 81,216 90,266 99,980 111,439 124,822 136,490 148,598
Other 0 0 32 33 7 0 0
Appendix Table 9: Number of NQF services managed by Victorian providers, 2015–2019
Victorian providers of NQF services 2015 2016 2017 2018 2019
VIC 3,557 3,602 3,687 3,629 3,620
Other jurisdictions 464 546 581 552 535
ACT 9 8 10 11 12
NSW 157 189 201 191 195
NT 7 16 20 18 18
QLD 66 79 90 88 85
SA 67 80 75 63 50
TAS 1 1 10 8 5
WA 157 173 175 173 170
60 QARD ANNUAL REPORT 2019
DATA TABLES

Appendix Table 10: Number of children attending ECEC services, 2015–2019
Service type 2015 2016 2017 2018 2019
Total 405,679 413,114 429,922 436,108 409,749
Centre-based day care (including occasional care) na na na na 188,249
Long day care 148,333 154,175 163,524 172,161 na
Kindergarten (long day care settings) 21,393 23,269 25,022 24,786 27,514
Kindergarten (all other settings) 52,756 52,996 53,948 53,620 51,991
OSHC (and vacation care) 111,875 119,753 121,955 127,879 106,132
Family day care 68,886 60,705 63,352 55,617 35,863
Occasional care 2,436 2,216 2,121 2,045 na
Note: Number of children in kindergarten refers to number of children enrolled in funded kindergarten in the year before school, using Victorian Department of Education and Training data. Number of children attending ECEC services refers to children 0-12 years attending Australian CCS approved child care services and is sourced from multiple years of the Report on Government Services and from Australian Bureau of Statistics, 2018, Preschool Education, cat. No. 4240.0. Changes to reporting under the CSS resulted in the introduction of new categories Centre-based care (a consolidation of long day care and occasional care previously reported separately) and Outside school hours care (a consolidation of outside school hours care, and vacation care previously reported separately). Data on funded kindergarten enrolments is not directly comparable to attendance in other service types.
Appendix Table 11: Average hours of attendance per week of children aged 0-12 years at Australian CCB approved child care
services, 2013–2019
Service type 2013 2014 2015 2016 2017 2018 2019
Centre-based day care na na na na na na 29.6
Long day care 27.9 28.0 28.1 28.3 28.4 28.5 na
Family day care 30.2 34.2 34.3 32.4 31.8 30.1 25.0
Vacation care 28.5 27.7 27.3 27.0 26.8 26.2 na
OSHC 6.4 7.8 7.9 7.9 8.0 8.1 8.4
Occasional care 8.6 8.4 8.8 8.6 8.7 8.9 na
Note: Data from this table is sourced from multiple years of the Report on Government Services. See note for Appendix Table 10 about continuity of data.
61QARD ANNUAL REPORT 2019
DATA TABLES

Appendix Table 12: Number of applications submitted by application type, 2013–2019
Application type 2013 2014 2015 2016 2017 2018 2019
Approval 688 767 758 736 725 620 547
Provider Approval 366 447 389 356 390 355 299
Service Approval 322 320 369 380 335 265 248
Amendment of approval 432 529 658 635 543 881 1,288
Amend Provider Approval 48 109 144 166 179 237 140
Amend Service Approval 384 420 514 469 364 644 1,148
Waiver (service or temporary) 127 106 182 222 290 303 310
Suspension 19 20 41 112 102 130 99
Suspension Provider Approval 1 2 5 18 20 23 15
Suspension Service Approval 18 18 36 94 82 107 84
Related to supervisor certificates 5,161 2,970 553 400 230 0 0
Amend Supervisor Certificate 27 57 37 39 31 0 0
Supervisor Certificate 5,079 2,898 511 352 188 0 0
Supervisor Certificate for Specified Class of Persons
53 14 5 8 11 0 0
Suspension Supervisor Certificate 2 1 0 1 0 0 0
Other 438 378 542 434 486 413 412
Change of Information-Provider 2 0 0 0 0 0 0
Decision – Request Review by Tribunal or Court
0 1 2 3 8 1 1
Extension-Temporary Waiver 0 0 0 1 3 10 26
Internal Review of Reviewable Decision 58 55 65 32 29 14 14
Out of Scope Application - 1 84 144 156 97 133
Re-Assessment and Re-Rating 3 19 26 64 19 31 33
Review of Ratings by RA 16 19 14 25 21 27 14
Revocation-Service Waiver 1 1 0 0 0 1 3
Transfer of Service Approval 219 282 351 165 250 232 188
Total 6,865* 4,770 2,734 2,539 2,376 2,347 2,656
Note: (i) This table includes applications submitted related to supervisor certificates that were excluded from the Applications section of this report. The requirement for supervisor certificates was removed from the National Law and Regulations on 1 October 2017. (ii) The 6,865 total includes surrenders of provider and service approvals, which were no longer submitted as applications from 2014.
62 QARD ANNUAL REPORT 2019
DATA TABLES

Appendix Table 13: Number of decisions by application type and decision type, 2013–2019
Approval type 2013 2014 2015 2016 2017 2018 2019
Provider approval 275 203 313 281 238 182 181
Approved (with additional conditions) 2 1 1 5 29 50 29
Approved (with standard conditions) 273 164 184 185 106 87 105
Refused 0 38 128 91 103 45 47
Service Approval 259 238 337 282 295 241 221
Approved (with additional conditions) 130 89 98 111 119 91 91
Approved (with standard conditions) 128 143 208 141 152 138 123
Refused 1 6 31 30 24 12 7
Appendix Table 14: Number of decisions by month and application type, 2019
Approval type Jan Feb Mar Apr May Jun Jul Aug Sep Oct Nov Dec Total
Provider Approval 19 15 7 9 22 14 13 14 16 18 11 23 181
Service Approval 42 19 15 15 22 12 11 21 10 9 21 24 221
Amendment of approval 25 91 33 43 40 28 231 480 35 53 30 135 1,224
Service or temporary waiver 15 19 21 22 19 14 14 12 9 17 16 32 210
Voluntary suspension 7 12 3 9 16 5 11 5 7 5 8 7 95
Other 64 48 19 25 33 16 38 39 20 39 27 23 391
Total 172 204 98 123 152 89 318 571 97 141 113 244 2,322
Appendix Table 15: Number of active waivers by type, 2013–2019
Waiver type 2013 2014 2015 2016 2017 2018 2019
Total 94 144 114 208 134 222 192
Physical 25 24 29 44 50 63 70
Service 16 20 22 29 33 43 45
Temporary 9 4 7 15 17 20 25
Staffing 69 120 85 164 84 159 123
Service 40 47 54 51 51 64 72
Temporary 29 73 31 113 33 95 51
Note: Active waivers are either in place until 31 December of a particular year, expire in the future or remain in place for the duration of the service approval. Temporary waivers that were active and expired before 31 December are not included. Physical and staffing waiver subtotals may not sum up to the total number of active waivers as there may be waivers that fall into both categories. Physical waivers include FDC location waivers.
Appendix Table 16: Number of active waivers related to qualifications, 2013–2019
Waiver type 2013 2014 2015 2016 2017 2018 2019
Total 69 120 85 75 56 151 123
Service 40 47 54 51 51 64 72
Temporary 29 73 31 24 5 87 51
Note: See footnote for Appendix Table 15
63QARD ANNUAL REPORT 2019
DATA TABLES

Appendix Table 17: Number of active waivers related to educator-to-child ratios, 2013–2019
Waiver type 2013 2014 2015 2016 2017 2018 2019
Total 0 0 0 89 28 8 0
Service 0 0 0 0 0 0 0
Temporary 0 0 0 89 28 8 0
Note: See footnote for Appendix Table 15
Appendix Table 18: Number of approved multi-storey services, 2013–2019
2013 2014 2015 2016 2017 2018 2019
NQF services 64 74 83 103 125 145 185
CSA services - - 1 1 1 0 2
Note: This includes only services that have been identified to be operating in multi-storey buildings at the end of 2019.
Appendix Table 19: Overall quality ratings by rating level, 2014–2019
Rating 2014 2015 2016 2017 2018 2019
Total services with an NQS rating 2,351 3,407 3,792 3,908 3,930 3,989
Excellent 4 8 8 10 9 10
Exceeding NQS 772 1,137 1,271 1,326 1,314 1,282
Meeting NQS 1,066 1,579 1,809 1,928 2,001 2,100
Working Towards NQS 508 683 689 635 605 597
Significant Improvement Required 1 0 15 9 1 0
Number of approved services 2,351 4,027 4,108 4,233 4,209 4,229
Percentage of services eligible for a rating 100% 94% 95% 94% 95% 95%
Percentage meeting NQS or above 78% 80% 81% 84% 85% 85%
Rating as % 2014 2015 2016 2017 2018 2019
Total services with an NQS rating 100% 100% 100% 100% 100% 100%
Excellent 0.2% 0.2% 0.2% 0.3% 0.2% 0.3%
Exceeding NQS 33% 33% 34% 34% 33% 32%
Meeting NQS 45% 46% 48% 49% 51% 53%
Working Towards NQS 22% 20% 18% 16% 15% 15%
Significant Improvement Required 0.0% 0.0% 0.4% 0.2% 0.0% 0.0%
64 QARD ANNUAL REPORT 2019
DATA TABLES

Appendix Table 20: Overall quality ratings by care type and rating level, 2019
Care type Sig
nifi
can
t Im
pro
vem
en
t R
eq
uir
ed
Wo
rkin
g
Tow
ard
s N
QS
Me
eti
ng
NQ
S
Exc
ee
din
g
NQ
S
Exc
elle
nt
Tota
l ser
vic
es
wit
h a
n N
QS
ra
tin
g
All services 0 597 2,100 1,282 10 3,989
LDC 0 222 861 410 6 1,499
KGN 0 66 386 707 4 1,163
OSHC 0 226 797 150 0 1,173
FDC 0 83 56 15 0 154
Rating as % Sig
nifi
can
t
Imp
rove
men
t
Req
uir
ed
Wo
rkin
g
Tow
ard
s N
QS
Mee
tin
g N
QS
Exc
eed
ing
NQ
S
Exc
elle
nt
Tota
l a
pp
rove
d
serv
ices
Pe
rce
nta
ge
o
f se
rvic
es
elig
ible
fo
r a
ra
tin
g
Pe
rce
nta
ge
m
ee
tin
g N
QS
o
r a
bo
ve
All services 0.0% 15% 53% 32% 0.3% 4,229 95% 85%
LDC 0.0% 15% 57% 27% 0.4% 1,607 93% 85%
KGN 0.0% 6% 33% 61% 0.3% 1,186 98% 94%
OSHC 0.0% 19% 68% 13% 0.0% 1,250 95% 81%
FDC 0.0% 54% 36% 10% 0.0% 186 96% 46%
Appendix Table 21: Overall quality ratings by provider management type and rating level, 2019
Provider management type Sig
nifi
can
t Im
pro
vem
en
t R
eq
uir
ed
Wo
rkin
g
Tow
ard
s N
QS
Me
eti
ng
NQ
S
Exc
ee
din
g
NQ
S
Exc
elle
nt
Tota
l ser
vic
es
wit
h a
n N
QS
ra
tin
g
All services 0 597 2,100 1,282 10 3,989
Catholic/independent school 0 16 45 89 1 151
Government school 0 77 114 47 1 239
Local government 0 30 125 222 0 377
Not for profit 0 124 598 663 6 1,391
Private for profit 0 350 1,218 261 2 1,831
Rating as % Sig
nifi
can
t Im
pro
vem
en
t R
eq
uir
ed
Wo
rkin
g
Tow
ard
s N
QS
Me
eti
ng
NQ
S
Exc
ee
din
g
NQ
S
Exc
elle
nt
Tota
l a
pp
rove
d
serv
ices
Pe
rce
nta
ge
o
f se
rvic
es
elig
ible
fo
r a
ra
tin
g
Pe
rce
nta
ge
m
ee
tin
g N
QS
o
r a
bo
ve
All services 0.0% 15% 53% 32% 0.3% 4,229 95% 85%
Catholic/independent school 0.0% 11% 30% 59% 0.7% 157 97% 89%
Government school 0.0% 32% 48% 20% 0.4% 244 99% 68%
Local government 0.0% 8% 33% 59% 0.0% 386 98% 92%
Not for profit 0.0% 9% 43% 48% 0.4% 1,420 98% 91%
Private for profit 0.0% 19% 67% 14% 0.1% 2,022 93% 81%
65QARD ANNUAL REPORT 2019
DATA TABLES

Appendix Table 22: Overall LDC quality ratings by rating level, 2014–2019
Rating 2014 2015 2016 2017 2018 2019
Total services with an NQS rating 866 1,156 1,246 1,319 1,412 1,499
Excellent 3 6 6 7 6 6
Exceeding NQS 241 348 409 427 427 410
Meeting NQS 439 586 650 711 767 861
Working Towards NQS 182 216 181 174 212 222
Significant Improvement Required 1 0 0 0 0 0
Number of approved services 866 1,280 1,343 1,457 1,520 1,607
Percentage of services eligible for a rating 100% 96% 94% 92% 95% 93%
Percentage meeting NQS or above 79% 81% 85% 87% 85% 85%
Rating as % 2014 2015 2016 2017 2018 2019
Total services with an NQS rating 100% 100% 100% 100% 100% 100%
Excellent 0.3% 0.5% 0.5% 0.5% 0.4% 0.4%
Exceeding NQS 28% 30% 33% 32% 30% 27%
Meeting NQS 51% 51% 52% 54% 54% 57%
Working Towards NQS 21% 19% 15% 13% 15% 15%
Significant Improvement Required 0.1% 0.0% 0.0% 0.0% 0.0% 0.0%
Appendix Table 23: Overall kindergarten quality ratings by rating level, 2014–2019
Rating 2014 2015 2016 2017 2018 2019
Total services with an NQS rating 875 1,144 1,173 1,183 1,168 1,163
Excellent 1 2 2 3 3 4
Exceeding NQS 404 585 641 681 693 707
Meeting NQS 365 444 446 429 396 386
Working Towards NQS 105 113 84 70 76 66
Significant Improvement Required 0 0 0 0 0 0
Number of approved services 875 1,197 1,203 1,205 1,194 1,186
Percentage of services eligible for a rating 100% 97% 98% 98% 98% 98%
Percentage meeting NQS or above 88% 90% 93% 94% 93% 94%
Rating as % 2014 2015 2016 2017 2018 2019
Total services with an NQS rating 100% 100% 100% 100% 100% 100%
Excellent 0.1% 0.2% 0.2% 0.3% 0.3% 0.3%
Exceeding NQS 46% 51% 55% 58% 59% 61%
Meeting NQS 42% 39% 38% 36% 34% 33%
Working Towards NQS 12% 10% 7% 6% 7% 6%
Significant Improvement Required 0.0% 0.0% 0.0% 0.0% 0.0% 0.0%
Note: Quality ratings in this table exclude ratings for kindergarten services provided in a long day care setting.
66 QARD ANNUAL REPORT 2019
DATA TABLES

Appendix Table 24: Overall quality ratings for NQF services funded to provide a four year old kindergarten program by rating
level, 2014–2019
Rating 2014 2015 2016 2017 2018 2019
Total services with an NQS rating 1,523 2,027 2,125 2,306 2,333 2,310
Excellent 4 8 8 10 9 9
Exceeding NQS 608 882 980 1,064 1,069 1,027
Meeting NQS 688 876 935 1,033 1,030 1,058
Working Towards NQS 223 261 202 199 225 216
Significant Improvement Required 0 0 0 0 0 0
Number of approved services 1,523 2,121 2,168 2,352 2,374 2,349
Percentage of services eligible for a rating 100% 99% 99% 98% 99% 98%
Percentage meeting NQS or above 85% 87% 90% 91% 90% 91%
Rating as % 2014 2015 2016 2017 2018 2019
Total services with an NQS rating 100% 100% 100% 100% 100% 100%
Excellent 0.3% 0.4% 0.4% 0.4% 0.4% 0.4%
Exceeding NQS 40% 44% 46% 46% 46% 44%
Meeting NQS 45% 43% 44% 45% 44% 46%
Working Towards NQS 15% 13% 10% 9% 10% 9%
Significant Improvement Required 0.0% 0.0% 0.0% 0.0% 0.0% 0.0%
Note: Quality ratings in this table include ratings for funded four year old kindergarten services provided in a long day care setting.
Appendix Table 25: Overall OSHC quality ratings by rating level, 2014–2019
Rating 2014 2015 2016 2017 2018 2019
Total services with an NQS rating 511 931 1,095 1,126 1,152 1,173
Excellent 0 0 0 0 0 0
Exceeding NQS 100 167 187 186 171 150
Meeting NQS 231 496 637 717 777 797
Working Towards NQS 180 268 271 222 204 226
Significant Improvement Required 0 0 0 1 0 0
Number of approved services 511 1,168 1,191 1,224 1,247 1,250
Percentage of services eligible for a rating 99% 93% 95% 94% 93% 95%
Percentage meeting NQS or above 65% 71% 75% 80% 82% 81%
Rating as % 2014 2015 2016 2017 2018 2019
Total services with an NQS rating 100% 100% 100% 100% 100% 100%
Excellent 0.0% 0.0% 0.0% 0.0% 0.0% 0.0%
Exceeding NQS 20% 18% 17% 17% 15% 13%
Meeting NQS 45% 53% 58% 64% 67% 68%
Working Towards NQS 35% 29% 25% 20% 18% 19%
Significant Improvement Required 0.0% 0.0% 0.0% 0.1% 0.0% 0.0%
67QARD ANNUAL REPORT 2019
DATA TABLES

Appendix Table 26: Overall FDC quality ratings by rating level, 2014–2019
Rating 2014 2015 2016 2017 2018 2019
Total services with an NQS rating 99 176 278 280 198 154
Excellent 0 0 0 0 0 0
Exceeding NQS 27 37 34 32 23 15
Meeting NQS 31 53 76 71 61 56
Working Towards NQS 41 86 153 169 113 83
Significant Improvement Required 0 0 15 8 1 0
Number of approved services 99 382 371 347 248 186
Percentage of services eligible for a rating 100% 84% 90% 94% 95% 96%
Percentage meeting NQS or above 59% 51% 40% 37% 42% 46%
Rating as % 2014 2015 2016 2017 2018 2019
Total services with an NQS rating 100% 100% 100% 100% 100% 100%
Excellent 0.0% 0.0% 0.0% 0.0% 0.0% 0.0%
Exceeding NQS 27% 21% 12% 11% 12% 10%
Meeting NQS 31% 30% 27% 25% 31% 36%
Working Towards NQS 41% 49% 55% 60% 57% 54%
Significant Improvement Required 0.0% 0.0% 5.4% 2.9% 0.5% 0.0%
Appendix Table 27: Overall LDC quality ratings by provider management type and rating level, 2019
Provider management type Sig
nifi
can
t Im
pro
vem
en
t R
eq
uir
ed
Wo
rkin
g
Tow
ard
s N
QS
Me
eti
ng
NQ
S
Exc
ee
din
g
NQ
S
Exc
elle
nt
Tota
l ser
vic
es
wit
h a
n N
QS
ra
tin
g
All LDC 0 222 861 410 6 1,499
Catholic/independent school 0 1 6 22 0 29
Government school 0 2 1 1 1 5
Local government 0 7 31 52 0 90
Not for profit 0 42 243 177 3 465
Private for profit 0 170 580 158 2 910
Rating as % Sig
nifi
can
t Im
pro
vem
en
t R
eq
uir
ed
Wo
rkin
g
Tow
ard
s N
QS
Me
eti
ng
NQ
S
Exc
ee
din
g
NQ
S
Exc
elle
nt
Tota
l a
pp
rove
d
serv
ices
Pe
rce
nta
ge
o
f se
rvic
es
elig
ible
fo
r a
ra
tin
g
Pe
rce
nta
ge
m
ee
tin
g N
QS
o
r a
bo
ve
All LDC 0.0% 15% 57% 27% 0.4% 1,607 93% 85%
Catholic/independent school 0.0% 3% 21% 76% 0.0% 30 97% 97%
Government school 0.0% 40% 20% 20% 20.0% 5 100% 60%
Local government 0.0% 8% 34% 58% 0.0% 93 97% 92%
Not for profit 0.0% 9% 52% 38% 0.6% 474 99% 91%
Private for profit 0.0% 19% 64% 17% 0.2% 1,005 91% 81%
68 QARD ANNUAL REPORT 2019
DATA TABLES

Appendix Table 28: Overall kindergarten quality ratings by provider management type and rating level, 2019
Provider management type Sig
nifi
can
t Im
pro
vem
en
t R
eq
uir
ed
Wo
rkin
g
Tow
ard
s N
QS
Me
eti
ng
NQ
S
Exc
ee
din
g
NQ
S
Exc
elle
nt
Tota
l ser
vic
es
wit
h a
n N
QS
ra
tin
g
All KGN 0 66 386 707 4 1,163
Catholic/independent school 0 3 17 62 1 83
Government school 0 6 16 14 0 36
Local government 0 14 70 154 0 238
Not for profit 0 42 280 474 3 799
Private for profit 0 1 3 3 0 7
Rating as % Sig
nifi
can
t Im
pro
vem
en
t R
eq
uir
ed
Wo
rkin
g
Tow
ard
s N
QS
Me
eti
ng
NQ
S
Exc
ee
din
g
NQ
S
Exc
elle
nt
Tota
l a
pp
rove
d
serv
ices
Pe
rce
nta
ge
o
f se
rvic
es
elig
ible
fo
r a
ra
tin
g
Pe
rce
nta
ge
m
ee
tin
g N
QS
o
r a
bo
ve
All KGN 0.0% 6% 33% 61% 0.3% 1,186 98% 94%
Catholic/independent school 0.0% 4% 20% 75% 1.2% 86 97% 96%
Government school 0.0% 17% 44% 39% 0.0% 38 95% 83%
Local government 0.0% 6% 29% 65% 0.0% 242 99% 94%
Not for profit 0.0% 5% 35% 59% 0.4% 811 98% 95%
Private for profit 0.0% 14% 43% 43% 0.0% 9 78% 86%
Note: Quality ratings in this table exclude ratings for kindergarten services provided in a long day care setting.
69QARD ANNUAL REPORT 2019
DATA TABLES

Appendix Table 29: Overall ratings for NQF services funded to provide a four-year-old kindergarten program by provider
management type and rating level, 2019
Provider management type Sig
nifi
can
t Im
pro
vem
en
t R
eq
uir
ed
Wo
rkin
g
Tow
ard
s N
QS
Me
eti
ng
NQ
S
Exc
ee
din
g
NQ
S
Exc
elle
nt
Tota
l fu
nd
ed
serv
ices
w
ith
an
NQ
S
rati
ng
All funded services 0 216 1,058 1,027 9 2,310
Catholic/independent school 0 4 18 81 1 104
Government school 0 7 14 15 1 37
Local government 0 18 89 194 0 301
Not for profit 0 71 462 596 5 1,134
Private for profit 0 116 475 141 2 734
Rating as % Sig
nifi
can
t Im
pro
vem
en
t R
eq
uir
ed
Wo
rkin
g
Tow
ard
s N
QS
Me
eti
ng
NQ
S
Exc
ee
din
g
NQ
S
Exc
elle
nt
Tota
l fu
nd
ed
ap
pro
ved
se
rvic
es
Pe
rce
nta
ge
o
f se
rvic
es
elig
ible
fo
r a
ra
tin
g
Pe
rce
nta
ge
m
ee
tin
g N
QS
o
r a
bo
ve
All funded services 0.0% 9% 46% 44% 0.4% 2,349 98% 91%
Catholic/independent school 0.0% 4% 17% 78% 1.0% 107 97% 96%
Government school 0.0% 19% 38% 41% 2.7% 39 95% 81%
Local government 0.0% 6% 30% 64% 0.0% 305 99% 94%
Not for profit 0.0% 6% 41% 53% 0.4% 1,144 99% 94%
Private for profit 0.0% 16% 65% 19% 0.3% 754 97% 84%
Note: Quality ratings in this table include ratings for funded four year old kindergarten services provided in a long day care setting.
70 QARD ANNUAL REPORT 2019
DATA TABLES

Appendix Table 30: Overall OSHC quality ratings by provider management type and rating level, 2019
Provider management type Sig
nifi
can
t Im
pro
vem
en
t R
eq
uir
ed
Wo
rkin
g
Tow
ard
s N
QS
Me
eti
ng
NQ
S
Exc
ee
din
g
NQ
S
Exc
elle
nt
Tota
l ser
vic
es
wit
h a
n N
QS
ra
tin
g
All OSHC 0 226 797 150 0 1,173
Catholic/independent school 0 12 22 5 0 39
Government school 0 69 97 32 0 198
Local government 0 1 13 5 0 19
Not for profit 0 34 68 11 0 113
Private for profit 0 110 597 97 0 804
Rating as % Sig
nifi
can
t Im
pro
vem
en
t R
eq
uir
ed
Wo
rkin
g
Tow
ard
s N
QS
Me
eti
ng
NQ
S
Exc
ee
din
g
NQ
S
Exc
elle
nt
Tota
l a
pp
rove
d
serv
ices
Pe
rce
nta
ge
o
f se
rvic
es
elig
ible
fo
r a
ra
tin
g
Pe
rce
nta
ge
m
ee
tin
g N
QS
o
r a
bo
ve
All OSHC 0.0% 19% 68% 13% 0.0% 1,250 95% 81%
Catholic/independent school 0.0% 31% 56% 13% 0.0% 41 100% 69%
Government school 0.0% 35% 49% 16% 0.0% 201 100% 65%
Local government 0.0% 5% 68% 26% 0.0% 21 90% 95%
Not for profit 0.0% 30% 60% 10% 0.0% 121 94% 70%
Private for profit 0.0% 14% 74% 12% 0.0% 866 95% 86%
Appendix Table 31: Overall FDC quality ratings by provider management type and rating level, 2019
Provider management type Sig
nifi
can
t Im
pro
vem
en
t R
eq
uir
ed
Wo
rkin
g
Tow
ard
s N
QS
Me
eti
ng
NQ
S
Exc
ee
din
g
NQ
S
Exc
elle
nt
Tota
l ser
vic
es
wit
h a
n N
QS
ra
tin
g
All FDC 0 83 56 15 0 154
Local government 0 8 11 11 0 30
Not for profit 0 6 7 1 0 14
Private for profit 0 69 38 3 0 110
Rating as % Sig
nifi
can
t Im
pro
vem
en
t R
eq
uir
ed
Wo
rkin
g
Tow
ard
s N
QS
Me
eti
ng
NQ
S
Exc
ee
din
g
NQ
S
Exc
elle
nt
Tota
l a
pp
rove
d
serv
ices
Pe
rce
nta
ge
o
f se
rvic
es
elig
ible
fo
r a
ra
tin
g
Pe
rce
nta
ge
m
ee
tin
g N
QS
o
r a
bo
ve
All FDC 0.0% 54% 36% 10% 0.0% 186 96% 46%
Local government 0.0% 27% 37% 37% 0.0% 30 100% 73%
Not for profit 0.0% 43% 50% 7% 0.0% 14 100% 57%
Private for profit 0.0% 63% 35% 3% 0.0% 142 95% 37%
71QARD ANNUAL REPORT 2019
DATA TABLES
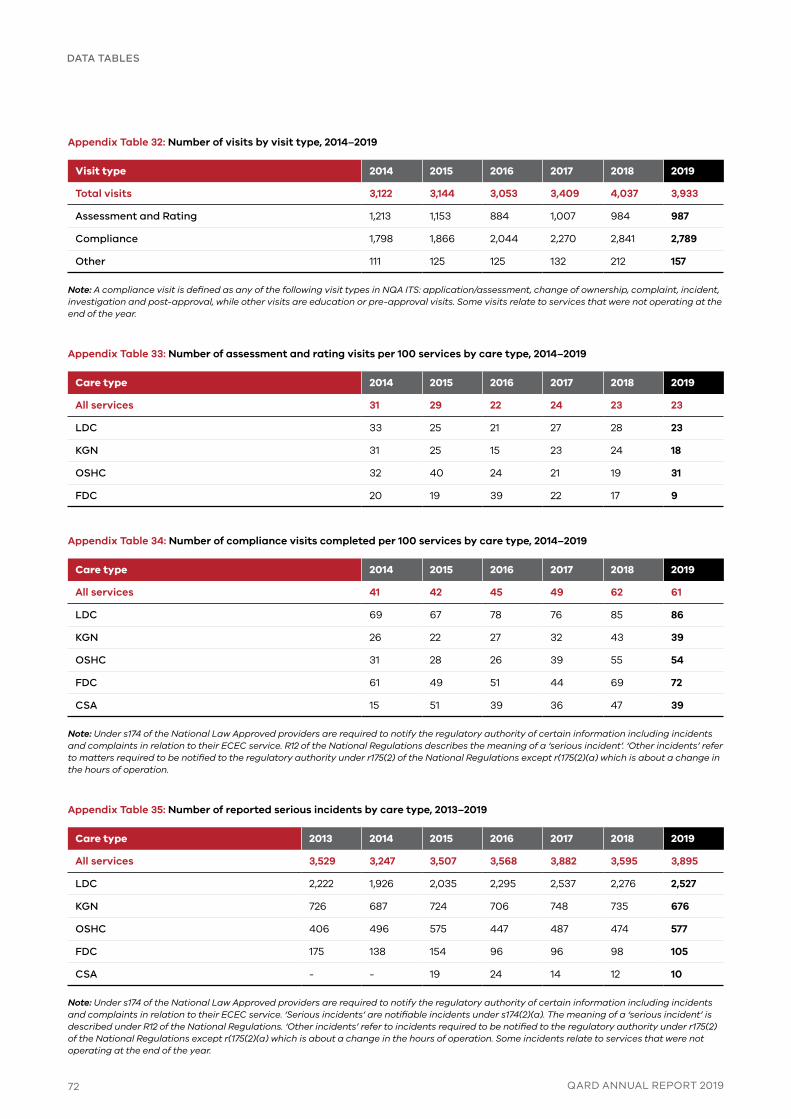
Appendix Table 32: Number of visits by visit type, 2014–2019
Visit type 2014 2015 2016 2017 2018 2019
Total visits 3,122 3,144 3,053 3,409 4,037 3,933
Assessment and Rating 1,213 1,153 884 1,007 984 987
Compliance 1,798 1,866 2,044 2,270 2,841 2,789
Other 111 125 125 132 212 157
Note: A compliance visit is defined as any of the following visit types in NQA ITS: application/assessment, change of ownership, complaint, incident, investigation and post-approval, while other visits are education or pre-approval visits. Some visits relate to services that were not operating at the end of the year.
Appendix Table 33: Number of assessment and rating visits per 100 services by care type, 2014–2019
Care type 2014 2015 2016 2017 2018 2019
All services 31 29 22 24 23 23
LDC 33 25 21 27 28 23
KGN 31 25 15 23 24 18
OSHC 32 40 24 21 19 31
FDC 20 19 39 22 17 9
Appendix Table 34: Number of compliance visits completed per 100 services by care type, 2014–2019
Care type 2014 2015 2016 2017 2018 2019
All services 41 42 45 49 62 61
LDC 69 67 78 76 85 86
KGN 26 22 27 32 43 39
OSHC 31 28 26 39 55 54
FDC 61 49 51 44 69 72
CSA 15 51 39 36 47 39
Note: Under s174 of the National Law Approved providers are required to notify the regulatory authority of certain information including incidents and complaints in relation to their ECEC service. R12 of the National Regulations describes the meaning of a ‘serious incident’. ‘Other incidents’ refer to matters required to be notified to the regulatory authority under r175(2) of the National Regulations except r(175(2)(a) which is about a change in the hours of operation.
Appendix Table 35: Number of reported serious incidents by care type, 2013–2019
Care type 2013 2014 2015 2016 2017 2018 2019
All services 3,529 3,247 3,507 3,568 3,882 3,595 3,895
LDC 2,222 1,926 2,035 2,295 2,537 2,276 2,527
KGN 726 687 724 706 748 735 676
OSHC 406 496 575 447 487 474 577
FDC 175 138 154 96 96 98 105
CSA - - 19 24 14 12 10
Note: Under s174 of the National Law Approved providers are required to notify the regulatory authority of certain information including incidents and complaints in relation to their ECEC service. ‘Serious incidents’ are notifiable incidents under s174(2)(a). The meaning of a ‘serious incident’ is described under R12 of the National Regulations. ‘Other incidents’ refer to incidents required to be notified to the regulatory authority under r175(2) of the National Regulations except r(175(2)(a) which is about a change in the hours of operation. Some incidents relate to services that were not operating at the end of the year.
72 QARD ANNUAL REPORT 2019
DATA TABLES

Appendix Table 36: Number of reported serious incidents per 100 NQF services by care type, 2013–2019
Care type 2013 2014 2015 2016 2017 2018 2019
All services 83 74 79 79 84 79 86
LDC 182 155 159 171 174 150 157
KGN 60 57 60 59 62 62 57
OSHC 37 43 49 38 40 38 46
FDC 66 41 40 26 28 40 56
CSA - - 4 6 4 3 3
Note: See footnote for Appendix Table 35
Appendix Table 37: Number of reported other incidents by care type, 2013–2019
Care type 2013 2014 2015 2016 2017 2018 2019
All services 137 450 663 930 887 1,010 1,549
LDC 99 332 460 580 584 611 830
KGN 24 71 137 192 178 198 298
OSHC 7 28 41 110 93 163 390
FDC 7 19 25 47 32 35 30
CSA - - 0 1 0 3 1
Note: See footnote for Appendix Table 35
Appendix Table 38: Number of reported other incidents per 100 approved services by care type, 2013–2019
Care type 2013 2014 2015 2016 2017 2018 2019
All services 3 10 15 21 19 22 34
LDC 8 27 36 43 40 40 52
KGN 2 6 11 16 15 17 25
OSHC 1 2 4 9 8 13 31
FDC 3 6 7 13 9 14 16
CSA - - 0 0 0 1 0
Note: See footnote for Appendix Table 35
Appendix Table 39: Number of complaints by complaint type, 2013–2019
Complaint type 2013 2014 2015 2016 2017 2018 2019
All complaints 1,394 1,552 1,627 1,828 1,765 1,694 1,996
Direct complaints 1,167 822 653 649 585 650 673
Complaints through notifications 227 730 974 1,179 1,180 1,044 1,323
Note: Complaint notifications are a requirement under s174 of the National Law for an approved provider to notify the regulatory authority of any complaint alleging a serious incident at the service or a breach of the National Law. Direct complaints are complaints received directly from a parent or other member of the public usually expressing dissatisfaction about a service. Some complaints relate to services that were not operating at the end of the year.
73QARD ANNUAL REPORT 2019
DATA TABLES

Appendix Table 40: Number of complaints per 100 services by complaint type, 2013–2019
Complaint type 2013 2014 2015 2016 2017 2018 2019
All complaints 33 35 37 40 38 37 44
Direct complaints 27 19 15 14 13 14 15
Complaints through notifications 5 17 22 26 26 23 29
Note: See footnote for Appendix Table 39
Appendix Table 41: Number of complaints per 100 services by care type, 2013–2019
Care type 2013 2014 2015 2016 2017 2018 2019
All services 33 35 37 40 38 37 44
LDC 81 86 83 93 86 77 90
KGN 20 26 27 27 21 22 20
OSHC 7 6 11 10 14 12 16
FDC 29 28 23 27 20 35 33
CSA - - 3 4 4 4 4
Note: See footnote for Appendix Table 39
74
DATA TABLES


